An Approach to Determine Risk Indices for Drinking Water–Study Investigation


Abstract
1. Introduction
- In 2014, Ohio, according to the Surveillance for Waterborne Disease Outbreaks Associated with Drinking Water in the United States, the microcystin contamination event occur in a drinking water system, about 110 people were illed. During this event, an extensive emergency response occurred to ensure that the approximately 500,000 people affected had access to information about the advisory,
- In 2013, Subcarpathian province, the secondary pollution of water took place and lasted about two weeks, probably due to a poorly chosen cleaning agent for the water supply network. Escherichia Coli bacteria were detected in the water network supplying 50,000 inhabitants. In the period of danger, the hospital recorded 100 cases of various types of ailments in patients (poisoning, diarrhoea).
2. Material and Methods
2.1. The Approach to Obtaining a Water-Pollution Criterion
- The first group (A) includes indices determining the suitability of drinking water, inter alia colour, turbidity, iron, manganese, sulphates and chlorides, for which it is assumed that periodic and limited exceedances of normative concentrations do not threaten human health,
- The next group (B) includes indicators that present a significant risk to human health. Included here are forms of nitrogen and phosphorus, fluorides, Chemical Oxygen Demand (COD), nanoparticles, hormones, antibiotics and pH,
- The last group (C) includes indicators that pose a toxic threat to the human body, among others: heavy metals, phenol, cyanides, and DDT and its metabolites. The indicators from group A thus concern the pollutants least harmful to people, while group C indicators are substances i.a. having a carcinogenic impact.
- Satisfactory quality of water, which has quality parameters above threshold values for norms, where EI = 0,For:Co ≤ Cacc
- Quality of water non-normative, but permissible for short periods of a duration that is nevertheless limited and to be determined, where 0 < EI < 1.0,
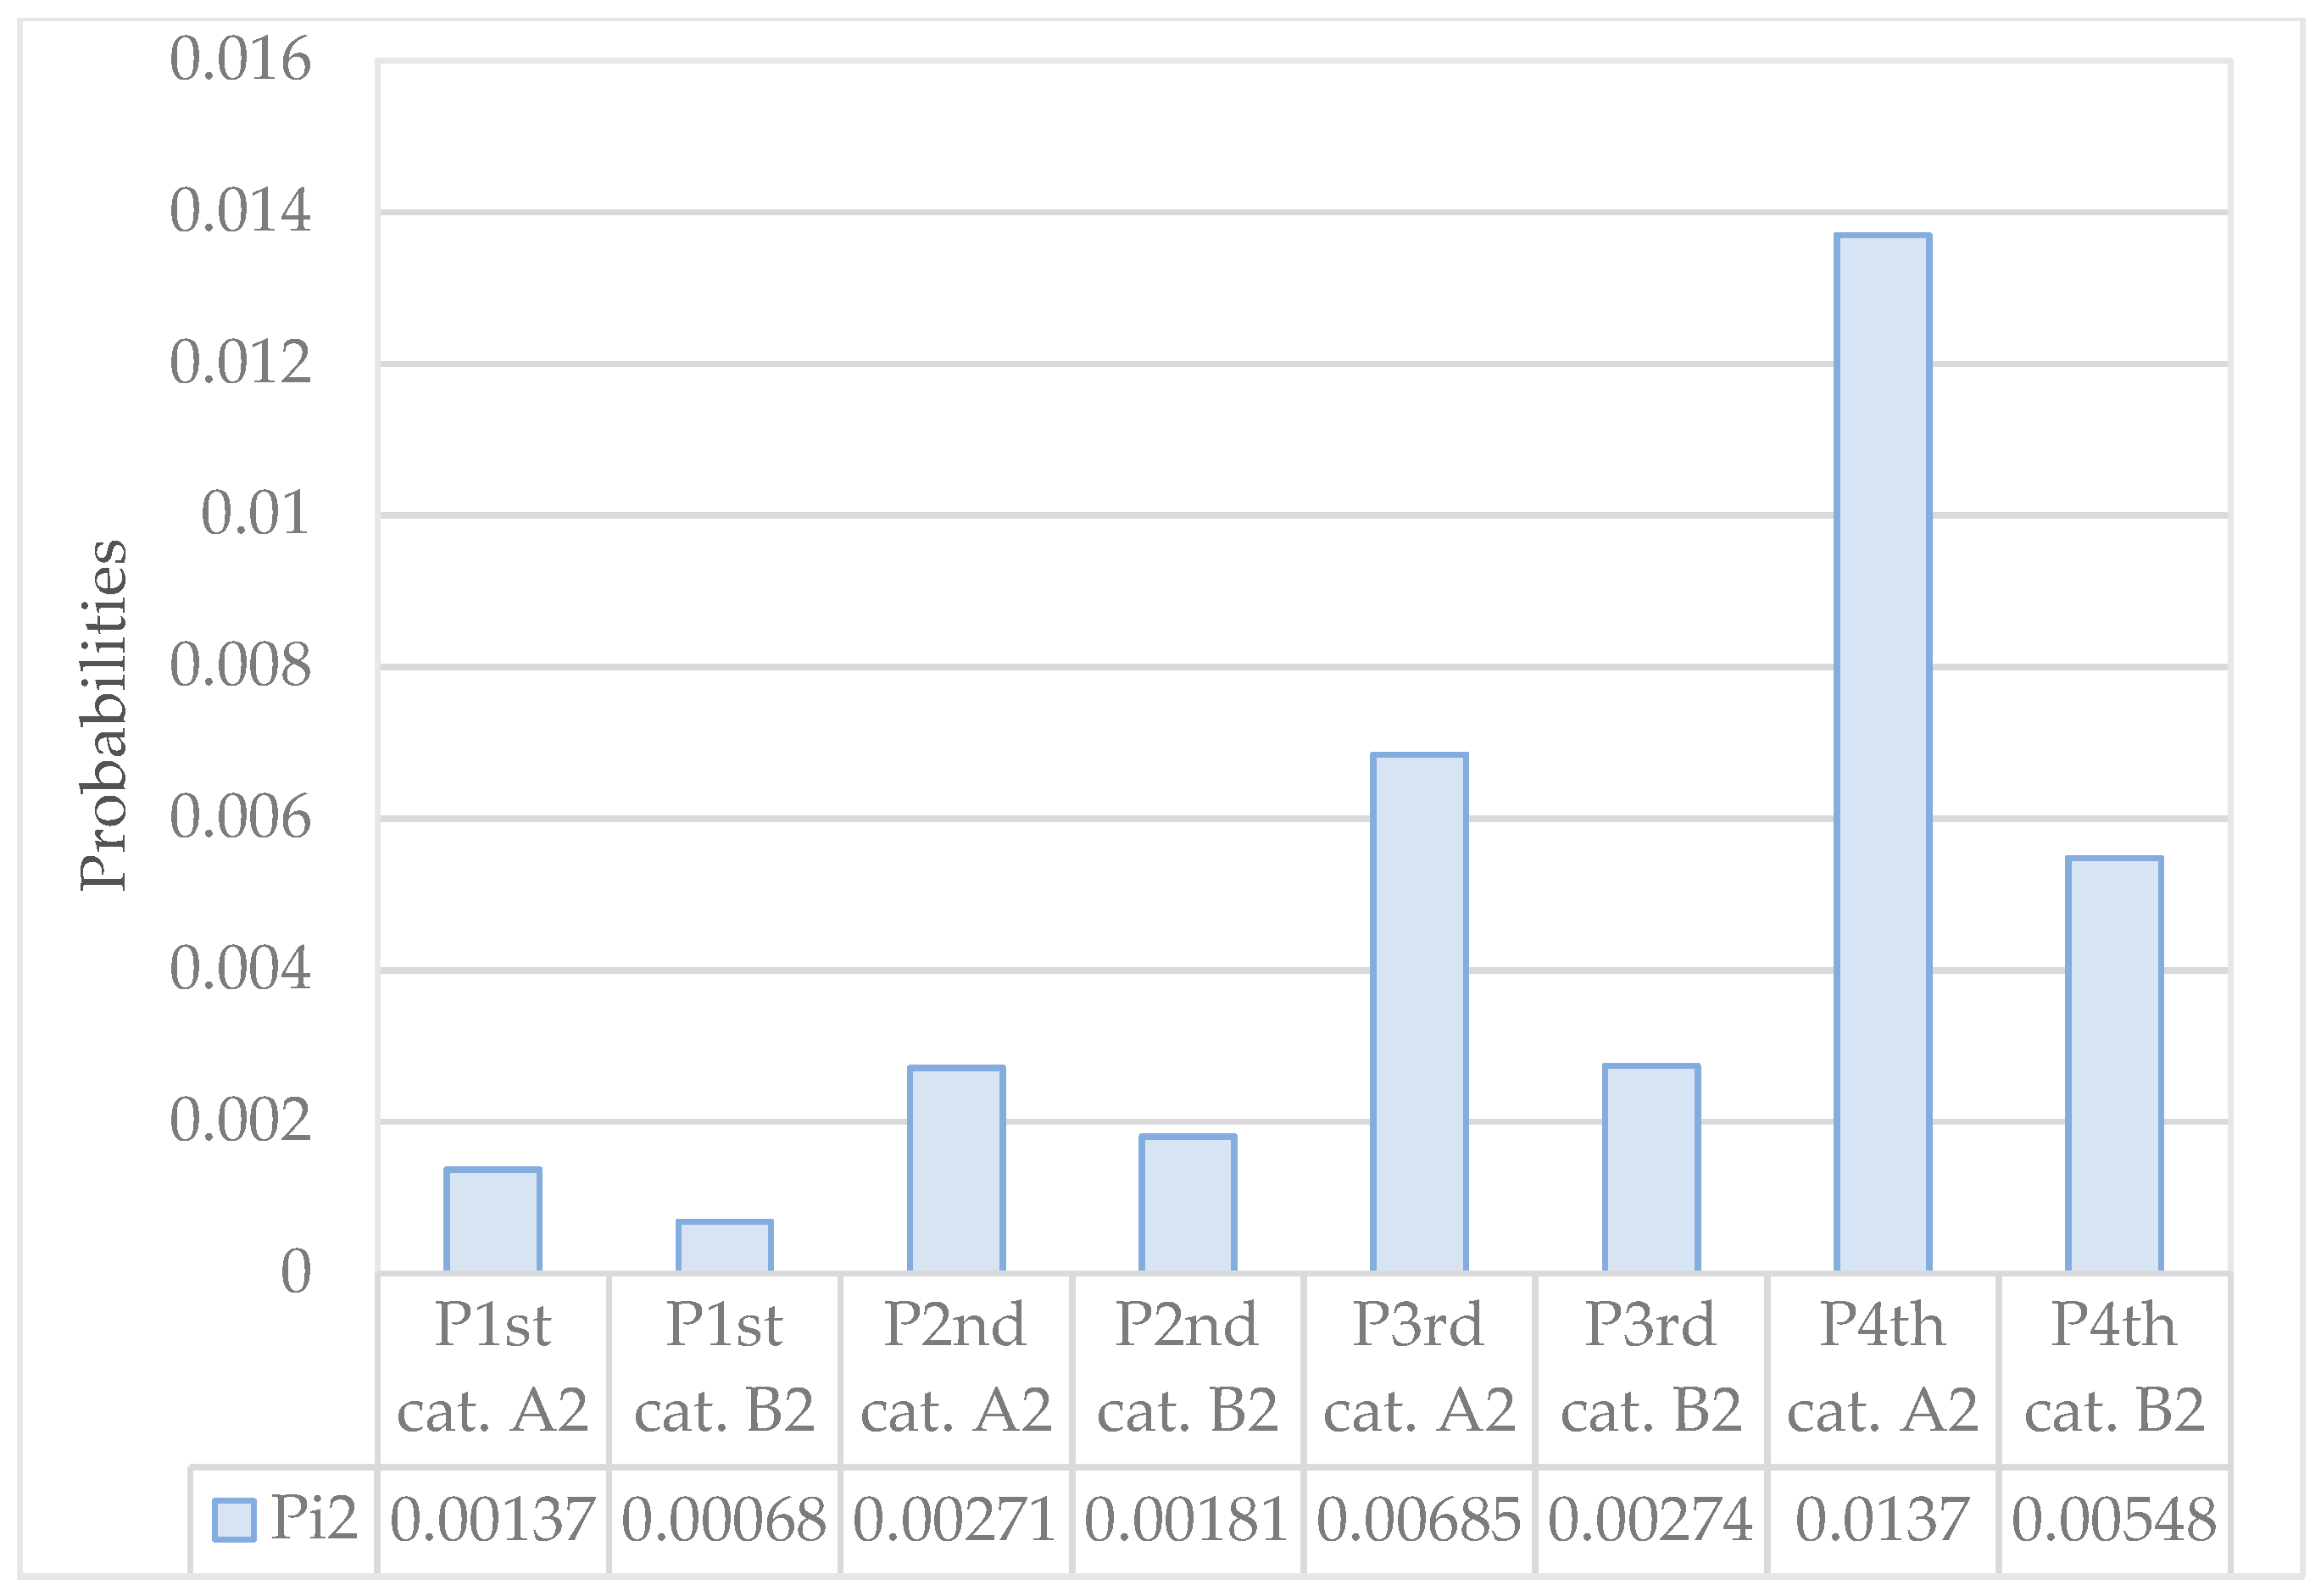
- Quality of the water that is unacceptable, making it absolutely necessary for a plan and WTP to be shut off in order to prevent that water from reaching recipients, where EI = 1.0,
2.2. Probability Estimation Methodology
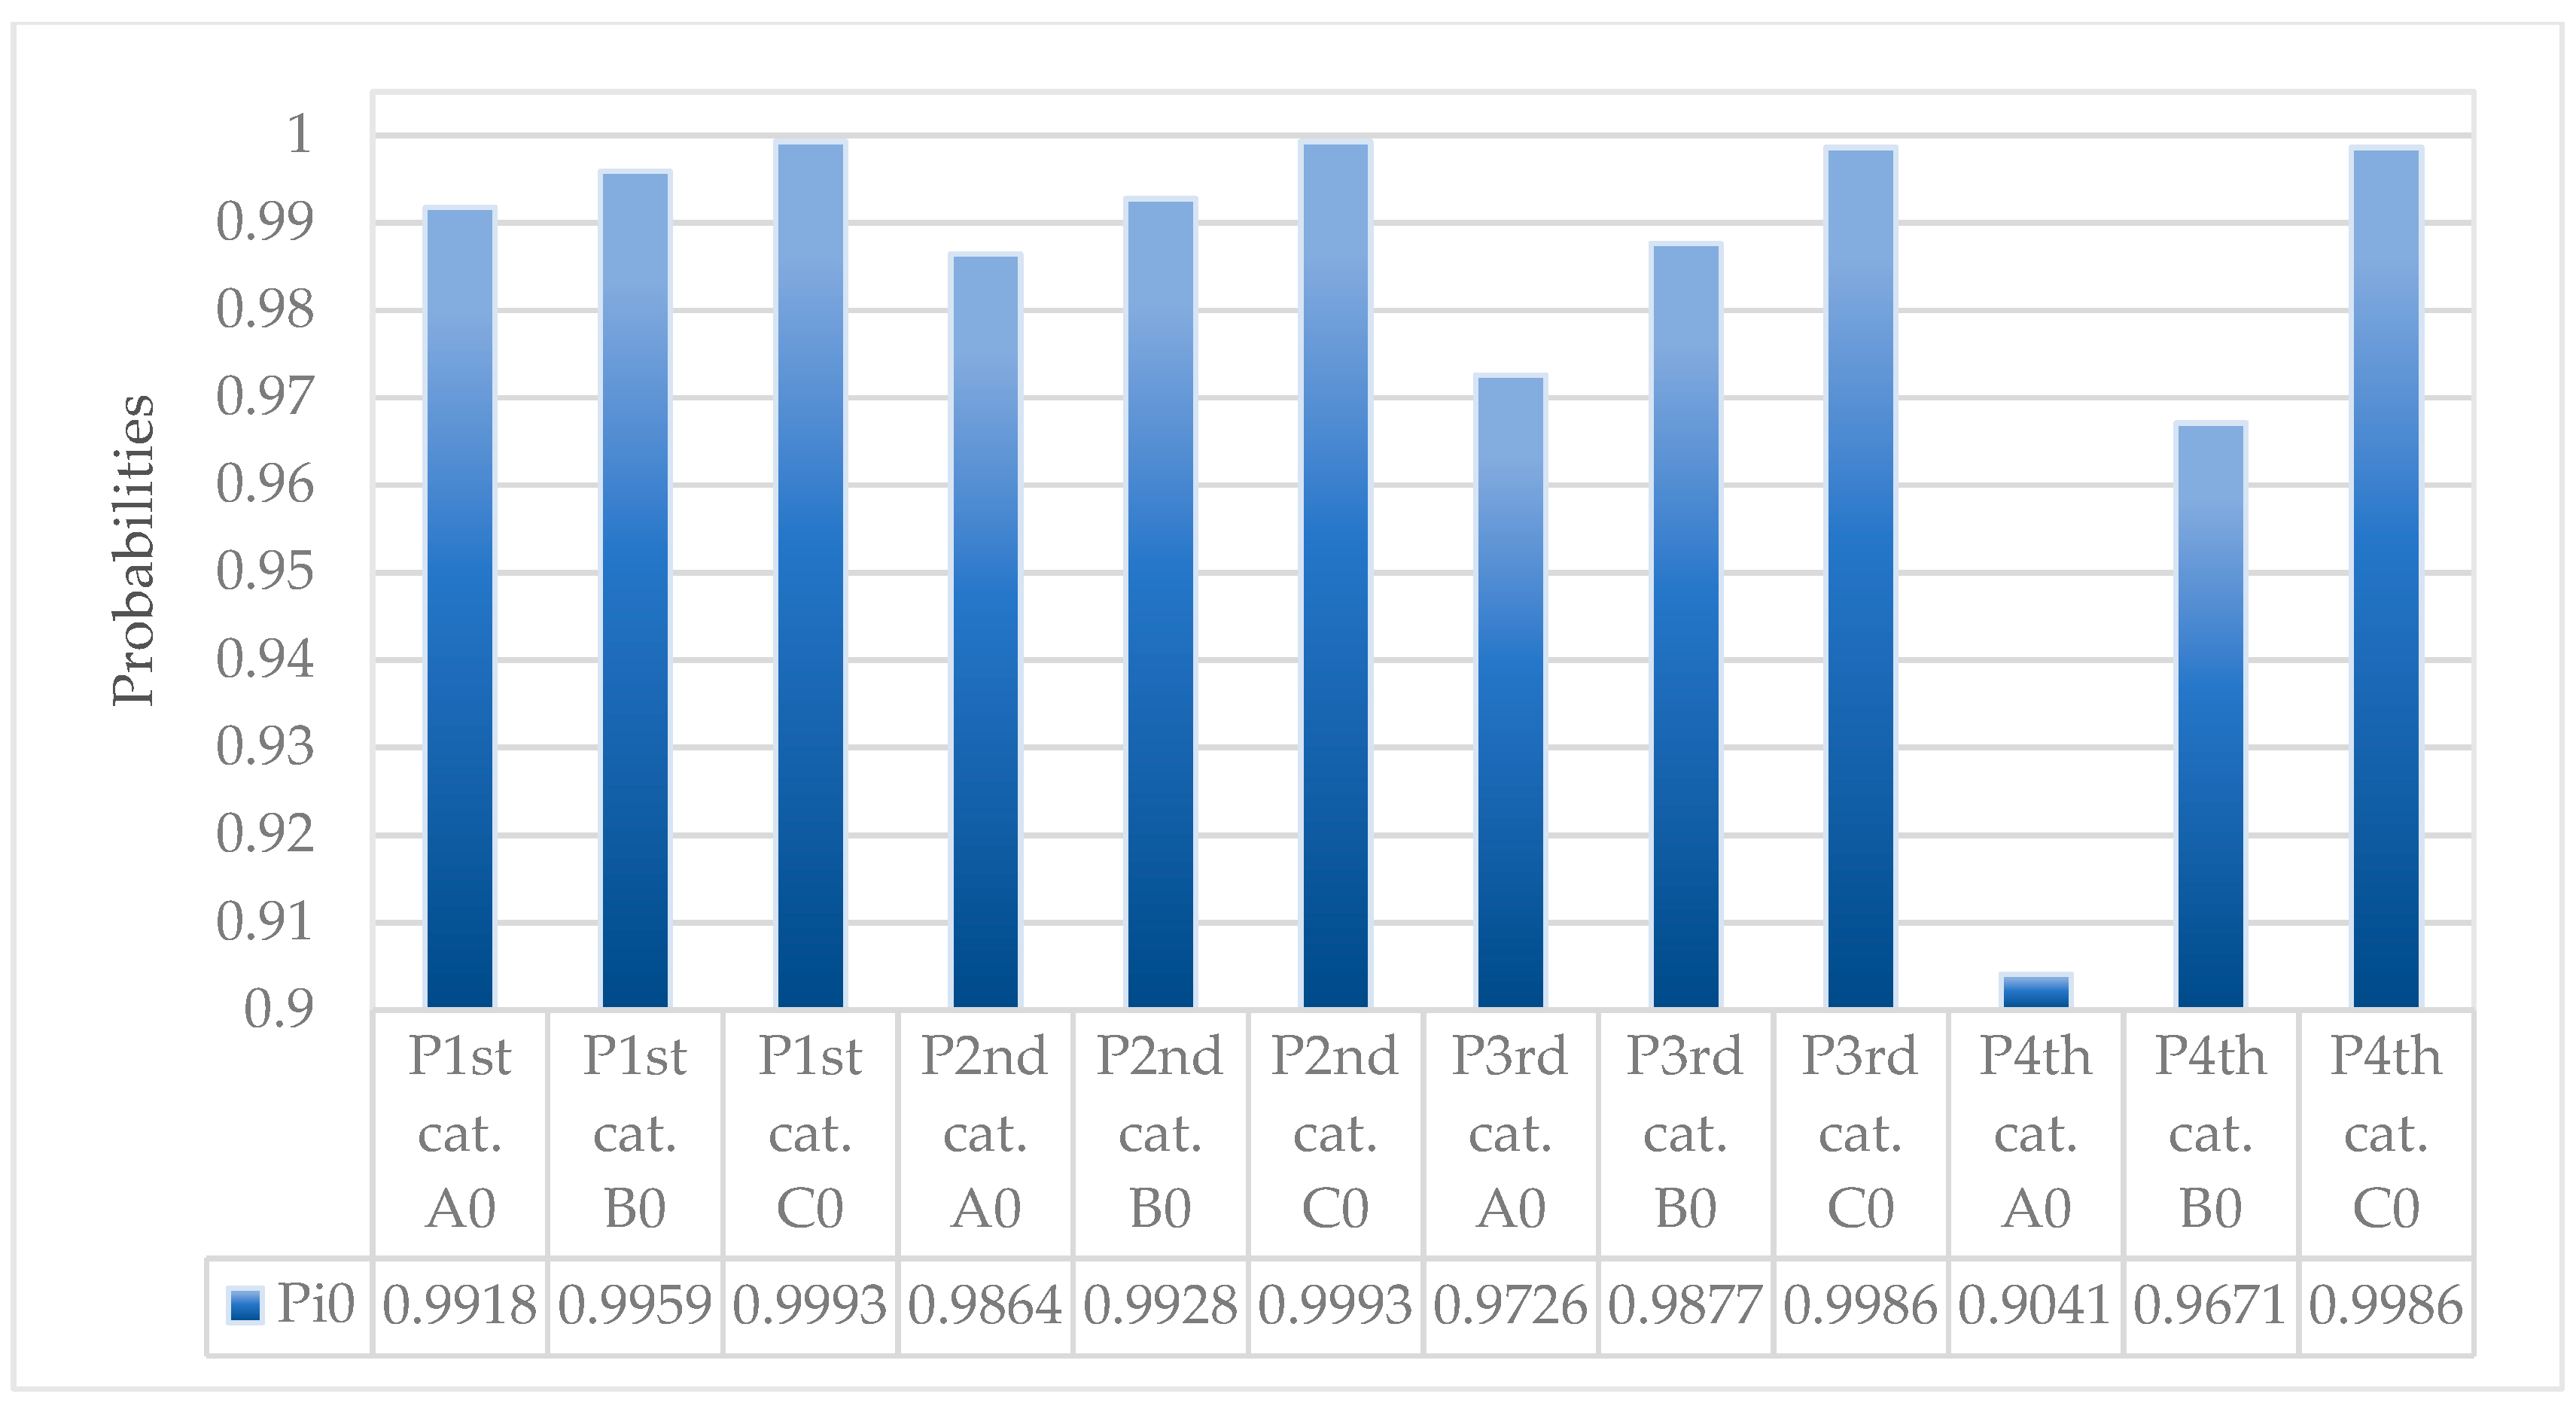
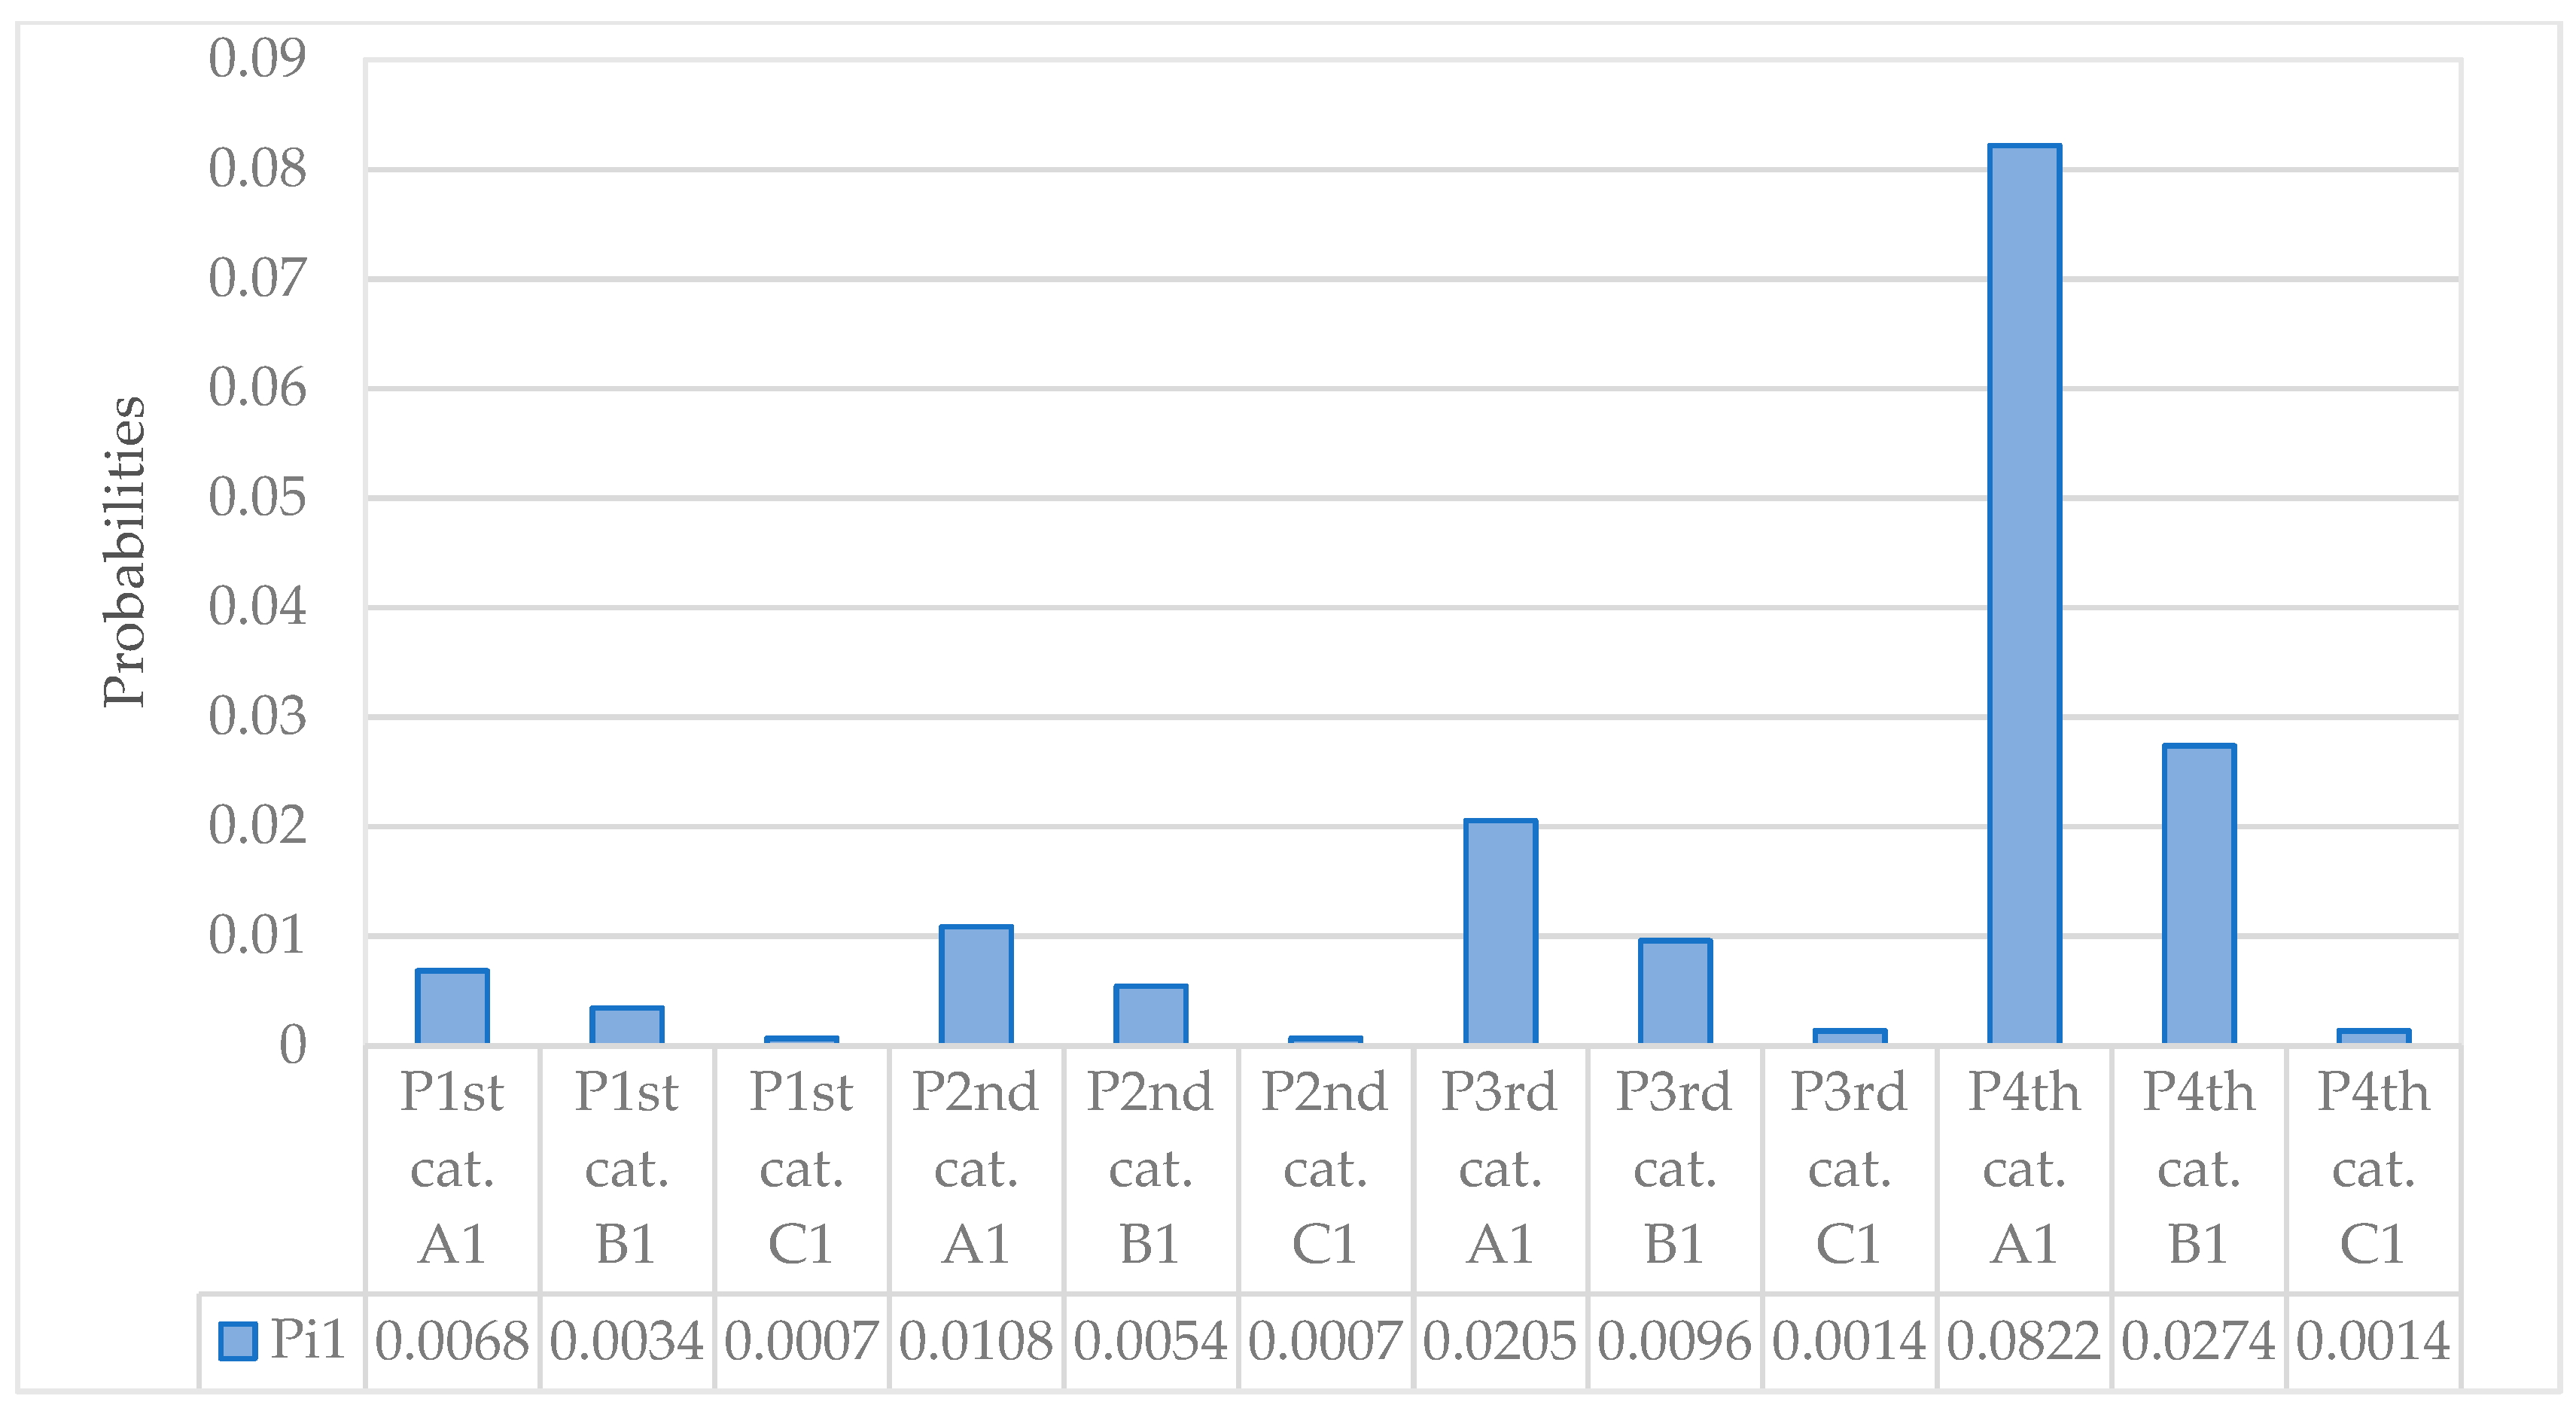
- 1st category: water-supply systems of urban and industrial agglomerations of more than 500,000 inhabitants, where quality control in respect of water is carried out at least four times every 24 h,
- 2nd category: water-supply systems of cities with populations in the 100,000–500,000 range, in which quality control in respect of water is carried out 3 times in 24-h periods,
- 3rd category: water-supply systems of cities with populations in the 10,000–100,000 range, in which quality control in respect of water is carried out twice a day,
- 4th category: water-supply systems of towns or settlements with under 10,000 people, in which one check on water quality is carried out each 24 h, or in justified cases less than once a day (e.g., where a catchment is forested or otherwise undeveloped).
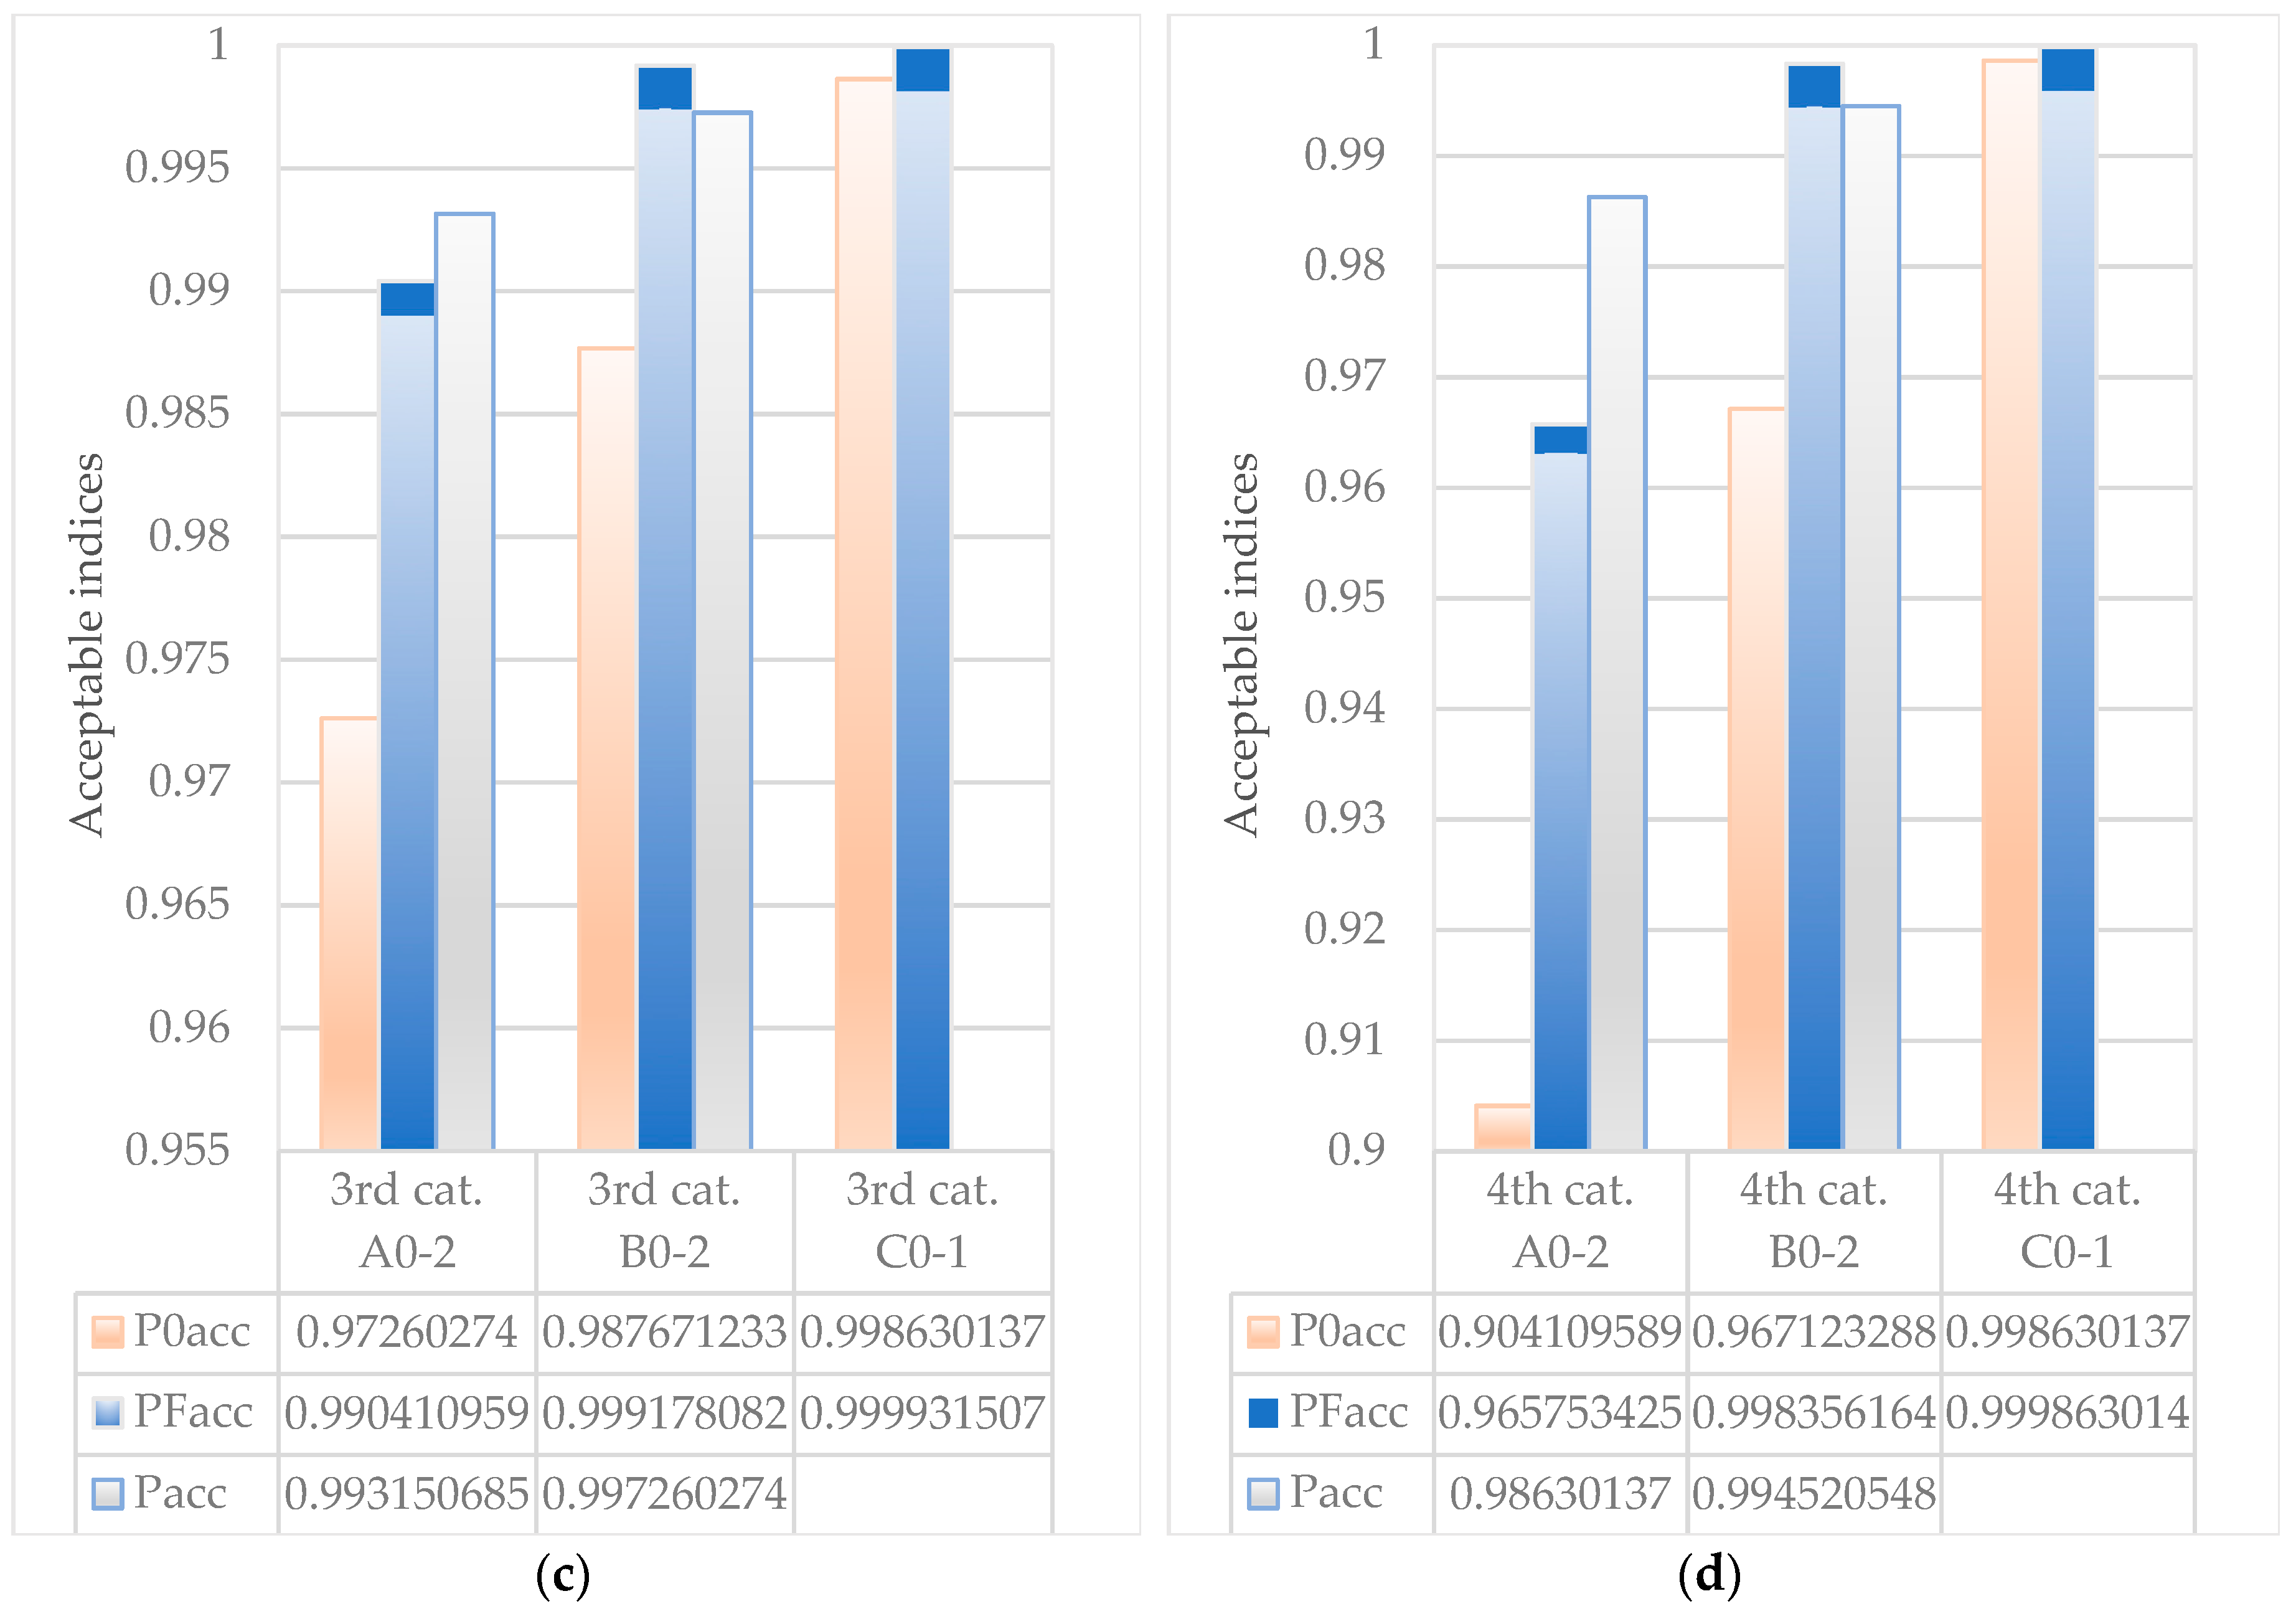
3. Application Example
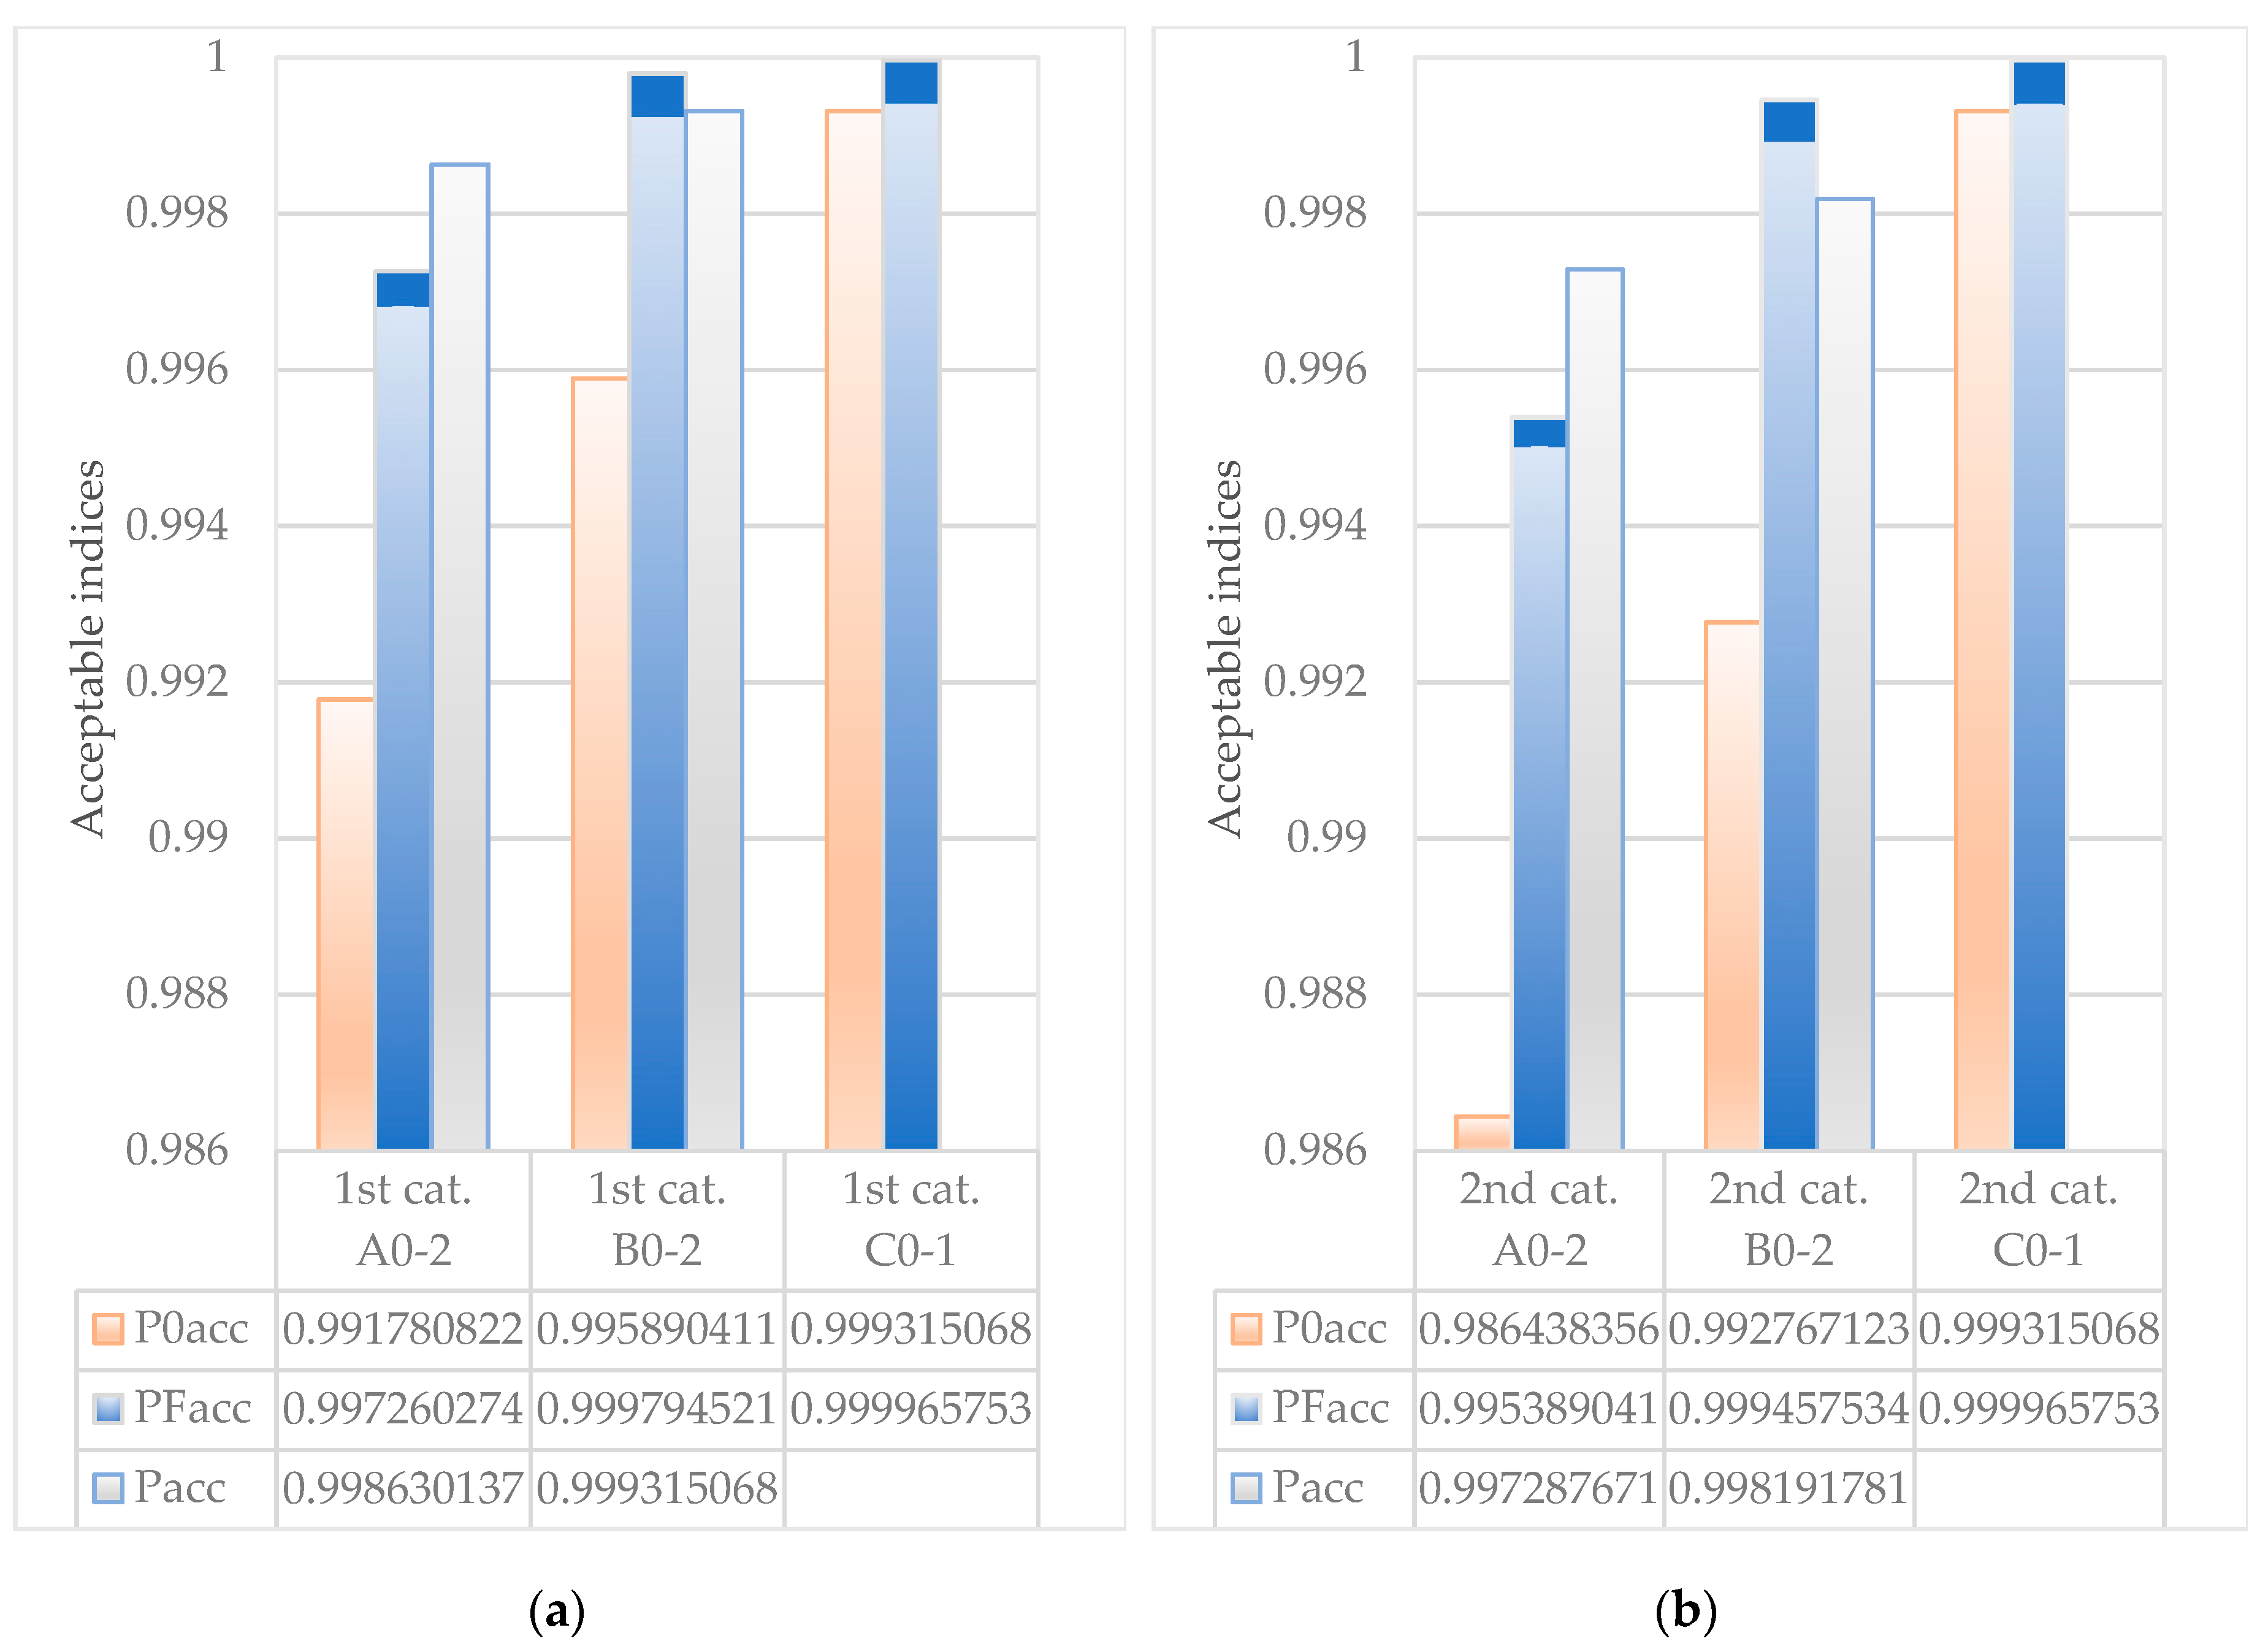
- P0acc = 0.999315068,
- PFacc = 0.999965753.
4. Conclusions and Perspectives
- While recipients of water are today looking increasingly for continuity of both the supply and the quality of water, sources may unfortunately be exposed to contamination by various dangerous substances that are not always monitored. Determination of risk indices for drinking water that are then set against acceptable levels allows the functioning of a system to be assessed,
- The concept presented here in no way understates the validity of water-quality norms that seem justified given verification over many years of application. However, that does not change what is an expression of current trends that will probably be corrected as the whole problem grows,
- The presented methodology can be implemented in water safety plans and evaluate new strategies in the security management process of the water supply systems,
- The objective reality of the functioning of a WTP involves various undesirable events causing a deterioration in water quality (final product), and reducing the reliability of public water supply, to the point where the safety of consumers is sometimes affected significantly.
Author Contributions
Funding
Acknowledgments
Conflicts of Interest
References
- Rak, J. A study of the qualitative methods for risk assessment in water supply systems. Environ. Prot. Eng. 2003, 29, 123–133. [Google Scholar]
- Eid, M. Modelling sequential events for risk, safety and maintenance assessments. J. Pol. Saf. Reliabil. Assoc. 2010, 1, 83–87. [Google Scholar]
- Tchorzewska-Cieslak, B. Estimating the acceptance of bearing the cost of the risks associated with the management of water supply system. Ochr. Sr. 2007, 29, 69–72. [Google Scholar]
- Rak, J.R. Methods of reliability index determination concerning municipal water quality. J. Konbin 2008, 5, 157–173. [Google Scholar] [CrossRef]
- Szpak, D.; Tchórzewska-Cieslak, B. Assessment of the failure rate of water supply system in terms of safety of critical infrastructure. Chemik 2014, 6, 862–867. [Google Scholar]
- Kwietniewski, M. Field reliability tests of water distribution system from the point of view of consumer’s needs. Civ. Eng. Environ. Syst. 2006, 23, 287–294. [Google Scholar] [CrossRef]
- Kwietniewski, M.; Roman, M. Reliability assessment of water supply systems. J. Water Supply Res. Technol. 1997, 46, 283–287. [Google Scholar]
- Sitzenfrei, R.; Zischg, J.; Sitzmann, M.; Bach, P.M. Impact of hybrid water supply on the centralised water system. Water 2018, 9, 855. [Google Scholar] [CrossRef]
- Rak, J.R. Some aspects of risk management in waterworks. Ochr. Sr. 2007, 29, 61–64. [Google Scholar]
- Rak, J.R.; Wloch, A. Models of level diversification assessment of water supply subsystem. Undergr. Infrastruct. Urban Areas 2015, 3, 237–244. [Google Scholar]
- Rak, J.; Tchórzewska-Cieślak, B. Review of matrix methods for risk assessment in water supply system. J. Konbin 2006, 1, 67–76. [Google Scholar]
- Tchórzewska-Cieślak, B. Bayesian Model of Urban Water Safety Management. Glob. Nest. J. 2011, 16, 667–675. [Google Scholar]
- Krolikowska, J. Damage evaluation of a town’s sewage system in southern poland by the preliminary hazard analysis method. Environ. Prot. Eng. 2011, 37, 131–142. [Google Scholar]
- Rak, J.; Boryczko, K. Assessment of water supply diversification using the Pielou index. Environ. Eng. 2017, 5, 53–58. Available online: https://books.google.pl/books?id=4H10DwAAQBAJ&pg=PA53&lpg=PA53&dq=Assessment+of+water+supply+diversification+using+the+Pielou+index&source=bl&ots=rUfm9Gc0bw&sig=ACfU3U1rLdZl_Oml3K0rzN3lJv2Dwh5D-g&hl=pl&sa=X&ved=2ahUKEwji87Lt5dTiAhVrmIsKHb-9BIwQ6AEwBnoECAkQAQ#v=onepage&q=Assessment%20of%20water%20supply%20diversification%20using%20the%20Pielou%20index&f=false (accessed on 3 June 2019).
- EN 15975-1. Security of Drinking Water Supply. Guidelines for Risk and Crisis Management. Part. 1 Crisis Management. Available online: https://infostore.saiglobal.com/preview/98705108051.pdf?sku=875255_SAIG_NSAI_NSAI_2080671 (accessed on 3 June 2019).
- EN 15975-2. Security of Drinking Water Supply. Guidelines for Risk and Crisis Management. Part. 2. Risk Management. Available online: https://circabc.europa.eu/webdav/CircaBC/env/Water%20Industries/Library/DRINKING%20WATER/C%20-%20Meetings%20and%20Workshops/1%20-%20Drinking%20Water%20Expert%20Group/2%20-%20Meetings%20of%20the%20Drinking%20Water%20Expert%20Group/05%20-%20Fifth%20Meeting%20of%20the%20Drinking%20Water%20Expert%20Group%20-%2022_01_2016/Presentations/Item%204%20EN%20150975-2%20Castell-Exner.pdf (accessed on 3 June 2019).
- World Health Organization. Guidelines for Drinking-Water Quality, 4th ed.; World Health Organization: Geneva, Switzerland, 2011. [Google Scholar]
- Estokova, A.; Ondrejka Harbulakova, V.; Luptakova, A.; Stevulova, N. Performance of fiber-cement boards in biogenic sulphate environment. Adv. Mater. Res. 2014, 897, 41–44. [Google Scholar] [CrossRef]
- Kowalski, D.; Kowalska, B.; Kwietniewski, M. Monitoring of water distribution system effectiveness using fractal geometry. Bull. Pol. Acad. Sci. 2015, 63, 155–161. [Google Scholar] [CrossRef]
- Kutyłowska, M. Prediction of failure frequency of water-pipe network in the selected city. Period. Polytech. Civ. Eng. 2017, 61, 548–553. [Google Scholar] [CrossRef]
- Ondrejka Harbulakova, V.; Estokova, A.; Stevulova, N.; Luptakova, A. Different aggressive media influence related to selected characteristics of concrete composites investigation. Int. J. Energy Environ. Eng. 2014, 5, 1–6. [Google Scholar] [CrossRef]
- Romano, E.; Guyennon, N.; Duro, A.; Giordano, R.; Petrangeli, A.B.; Portoghese, I.; Salerno, F.A. Stakeholder oriented modelling framework for the early detection of shortage in water supply systems. Water 2018, 10, 762. [Google Scholar] [CrossRef]
- Sapkota, M.; Arora, M.; Malano, H.; Sharma, A.; Moglia, M. Integrated evaluation of hybrid water supply systems using a promethee-gaia approach. Water 2018, 10, 610. [Google Scholar] [CrossRef]
- Shalamzari, M.J.; Zhang, W. Assessing water scarcity using the water poverty index in golestan province of Iran. Water 2018, 10, 1079. [Google Scholar] [CrossRef]
- Sun, X.; Zhang, H.; Zhong, M.; Wang, Z.; Liang, X.; Huang, T.; Huang, H. Analyses on the temporal and spatial characteristics of water quality in a seagoing river using multivariate statistical techniques: A case study in the duliujian river, China. Int. J. Environ. Res. Public Health 2019, 16, 1020. [Google Scholar] [CrossRef] [PubMed]
- Wang, J.; Tao, T.; Yan, H. Effects of sulfate, chloride, and bicarbonate on iron stability in a PVC–U drinking pipe. Int. J. Environ. Res. Public Health 2017, 14, 660. [Google Scholar] [CrossRef] [PubMed]
- Wang, X.L.; Wang, G.X.; Wu, Y.X.; Xu, Y.; Gao, H. Comprehensive assessment of regional water usage efficiency control based on game theory weight and a matter-element model. Water 2017, 9, 113. [Google Scholar] [CrossRef]
- Zheng, J.; Zhang, H.; Xing, Z. Re-examining regional total-factor water efficiency and its determinants in China: A parametric distance function approach. Water 2018, 10, 1286. [Google Scholar] [CrossRef]
- Zimoch, I. Pressure control as part of risk management for a water-pipe network in service. Ochr. Sr. 2012, 34, 57–62. [Google Scholar]
- Council Directive 2008/114/EC of 8 December 2008 on the Identification and Designation of European Critical Infrastructures and the Assessment of the Need to Improve Their Protection, OJ L 345. Available online: https://eur-lex.europa.eu/legal-content/EN/TXT/?uri=CELEX%3A32008L0114 (accessed on 3 June 2019).
- Hippe, Z.S.; Zamorska, J. A new approach to application of pattern recognition methods in analytical chemistry–II. Prediction of missing values in water pollution grid using modified KNN-method. Chem. Anal. 1999, 44, 597–602. [Google Scholar]
- Pietrucha-Urbanik, K.; Studziński, A. Case Study of Failure Simulation of Pipelines Conducted in Chosen Water Supply System. Eksploat. Niezawodn. 2017, 19, 317–323. [Google Scholar] [CrossRef]
- Zamorska, J.; Papciak, D. Activity of nitrifying biofilm in the process of water treatment in diatomite bed. Environ. Prot. Eng. 2008, 34, 37–52. [Google Scholar]
- Zimoch, I. Modeling of trihalomethane concentrations in tap water. Ochr. Sr. 2011, 33, 35–42. [Google Scholar]
- Council Directive 98/83/EC of 3 November 1998 on the quality of water intended for human consumption, with its latest amendments, OJ L 330, 5.12.1998. Available online: https://eur-lex.europa.eu/legal-content/EN/TXT/?uri=CELEX%3A31998L0083 (accessed on 3 June 2019).
- Krolikowska, J.; Krolikowski, A. Fees for a storm water discharge-needs and possibilities. Rocz. Ochr. Sr. 2013, 15, 1143–1152. [Google Scholar]
- Krolikowska, J.; Debowska, B.; Krolikowski, A. An evaluation of potential losses associated with the loss of vacuum sewerage system reliability. Environ. Eng. 2013, 4, 51–57. [Google Scholar]
- Kowalski, D.; Kowalska, B.; Kwietniewski, M. Localization method for water quality measuring points in water network monitoring system. Ochr. Sr. 2013, 35, 45–48. [Google Scholar]
- Rak, J. Safety of Water Supply System; Polish Academy of Science: Warsaw, Poland, 2009. [Google Scholar]
- Rak, J.R. Selected Aspects of the Safety of Water Supply Systems; Publishing House of Rzeszow University of Technology: Rzeszow, Poland, 2015. [Google Scholar]
- Zimoch, I.; Kotlarczyk, B.; Soltysik, A. Use of prehydrolyzed coagulants for the enhancement of water treatment efficiency in the czaniec water treatment plant. Ochr. Sr. 2007, 29, 45–49. [Google Scholar]
- Gaska, K.; Generowicz, A.; Zimoch, I.; Ciula, J.; Iwanicka, Z. A high-performance computing (HPC) based integrated multithreaded model predictive control (MPC) for water supply networks. Archit. Civ. Eng. Environ. 2017, 10, 141–151. [Google Scholar] [CrossRef]
- Han, S.; Koo, D.D.; Kim, Y.; Park, J. Gap analysis based decision support methodology to improve level of service of water services. Sustainability 2017, 9, 1578. [Google Scholar] [CrossRef]
- Piegdon, I.; Tchorzewska-Cieslak, B.; Szpak, D. The use of geographical information system in the analysis of risk of failure of water supply network. Environ. Eng. 2017, 5, 7–16. [Google Scholar]
- Szpak, D. Method of water consumers safety analysis and assessment. E3S Web of Conf. 2017, 17, 00092. Available online: https://www.e3s-conferences.org/articles/e3sconf/pdf/2017/05/e3sconf_eko2017_00092.pdf (accessed on 3 June 2019). [CrossRef]


| 1st Category | ||||||||
| Application Example | A | B | C | |||||
| 0 | 1 | 2 | 0 | 1 | 2 | 0 | 1 | |
| EI= 0 | 0 < EI ≤ 0.3 | 0.3 < EI ≤ 0.5 | EI= 0 | 0 < EI ≤ 0.1 | 0.1 < EI ≤ 0.3 | EI= 0 | 0 < EI ≤ 0.05 | |
| Fi, a−1 | - | 10 | 2 | - | 5 | 1 | - | 1 |
| Ti, d | - | 0.25 | 0.25 | - | 0.25 | 0.25 | - | 0.25 |
| EIi | EI0 | EI1 | EI2 | EI0 | EI1 | EI2 | EI0 | EI1 |
| 0 | 0.3 | 0.5 | 0 | 0.1 | 0.3 | 0 | 0.05 | |
| 2nd Category | ||||||||
| Application Example | A | B | C | |||||
| 0 | 1 | 2 | 0 | 1 | 2 | 0 | 1 | |
| EI = 0 | 0 < EI ≤ 0.3 | 0.3 < EI ≤ 0.5 | EI= 0 | 0 < EI ≤ 0.1 | 0.1 < EI ≤ 0.3 | EI= 0 | 0 < EI ≤ 0.05 | |
| Fi, a−1 | - | 12 | 3 | - | 6 | 2 | - | 1 |
| Ti, d | - | 0.33 | 0.33 | - | 0.33 | 0.33 | - | 0.25 |
| EIi | EI0 | EI1 | EI2 | EI0 | EI1 | EI2 | EI0 | EI1 |
| 0 | 0.3 | 0.5 | 0 | 0.1 | 0.3 | 0 | 0.05 | |
| 3rd Category | ||||||||
| Application Example | A | B | C | |||||
| 0 | 1 | 2 | 0 | 1 | 2 | 0 | 1 | |
| EI= 0 | 0 < EI ≤ 0.3 | 0.3 < EI ≤ 0.5 | EI= 0 | 0 < EI ≤ 0.1 | 0.1 < EI ≤ 0.3 | EI= 0 | 0 < EI ≤ 0.1 | |
| Fi, a−1 | - | 15 | 5 | - | 7 | 2 | - | 1 |
| Ti, d | - | 0.5 | 0.5 | - | 0.5 | 0.5 | - | 0.5 |
| EIi | EI0 | EI1 | EI2 | EI0 | EI1 | EI2 | EI0 | EI1 |
| 0 | 0.3 | 0.5 | 0 | 0.1 | 0.3 | 0 | 0.05 | |
| 4th Category | ||||||||
| Application Example | A | B | C | |||||
| 0 | 1 | 2 | 0 | 1 | 2 | 0 | 1 | |
| EI = 0 | 0 < EI ≤ 0.3 | 0.3 < EI ≤ 0.7 | EI= 0 | 0 < EI ≤ 0.1 | 0.1 < EI ≤ 0.3 | EI = 0 | 0 < EI ≤ 0.1 | |
| Fi, a−1 | - | 30 | 5 | - | 10 | 2 | - | 1 |
| Ti, d | - | 1 | 1 | - | 1 | 1 | - | 0.5 |
| EIi | EI0 | EI1 | EI2 | EI0 | EI1 | EI2 | EI0 | EI1 |
| 0 | 0.3 | 0.7 | 0 | 0.1 | 0.3 | 0 | 0.1 | |
© 2019 by the authors. Licensee MDPI, Basel, Switzerland. This article is an open access article distributed under the terms and conditions of the Creative Commons Attribution (CC BY) license (http://creativecommons.org/licenses/by/4.0/).
Share and Cite
Rak, J.R.; Pietrucha-Urbanik, K. An Approach to Determine Risk Indices for Drinking Water–Study Investigation. Sustainability 2019, 11, 3189. https://doi.org/10.3390/su11113189
Rak JR, Pietrucha-Urbanik K. An Approach to Determine Risk Indices for Drinking Water–Study Investigation. Sustainability. 2019; 11(11):3189. https://doi.org/10.3390/su11113189
Chicago/Turabian StyleRak, Janusz R., and Katarzyna Pietrucha-Urbanik. 2019. "An Approach to Determine Risk Indices for Drinking Water–Study Investigation" Sustainability 11, no. 11: 3189. https://doi.org/10.3390/su11113189
APA StyleRak, J. R., & Pietrucha-Urbanik, K. (2019). An Approach to Determine Risk Indices for Drinking Water–Study Investigation. Sustainability, 11(11), 3189. https://doi.org/10.3390/su11113189