1. Introduction
The United Nations made sustainable development a global priority with Agenda 21 during the 1992 Earth Summit and most recently with Agenda 2030 and its sustainable development goals [
1]. The National Academy of Engineering (NAE) has also prioritized sustainability for engineers in the United States [
2]. Together, these goals reflect a global concern and commitment to sustainable development and call for engineers to take responsibility for sustainable solutions to complex problems. Building the knowledge base and sense of responsibility for sustainable development among engineers is a process that must begin early in the engineer’s career, during the undergraduate years. Yet, integrating sustainability themes into undergraduate engineering education is difficult.
Engineering sits at the intersection between the needs of society and scientific knowledge [
3]. This makes engineers critical in both facilitating and leading sustainable development in the 21st century. In turn, engineering educators are tasked with advancing a major shift in mindset from controlling nature to participating with nature and doing so in such a way that synergistically improves both human life and environment [
3]. In support of this paradigm shift, the NAE, with input from technology experts around the world, defined 14 grand challenges of engineering based on four cross-cutting themes which include sustainability [
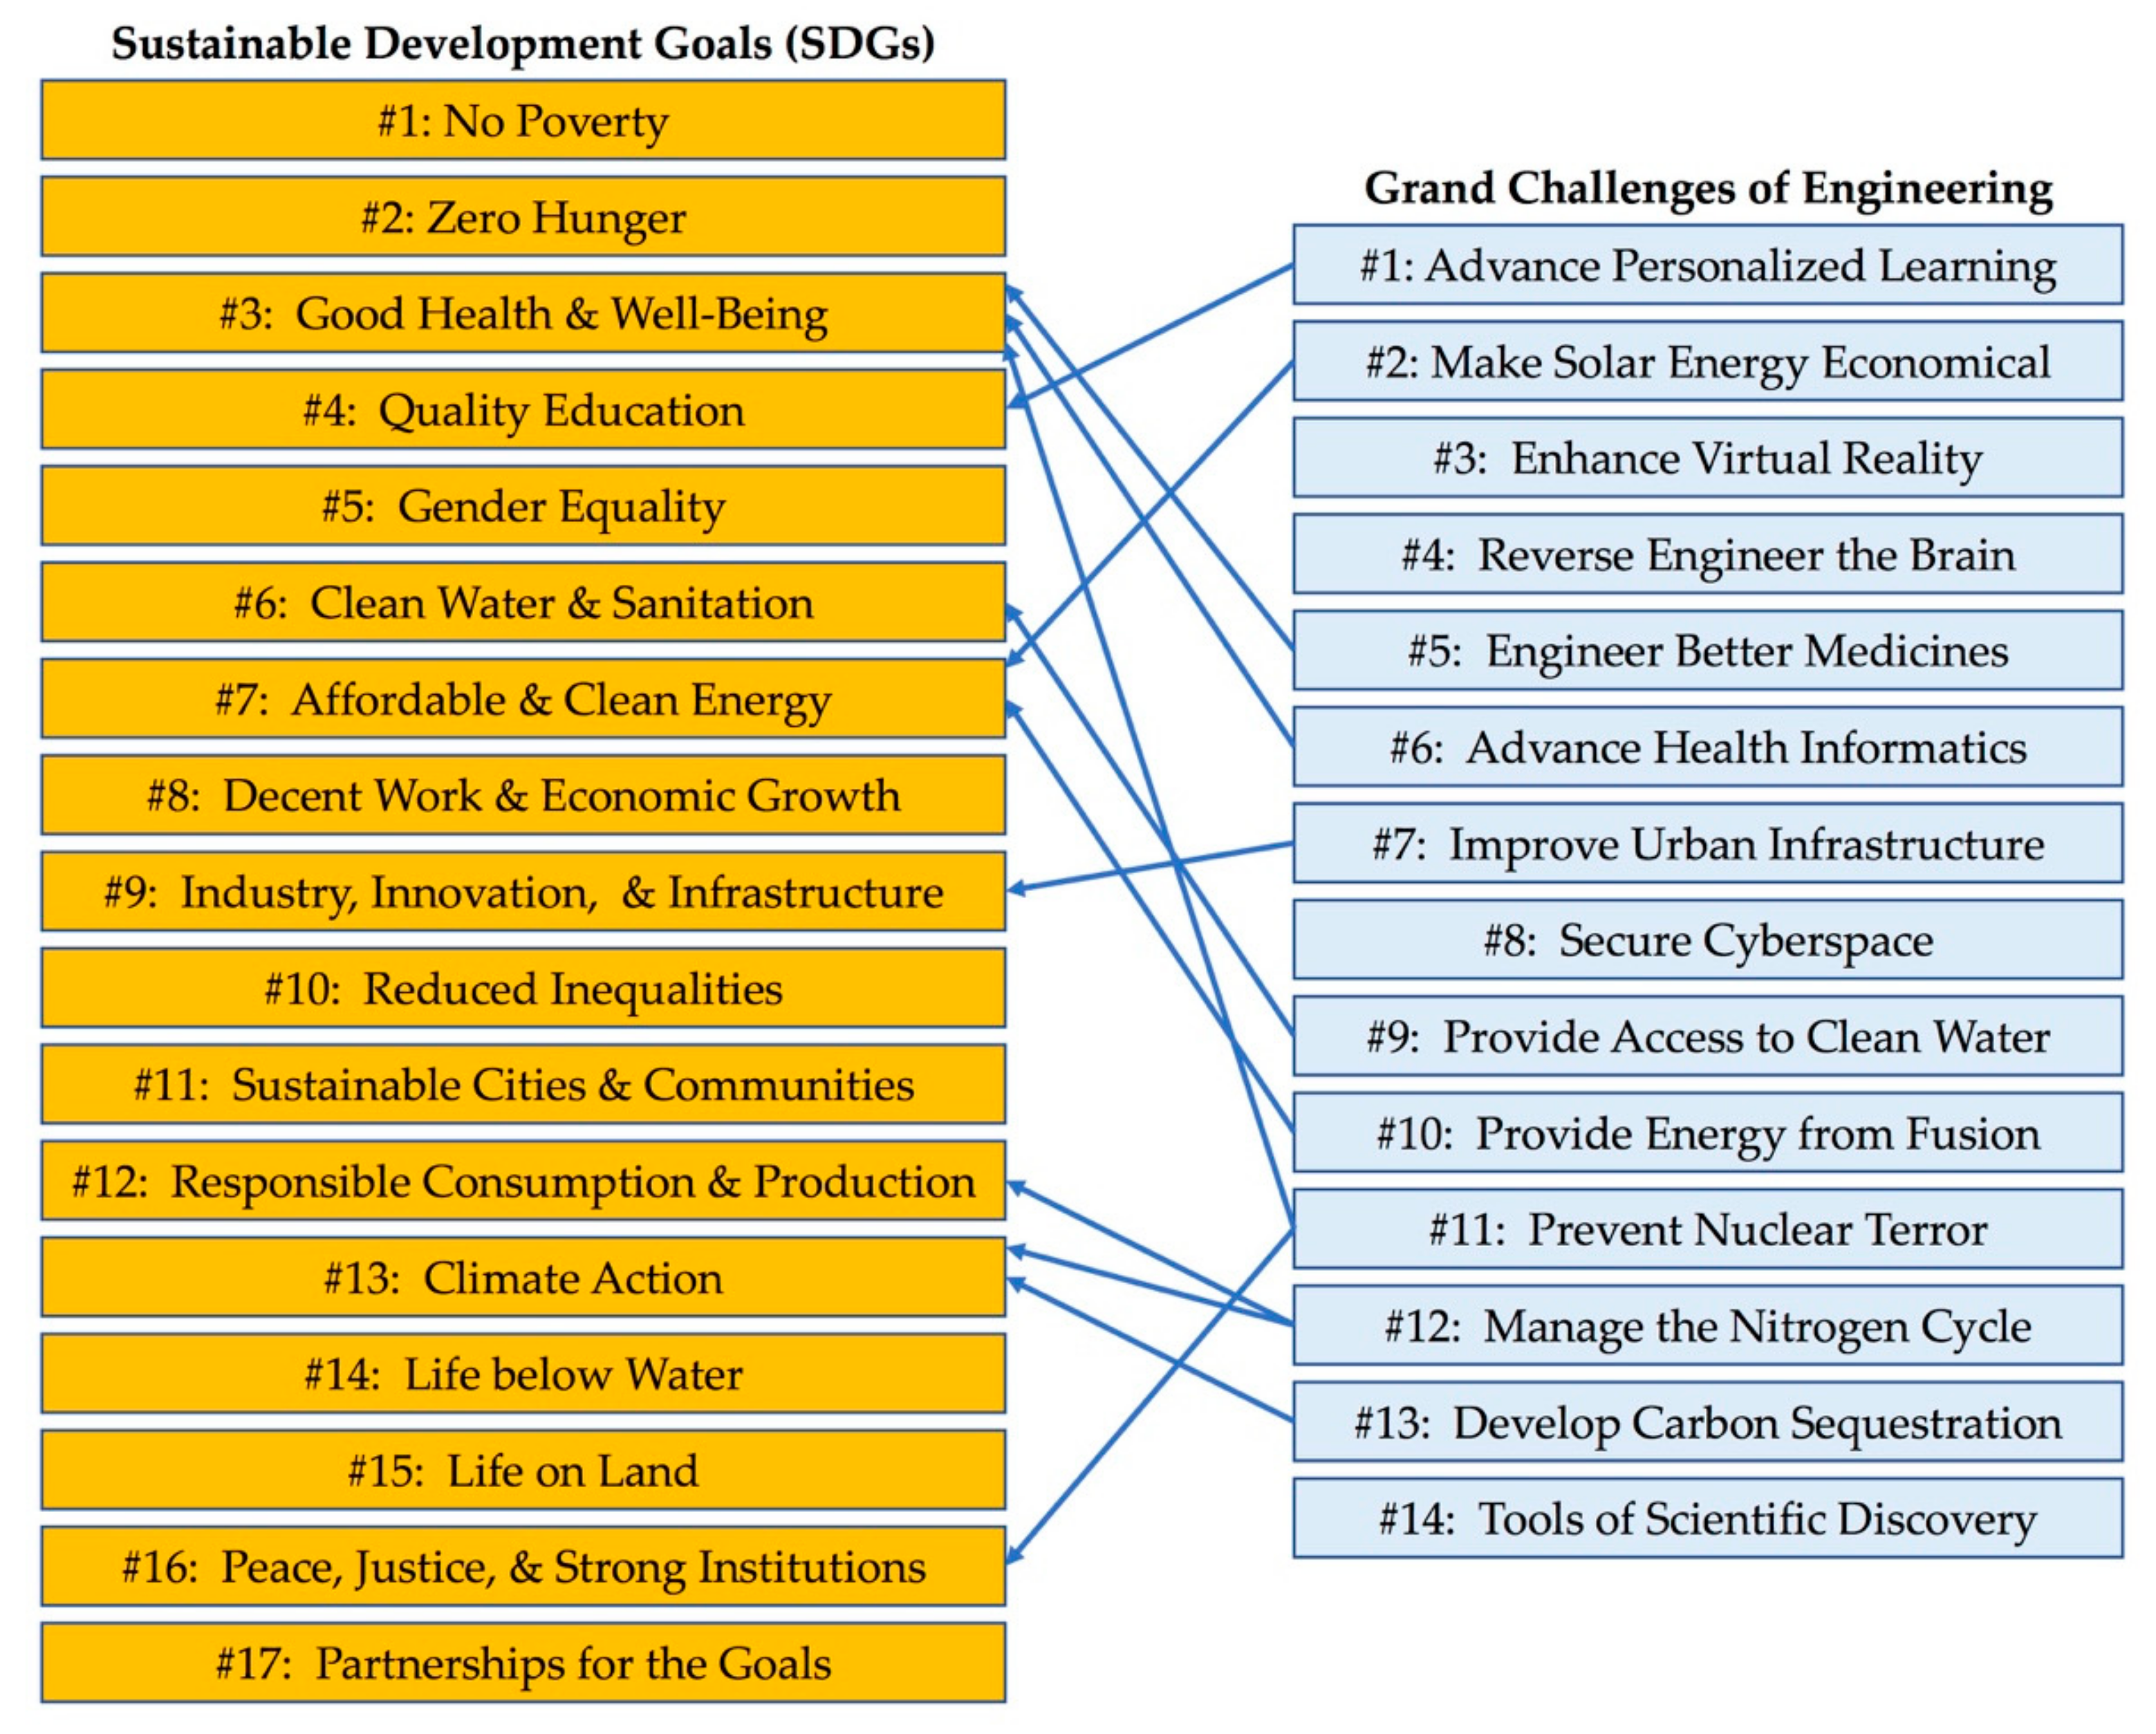
2]. Several of these grand challenges focus on a traditional single-pillar, environmentally focused view of sustainability (e.g., develop carbon sequestration methods, manage the nitrogen cycle). However, many challenges also incorporate social and economic pillars of sustainability (e.g., provide access to clean water, restore and improve urban infrastructure) associated with the more comprehensive triple bottom line (TBL) approach. Still, other challenges focus on the cross-cutting influence of education (e.g., advance personalized learning) in supporting a more sustainable future alongside environmental, social, and economic dimensions.
When the 14 grand engineering challenges and the 17 sustainable development goals (SDGs) that guide Agenda 2030 are mapped to one another (
Figure 1), the intersection between the NAE’s priorities and Agenda 2030 is evident. These 17 SDGs as well as Agenda 2030 evolved from the TBL and associated action plan defined by Agenda 21, which, in turn, emerged from the 1992 Earth Summit and was adopted by 178 countries at that time [
4]. Agenda 21 set in motion a commitment at local, national, and global levels to sustainable development. Since that time, the language of sustainable development has changed, but the core commitment and goals central to Agenda 21 remain firm. Agenda 21 focuses on four major facets of sustainable development: social and economic aspects, conservation of resources, strengthening the role of major groups, and means of implementation. Many of the Agenda 2030 SDGs are focused on the environment (e.g., #13 climate action, #14 life below water, #15 life on land) while others focus on the economic (e.g., #8 decent work and economic growth, #1 no poverty) and social (e.g., #5 gender equality, #16 peace, justice, and strong institutions) pillars of sustainability. Furthermore, Agenda 2030 goes beyond the three basic pillars of sustainability by specifically emphasizing education (#4 quality education) as well as the partnerships (goal #17) necessary to realistically achieve the SDGs [
1].
The efforts of the United Nations in adopting far-reaching sustainability goals for the 21st century have provided impetus for educators to incorporate sustainability and sustainable development into K-16 curricula. Likewise, the efforts of the National Academy of Engineering in formulating grand challenges for engineers have stimulated an urgent need for engineering programs in higher education to figure out how, when, and to what extent sustainability should be integrated into existing curricula. The United Nations Agenda 2030 recognized this urgent need for changes in education within all disciplines and across all levels of education and expressed it in Target 4.7 under the Quality Education SDG #4 [
5]:
“By 2030, ensure that all learners acquire the knowledge and skills needed to promote sustainable development, including, among others, through education for sustainable development and sustainable lifestyles, human rights, gender equality, promotion of a culture of peace and non-violence, global citizenship and appreciation of cultural diversity and of culture’s contribution to sustainable development.”
Like the UN Initiative, education for sustainable development (ESD), this target is generalized and has been left ambiguous on purpose so that specific disciplines can implement it within the context of the knowledge and skills inherent to those disciplines. However, such ambiguity has reduced support for the ESD and resulted in poor understanding of how to achieve the plentiful supply of learning outcomes that have emerged from the ESD initiative [
6]. On the positive side, many university and college campuses in the U.S. have successfully adopted greening initiatives and pursued research in sustainable development. But, pedagogical strategies to integrate sustainability into the curriculum at a deep enough level to achieve the objectives of the ESD have lagged far behind research and greening [
7]. Similar ambiguity has emerged from the broad, multi-faceted call for considering sustainability made by engineering’s accreditation board (ABET):
Student Outcome 2: “an ability to apply engineering design to produce solutions that meet specified needs with consideration of public health, safety, and welfare, as well as global, cultural, social, environmental, and economic factors.”
In addition to having to resolve how to implement these educational outcomes, engineering faces additional challenges for integrating sustainability into the curricula because engineering teaching remains dominated by lecture-based, content-heavy instruction [
9] that is incompatible with effective instruction for sustainable development. Teaching sustainability requires a shift in how engineering educators teach. They must not only develop knowledge and skills but also enable students to shift their values to favor sustainable development [
6]. Negotiating shifts in values via indoctrination in a lecture-based environment is prone to failure [
10] and instead requires more student-centered learning strategies, including problem-based learning, experiential learning, participatory learning, and applied learning [
6]. The end result is that career engineers still produce products that are predominantly unsustainable and engineering students’ understanding of sustainability is largely unsatisfactory [
11]. Attempts to integrate sustainability into existing curricula have had limited effectiveness and are hampered by students’ views that sustainable design is a secondary rather than critical piece of product design [
12], by definitions of sustainability that remain narrow and restricted to environmental impacts [
13], and by entrenched beliefs that sustainability is outside the scope of an engineering education [
14,
15].
This study seeks to gain greater insight into the best intersection between where engineering education is now and where it needs to be regarding sustainability education. It does so by first contextualizing what engineering students think is important in terms of what is important to engineering as a discipline. While engineering educators advocate for a heterogeneous and often inconsistent scope of skills and methodologies regarding what engineering students should or should not learn about sustainability [
16], few would argue that engineers need not be prepared to contribute to what is important to engineering. Thus, placing what engineering students say they are ready to contribute in their careers into the context of the grand challenges of engineering may be a more effective way to bring more engineering educators onto the same page with regard to sustainability education. Doing so can also expose gaps in engineering education that are relevant not only to sustainable development but to other key societal problems that ultimately attract broader support for curriculum change. In addition to looking at potential gaps between engineering education and the engineering profession in sustainability terms, this study also evaluates differences among engineering and other STEM (environmental sciences) majors and non-STEM majors (business, education). If traditional engineering teaching is not necessarily well positioned to teach all aspects of sustainable development, our goal is to identify the best starting points that will nevertheless allow educators to move toward a more sustainability-focused education and a transformation in what engineers seek to do when they graduate.
2. Materials and Methods
The goal of this research is to support the development of tools for effectively teaching sustainability in engineering. This study specifically focuses on developing insight into where engineering education best fits in sustainability education. Our first research question (RQ1) is explored via qualitative analysis of a single open-ended survey question where students can freely articulate their intended contributions to sustainability over the course of their careers. The second and third research questions (RQ2 and RQ3) are explored using quantitative analyses of survey data.
2.1. Research Questions
2.1.1. Research Question 1 (RQ1)
Do engineering students expect to contribute to sustainability in ways that are consistent with national priorities for engineering? As a nation, if the United States expects to meet its grand challenges for engineering in the 21st century, the expectations of engineering students must be aligned with expectations of the discipline. This research question takes a look at how aligned these expectations are by comparing open-ended responses of engineering students to the priorities established by engineering experts in the National Academy of Engineering [
2].
2.1.2. Research Question 2 (RQ2)
Do students in various (STEM and non-STEM) majors express a different sense of personal responsibility for specific challenges in sustainability? This question offers some insight into the role that engineering (and STEM education) can play in sustainability education. If more engineering students bear personal responsibility for certain challenges of sustainability than students in other fields, these differences suggest logical points of departure for exploring sustainability more broadly in the engineering curriculum.
2.1.3. Research Question 3 (RQ3)
How are students’ personal knowledge and professional responsibility linked to their sense of personal responsibility for promoting sustainability? Since much of engineering remains lecture-based and focused on the transmission of content, the answer to this question provides insight into how effectively overlaying sustainability content into traditional lecture-based pedagogy can improve individual or personal knowledge and in so doing, enhance the personal responsibility for sustainable development that engineering students take with them into the workforce.
2.2. Participants
The population associated with this study consists of 399 undergraduate students (
Table 1) in majors associated with business (21%), education (10%), engineering and computer science (59%), or environmental sciences (10%). Approximately 41% of the sample was female, and the self-reported ethnicities were primarily White (44%) and Asian (43%). Within engineering, the majors most represented in this population were electrical engineering (58.9%) and mechanical engineering (31.6%), which together make up 48% [
17] of the total engineering bachelor’s degrees granted in the United States. In all fields, a majority of participants were upper level (junior or senior): 90% in engineering, 63% in education, 85% in environmental studies, and 79% in business.
Background data regarding participant involvement in curricular and extracurricular activities relating to sustainability was not collected in this study. However,
Table 2 summarizes relevant courses that students were exposed to within their major, designated by the institution as either related to or focused on sustainability.
Sustainability-related courses cover one or more topics that are relevant to at least one dimension of sustainability while
sustainability-focused courses are those that focus on all three dimensions of sustainability. The course information in
Table 2 provides insight into the extent to which coursework may have influenced student perceptions and responses in this study. Most courses in this list are
sustainability focused but emphasize the environmental pillar of sustainability over economic and social aspects. In terms of the amount of coverage in each major associated with this study, environmental sciences had the greatest number of sustainability coursework options (by a wide margin) while business as well as electrical and computer engineering students had the fewest such options within the major.
2.3. Procedures
IRB (internal review board) approval was obtained by the investigating institution to recruit, incentivize, and survey students using convenience sampling. Undergraduate participants were recruited into the study over four academic terms. In engineering, participants were recruited from a senior-level design course (11.4%), a junior-level design course (13.1%), a junior-level writing course (21.1%), and a sophomore-level electronics course (54.4%). All of these engineering courses had content that related to sustainability (e.g., reducing component count, selecting less hazardous components) but no courses focused on sustainability as a central theme. Participants were provided incentives consisting of a nominal amount of extra credit for the course in which they were recruited. In other majors, participants were randomly recruited by email from department or college listservs and given an Amazon gift card for survey completion. Participation in the study was voluntary, and students were assured their survey responses would remain confidential. All students completed an electronic survey online and outside of class. Surveys were collected with identifying information so that duplicate surveys could be removed before aggregating data for analysis. All results were cross-sectional. In the survey, students reported demographic information and responded to affective items that addressed sense of belonging and self-efficacy, as well as to a range of items that assessed global competence, civic engagement, social responsibility, and sustainability.
2.4. Instruments
This study focuses on survey responses regarding a single demographic measure (type of major), scales consisting of multiple items, individual items addressing personal responsibility, and a single short answer question. The short answer question, used to address RQ1, was:
What do you believe your most important contribution to sustainability will be as a professional in your chosen field?
RQ2 and RQ3 relied on three scales: A nine-item scale that measured perceptions of
professional responsibility for sustainable development, a five-item scale that measured
personal knowledge about sustainability, and another five-item scale focused on
personal responsibility. Individual items associated with
personal responsibility were also used to support analysis of RQ2.
Personal knowledge and
personal responsibility scales were drawn from previous studies on social responsibility and sustainability, which demonstrated good validity and reliability on scales using these items [
18,
19,
20].
A modified scale representative of general beliefs about
professional responsibility was developed for this study by using exploratory factor analysis of 28 previously used survey items, which addressed what students thought professionals in their chosen field should do regarding various facets of sustainable development. A principal component analysis (PCA) was first performed on all items using no rotation with eigenvalues set to 1. Communalities were examined to identify problematic variables, and those variables with a communality less than 0.40 were dropped from the analysis. Once these variables were removed, the principal component analysis was repeated until all communalities were greater than 0.40. Factors that accounted for at least 5% of the variance in the data were retained for subsequent factor analyses, leading to a total of four factors. Subsequent factor analyses used a Promax rotation because some of the items in the scale were assumed to be correlated. The first of the four factors (which explained 25% of the variance in the data) was retained to represent students’ sense of
professional responsibility. The
personal knowledge scale was extracted from five items, which evaluated student perceptions on five specific issues in sustainability. All five issues (climate change, sustainable energy, resource scarcity, waste electronics, and access to education) were compatible with the TBL (triple bottom line) approach to sustainability, which balances considerations of social, economic, and environmental impact in sustainable development. The
personal knowledge scale represented 60% of the variance in the data consisting of these five items. Finally,
personal responsibility was evaluated based on the same specific challenges in sustainability as were assessed regarding
personal knowledge. Five items, each focusing on a different challenge, were aggregated into a single factor that represented 64% of the variance in the data. Sample items for this and the other two scales used in this study are provided in
Table 3. In addition, each single item in
personal responsibility was also retained to perform frequency analyses to understand differences among majors associated with RQ2.
2.5. Data Analysis
Short answer data regarding students’ intended contributions to sustainability were analyzed using qualitative methods involving a multi-step phase analysis consistent with that described in [
21,
22,
23]. Short answer data were cleaned, de-identified, and aggregated into a single MS Excel spreadsheet before analysis. Responses were then coded according to the 17 SDGs outlined by Agenda 2030 [
1], which build on the millennium development goals by emphasizing human rights and gender equality alongside goals that balance the social, economic, and environmental dimensions of sustainability. Codes were assigned based on a primary goal that was most substantively represented in a student’s response. A second pass at the data then included any additional SDGs that were consistent with the student’s response. Student responses that were too generalized to align with a specific SDG(s) were coded separately (code = −1) as were student responses that did not pertain to TBL concepts of sustainability at all (code = 0).
Multiple strategies were used to maintain the quality of data collection and handling by preserving validity and improving reliability of the data consistent with the quality framework provided by Walther, Sochaka, and Kellam [
24]. To preserve validity of the analysis results, short answer data were coded according to globally accepted contexts for sustainability embodied by the 17 SDGs of Agenda 2030. Care was also taken during data collection and handling to ensure reliability of the results. Unlike focus groups and interviews, where what researchers say and how they ask questions may expose researcher bias and thus influence student responses, the short answer question in our survey was answered remotely and was less vulnerable to such bias.
Data from Likert-scale items and scales used to explore RQ2 and RQ3 were analyzed using SPSS 19 to compute descriptive statistics, test the reliability of the scales, conduct frequency analyses and analyses of variance (ANOVA) by type of major, and construct the linear regression models for analysis. In RQ2, frequency statistics were tabulated by type of major (business, education, engineering, and environmental sciences) for five
personal responsibility items and subsequent analyses using chi-squared tests of independence used to understand differences by type of major. The strength of differences was evaluated using effect sizes based on Cramer’s V [
25]. In RQ3, descriptive statistics and ANOVAs were first used to identify any significant differences in the independent variables. Then, a hierarchical linear regression model was used to understand how type of major,
professional responsibility, and
personal knowledge predicted
personal responsibility. For the regression models, field of study was effect coded as summarized in
Table 4 with engineering as the baseline field (coded as −1 for all effect coded variables). Type of major was coded in the lowest level of the model using these effect codes and
professional responsibility and
personal knowledge were inserted in the second level of the model. Any interactions that emerged as potentially significant were then evaluated in the third and last level of the regression model. The strength of the regression models was evaluated using the r
2 coefficient of determination.
3. Results
The results of this study explore how engineering students’ perspectives on sustainability compare to the vision of the engineering profession and to the perspectives of students in other types of majors.
3.1. Sense of Personal Responsibility
Engineering students cited multiple SDGs in their responses to the short answer question in the survey. How their responses compared to the 17 Agenda 2030 SDGs is summarized in
Table 5.
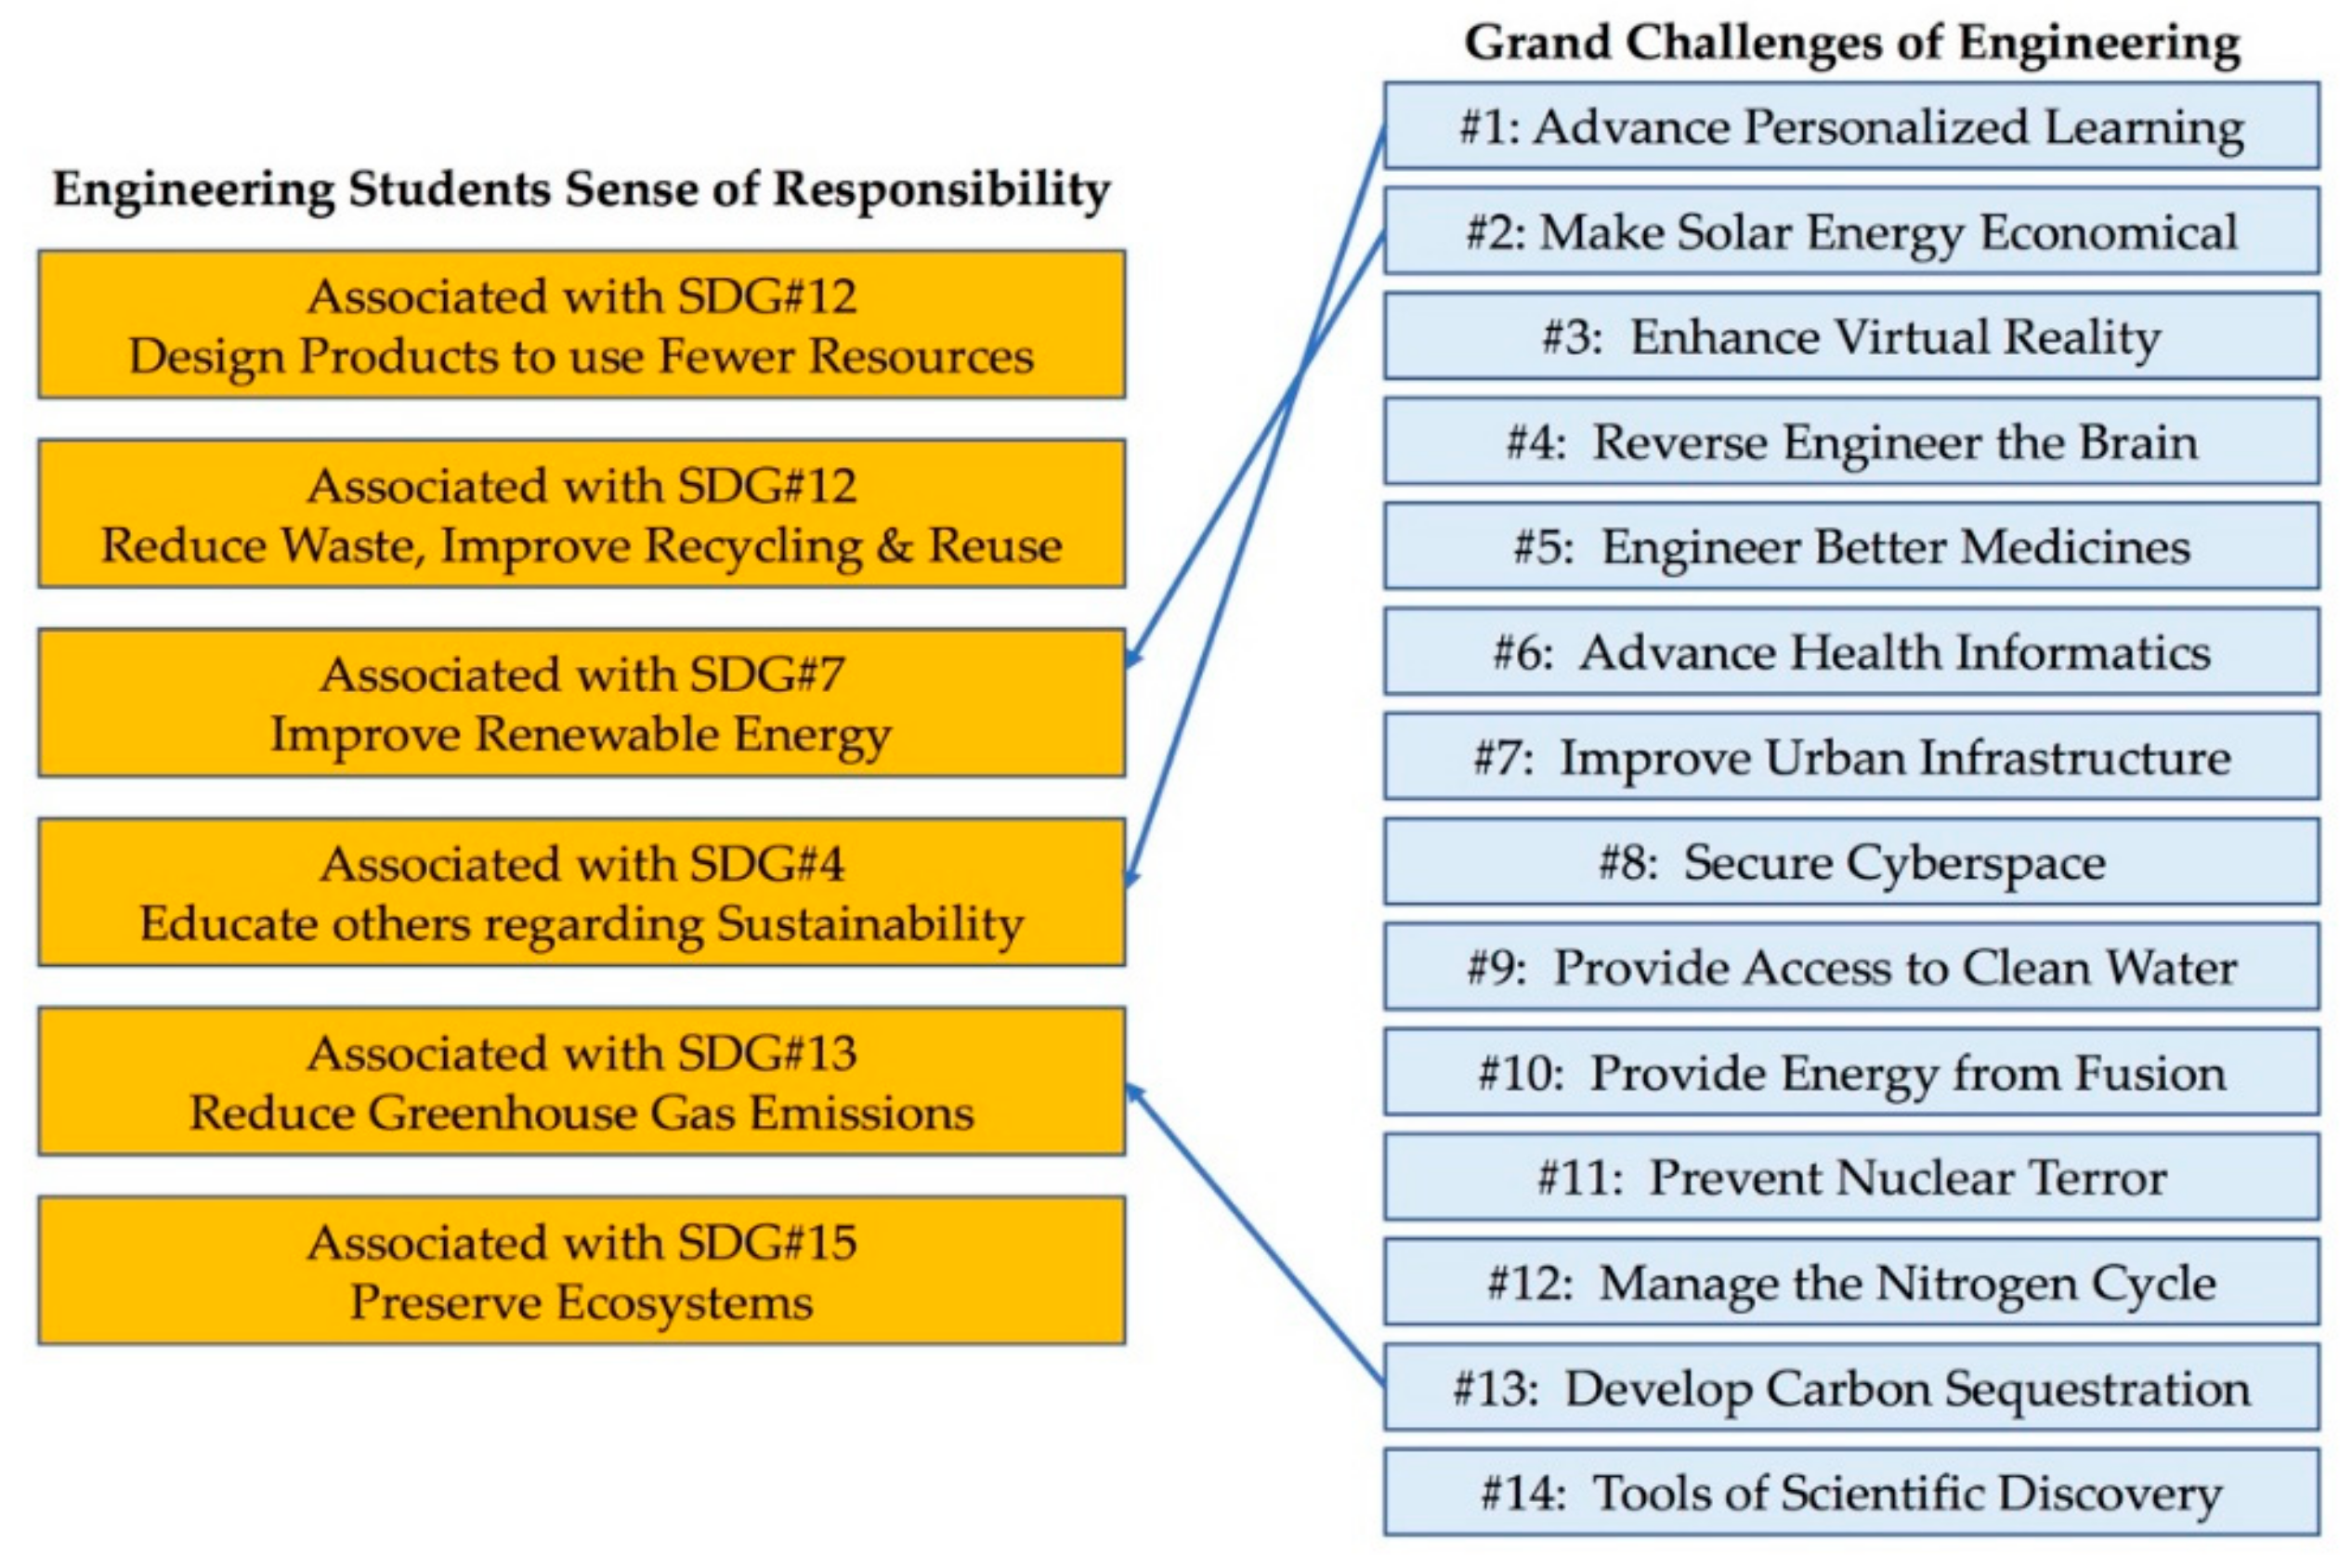
Many students (20%) responded in terms that were too generalized to code and many expressed thoughts (21%) that did not align with modern conceptions of sustainability. Of those that provided specific responses in line with such modern conceptions, the largest number (32%) envisioned their primary contribution to sustainability to be in line with SDG #12 (responsible consumption and production) followed by 19% who aligned with SDG #7 (affordable and clean energy). Eight students (3.5%) believed that contributing to educating others in sustainability (which is part of SDG #4) was an important part of their contribution as professional engineers. Two students expressed an interest in contributing to each of SDGs #9 (industry, innovation, and infrastructure), #13 (climate action), and #15 (life on land), and only a single student deemed #3 (good health and wellbeing) or #6 (clean water and sanitation) to be within their realm of influence as career engineers. Nine of the 17 SDGs were not noted by at least one student and 93% of students mentioned only one (primary) SDG in their responses.
Given the number of students who provided a response that could not be coded according to the 17 SDGs, our study turned to more close-ended, Likert-scale questions to understand differences between disciplines. These questions addressed
personal responsibility for five of the specific challenges in sustainability that came up most frequently in our qualitative analysis in RQ1 (
Table 5): Sustainable energy (under SDG #7), climate change (under SDG #13), education (under SDG #4), resource scarcity (under SDG #12), and waste management (under SDG #12). Results of the quantitative analyses of these
personal responsibility questions are described next.
3.2. Differences among Disciplines
Individual, Likert-scale questions asked students to express how strongly they agreed or disagreed with having
personal responsibility for five critical issues in sustainability: Increasing sustainable energy, improving access to education, mitigating climate change, reducing proliferation of waste electronics, and addressing resource scarcity. For frequency analyses, responses from the five-point Likert scale were combined into three categories: Strongly disagree or disagree; strongly agree or agree; and neither/neutral. Results are summarized in
Table 6.
Potential differences among types of majors were evaluated using chi-squared independence tests. Significant differences among the students in the four types of majors emerged in the level of personal responsibility students expressed for mitigating climate change, supporting sustainable energy, and reducing waste electronics. The strongest of these results (Cramer’s V = 0.227) occurred with personal responsibility regarding the mitigation of climate change. A strong majority of students in environmental sciences (92%) strongly agreed or agreed that they held a future personal responsibility in this area while none of these students denied such responsibility. In contrast, education students were split between feeling responsible for mitigating climate change (31%) or not (28%), with many acknowledging strong feelings in neither direction (41%). Nearly half of engineering students (46%) expressed responsibility for climate change, despite the fact that most of the engineering students surveyed were mechanical or electrical engineers and had no coursework explicitly focused on climate change in their majors.
Significant differences among disciplines also emerged with regard to personal responsibility for contributing to the sustainability of energy. The strength of these differences was appreciable (Cramer’s V = 0.197) although not as strong as differences among students with regard to climate change. Similar to the climate change results, a strong majority of students in environmental science (82%) felt responsible for sustainable energy but a majority of engineering students (65%) did as well. In contrast, a minority of business (46%) and education (36%) students expressed such responsibility.
Similar results emerged with respect to personal responsibility for the proliferation of waste electronics although the effect size was small (Cramer’s V = 0.101). A majority of both environmental (55%) and engineering (58%) students felt responsible for decreasing the proliferation of waste electronics in their careers while a minority of business (42%) and education (36%) students expressed such responsibility.
Among the remaining two issues examined (resource scarcity and access to education), no significant differences across majors emerged. With regard to access to education, between 40% and 50% of students in each of the four disciplines acknowledged professional responsibility for improving such access. A majority of environmental science (55%) and engineering students (58%) felt responsible for addressing resource scarcity, while a minority of business (42%) and education (38%) students acknowledged such responsibility. The differences in these results, however, were not statistically significant.
Overall, on these five critical issues of sustainability, more students in STEM fields expressed a strong sense of personal responsibility than students in non-STEM fields. Linkages between such personal responsibility and other personal and professional dimensions of responsibility for sustainable development were examined in the next set of analyses (associated with RQ3).
3.3. Professional Responsibility, Personal Knowledge, and Personal Responsibility
In order to understand whether professional responsibility and personal knowledge are associated with personal responsibility, the five items measuring students’ sense of personal responsibility in RQ2 were combined into a single scale. The resulting scale had good reliability (Cronbach’s reliability of 0.87) and was used as the dependent variable in subsequent ANOVAs and regression models to understand potential linkages of interest. Scales measuring professional responsibility and personal knowledge as well as type of major were used as independent variables in these models.
Descriptive statistics for the three scales are summarized in
Table 7. A one-way analysis of variance (ANOVA) showed significant differences in the means across disciplines for
professional responsibility and
personal responsibility but not for
personal knowledge. Subsequent pairwise comparisons with Bonferroni correction to control for type 1 error showed that scores for students in environmental science were significantly higher than business, education, and engineering majors for
professional responsibility and significantly higher for students in business for
personal responsibility. No other pairwise comparisons emerged as significant.
A hierarchical linear regression model was then constructed to evaluated how type of major,
professional responsibility, and
personal knowledge predicted
personal responsibility. Type of major was effect coded into three different independent variables (business, education, environment) as described in
Table 4 and inserted into the first level of the regression model (Model 1). The second level of the model included
personal knowledge and
professional responsibility scales as independent variables. The results of the model are summarized in
Table 8.
In the first model (Model 1), students reporting a major associated with business significantly and negatively predicted personal responsibility while students in environmental studies majors were positively associated with personal responsibility. The strength of this model, however, was weak (r2 = 0.028). When professional responsibility and personal knowledge were added the model (Model 2), type of major was no longer significant, suggesting that the contribution of type of major was based primarily on differences in personal knowledge or professional responsibility across types of major. Interactions between type of major and the other two independent variables were also investigated in a third level of the regression model. But, no interactions were found to be significant and these results are not reported.


