Article

Application of Time-Lapse Ion Exchange Resin Sachets (TIERS) for Detecting Illegal Effluent Discharge in Mixed Industrial and Agricultural Areas, Taiwan

1
Center for General Education, Chung Yuan Christian University, Taoyuan 32023, Taiwan
2
Department of Civil and Disaster Prevention Engineering, National United University, Miaoli 36063, Taiwan
3
Graduate Institute of Innovation and Technology, National Pingtung University of Science and Technology, Pingtung County 91201, Taiwan
4
Department of Bioenvironmental Systems Engineering, National Taiwan University, Taipei 10617, Taiwan
*
Author to whom correspondence should be addressed.
Sustainability 2019, 11(11), 3129; https://doi.org/10.3390/su11113129
Submission received: 17 March 2019 / Revised: 24 May 2019 / Accepted: 27 May 2019 / Published: 3 June 2019
(This article belongs to the Special Issue Sustainable Management of Heavy Metals)

Abstract

:
Many factories were built and scattered around the farmlands in Taiwan due to inappropriate land use planning. Illegal effluent discharge of high concentration of metals from the nearby factories has been threatening the farmlands, causing damages to agricultural production, food safety, and human health. Sampling was mostly responsible for monitoring the water quality of the agricultural environment; however, the analysis is of high cost and time consuming. Due to uneasy controlled environmental factors (i.e., illegal effluents) and time-consuming and expensive traditional analysis techniques (i.e., atomic absorption spectrometry (AAS), atomic fluorescence spectrometry (AFS), inductively coupled plasma atomic emission spectrometry (ICP-AES), inductively coupled plasma optical emission spectrometry (ICP-OES), and inductively coupled plasma mass spectrometry (ICP-MS)), we develop a fast-screening method, which is the combination of ion exchange resins and the portable X-ray fluorescence (XRF) spectroscopy to identify the source of contaminants in a mixed industrial and agricultural area in Taoyuan County, Taiwan. The time-lapse ion exchange resin sachet (TIERS) is a non-woven bag that is filled with resins and placed in the irrigation channels for continuously absorbing the metal and trace elements in water. The standardization ratios of Cu/Sr and Zn/Sr were calculated as the pollutant indicators for fast-screening the highly polluted sites of exceedance probability of 2.27% in the monitoring area. The TIERS is verified to detect the metal and trace element concentration in an efficient and sufficient way.

1. Introduction

Many studies have confirmed that human factors and rapid urbanization can majorly affect soil pollution [1,2]. As the population densities and freshwater resources are unevenly distributed, farmers attempt to use wastewater from different human activities (i.e., industrial, commercial, and domestic activities) for crop irrigation [3]. Wastewater usage for crop irrigation has certain advantages, such as saving freshwater and fertilizers, providing essential macronutrients (N, P, and K), increasing crop yield, and reducing water contamination and crop production cost [4,5,6,7]. However, there are some drawbacks of using wastewater, including soil hardening and heavy metal contamination in soil, shallow groundwater, and crops [4,8,9,10,11,12,13,14]. The most concern is that the accumulation of these elements in soils by the repeated addition of sludge, wastes, animal manures, and fertilizer products. Metals in water that are absorbed by soils and crops in the irrigation area can be transported via sewage irrigation and further influence the food chain [15,16,17,18]. Heavy metals are hazardous to the environment and human health, as the metals can accumulate in organisms or human bodies via the food chain [19]. The heavy metal contaminated soil poses human health risks via food crop consumption, and the continuous accumulation of heavy metals in human bodies can cause disorders in the physic-biochemical processes [20,21,22]. During past decades, heavy metal pollutions have been gradually emerging [23,24] and the irrigation sources greatly affected the heavy metal distribution in soil [15]. The long-term sewage irrigation would increase the organic matter in soil and result in high pollutant contamination in top soil layer (0–30 cm) and deeper soil layer (40–70 cm) [17]. Moreover, when the capacity of the soil to retain metals is reduced, metals with relative higher mobility can migrate in deeper soil and further contaminate groundwater by percolation [25].
Many studies have been done to evaluate the metal contamination in water that receives untreated domestic wastewater and industrial effluents [6,26,27,28], and also to characterize the metals in soils, groundwater, plants, and yields, as affected by long-term irrigation with industrial wastewater in Pakistan [28,29], Italy [30], India [6,31], Tunisia [26], Turkey [32], Egypt [33], China [15,16,17], and Zimbabwe [20]. The environmental forensic science refers to the combination of geochemistry, environmental transport and diffusion models, and various analytical methods (i.e., chemical fingerprint analysis technique, satellite and aerial photography, statistical methods, numerical models, etc.) to investigate the relationship between the characteristics and sources of pollution, and to further identify who should be responsible for the pollution. Many techniques have been used to detect metal, including atomic absorption spectrometry (AAS), atomic fluorescence spectrometry (AFS), inductively coupled plasma atomic emission spectrometry (ICP-AES), inductively coupled plasma optical emission spectrometry (ICP-OES), and inductively coupled plasma mass spectrometry (ICP-MS) [34]. They have some advantages (i.e., high sensitivity and high selectivity), while their disadvantages are expensive instrumentation and biomolecule reagents, complex sample pretreatment, long detection times, and being incapable of in situ detection [35,36,37].
X-ray fluorescence (XRF) spectrometry is a well-established analytical technique, and it has been applied for qualitative and quantitative analysis of a wide range of substances. The XRF spectrometry provides the elemental composition of the substances in forms of material or solution by showing the emitted fluorescence signal. It is known for rapid speed and the ease of use. Many studies have been done to determine the soil pollutant concentrations by using XRF techniques [35,38,39,40]. Moreover, the ion exchange method has been widely used for water purification and wastewater treatment, especially in the recycling process of Chromium(III), Copper(II) sulfate, and Nickel(II) sulfate from the electroplating effluents [41,42,43]. As the ion exchanger has ionogenic groups to which counter ions can be bound, the ions of same electric charge are exchanged when the liquid is contacted with the ion exchanger as the ion exchange reaction. While taking away positive or negative charge, the resins release equivalent charge into liquid phase without changing the resin structure. There are two general types of ion exchange resins: cation exchange resins and anion exchange resins. Common cations include Na1+, Ca2+, Mg2+, Fe2+, and H1+, while common anions include Cl1−, SO42−, and OH1-. Exchange capacity is the amount of impurity that resin is capable of removing. As the cation resin is denser than the anion resin, the cation resin has larger exchange capacity (2.0–2.5 eq/L) than the anion resin (1.2–1.3 eq/L) [43]. The ion-exchange membranes were also used for monitoring the nutrient release from flooded soils [44]. The resins have good exchange characteristics for metal ions, and high ion exchange capacity and efficiency, and fast reaction rate, being developed as adsorbents of low cost and high efficiency [45,46,47,48].
Due to inappropriate land use planning in Taiwan, the enterprise effluent discharge system and the agricultural irrigation water system were usually not completely separated. Contaminants from illegal effluent discharges were often detected in irrigation water and then transported into farmlands through rivers. Those illegal effluent discharges are hardly identified the discharging sources, as they are characterized by short lag-time, wide range of dispersion, irregular and inconstant discharge, and high concentration of pollutants. Thus, there is an imminent need to develop an effective and quick method to detect any illegal effluent discharges. In this study, we first exanimate the adsorption rates of ion exchange resin to different metals and trace elements (Cu, Zn, Ca), and to further establish the resin detection modules in the XRF. The time-lapse ion-exchange resin sachet (TIERS) is designed as a non-woven bag that is filled with the resin, and placed in the irrigation ditches for validating the feasibility of this fast-screening method. The analytical results of TIERS reflect the accumulated amount of metals and trace elements as the time-lapse sachet records all effluents passing through the resins during the monitoring period. The field monitoring TIERS results would be useful for screening the potential contamination sections from a vast area and in further identifying the hotspots to trace back the illegal effluents.

2. Materials and Methods

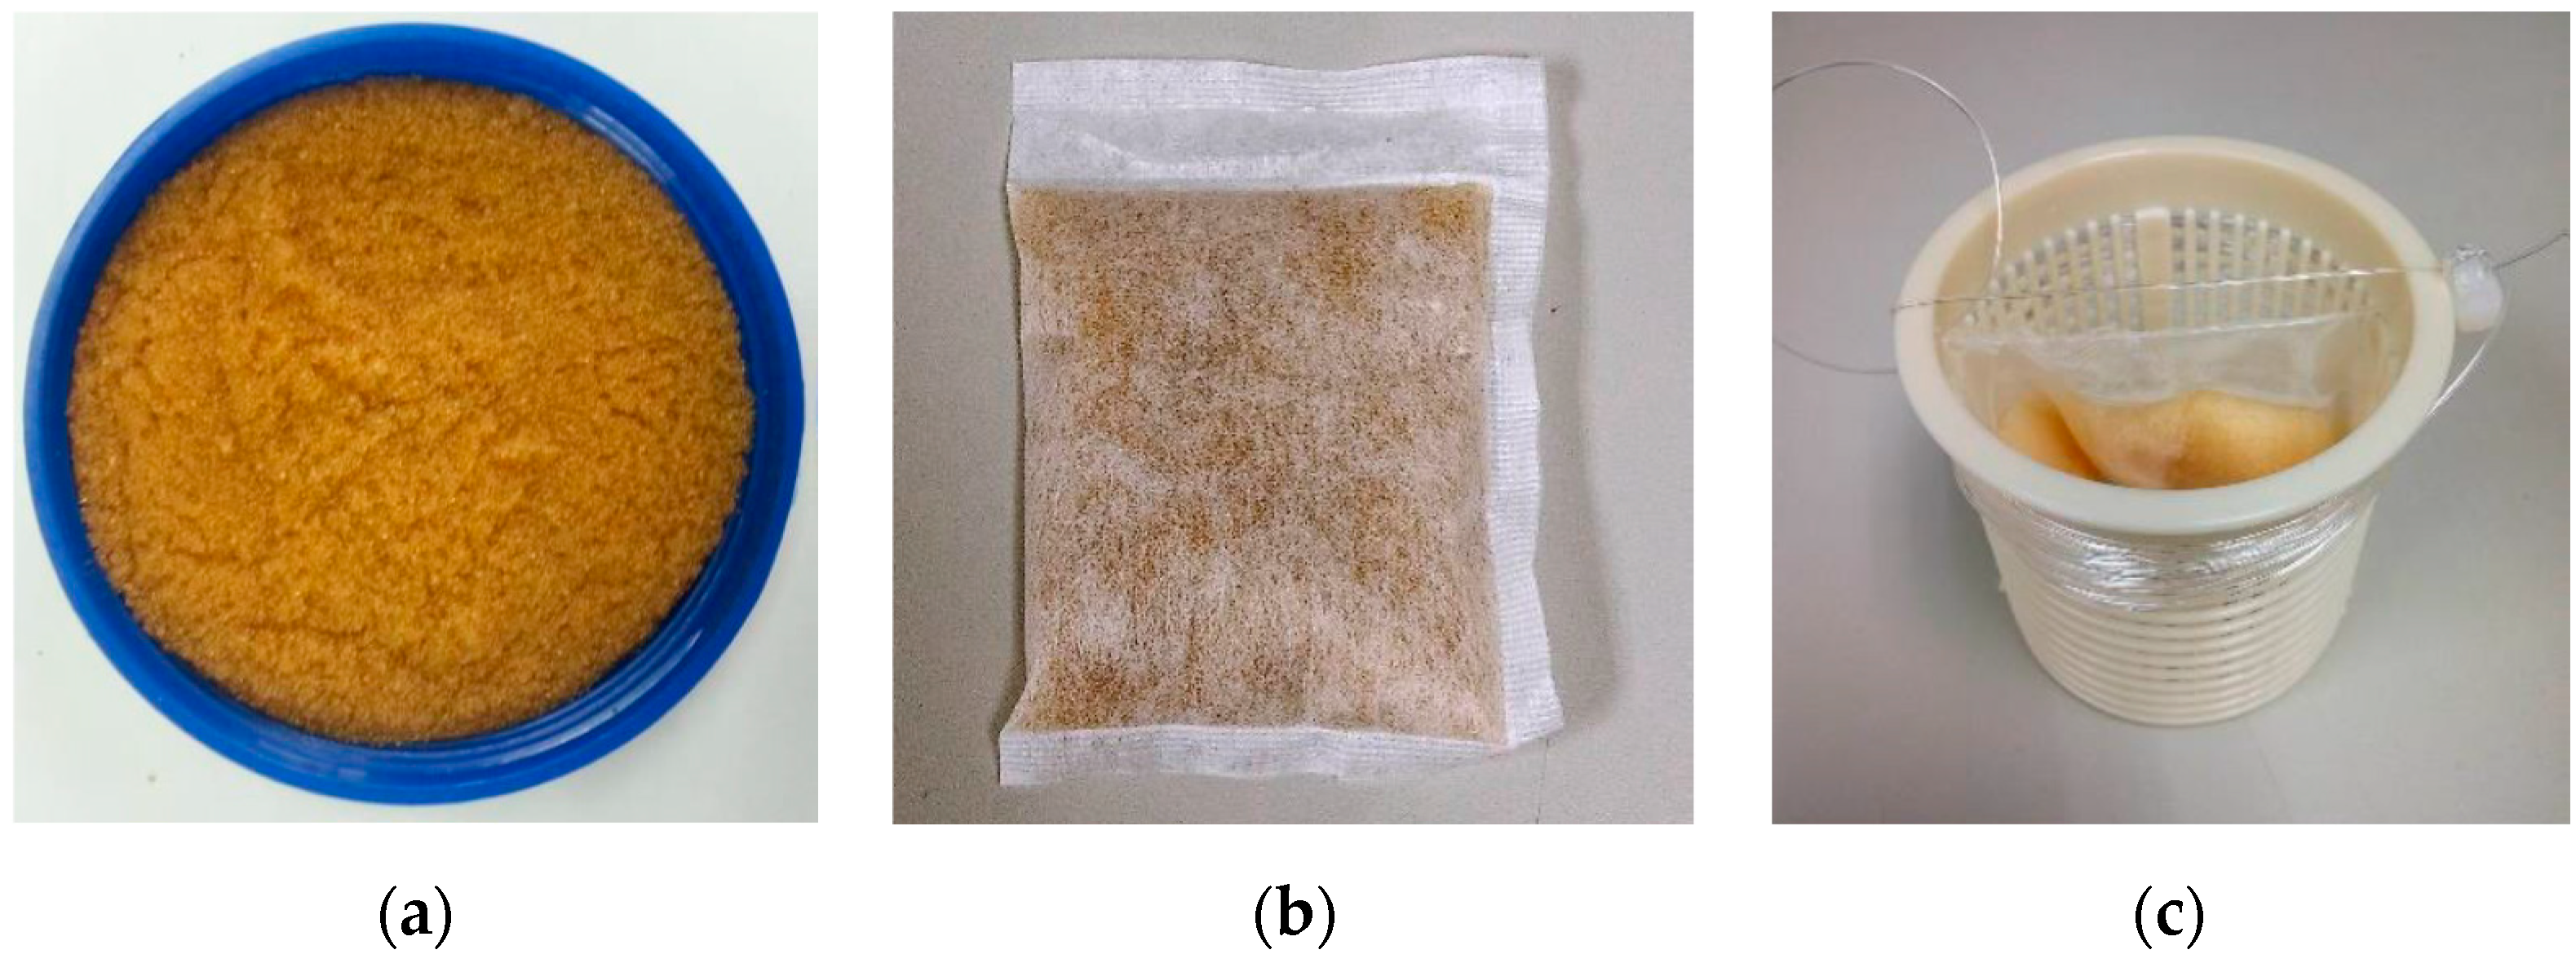
2.1. Design of Time-Lapse Ion Exchange Resin Sachet (TIERS)

An ion exchange is the reversible exchange of ions between a liquid and a solid substance (called a resin). In this study, a sodium-type cation exchange resin is chosen due to its high affinity for metals and trace elements. The cation exchange resin (Purolite C100), as produced from Purolite (website: https://www.purolite.com/), is a gel-type strong acid cation exchange resin that is primarily used in coflow regenerated industrial softening or when regenerated with mineral acids in cation stage of demineralization plants used in industrial water treatment. Table 1 shows the physical characteristics of the resin.
The time-lapse ion exchange resin sachet (TIERS) was designed to detect the in-situ unusual pollutant discharge in a continuous, time-, and cost-efficient way. A TIERS is a package of non-woven fabric that is filled with 20 g of resins (Figure 1a). The non-woven fabric is used as the covering material, as it has good permeability for cation exchange without containing any elements that would affect the experiment results (Figure 1b), and the plastic shell (Figure 1c) is used to prevent the resin sachet that is punctured by sharp objects in rapid streamflows. The resin sachets are placed in the field for continuous seven days as time-lapse sachets to accumulate the amount of metal and trace elements in the flows at the specific site/location during the monitoring period. It should be noted that the concentration of metal and trace elements that are detected by the XRF indicates the amount of metal and trace elements in the resin. It does not fully depict the concentration of metal and trace elements in water at any point of time, or cannot present the average water concentration during the monitoring period. After the monitoring period, the TIERS is taken back to the laboratory for XRF detection. The plastic shell will be reused for the next field sampling until it cannot be reused. The used resins and the un-reused plastic shell will be disposed as plastic recycled trash.

2.2. X-ray Fluorescence (XRF) Spectrometry

X-ray fluorescence (XRF) spectrometry is a non-destructive detection method that is commonly used for detecting the concentration of various trace elements contained in the environmental soil [49]. In this study, we used a portable XRF (model: Olympus DELTA Professional DPO-6500), which has already-built soil detection modules to detect the concentrations of 26 metal and trace elements in soils, including Hg, Pb, Cr, As, Zn, Cu, Ni, Cd, P, S, Cl, K, Ca, Ti, Mn, Fe, Co, Se, Rb, Sr, Zr, Mo, Ag, Sn, Sb, and Ba. Furthermore, we developed the resin detection modules in the portable XRF for detecting the metal and trace elements that are adsorbed in resins.
Before developing the resin detection modules, the relationship between adsorption by resins and XRF detection values needs to be constructed. Thus, the Itrax XRF core scanner (XRF-CS) was used for laboratory analysis. The Itrax XRF-CS, which is a unique multi-function scanner for core examination, is commonly used for geological research, and it can detect the element profiles of sediment core. Raychaudhuri et al. [50] used the Itrax XRF-CS to analyze the exposure time of resins in laboratory and field survey. Their results showed that resin samples can be measured in approximately 20 s and identified pollution hot spots in a rapid way. However, the Itrax XRF-CS is a large desktop instrument and the analyzing cost is too high to handle a huge number of samples. Therefore, we used the laboratory experiment results and blank resins as the resin reference standards to establish a specific resin detection module in a portable (XRF) spectrometry, which can be handy for in-situ experiment and detecting the resin samples in short time (180 s). As the XRF itself has a limit of detection (LOD), which is the minimum concentration of the substance contained in the sample to be detected, the LOD is calculated by detecting the slope of the standard curve of the blank resin sample. Therefore, the concentration less the LOD cannot be quantified.

2.3. Preparation for Resin Detection Modules in XRF

The Jar-test of resin adsorption was conducted in the laboratory. The purpose of analyzing the adsorption concentrations in the resins was to develop the resin detection module in the portable XRF. We first examined those two metals and Ca for their resin adsorption rate, since Zn and Cu are generally regarded as target heavy metals in Taiwan. Calcium is commonly seen in natural water. Geological conditions influence the Ca concentration, and it is positively correlated with the flow discharge. Thus, Ca was also examined. First, we prepared standard water samples of different concentrations of metal and trace elements according to the effluent standards of Taiwan EPA. Both of Taiwan EPA standards for Zn and Cu are lower than the standard limits of irrigation water by the US and WHO, which are 2.0 mg/L and 0.2 mg/L for Zn and Cu, respectively [51,52]. Four levels of Zn, Cu, and Ca concentrations in one liter of water were prepared (Table 2). The Jar-Tester was used to stir the water that was mixed with 20 g of resins at four levels of stirring speeds (V1: 50 rpm, V2: 100 rpm, V3: 150 rpm, V4: 200 rpm) for different time intervals (1, 2, 3, 5, 10, 20, 30, 60, 120 min). After jar-testing at different time intervals, the water samples and resins were analyzed by inductively coupled plasma optical emission spectrometry (ICP-OES, Model: Thermo Scientific iCAP 7000 series) for the metal and trace element concentration left in water, and by the Itrax XRF-CS for the detection counts, respectively.
According to the law of conservation of mass, the amount of metal and trace elements that the resin can absorb can be calculated by the concentration of metal and trace elements in the water. The resin detection modules in the portable XRF were established based on the relationship between the amount of metal and trace elements absorbed in the resins and the detected values (XRF-CS counts) by Itrax XRF-CS. The resin adsorption rate in water is calculated, as shown in Equation (1), and the amount of absorbed metal and trace elements in the resins is calculated, as shown in Equation (2).
R = C i C f C i × 100 %
where R is adsorption rate (%); Ci and Cf are initial concentration in water (mg/L) and final concentration in water (mg/L) at the time interval of concern, respectively.
C R = ( C i C f ) × V w   × 1000   W R
where CR is the concentration of metal and trace element in the resin (mg/kg); Vw is the water solution volume (1 L); and, WR is the resin weight (20 g); 1000 is the conversion coefficient (1000 g/kg).

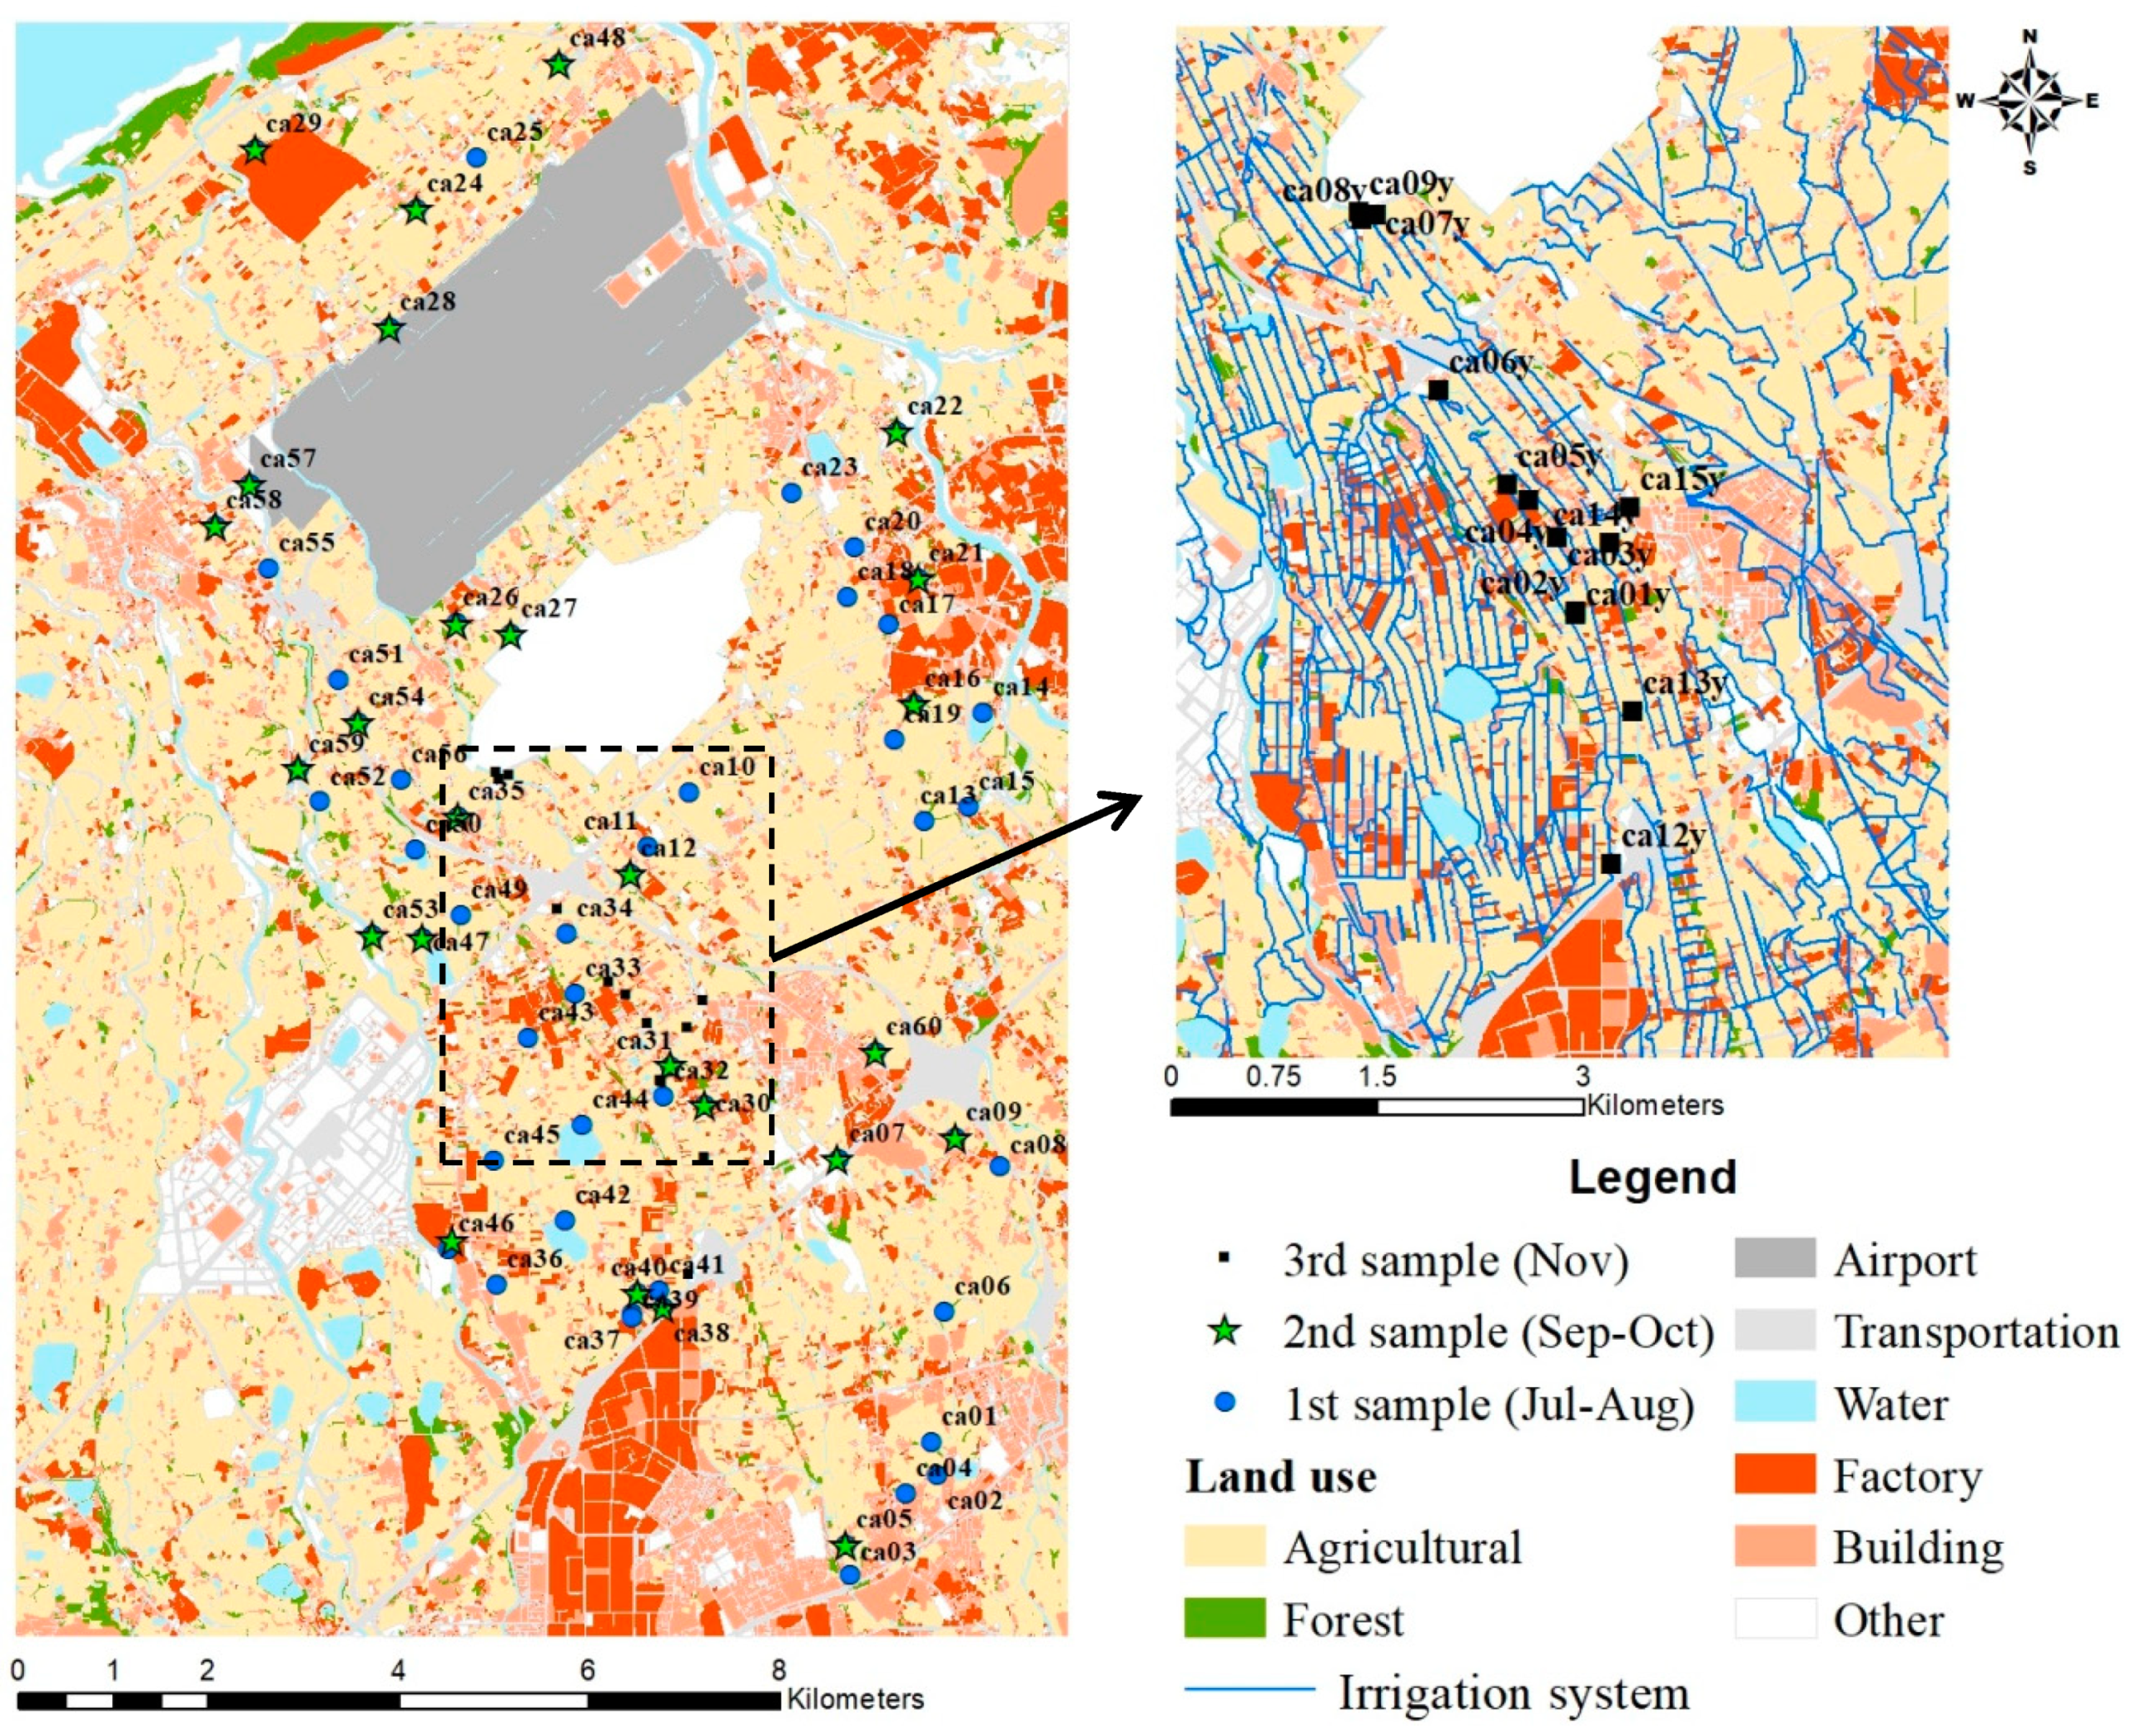
2.4. Field Application

We placed the resin sachets in selected irrigation channels of the Dayuan and Dachu regions in Taoyuan County, where it has been exanimated for high proportion of metal contaminated agricultural lands, in order to test the performance of the resin sachets in the environment. Three sampling batches were conducted in 2016 during July–August, September–October, and November, respectively. The sampling period of each batch lasts for 21 days. At the beginning of the sampling period, the resin sachets were placed at selected sites in the irrigation channels (Figure 2). For each site, three resin sachets were placed at the upstream, middle and downstream of the site for seven days. After seven days, the old resin sachets were taken back to the laboratory and the new resin sachets were placed at the same locations for another seven days. This recycling procedure was repeated for three times in a sampling batch.
A total of 60, 26, and 14 sites were selected for the first, second, and third sampling batch. Thus, three recycling procedures of the first batch for 60 sites (ca01–ca60) were conducted during 28–29 July, 4–5 August, and 11–12 August, respectively. The 26 sites for the second sampling batch include one new site (ca61) and 25 old sites screened from the first sampling batch. Three recycling procedures of the second sampling batch were conducted on 30 September, 7 October, and 14 October, respectively. 14 new sites (ca01y–ca09y, and ca11y–ca15y) were selected for the third sampling batch due to suspicious discharge from the factories, and the recycling procedures were conducted on 4, 11, and 18 November, respectively. During the third batch, nine sites (ca01y–ca09y) were selected for the first two recycling procedures, and five sites (ca11y–ca15y) were selected for the last recycling procedure Table 3 shows the number of recycled resin sachets and the recycling rates. It should be noted that the resin sachets were usually closely bound to the discharge pipe and could be sometimes flushed away or cut by the factory staffs to avoid being detected. During 21 days of sampling batch, the overall recycling rate for each batch was 78.15%, 82.48%, and 81.16%, respectively.
The resin sample that is taken back from the field must be washed with distilled water, and dried at room temperature. After being dried-out, the resins were taken out from the non-woven bag and placed in the container of XRF for analysis. The detection time for one resin sample only takes 180 s. A total of 26 metal and trace elements were detected, and only Cu, Zn, Ca, and Sr were used for further analysis of concern in this study. Sr was discussed in the field analysis, as it is naturally stable in environment. Moreover, the ratio of Sr to Ca is often discussed in marine elements, coral skeletons, and fish gill for the isotope dating and the impact of climate change [53,54,55]. Thus, the ratio of Sr to Ca was calculated to ensure the stability in the monitoring sites and further determine the reference element for eliminating the flow effect on metal accumulation in resin.

3. Results and Discussion

3.1. Development of Resin Detection Modules in XRF

The resins are usually used to remove undesirable ions from a liquid and substitute acceptable cations or anions from the resins until equilibrium is reached. The mass action law with the selectivity coefficient (K) of resins describes this equilibrium. The resins tend to exchange ions with ions with high electric charge, ions with smaller hydration volume, ions with greater polarity, ions with active exchanger, and ions that do not easily form compounds with other ions. As the exchange efficiency of the resins is usually affected by pH, temperature, initial metal concentration, and attaching time [56,57], many studies have conducted the ion exchange equilibrium tests of heavy metal with varying metal ion concentration, pH, agitation time, resin weight, and reaction temperature [58,59]. They analyzed the ion-exchange equilibria by the various isotherm models (i.e., Langmuir, Freundlich, Redlich–Peterson, selectivity coefficient approaches), and regressed the ion-exchange kinetic data by different kinetic models (i.e., pseudo first-order, second-order, reversible reaction model).
The Jar-Tester with different stirring speeds was examined to evaluate the resin adsorption rates. Figure 3, Figure 4 and Figure 5 show the experimental results of the resin adsorption rates for Zn, Cu, and Ca. It shows different reactions of the ion exchange resins for element types and water concentrations, in terms of the adsorption efficiency. The adsorption rate increased by time, indicating that resins can record the decreasing trends of metal and trace elements in water as long as water can freely pass through the resins. Except for the highest concentration (C4), at the stirring speeds of V2, V3, and V4 the adsorption rates could reach above 80% after 120 min., and especially the adsorption rate could reach above 80% after 60 min. at the highest stirring speed (V4). It was because the cation exchange resin was not saturated and its adsorption efficiency did not affect by the competence among different metals and trace elements. It was noted that except for high Ca concentration (C4) at the highest stirring speed (V4), the adsorption rates for the highest concentrations (C4) after 120 min. of jar-test were mostly below 60% at any stirring speed. This result is in agreement with the study [59] that adsorption decreased with increase in metal concentration. Moreover, the adsorption rates were relatively low for any concentrations, ranging between 20–40% after 120 min. at the slowest stirring speed (V1). Both of the observations indicate that the resins need more time (at least more than 120 min) to absorb metal and trace elements in water when the water concentration is high and the environmental flow is slow.
The amount of metal and trace elements absorbed in the resins was calculated as the initial water concentration minus the final water concentration at the time of concern, and then converted into the unit of amount of metal and trace elements in one kg of resins. The relationships between the adsorption by resins and Itrax XRF-CS detection value (count per second, cps) can be found in Figure S1. The coefficient of determination for Zn, Cu, and Ca was greater than 0.98, which indicated that the excellent linear relationships were reliable for developing the resin detection modules in the portable XRF. The resins in the hydrogen form H+ and sodium form Na+ are strongly acidic resins. Resins in the hydrogen form can remove all cations from solution, while resins in the sodium form cannot remove other monovalent cations (i.e., K+, NH4+). The resin adsorption capacity increases with increase in pH of the aqueous solution [59]. Usually, the solubility and stability of metals of interest in a wide pH range could be identified by using potential-pH (also known as Eh-pH or Pourbaix) diagrams, which are constructed under the assumption that the system is in equilibrium with water and it can also describe the effects of complexes, temperature, and pressures [60,61].

3.2. Field Monitoring Results

Environmental forensic identifies the sources and transmissions of pollutants via water, air, soil, and organism, and the effects of pollutants on human health and the environment. Environmental forensic applications include the identification of the source of oil products [62,63], anthropogenic and geogenic methane [64], total petroleum hydrocarbons (TPH) and polycyclic aromatic hydrocarbons (PAH) [65], and nitrate for protecting drinking water [66]. Moreover, Arefin et al. [67] identified the source of lead (Pb) by comparing the Pb concentration to other elements (i.e., Sb and Sn), and showed that more than 80% of lead in the residential areas came from the battery plants. Studies have shown that the desorption processes could influence the fate of trace elements in natural environment [68,69], and the emission source and aging time in the soil could influence the reactive fraction of metals [70]. Thus, the ratio between natural suspended particulate matter (SPM) and solution, the aging effect of the complex, and the combination of sorption and desorption times should be considered when studying the sorption and desorption kinetics of the trace elements [71,72,73]. In this study, the TIERS technique was applied to quantify the accumulated metal concentration in the resin sachet during the monitoring period. It should be noted that the adsorbed metal could be from many sources, including the factory effluent, substrate sludge, flushed contaminated soil from upland, and labile solid-phase metal. At this stage, the resin sachet is used to detect the illegal effluent discharge and further analysis on the sources of metal could be done in the future work.
During three sampling batches (July–August, September–October, November 2016), a total of 422, 193, and 56 resin samples were collected with the recycling rates of 78.15%, 82.48%, and 81.16%, respectively (Table 3). The resin samples were pretreated and analyzed for the metal and trace element concentrations by XRF. Table 4 and Figure S2 show the ranges of different metal and trace elements (Zn, Cu, Ca, and Sr) concentrations during nine sampling periods (three recycling procedures for each batch) from July to November 2016. For most of the monitoring periods, the median concentrations of Zn and Cu were lower than the mean concentrations, which indicated that more than 50% of the resin samples have lower concentrations than the mean concentrations and few samples have extremely high concentrations. For example, the median (and mean) concentrations of Zn were 4.2–10.3 mg/kg (mean: 6.25–13.75 mg/kg), 13–13.8 mg/kg (mean: 14–16.98 mg/kg), and 3.6–12.3 mg/kg (mean: 4.67–28.98 mg/kg) for the first, second, and third sampling batches, respectively. The median (and mean) concentrations of Cu were 2.7–3.7 mg/kg (mean: 4.32–6.79 mg/kg), 5–5.8 mg/kg (mean: 7.24–10 mg/kg), and 10.35–30.1 mg/kg (mean: 52.98–123.8 mg/kg) for the first, second, and third sampling batches, respectively.
Table 4 describes the descriptive statistics for Zn, Cu, Ca, and Sr of resin samples for each sampling batch and entire sampling period. Generally, Ca and Sr could be detected for all samples, while 26 and 200 samples were detected that their Zn and Cu concentrations were smaller than the LOD (limit of detection) in XRF, respectively. As mentioned above, the resin sampling sites for the second batch were decided from the analysis results of the first batch. Thus, the mean and median of the Zn and Cu concentrations in the second batch were expected to be higher than those in the first batch. Moreover, it was found that the variations of Zn and Cu concentrations (standard deviation: 21.33 mg/kg and 170.85 mg/kg, respectively) in the third sampling batch were the greatest when compared to the first and second batches (Table 4). It was mainly because the resin sampling sites for the third batch were chosen for the purpose of detecting effluent discharge from the suspected factories. An extremely high Cu concentration of 823.00 mg/kg was noted, which indicated an abnormal discharge contained with extremely high Cu concentration happened during the monitoring period. In this study, the observed metal sorption in resins showed the relative pollution levels among these sampling sites. The metal fluxes and kinetic processes could be measured by using the technique of diffusive gradients in thin films (DGT), as the amount of metal in soil solution could be influenced by the kinetics of metal in sandy and silty soils with lower pH, as suggested by Zhang et al. [74].

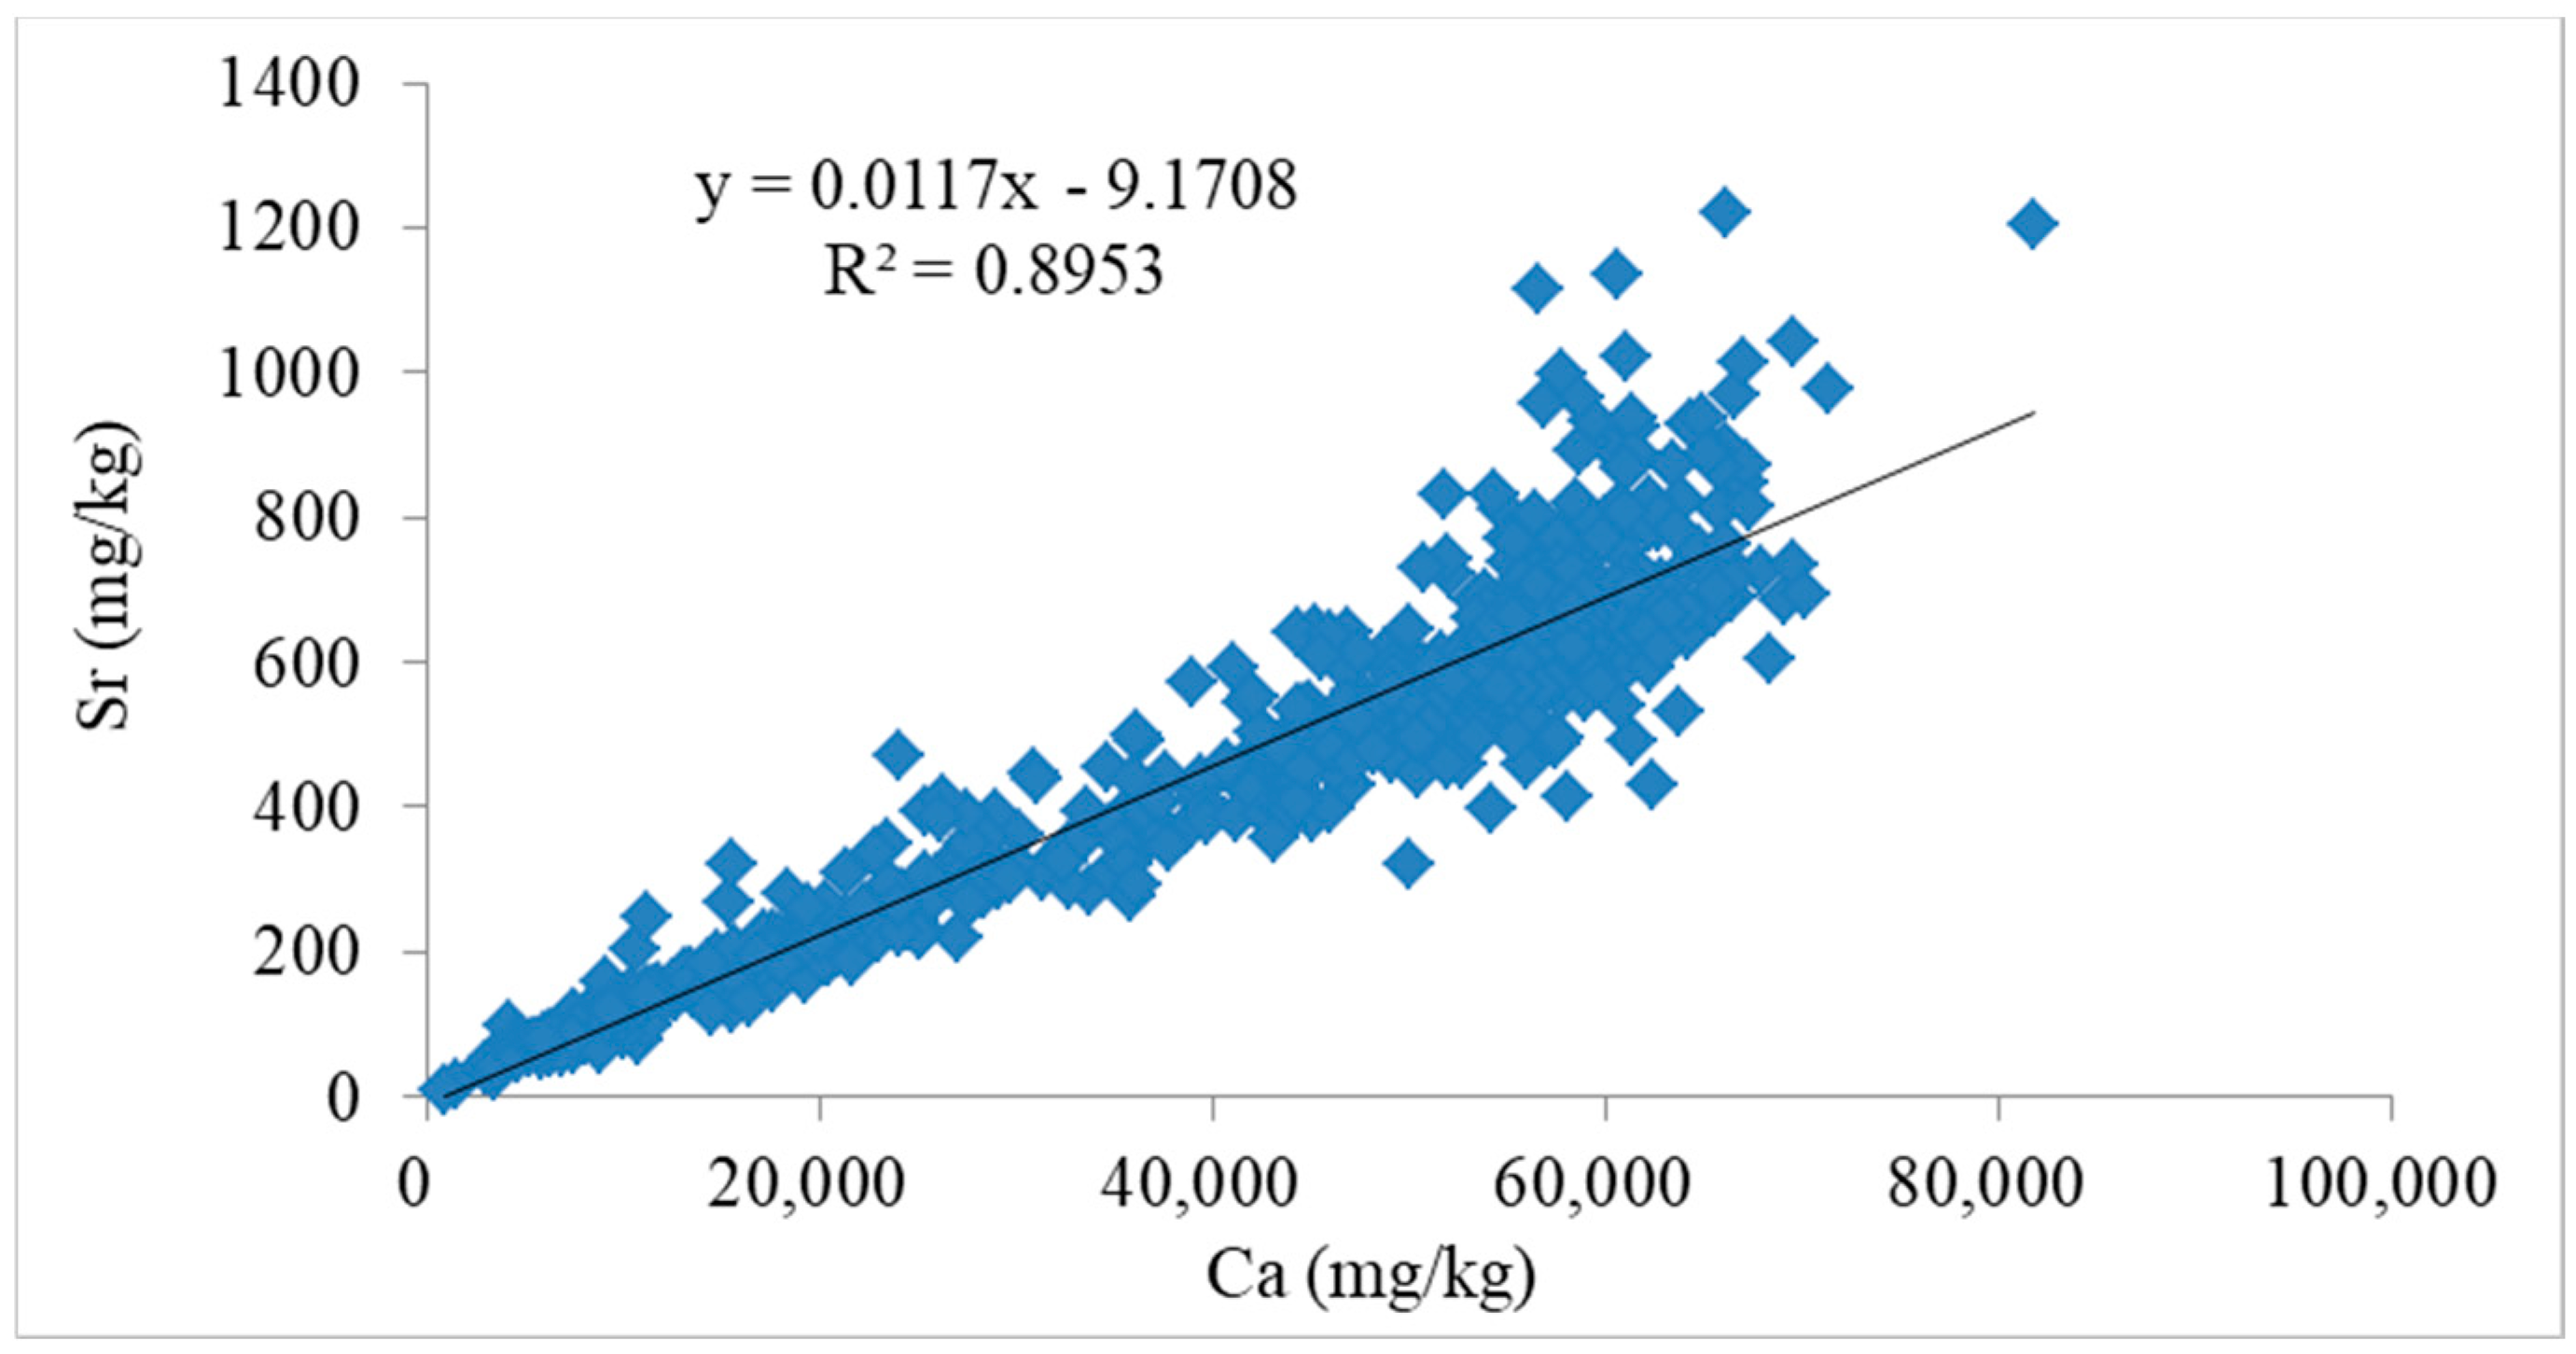
3.3. Standardization of Zn and Cu by Sr

When considering the influence of water effluent, resins could adsorb more ions, as more water flows through the resin sachet. Thus, the ranges of Ca and Sr concentrations could reflect the characteristics of the effluents during the monitoring period at different sampling areas. In Table 4, the mean Ca concentration ranges were 36,475.74–46,944.43 mg/kg, 36,806.91–38,991.11 mg/kg, and 27,839.67–41,038.67 mg/kg for the first, second, and third sampling batches, respectively. The mean Sr concentration ranges were 430.29–555.97 mg/kg, 361.85–423.34 mg/kg, and 325.23–431.67 mg/kg for the first, second, and third sampling batches, respectively. Moreover, the ratio of Sr to Ca for each sampling batch was quite stable, with an average ratio of 0.0115 (Table 5). Thus, a very good positive relationship between Ca and Sr (R2 = 0.8953) was found for the entire monitoring period, with the mean Ca and Sr concentrations of 39,078.16 mg/kg and 446.73 mg/kg, respectively (Figure 6 and Table 4).
Both Ca and Sr could be used as a reference because of their stable amount in the environment. However, Ca is usually of high magnitude of concentration, while Sr has a relative similar magnitude of concentration with the metals of concern in the environment. We calculated the standardization ratios of the target metals to Sr (e.g., Zn/Sr or Cu/Sr) as the pollution indicators, in order to eliminate the effect of effluent on the accumulated metals (Zn and Cu) in the resins. Table 6 shows the descriptive statistics of Zn/Sr and Cu/Sr for each sampling batch. The suggested threshold to identify the highly polluted sites of exceedance probability of 2.27% in a specific sampling batch and monitoring period was calculated as the mean value plus two times of the standard deviation. It should be noted that the thresholds for different metals may change depending on the selected sampling sites, the number of resin samples, characteristics of the monitoring area, and monitoring period and length, etc. Thus, the thresholds for Zn/Sr varied between 0.1161 and 0.2107, while an extremely high threshold for Cu/Sr was applied for the third sampling batch, as the sampling area was known for suspicious factories.
By standardizing the metal concentrations, the effect of water flow can be ignored. A total of 14, 11, and 4 resin samples were identified as highly polluted sites, based on the suggested thresholds for different sampling batches (Table 7, Table 8 and Table 9). For the first batch, four sites (ca09u, ca15u, ca21m, ca53u) exceeded both thresholds; especially the site (ca21m) values were 5.5 times of the thresholds. Moreover, three sites (ca07, ca21, ca46) found frequently exceeded the thresholds of Zn/Sr and Cu/Sr, indicating frequent effluent being discharged to the sites during the monitoring period. For the second batch, two sites (ca26 and ca60) exceeded both of the thresholds. Three sites (ca21, ca26, ca60) were frequently found to exceed the thresholds. For both first and second batches, high values of Zn/Sr and Cu/Sr were found at four sites (ca21, ca26, ca46, ca53), indicating that further investigation on the nearby activities is needed to identify the source of pollutants. The variations of Zn/Sr and Cu/Sr values of the same sites of different sampling locations or during the different monitoring period indicate diffident contamination level of each element throughout the monitoring region and unpredictable effluent discharged from nearby factories. Therefore, more sampling batches are needed to provide evidence of frequently effluent discharge from some specific factories.
For the third batch, three sites (ca05y, ca07y, ca12y) were found that their Zn/Sr and Cu/Sr values exceeded the thresholds. These sites were located at factory channel outlets, from which a large amount of wastewater discharge containing a high Cu concentration is highly possible. When compared to the first two batches, the Cu/Sr values of the two sites (ca05, ca12) during the third batch were extremely high. Such abnormal Cu concentrations confirmed that the nearby electronic factory was the pollutant source. In previous study in Taiwan, untreated wastewater with high concentration of metals were found to be illegally discharged from a semiconductor factory in Kaohsiung and an electroplate factory in Changhua, respectively [75]. These unscrupulous factories illegally discharge untreated wastewater via concealed piping during heavy rainfall events or nights. The effluent discharge of high concentrations of heavy metals from the industry has been threatening some farm lands, food safety, and human health.
Anthropogenic sources generally have higher reactive fraction than geogenic metal forms [70]. Different land use types [76] and spatial variations in land use pattern [77,78] have been reported to influence heavy metal contamination in soils. Kriging interpolation and spatial regression models are broadly applied to analyze the relationship between metal concentrations and possible influencing factors, as the soil heavy metal concentrations are related to their neighbors and potential sources rather than being independent of each other [78,79,80,81]. However, the evidence of location accuracy from potential sources is still insufficient [78]. Therefore, we were able to accurately identify the location of direct discharge sources and the amount of discharged metal concentrations to reflect the metal pollution in water under the impacts of effluent discharge from the factories.

4. Conclusions

The time-lapse ion-exchange resin sachet (TIERS) and portable XRF were used for fast-screening the hot spots of suspected pollutant areas where illegal effluent discharges are irregular and inconstant with a wide range of dispersion in order to effectively and quickly detect the illegal effluent discharges. The examined ion exchange resin (Purolite C100) has rapid and powerful cation exchange capacity. Except for high concentration (C4), the adsorption rates were found to increase by time and to reach above 80% after 120 min. However, the adsorption rates were low (20–40%) even after 120 min. at the slowest stirring speed (V1). Both of the observations indicate that the resins need more time to absorb contaminants in water for the conditions of high water concentration and slow environmental flow. Therefore, duration of monitoring period and amount of water flow at the monitoring site should be considered for field implementation.
The time-lapse ion-exchange resin sachet (TIERS) was designed as a non-woven bag that was filled with the resin, and was placed in the irrigation ditches for validating the feasibility of this fast-screening method. The analytical results of TIERS can reflect the accumulated amount of metals and trace elements, as the time-lapse sachet records all of the effluents passing through the resins during the monitoring period. Both Ca and Sr are relatively stable trace elements in natural water, and they can reflect the amount of water passing through the resin sachet. Due to the similar magnitude of Sr concentration with target metals, Sr standardized the target metals (Zn and Cu) in order to eliminate the effect of effluent on the accumulated metal in the resins. Those standardization ratios were used as pollution indicators for fast-screening the highly polluted sites of exceedance probability of 2.27% in a specific sampling batch. This TIERS technique could quickly and effectively detect the hot spots from a vast area, and it would be useful for providing scientific evidence of factories that discharge illegal intermittent metal effluent during night time or holidays. The advantages of using the TIERS technique and portable XRF are low cost and high efficiency, and it is suitable for a wide investigation field. It is suggested that different resin types and metal detection techniques could be examined to improve the analytical accuracy of metal concentration and the metal adsorption rate in resin, and further identify the sources of metal.

Supplementary Materials

The following are available online at https://www.mdpi.com/2071-1050/11/11/3129/s1.

Author Contributions

Conceptualization, Funding acquisition and Supervision, T.-K.C.; Methodology and Sampling, S.-C.L. and W.-C.H.; Validation, L.-C.C.; Data curation, Formal analysis and Visualization, P.-K.S. and L.-C.C.; Writing-Original Draft Preparation, L.-C.C.; Writing-Review & Editing, L.-C.C.

Funding

This research was funded by the Council of Agriculture, Executive Yuan, Taiwan, R.O.C. (grant number 106AS-15.2.2-IE-b1).

Acknowledgments

We thank the funding provided by the Council of Agriculture, Executive Yuan, Taiwan, R.O.C.

Conflicts of Interest

The authors declare no conflict of interest. The funders had no role in the design of the study; in the collection, analyses, or interpretation of data; in the writing of the manuscript, and in the decision to publish the results.

References

  1. Trujillo-González, J.M.; Torres-Mora, M.A.; Keesstra, S.; Brevik, E.C.; Jiménez-Ballesta, R. Heavy metal accumulation related to population density in road dust samples taken from urban sites under different land uses. Sci. Total Environ. 2016, 553, 636–642. [Google Scholar] [CrossRef] [PubMed]
  2. Zuo, S.; Dai, S.; Li, Y.; Tang, J.; Ren, Y. Analysis of heavy metal sources in the soil of riverbanks across an urbanization gradient. Int. J. Environ. Res. Public Health 2018, 15, 2175. [Google Scholar] [CrossRef] [PubMed]
  3. Khalid, S.; Shahid, M.; Natasha; Bibi, I.; Sarwar, T.; Shah, A.H.; Niazi, N.K. A review of environmental contamination and health risk assessment of wastewater use for crop irrigation with a focus on low and high-income countries. Int. J. Environ. Res. Public Health 2018, 15, 895. [Google Scholar] [CrossRef] [PubMed]
  4. Murtaza, G.; Ghafoor, A.; Qadir, M.; Owens, G.; Aziz, M.; Zia, M.; Ullah, S. Disposal and use of sewage on agricultural lands in Pakistan: A review. Pedosphere 2010, 20, 23–34. [Google Scholar] [CrossRef]
  5. Scott, C.A.; Drechsel, P.; Raschid-Sally, L.; Bahri, A.; Mara, D.; Redwood, M.; Jiménez, B. Wastewater irrigation and health: Challenges and outlook for mitigating risks in low-income countries. In Wastewater Irrigation and Health: Assessing and Mitigating Risk in Low-Income Countries; Earthscan: London, UK, 2010; pp. 381–394. [Google Scholar]
  6. Raychaudhuri, S.; Raychaudhuri, M.; Rautaray, S.K.; Parida, S.; Kumar, A. Urban wastewater – A potential irrigation source for summer paddy (Oryza sativa L.) in India. Int. J. Agric. Innov. Res. 2017, 5, 986–995. [Google Scholar]
  7. Zhang, Y.; Shen, Y. Wastewater irrigation: Past, present, and future. Wiley Interdiscip. Rev. Water 2019, 6, e1234. [Google Scholar] [CrossRef]
  8. Rattan, R.; Datta, S.; Chhonkar, P.; Suribabu, K.; Singh, A. Long-term impact of irrigation with sewage effluents on heavy metal content in soils, crops and groundwater—A case study. Agric. Ecosyst. Environ. 2005, 109, 310–322. [Google Scholar] [CrossRef]
  9. Khan, S.; Cao, Q.; Zheng, Y.; Huang, Y.; Zhu, Y. Health risks of heavy metals in contaminated soils and food crops irrigated with wastewater in Beijing, China. Environ. Pollut. 2008, 152, 686–692. [Google Scholar] [CrossRef] [PubMed]
  10. Qadir, M.; Wichelns, D.; Raschid-Sally, L.; McCornick, P.G.; Drechsel, P.; Bahri, A.; Minhas, P. The challenges of wastewater irrigation in developing countries. Agric. Water Manag. 2010, 97, 561–568. [Google Scholar] [CrossRef] [Green Version]
  11. Singh, A.; Sharma, R.K.; Agrawal, M.; Marshall, F.M. Health risk assessment of heavy metals via dietary intake of foodstuffs from the wastewater irrigated site of a dry tropical area of India. Food Chem. Toxicol. 2010, 48, 611–619. [Google Scholar] [CrossRef]
  12. Muamar, A.; Zouahri, A.; Tijane, M.; El Housni, A.; Mennane, Z.; Yachou, H.; Bouksaim, M. Evaluation of heavy metals pollution in groundwater, soil and some vegetables irrigated with wastewater in the Skhirat region Morocco. J. Mater. Environ. Sci. 2014, 5, 961–966. [Google Scholar]
  13. Khalid, S.; Shahid, M.; Dumat, C.; Niazi, N.K.; Bibi, I.; Gul Bakhat, H.F.S.; Abbas, G.; Murtaza, B.; Javeed, H.M.R. Influence of groundwater and wastewater irrigation on lead accumulation in soil and vegetables: Implications for health risk assessment and phytoremediation. Int. J. Phytoremediation 2017, 19, 1037–1046. [Google Scholar] [CrossRef] [PubMed]
  14. Li, Q.; Tang, J.; Wang, T.; Wu, D.; Busso, C.A.; Jiao, R.; Ren, X. Impacts of sewage irrigation on soil properties of farmland in China: A review. Solid Earth Discuss. 2017. [Google Scholar] [CrossRef]
  15. Liu, W.H.; Zhao, J.Z.; Ouyang, Z.Y.; Soderlund, L.G.; Liu, H. Impact of sewage irrigation on heavy metal distribution and contamination in Beijing, China. Environ. Int. 2005, 31, 805–812. [Google Scholar] [CrossRef]
  16. Liang, J.; Chen, C.; Song, X.; Han, Y.; Liang, Z. Assessment of heavy metal pollution in soil and plants form Dunhua sewage irrigation area. Int. J. Electrochem. Sci. 2011, 6, 5314–5324. [Google Scholar]
  17. Bao, Z.; Wu, W.; Liu, H.; Chen, H.; Yin, S. Impact of long-term irrigation with sewage on heavy metals in soils, crops, and groundwater—A case study in Beijing. Pol. J. Environ. Stud. 2014, 23, 309–318. [Google Scholar]
  18. Camargo, M.A.F.; Pereira, T.A.R. Evaluation of concentration of heavy metals in water used in agriculture irrigation. Open Access Libr. J. 2018, 5, e4959. [Google Scholar]
  19. Ravera, O.; Cenci, R.; Beone, G.M.; Dantas, M.; Lodigiani, P. Trace element concentrations in freshwater mussels and macrophytes as related to those in their environment. J. Limnol. 2003, 62, 61–70. [Google Scholar] [CrossRef]
  20. Mapanda, F.; Mangwayana, E.; Nyamangara, J.; Giller, K. The effect of long-term irrigation using wastewater on heavy metal contents of soils under vegetables in Harare, Zimbabwe. Agric. Ecosyst. Environ. 2005, 107, 151–165. [Google Scholar] [CrossRef]
  21. Mahmood, A.; Malik, R.N. Human health risk assessment of heavy metals via consumption of contaminated vegetables collected from different irrigation sources in Lahore, Pakistan. Arab. J. Chem. 2014, 7, 91–99. [Google Scholar] [CrossRef]
  22. Xiong, T.; Dumat, C.; Pierart, A.; Shahid, M.; Kang, Y.; Li, N.; Bertoni, G.; Laplanche, C. Measurement of metal bioaccessibility in vegetables to improve human exposure assessments: Field study of soil-plant-atmosphere transfers in urban areas, South China. Environ. Geochem. Health 2016, 38, 1283–1301. [Google Scholar] [CrossRef]
  23. Guo, Y.; Yang, S. Heavy metal enrichments in the Changjiang (Yangtze river) catchment and on the inner shelf of the east China sea over the last 150 years. Sci. Total Environ. 2016, 543, 105–115. [Google Scholar] [CrossRef]
  24. Hu, B.; Zhao, R.; Chen, S.; Zhou, Y.; Jin, B.; Li, Y.; Shi, Z. Heavy metal pollution delineation based on uncertainty in a coastal industrial city in the Yangtze river delta, China. Int. J. Environ. Res. Public Health 2018, 15, 710. [Google Scholar] [CrossRef] [PubMed]
  25. Vaseghi, S.; Afyuni, M.; Shariatmadari, H.; Mobli, M. Effect of sewage sludge on some nutrients concentration and soil chemical properties. J. Isfahan Water Wastewater 2005, 53, 15–19. [Google Scholar]
  26. Khaskhoussy, K.; Kahlaoui, B.; Nefzi, B.M.; Jozdan, O.; Dakheel, A.; Hachicha, M. Effect of treated wastewater irrigation on heavy metals distribution in a tunisian soil. Eng. Technol. Appl. Sci. Res. 2015, 5, 805–810. [Google Scholar]
  27. Arefin, M.T.; Rahman, M.M.; Wahid-U-Zzaman, M.; Kim, J.-E. Heavy metal contamination in surface water used for irrigation: Functional assessment of the Turag river in Bangladesh. J. Appl. Biol. Chem. 2016, 59, 83–90. [Google Scholar] [CrossRef]
  28. Haroon, B.; Ping, A.; Pervez, A.; Faridullah; Irshad, M. Characterization of heavy metal in soils as affected by long-term irrigation with industrial wastewater. J. Water Reuse Desalin. 2018, 9, 47–56. [Google Scholar] [CrossRef] [Green Version]
  29. Khan, A.; Javid, S.; Muhmood, A.; Mjeed, T.; Niaz, A.; Majeed, A. Heavy metal status of soil and vegetables grown on peri-urban area of Lahore district. Soil Environ. 2013, 32, 49–54. [Google Scholar]
  30. Gatta, G.; Gagliardi, A.; Disciglio, G.; Lonigro, A.; Francavilla, M.; Tarantino, E.; Giuliani, M.M. Irrigation with treated municipal wastewater on artichoke crop: Assessment of soil and yield heavy metal content and human risk. Water 2018, 10, 255. [Google Scholar] [CrossRef]
  31. Suruchi; Khanna, P. Assessment of heavy metal contamination in different vegetables grown in and around urban areas. Res. J. Environ. Toxicol. 2011, 5, 162–179. [Google Scholar] [CrossRef]
  32. Özkay, F.; Kiran, S.; Taş, I.; Kuşvuran, S. Effects of Copper, Zinc, Lead and Cadmium Applied with Irrigation Water on Some Eggplant Plant Growth Parameters and Soil Properties. Turk. J. Agric. Nayrural Sci. 2014, 1, 377–383. [Google Scholar]
  33. Nassr, M.M.I.; Moursi, E.A.; Kassab, M.M. Effect of irrigation water quality on some soil properties, productivity of some wheat cultivars and their contents of heavy metals. J. Soil Sci. Agric. Eng. Mansoura Univ. 2014, 5, 1317–1333. [Google Scholar]
  34. Qin, S.; Zhao, C. Study on heavy metal element detection of china tea based on ICP-MS method. ARPN J. Eng. Appl. Sci. 2017, 12, 1516–1520. [Google Scholar]
  35. Hutton, L.A.; O’Neil, G.D.; Read, T.L.; Ayres, Z.J.; Newton, M.E.; Macpherson, J.V. Electrochemical X-ray fluorescence spectroscopy for trace heavy metal analysis: Enhancing X-ray fluorescence detection capabilities by four orders of magnitude. Anal. Chem. 2014, 86, 4566–4572. [Google Scholar] [CrossRef] [PubMed]
  36. Liu, Y.; Deng, Y.; Dong, H.; Liu, K.; He, N. Progress on sensors based on nanomaterials for rapid detection of heavy metal ions. Sci. China Chem. 2017, 60, 329–337. [Google Scholar] [CrossRef]
  37. Lu, Y.; Liang, X.; Niyungeko, C.; Zhou, J.; Xu, J.; Tian, G. A review of the identification and detection of heavy metal ions in the environment by voltammetry. Talanta 2018, 178, 324–338. [Google Scholar] [CrossRef] [PubMed]
  38. Ritschel, A.; Wobrauschek, P.; Chinea, E.; Grass, F.; Fabjan, C. An electrochemical enrichment procedure for the determination of heavy metals by total-reflection X-ray fluorescence spectroscopy. Spectrochim. Acta Part B 1999, 54, 1449–1454. [Google Scholar] [CrossRef]
  39. Radu, T.; Diamond, D. Comparison of soil pollution concentrations determined using AAS and portable XRF techniques. J. Hazard. Mater. 2009, 171, 1168–1171. [Google Scholar] [CrossRef]
  40. Kim, S.M.; Choi, Y.; Charlesworth, S. Assessing statistically significant heavy metal concentrations in abandoned mine areas via hot spot analysis of portable XRF data. Int. J. Environ. Res. Public Health 2017, 14, 654. [Google Scholar] [CrossRef]
  41. Juang, R.S.; Wang, Y.C. Ligand-enhanced separation of divalent heavy metals from aqueous solutions using a strong-acid ion-exchange resin. Ind. Eng. Chem. Res. 2003, 42, 1948–1954. [Google Scholar] [CrossRef]
  42. Kang, S.Y.; Lee, J.U.; Moon, S.H.; Kim, K.W. Competitive adsorption characteristic of Co2+, Ni2+ and Cr3+ by IRN77 cation exchange resin in synthesized wastewater. Chemosphere 2004, 56, 141–147. [Google Scholar] [CrossRef] [PubMed]
  43. Eom, T.H.; Lee, C.H.; Kim, J.H.; Lee, C.H. Development of an ion exchange system for plating wastewater treatment. Desalination 2005, 180, 163–172. [Google Scholar] [CrossRef]
  44. Bremer, E.; Miller, J.; Curtis, T.; Miller, J. Placement of ion-exchange membranes for monitoring nutrient release from flooded soils. Can. J. Soil Sci. 2018, 98, 709–715. [Google Scholar] [CrossRef]
  45. Demirbaş, A. Adsorption of Cr(III) and Cr(VI) ions from aqueous solutions on to modified lignin. Energy Sources 2005, 27, 1449–1455. [Google Scholar] [CrossRef]
  46. Donia, A.M.; Atia, A.A.; El-Boraey, H.; Mabrouk, A.D.H. Uptake studies of copper(II) on glycidyl methacrylate chelating resin containing Fe2O3 particles. Sep. Purif. Technol. 2006, 49, 64–70. [Google Scholar] [CrossRef]
  47. Ansari, R.; Fahim, N.K. Application of polypyrrole coated on wood sawdust for removal of Cr(VI) ion from aqueous solutions. React. Funct. Polym. 2007, 67, 367–374. [Google Scholar] [CrossRef]
  48. Kammerer, J.; Carle, R.; Kammerer, D.R. Adsorption and ion exchange: Basic principles and their application in food processing. J. Agric. Food Chem. 2011, 59, 22–42. [Google Scholar] [CrossRef] [PubMed]
  49. Shefsky, S. Comparing field portable X-Ray Fluorescence (XRF) to laboratory analysis of heavy metal in soil. Presented at the International Symposium of Field Screening Methods for Hazardous Wastes and Toxic Chemicals, Las Vegas, NV, USA, 29–31 January 1997. [Google Scholar]
  50. Huang, J.-J.S.; Lin, S.-C.; Löwemark, L.; Liou, S.Y.H.; Chang, Q.; Chang, T.-K.; Wei, K.-Y.; Croudace, I.W. Rapid assessment of heavy metal pollution using ion-exchange resin sachets and micro-XRF core-scanning. Sci. Rep. 2019, 9, 6601. [Google Scholar] [CrossRef]
  51. WHO. Joint FAO/WHO Expert Standards Program Codex Alimentation Commission; WHO: Geneva, Switzerland, 2007; Available online: http://www.who.int (accessed on 1 February 2019).
  52. Radojevic, M.; Bashkin, V.N. Practical Environmental Analysis, 2nd ed.; Royal Society of Chemistry (RSC) Publishing: Cambridge, UK, 2010. [Google Scholar]
  53. Brown, R.J.; Severin, K.P. Otolith chemistry analyses indicate that water Sr:Ca is the primary factor influencing otolith Sr:Ca for freshwater and diadromous fish but not for marine fish. Can. J. Fish. Aquat. Sci. 2009, 66, 1790–1808. [Google Scholar] [CrossRef] [Green Version]
  54. Coggon, R.M.; Teagle, D.A.H.; Smith-Duque, C.E.; Alt, J.C.; Cooper, M.J.; Hsieh, M.-H.; Brun, T.; Devetak, I. Reconstructing past seawater Mg/Ca and Sr/Ca from Mid-Ocean Ridge Flank Calcium Carbonate Veins. Science 2010, 327, 1114–1117. [Google Scholar] [CrossRef]
  55. DeLong, K.L.; Quinn, T.M.; Taylor, F.W.; Lin, K.; Shen, C.-C. Sea surface temperature variability in the southwest tropical Pacific since AD 1649. Nat. Clim. Chang. 2012, 2, 799–804. [Google Scholar] [CrossRef]
  56. Gode, F.; Pehlivan, E. Removal of chromium (III) from aqueous solutions using Lewatit S 100: The effect of pH, time, metal concentration and temperature. J. Hazard. Mater. 2006, 136, 330–337. [Google Scholar] [CrossRef]
  57. Silva, D.L.; Brunner, G. Desorption of heavy metals from ion exchange resin with water and carbon dioxide. Braz. J. Chem. Eng. 2006, 23, 213–218. [Google Scholar] [CrossRef]
  58. Lee, I.-H.; Kuan, Y.-C.; Chern, J.-M. Equilibrium and kinetics of heavy metal ion exchange. J. Chin. Inst. Chem. Eng. 2007, 38, 71–84. [Google Scholar] [CrossRef]
  59. Chandramohan, K.; Marimuthu, S. Adsorptive removal of Copper from aqueous solution by Amberlite cation-exchange resin-equilibrium and kinetic studies. In Proceedings of the 2011 International Conference on Biology, Environment and Chemistry, Dubai, UAE, 28–30 December 2011; Volume 24, pp. 357–361. [Google Scholar]
  60. Tamilmani, S.; Huang, W.; Raghavan, S.; Smallb, R. Potential-pH diagrams of interest to chemical mechanical planarization of copper. J. Electrochem. Soc. 2002, 149, G638–G642. [Google Scholar] [CrossRef]
  61. Huang, H.-H. The Eh-pH diagram and its advances. Metals 2016, 6, 23. [Google Scholar] [CrossRef]
  62. Philp, R.P.; Allen, J.; Kuder, T. The use of the isotopic composition of individual compounds for correlating spilled oils and refined products in the environment with suspected sources. Environ. Forensics 2002, 3, 341–348. [Google Scholar] [CrossRef]
  63. O’Sullivan, G.; Kalin, R.M. Investigation of the range of carbon and hydrogen isotopes within a global set of gasolines. Environ. Forensics 2008, 9, 166–176. [Google Scholar] [CrossRef]
  64. Lundegard, P.D.; Sweeney, R.E.; Ririe, G.T. Soil gas methane at petroleum contaminated sites: Forensic determination of origin and source. Environ. Forensics 2000, 1, 3–10. [Google Scholar] [CrossRef]
  65. Stout, S.A.; Wasielewski, T.N. Historical and chemical assessment of the sources of PAHs in soils at a former coal-burning power plant, New Haven, Connecticut. Environ. Forensics 2004, 5, 195–211. [Google Scholar] [CrossRef]
  66. Silva, S.R.; Ging, P.B.; Lee, R.W.; Ebbert, C.; Tesoriero, A.J.; Inkpen, E.L. Forensic applications of nitrogen and oxygen isotopes in tracing nitrate sources in urban environments. Environ. Forensics 2002, 3, 125–130. [Google Scholar] [CrossRef]
  67. Machemer, S.D.; Hosick, T.J.; Ingamells, R.L. Source identification of lead contamination in residential and undisturbed soil adjacent to a battery manufacturing facility (Part 1). Environ. Forensics 2007, 8, 77–95. [Google Scholar] [CrossRef]
  68. Hegeman, W.J.M.; van Der Weijden, C.H.; Zwolsman, J.J.G. Sorption of Zinc on suspended particles along a salinity gradient: A laboratory study using illite and suspended matter from the river Rhine. Neth. J. Sea Res. 1992, 28, 285–292. [Google Scholar] [CrossRef]
  69. Millward, G.E.; Liu, Y.P. Modelling metal desorption kinetics in estuaries. Sci. Total Environ. 2003, 314, 613–623. [Google Scholar] [CrossRef]
  70. Owsianiak, M.; Holm, P.E.; Fantke, P.; Christiansen, K.S.; Borggaard, O.K.; Hauschild, M.Z. Assessing comparative terrestrial ecotoxicity of Cd, Co, Cu, Ni, Pb, and Zn: The influence of aging and emission source. Environ. Pollut. 2015, 206, 400–410. [Google Scholar] [CrossRef] [PubMed] [Green Version]
  71. Sanchez, A.L.; Smolders, E.; Van den Brande, K.; Merckx, R.; Wright, S.M.; Naylor, C. Prediction of in situ solid/liquid distribution of radiocaesium in soils. J. Environ. Radioact. 2002, 63, 35–47. [Google Scholar] [CrossRef]
  72. Hatje, V.; Payne, T.E.; Hill, D.M.; McOrist, G.; Birch, G.F.; Scymczak, R. Kinetics of trace element uptake and release by particles in estuarine waters: Effects of pH, salinity, and particle loading. Environ. Int. 2003, 29, 619–629. [Google Scholar] [CrossRef]
  73. Garnier, J.M.; Ciffroy, P.; Benyahya, L. Implications of short and long term (30 days) sorption on the desorption kinetic of trace metals (Cd, Zn, Co, Mn, Fe, Ag, Cs) associated with river suspended matter. Sci. Total Environ. 2006, 366, 350–360. [Google Scholar] [CrossRef] [PubMed]
  74. Zhang, H.; Davison, W.; Tye, A.M.; Crout, N.M.J.; Young, S.D. Kinetics of zinc and cadmium release in freshly contaminated soils. Environ. Toxicol. Chem. 2006, 25, 664–670. [Google Scholar] [CrossRef]
  75. Cheng, B.Y.; Fang, W.T.; Shyu, G.S.; Chang, T.K. Distribution of heavy metals in the sediments of agricultural fields adjacent to urban areas in Central Taiwan. Paddy Water Environ. 2012, 11, 343–351. [Google Scholar] [CrossRef]
  76. Van, T.N.; Ozaki, A.; Tho, H.N.; Duc, A.N.; Thi, Y.T.; Kurosawa, K.; Charlesworth, S. Arsenic and heavy metal contamination in soils under different land use in an estuary in Northern Vietnam. Int. J. Environ. Res. Public Health 2016, 13, 1091. [Google Scholar] [CrossRef]
  77. Wang, X.; Xu, Y. Soil heavy metal dynamics and risk assessment under long-term land use and cultivation conversion. Environ. Sci. Pollut. Res. 2014, 22, 264–274. [Google Scholar] [CrossRef]
  78. Li, W.; Wang, D.; Wang, Q.; Liu, S.; Zhu, Y.; Wu, W.; Charlesworth, S. Impact from land use pattern on spatial distribution of cultivated soil heavy metal pollution in typical rural-urban fringe of Northeast China. Int. J. Environ. Res. Public Health 2017, 14, 336. [Google Scholar] [CrossRef]
  79. Kalavrouziotis, I.K.; Koukoulakis, P.H.; Papadopoulos, A.H. Heavy metal interrelationships in soil in the presence of treated wastewater. Glob. NEST J. 2009, 11, 497–509. [Google Scholar]
  80. Sun, C.; Liu, J.; Wang, Y.; Sun, L.; Yu, H. Multivariate and geostatistical analyses of the spatial distribution and sources of heavy metals in agricultural soil in Dehui, Northeast China. Chemosphere 2013, 92, 517–523. [Google Scholar] [CrossRef]
  81. Ağca, N. Spatial distribution of heavy metal content in soils around an industrial area in Southern Turkey. Arab. J. Geosci. 2015, 8, 1111–1123. [Google Scholar] [CrossRef]
Figure 1. Time-lapse ion exchange resin sachet (TIERS) (a) Resin; (b) Resin sachet; and, (c) Resin sachet in a plastic shell.
Sustainability 11 03129 g001
Figure 2. Placement of resin sachets in Taoyuan.
Sustainability 11 03129 g002
Figure 3. Adsorption rates of zinc in ion exchange resin. Note: V1, V2, V3, and V4 are the stirring speeds of 50 rpm, 100 rpm, 150 rpm, and 200 rpm, respectively; C1, C2, C3, and C4 are zinc concentrations of 0.5 mg/L, 5.0 mg/L, 50 mg/L, and 100 mg/L, respectively.
Sustainability 11 03129 g003
Figure 4. Adsorption rates of copper in ion exchange resin. Note: V1, V2, V3, and V4 are the stirring speeds of 50 rpm, 100 rpm, 150 rpm, and 200 rpm, respectively; C1, C2, C3, and C4 are copper concentrations of 0.3 mg/L, 3.0 mg/L, 30 mg/L, and 60 mg/L, respectively.
Sustainability 11 03129 g004
Figure 5. Adsorption rates of calcium in ion exchange resin. Note: V1, V2, V3, and V4 are the stirring speeds of 50 rpm, 100 rpm, 150 rpm, and 200 rpm, respectively; C1, C2, C3, and C4 are the calcium concentrations of 2 mg/L, 20 mg/L, 100 mg/L, and 200 mg/L, respectively.
Sustainability 11 03129 g005
Figure 6. Relationship between Ca and Sr in resin samples.
Sustainability 11 03129 g006
Table 1. Characteristics of the sodium-type cation exchange resin.
ItemDescription
Product namePurolite C100
ApplicationSoftening, Demineralization
Polymer structureGel polystyrene crosslinked with divinylbenzene
AppearanceSpherical beads
Functional groupSulfonic acid
Ionic formNa+ form
Cation exchange capacity (CEC)2.0 eq/L (Na+ form)
Moisture retention44–48% (Na+ form)
Particle size range300–1200 μm
Particle density1.29 g/cm3
Temperature tolerance120 °C
Table 2. Designed concentration of metal ions in water.
Concentration (mg/L)ZnCuCa
C1Trace0.50.32
C2 1Low5.03.020
C3Medium5030100
C4High10060200
1 Taiwan EPA’s effluent standards, excluding Ca.
Table 3. Number of data used for analysis.
Sampling BatchSample DateNo. of Sample PlacementNo. of Collected SampleRecycle Rate (%)
1st28–29 July18013776.11
4–5 August18014982.78
11–12 August18013675.56
All54042278.15
2nd30 September786178.21
7 October786380.77
14 October786988.46
All23419382.48
3rd4 November272488.89
11 November272385.19
18 November15960.00
All695681.16
Table 4. Descriptive statistics of resin samples.
Metal and Trace ElementSampling Batch 1Mean (mg/kg)Median (mg/kg)Std. Dev. (mg/kg)Relative Std. Dev. (%)Max. (mg/kg)Min. (mg/kg)Number of DataNumber of Data Smaller than LOD 2
Zn1st8.835.6011.58131.11139.001.0042218
2nd15.0213.1010.3568.8953.101.601930
3rd11.725.6521.33182.09145.101.10568
All10.907.6012.53114.92145.101.0067126
Cu1st5.973.2512.02201.30163.001.70422160
2nd8.895.2512.43139.81118.001.7019327
3rd79.2013.40170.85215.71823.001.805613
All13.694.0056.37411.80823.001.70671200
Ca1st40,843.0948,824.0020,611.9350.4781,872.001540.004220
2nd37,304.7643,930.0019,618.5152.5963,731.00962.001930
3rd31,890.0726,984.0019,035.7659.6958,452.004682.00560
All39,078.1645,568.0020,351.5952.0881,872.00962.006710
Sr1st483.85519.50262.9054.331222.0018.404220
2nd391.85430.00220.5556.28808.007.501930
3rd356.11389.50196.5655.20675.0052.40560
All446.73481.00250.9256.171222.007.506710
1 1st, 2nd, 3rd denotes the sample period during July-August, September-October, and November, respectively. All denotes the entire samples collected during July-November, 2016. 2 LOD: The minimum limit that can be detected in the resin module of XRF.
Table 5. Ratio of Sr to Ca in resin samples.
Ratio of Sr/CaSampling BatchMeanMedianStd. Dev.Relative Std. Dev. (%)Max.Min.
Sr/Ca1st0.01190.01150.001916.230.02300.0080
2nd0.01040.01050.001514.500.01420.0064
3rd0.01160.01120.001714.290.01560.0088
All0.01150.01120.001916.690.02300.0064
Table 6. Descriptive statistics of Zn/Sr and Cu/Sr for each sampling batch.
Sampling BatchMeanMedianStd. Dev.Relative Std. Dev. (%)Max.Min.Threshold 1
Zn/Sr1st0.02650.01390.0455171.500.65210.00140.1176
2nd0.06040.03400.0752124.420.53330.00540.2107
3rd0.02990.01830.0431143.810.25230.00380.1161
Cu/Sr1st0.01470.00690.0314213.040.43380.00210.0775
2nd0.02660.01740.0329123.720.29330.00390.0925
3rd0.21760.05600.3848176.801.43130.00510.9871
1 It is calculated as the sum of mean and two times of standard deviation.
Table 7. Sample of 1st batch that exceeds suggested thresholds.
Sample No.Zn (mg/kg)Cu (mg/kg)Ca (mg/kg)Sr (mg/kg)Zn/SrCu/Sr
ca07m 1-1 29.001.803474.0052.100.1727 30.0345
ca07d-315.803.007482.00113.700.13900.0264
ca07m-321.005.504690.0076.900.27310.0715
ca09u-350.5020.4017,285.00222.000.22750.0919
ca15u-37.203.803077.0039.100.18410.0972
ca21m-17.40<LOD4485.0057.400.1289* 4
ca21d-3105.4024.9040,772.00459.000.22960.0542
ca21m-347.8031.805691.0073.300.65210.4338
ca26d-122.802.3018,160.00190.000.12000.0121
ca46d-138.1073.9053,529.00686.000.05550.1077
ca46u-336.5054.2060,608.00684.000.05340.0792
ca47d-2139.00163.0081,872.001204.000.11540.1354
ca53u-314.7014.7011,086.00122.900.11960.1196
ca58d-122.906.4018,998.00192.000.11930.0333
1 u, m, and d denote upstream, middle, and downstream of the sites, respectively. 2 1, 2, and 3 denote the three recycling procedures on 28–29 July, 4–5 August, and 11–12 August, respectively. 3 Shaded value indicates the number exceeds the threshold (Zn/Sr = 0.1176, Cu/Sr = 0.0775). 4 * denotes no value.
Table 8. Sample of 2nd batch that exceeds suggested thresholds.
Sample No.Zn (mg/kg)Cu (mg/kg)Ca (mg/kg)Sr (mg/kg)Zn/SrCu/Sr
ca21u 1-4 246.804.9011,827.00123.700.3783 30.0396
ca21m-623.205.309859.00105.700.21950.0501
ca26u-537.1010.007482.0087.100.42590.1148
ca26m-440.4012.107548.0095.100.42480.1272
ca26u-439.809.609647.00111.100.35820.0864
ca30u-653.10118.0063,594.00781.000.06800.1511
ca46u-648.3055.2057,446.00570.000.08470.0968
ca53u-69.605.706929.0060.900.15760.0936
ca60d-54.002.20962.007.500.53330.2933
ca60m-54.102.803536.0029.300.13990.0956
ca61m-615.2048.3037,820.00346.000.04390.1396
1 u, m, and d denote upstream, middle, and downstream of the sites, respectively. 2 4, 5, and 6 denote the three recycling procedures on 30 September, 7 October, and 14 October, respectively. 3 Shaded value indicates the number exceeds the threshold (Zn/Sr = 0.2107, Cu/Sr = 0.0925).
Table 9. Sample of 3rd batch that exceeds suggested thresholds.
Sample No.Zn (mg/kg)Cu (mg/kg)Ca (mg/kg)Sr (mg/kg)Zn/SrCu/Sr
ca05ym 1-1 23.50567.0026,282.00411.000.00851.3796 3
ca05yu-14.00476.0025,420.00392.000.01021.2143
ca07ym-213.60<LOD6084.0075.800.1794* 4
ca12yu-3145.10823.0053,642.00575.000.25231.4313
1 u, m, and d denote upstream, middle, and downstream of the sites, respectively. 2 1, 2, and 3 denote the three recycling procedures on 4, 11 and 18 November, respectively. 3 Shaded value indicates the number exceeds the threshold (Zn/Sr = 0.1161, Cu/Sr = 0.9871). 4 *denotes no value.

