Carbon Footprint of Wines from the Finger Lakes Region in New York State


Abstract
1. Introduction
2. Materials and Methods
2.1. Goal and Scope Definition
2.2. Inventory Analysis and Impact Assessment
2.3. Interpretation
2.4. Assumptions and Limitations
2.5. Study-Specific Methodology
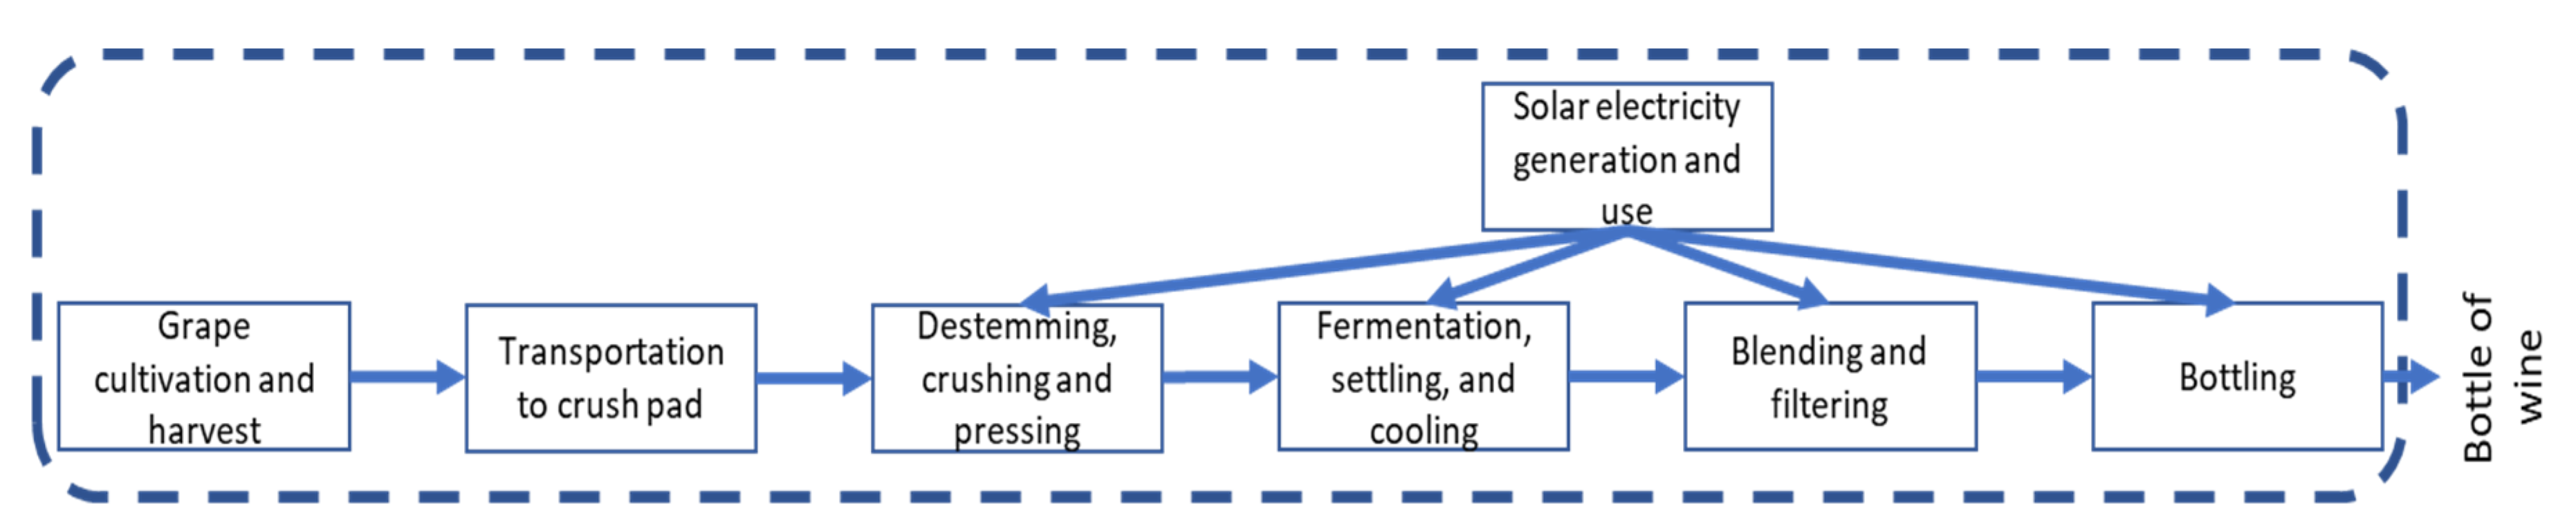
2.5.1. Small Winery
2.5.2. Medium Winery
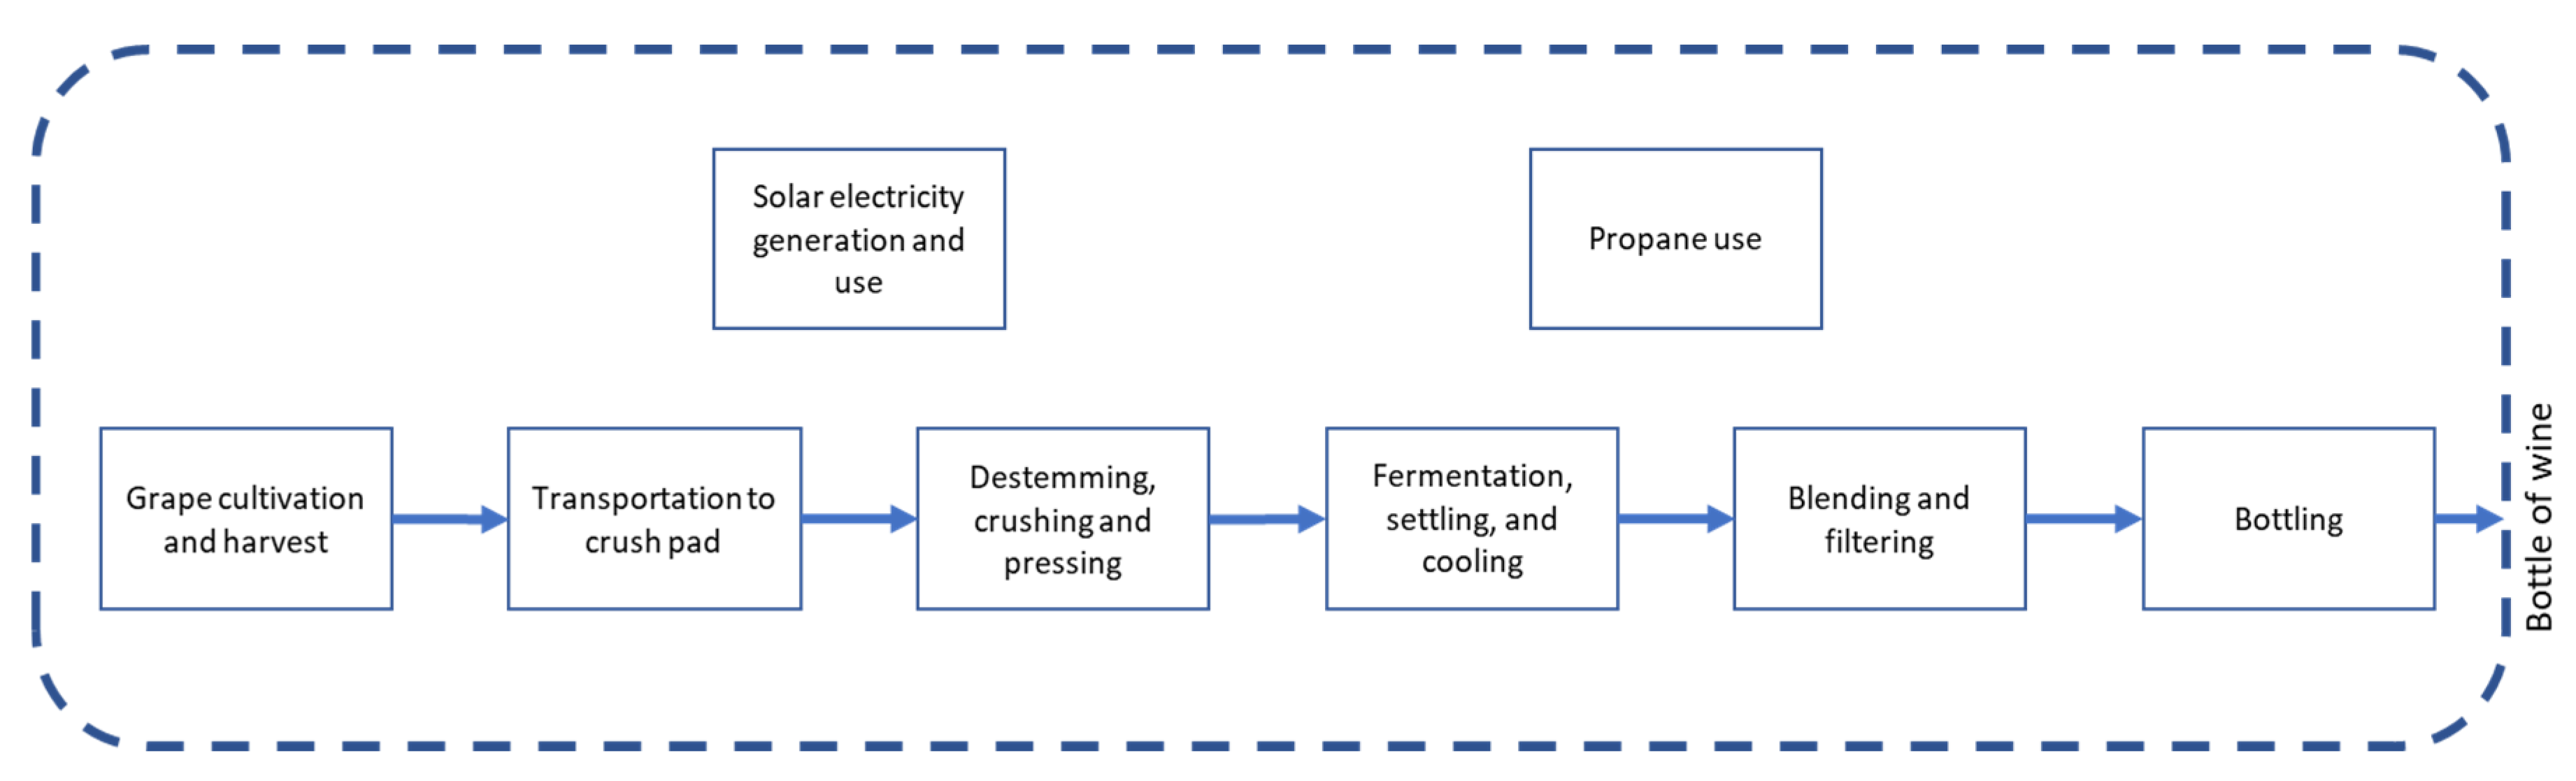
2.5.3. Large Winery
2.6. Main Differences between Case Studies
3. Results and Discussion
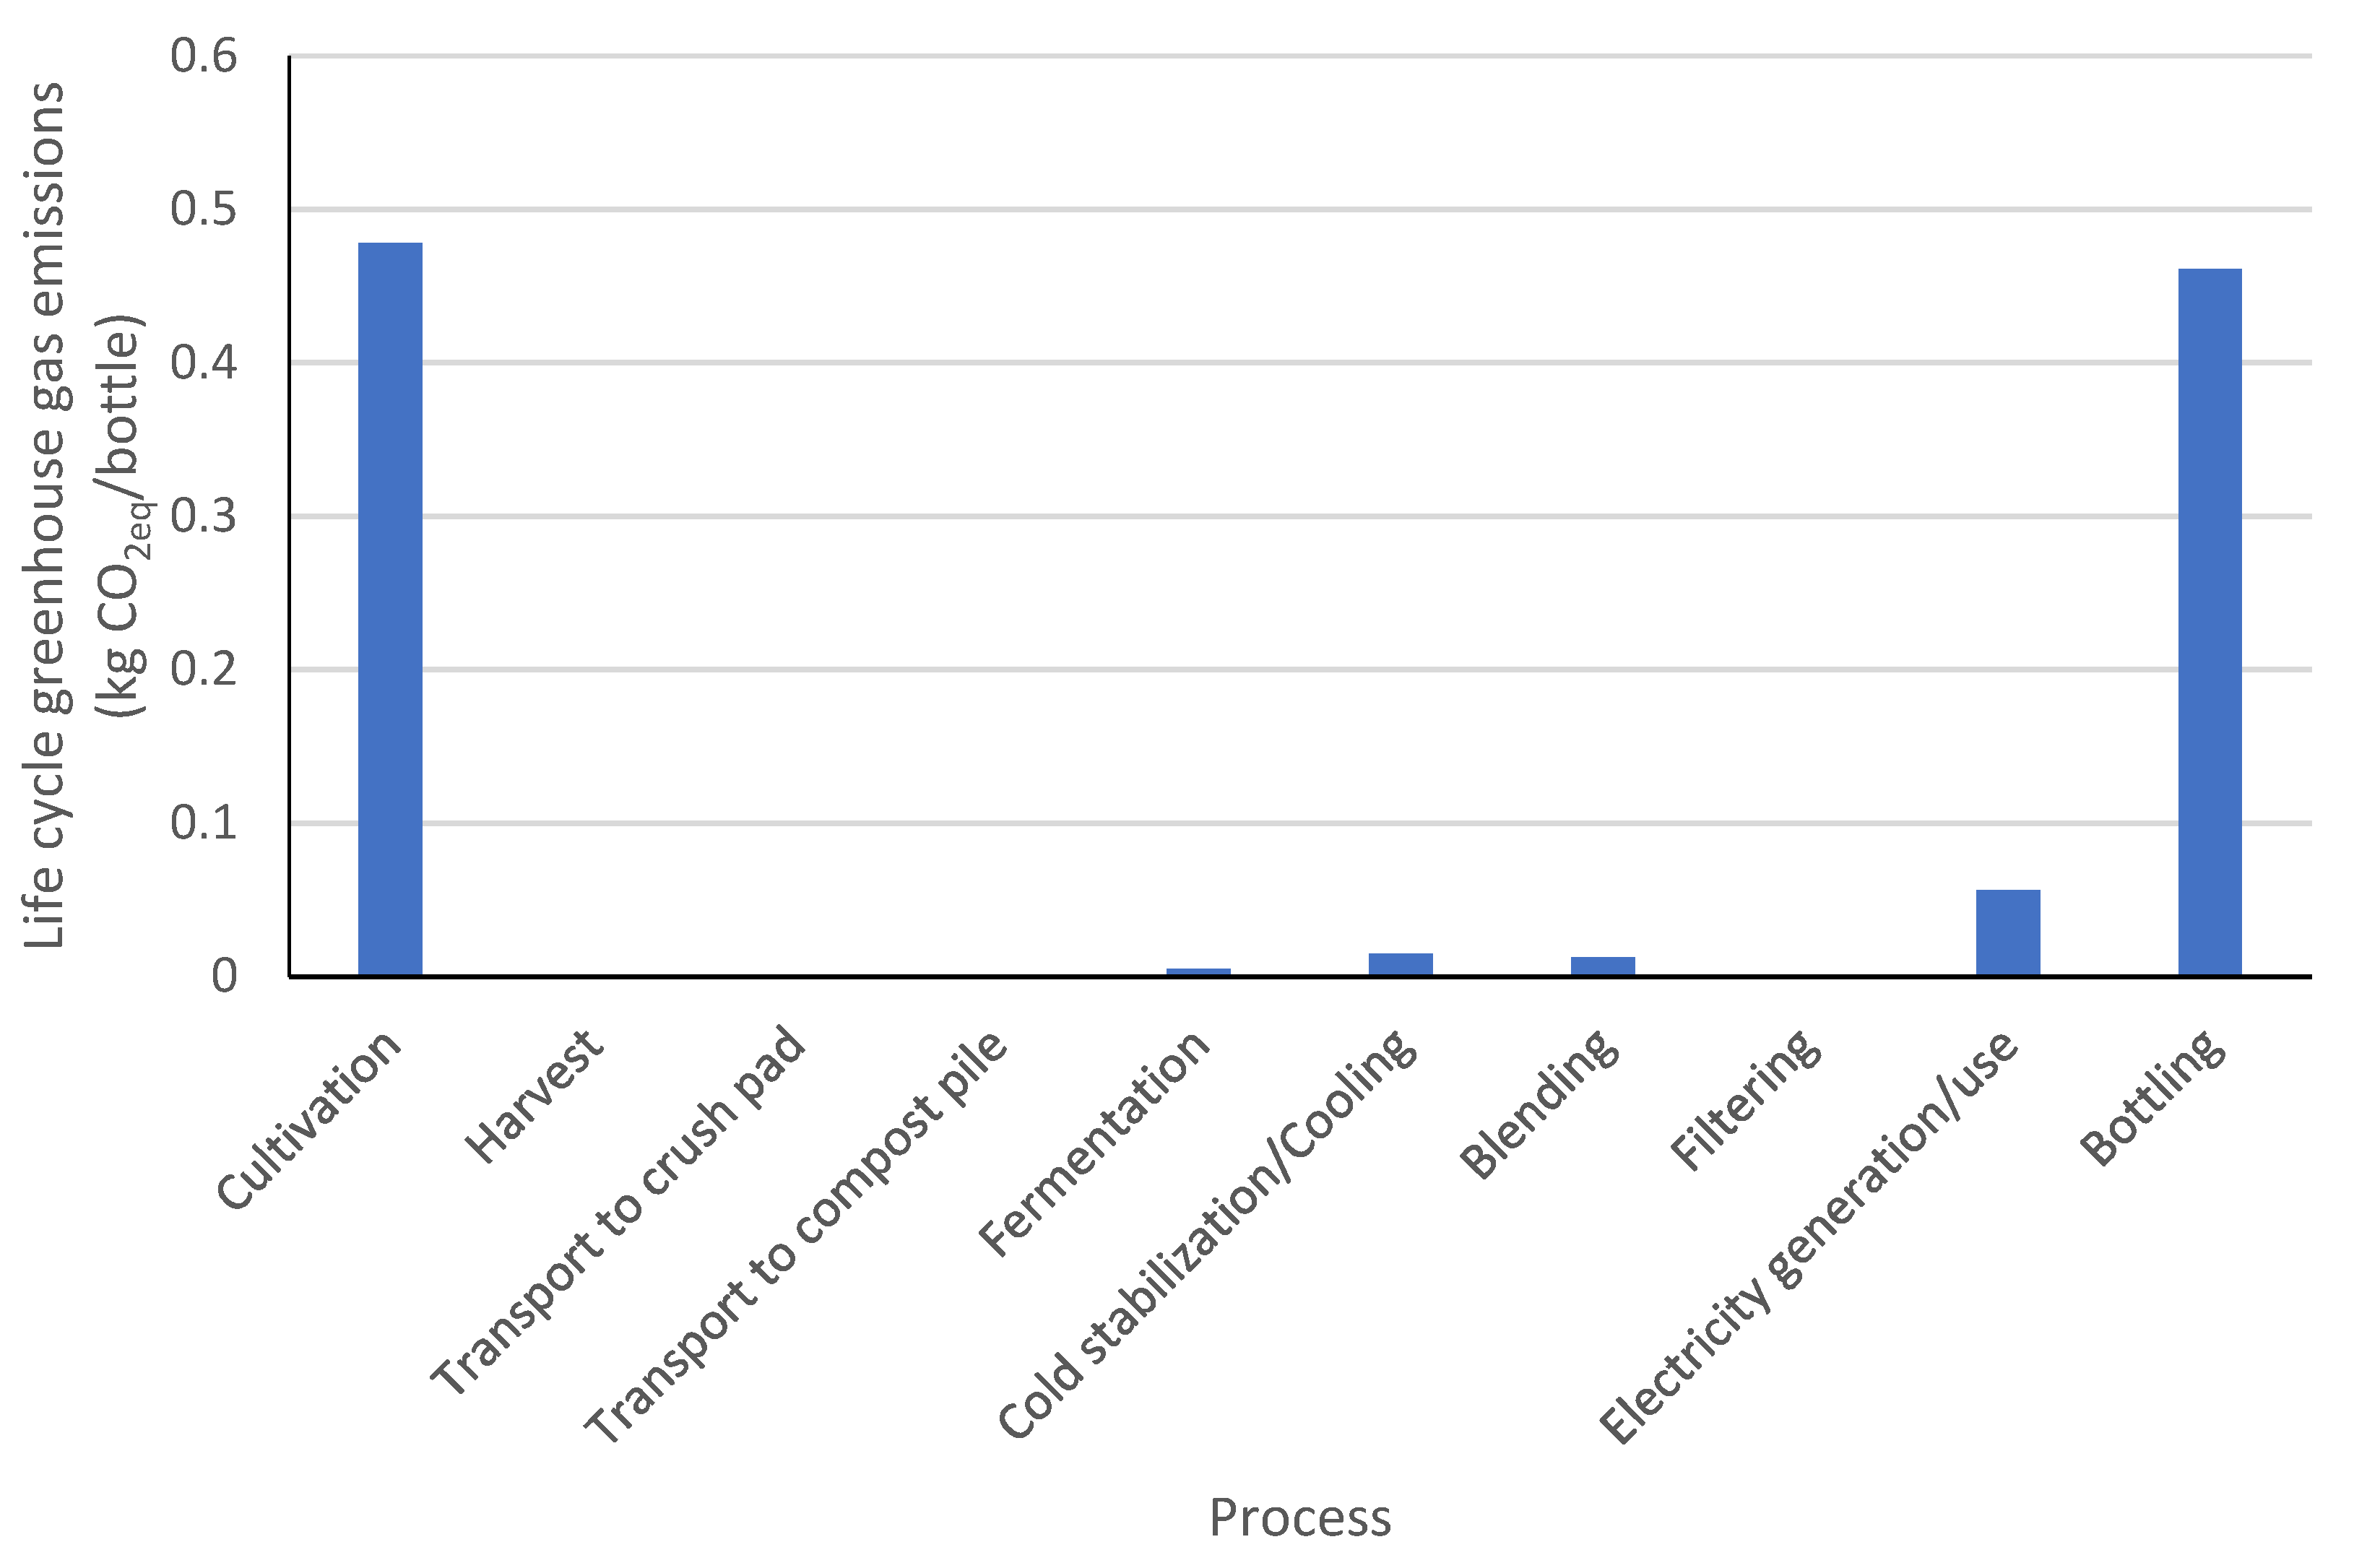
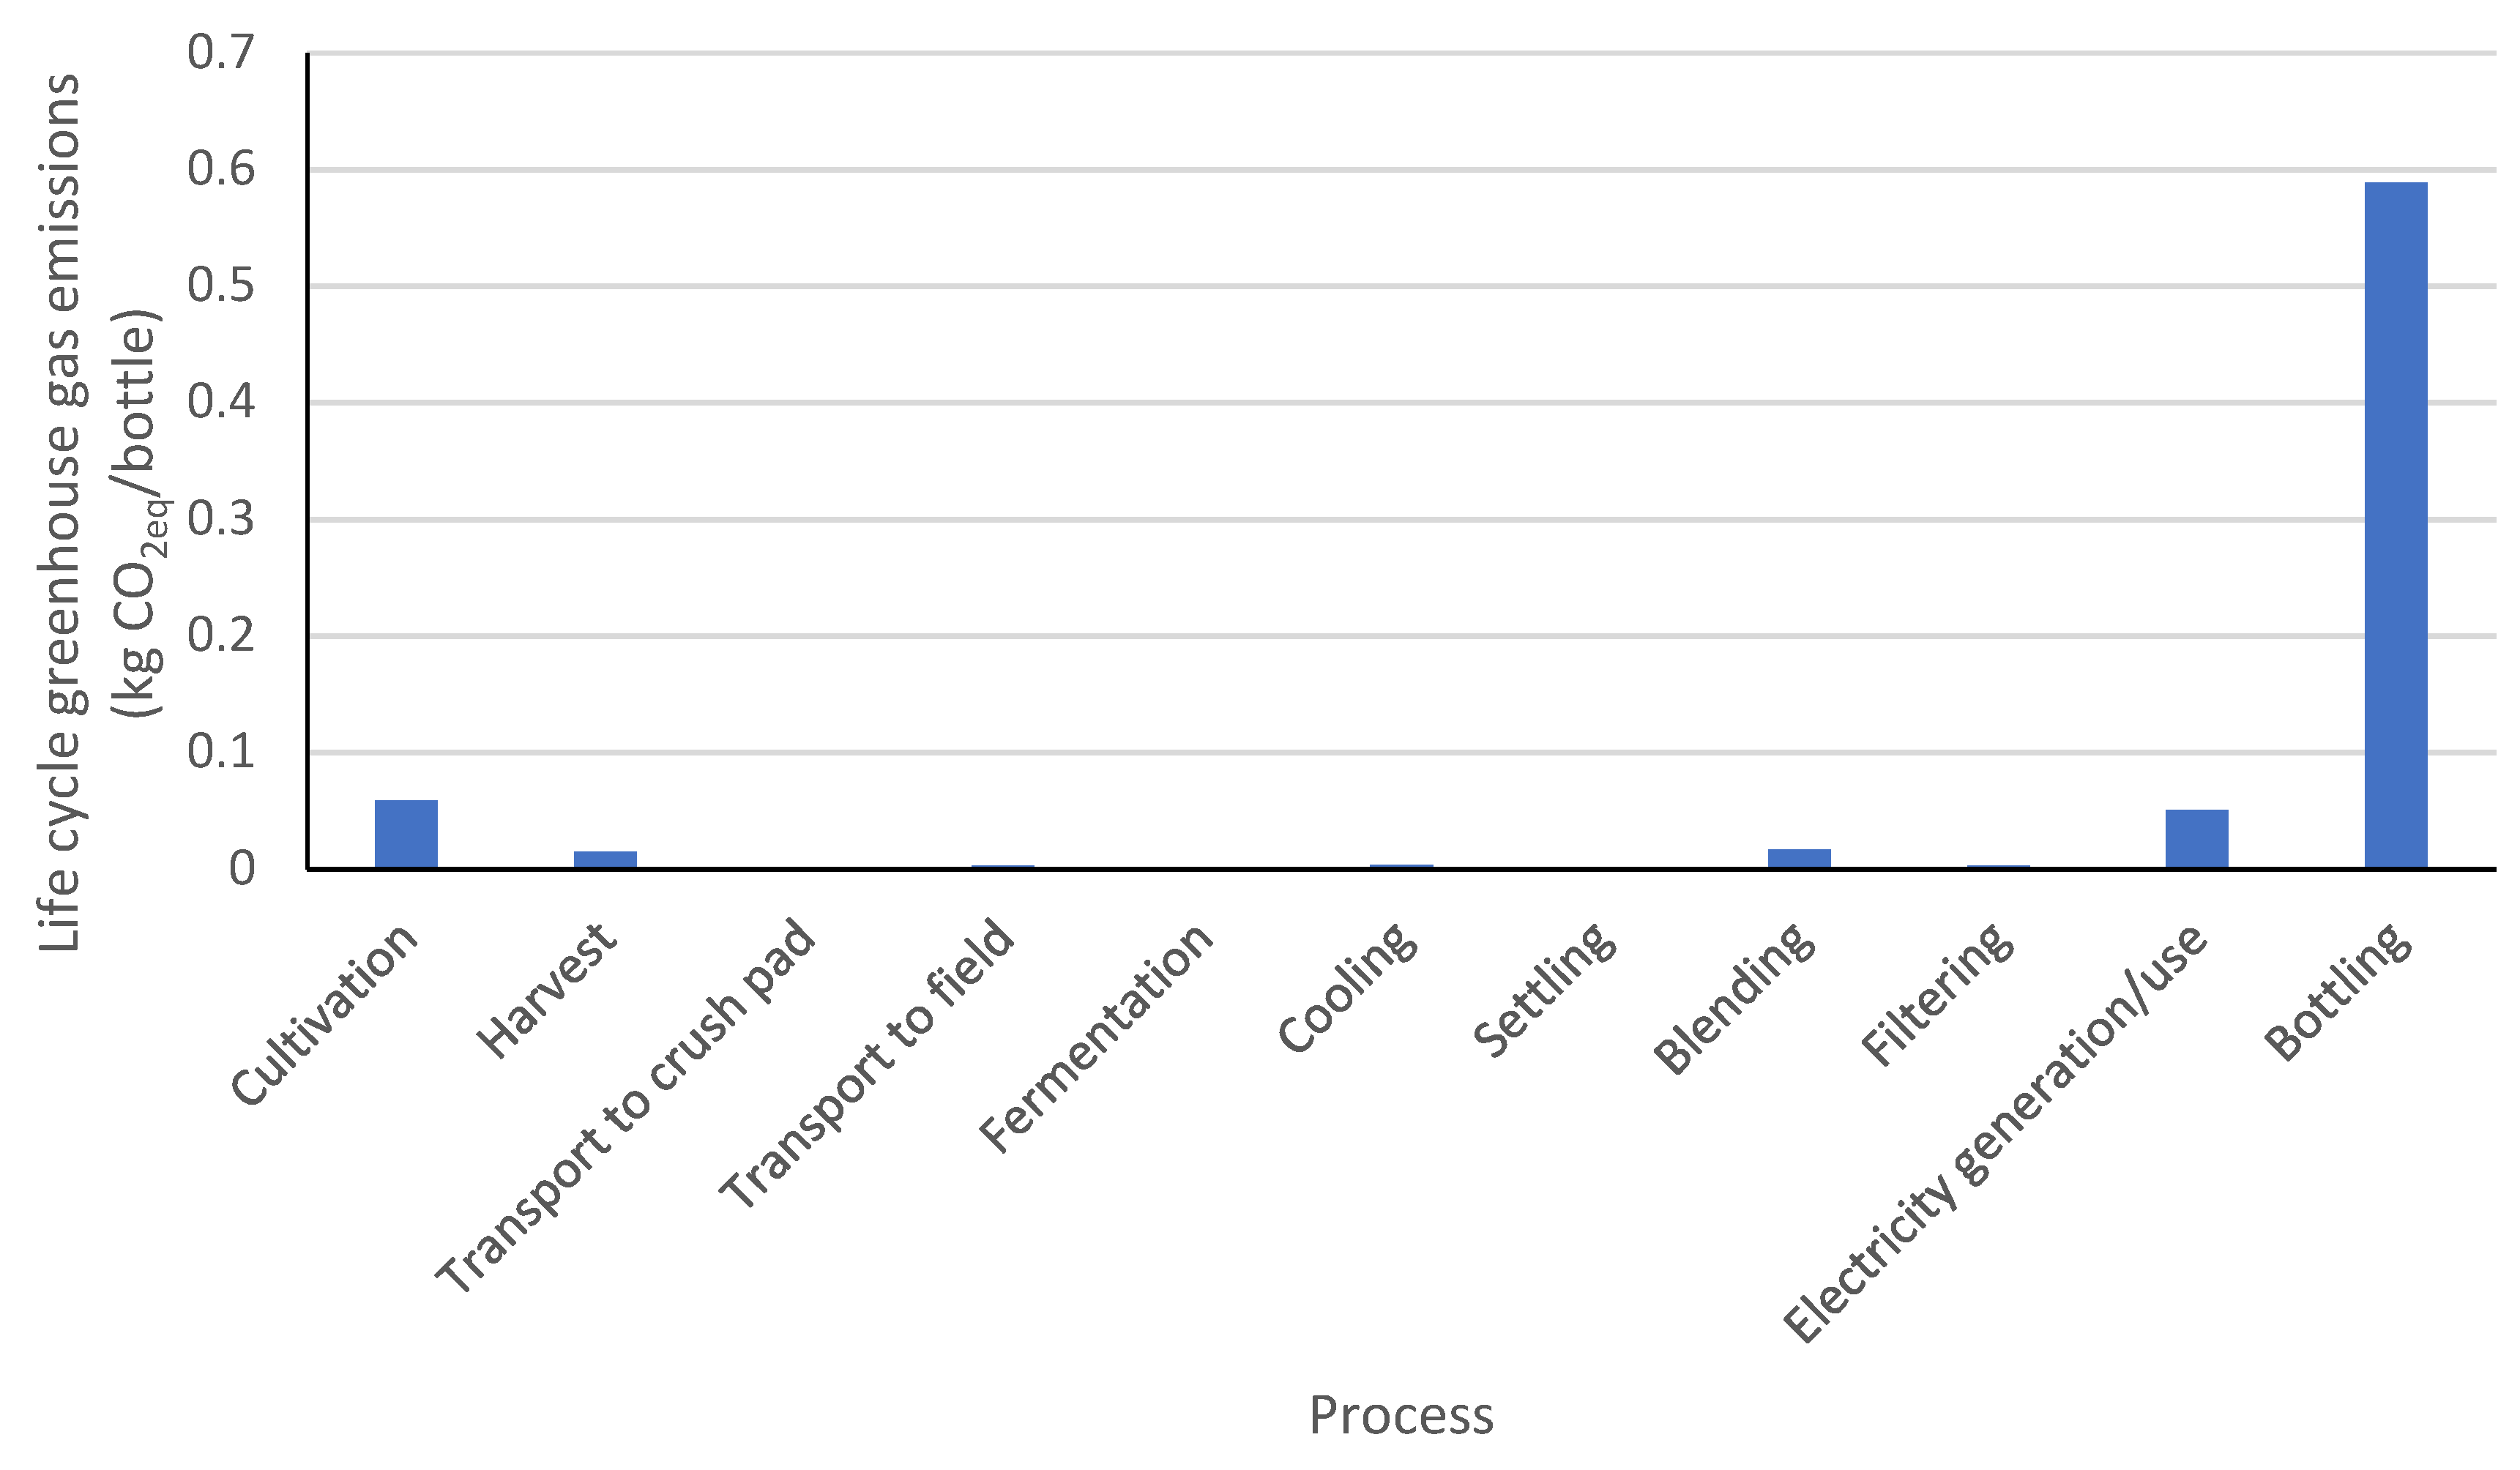
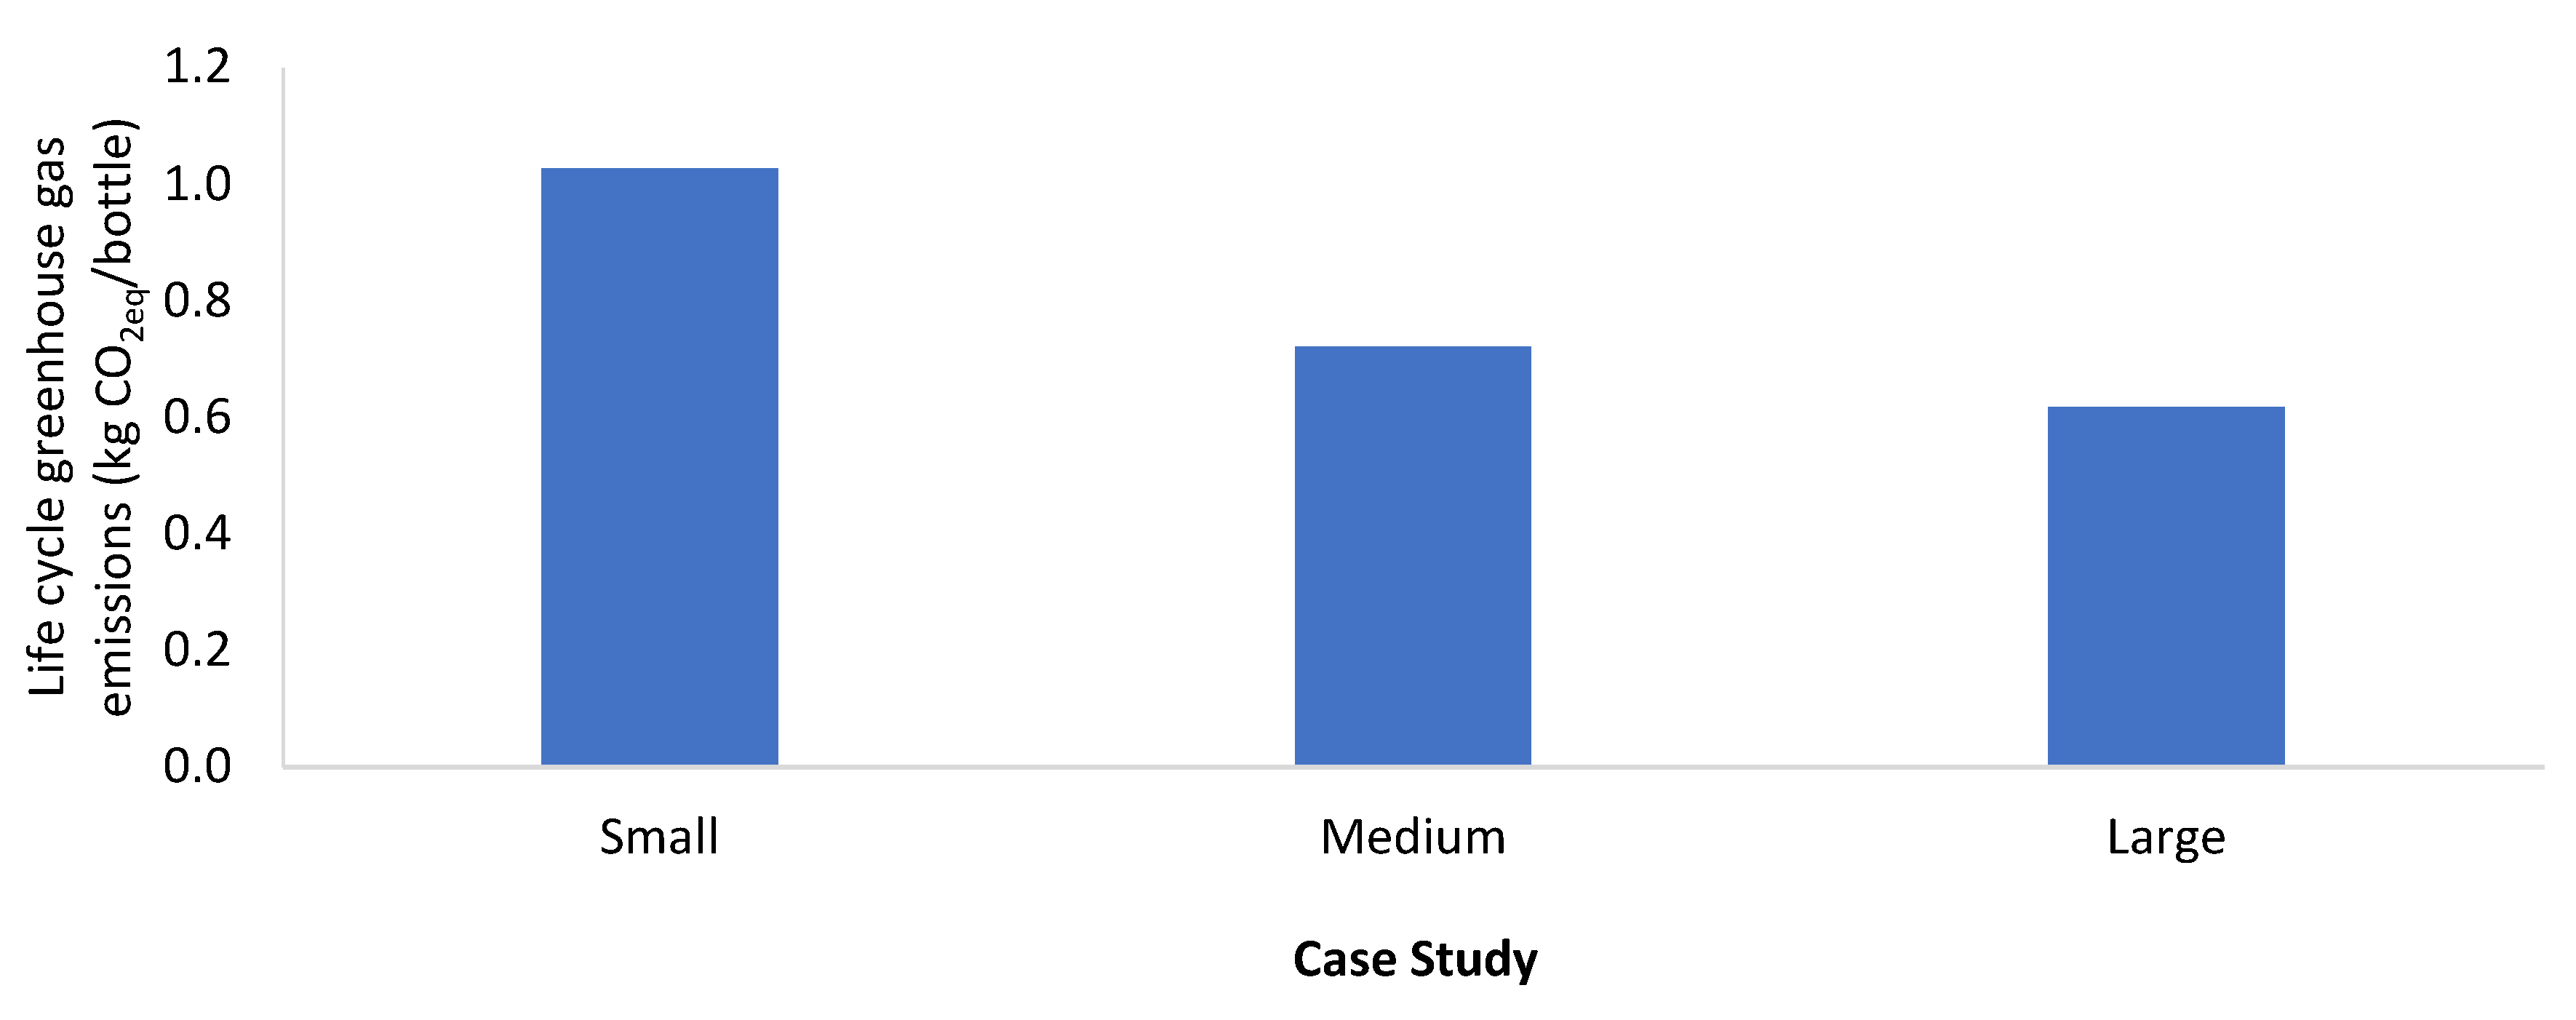
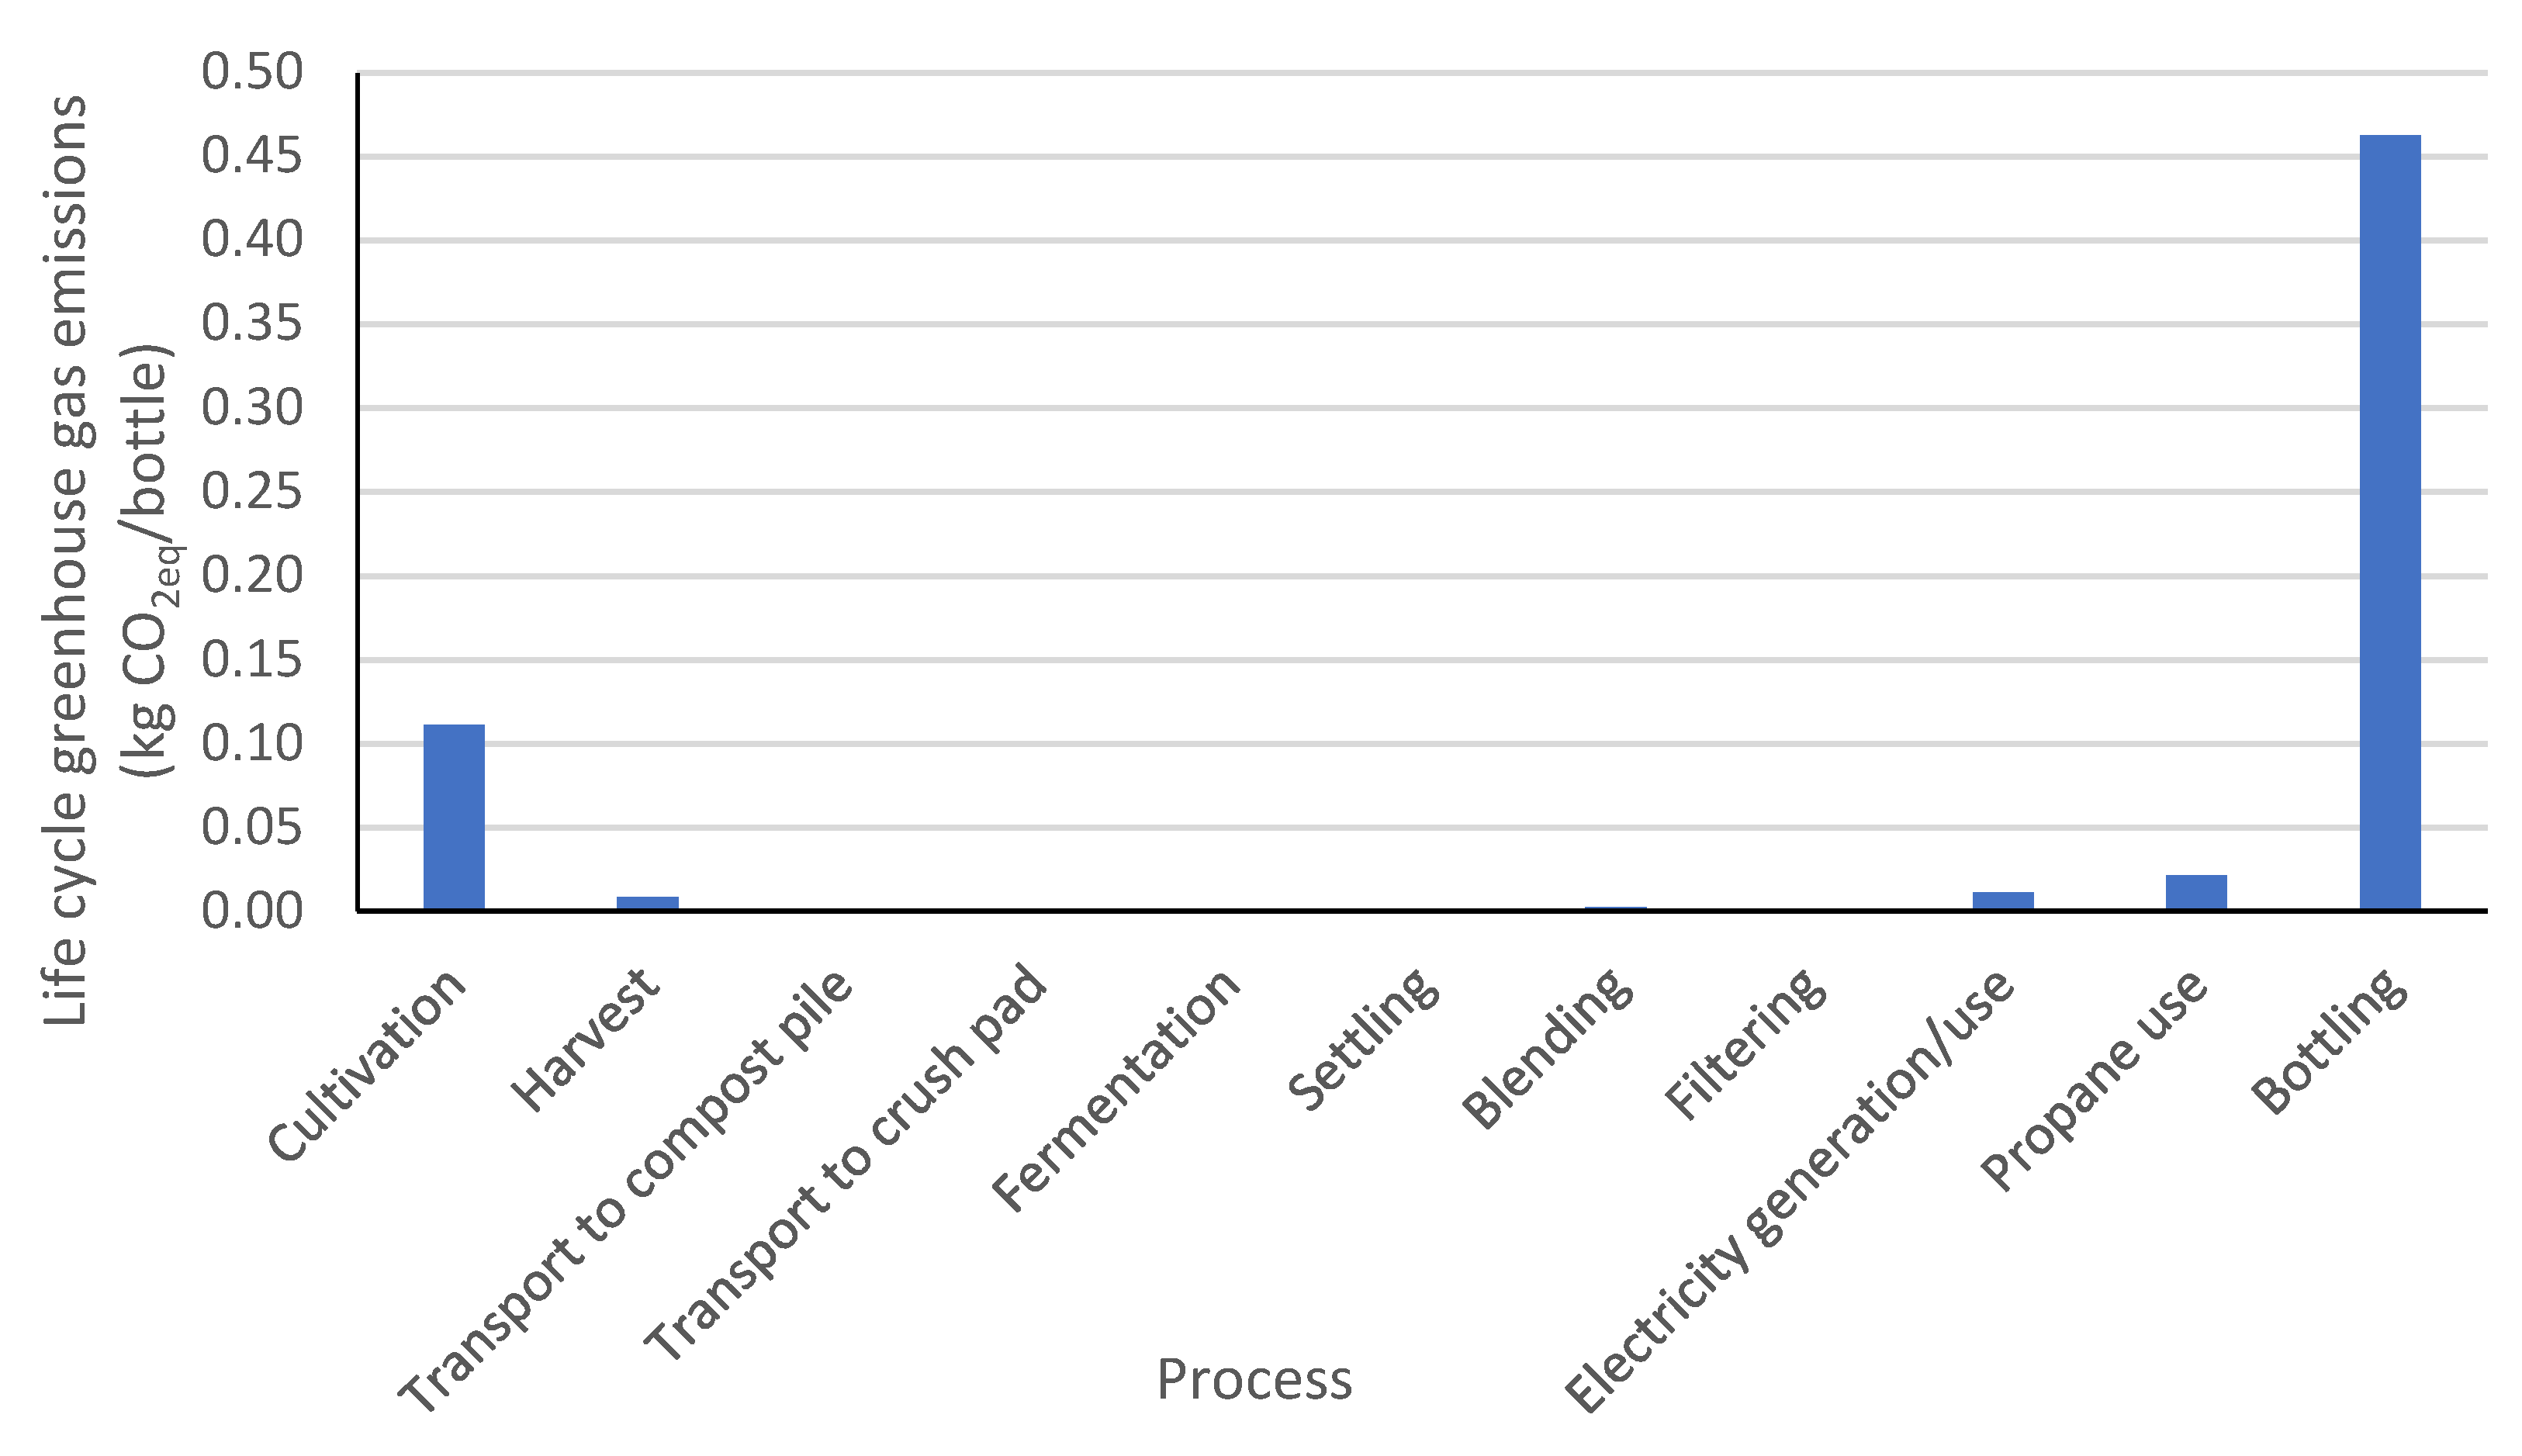
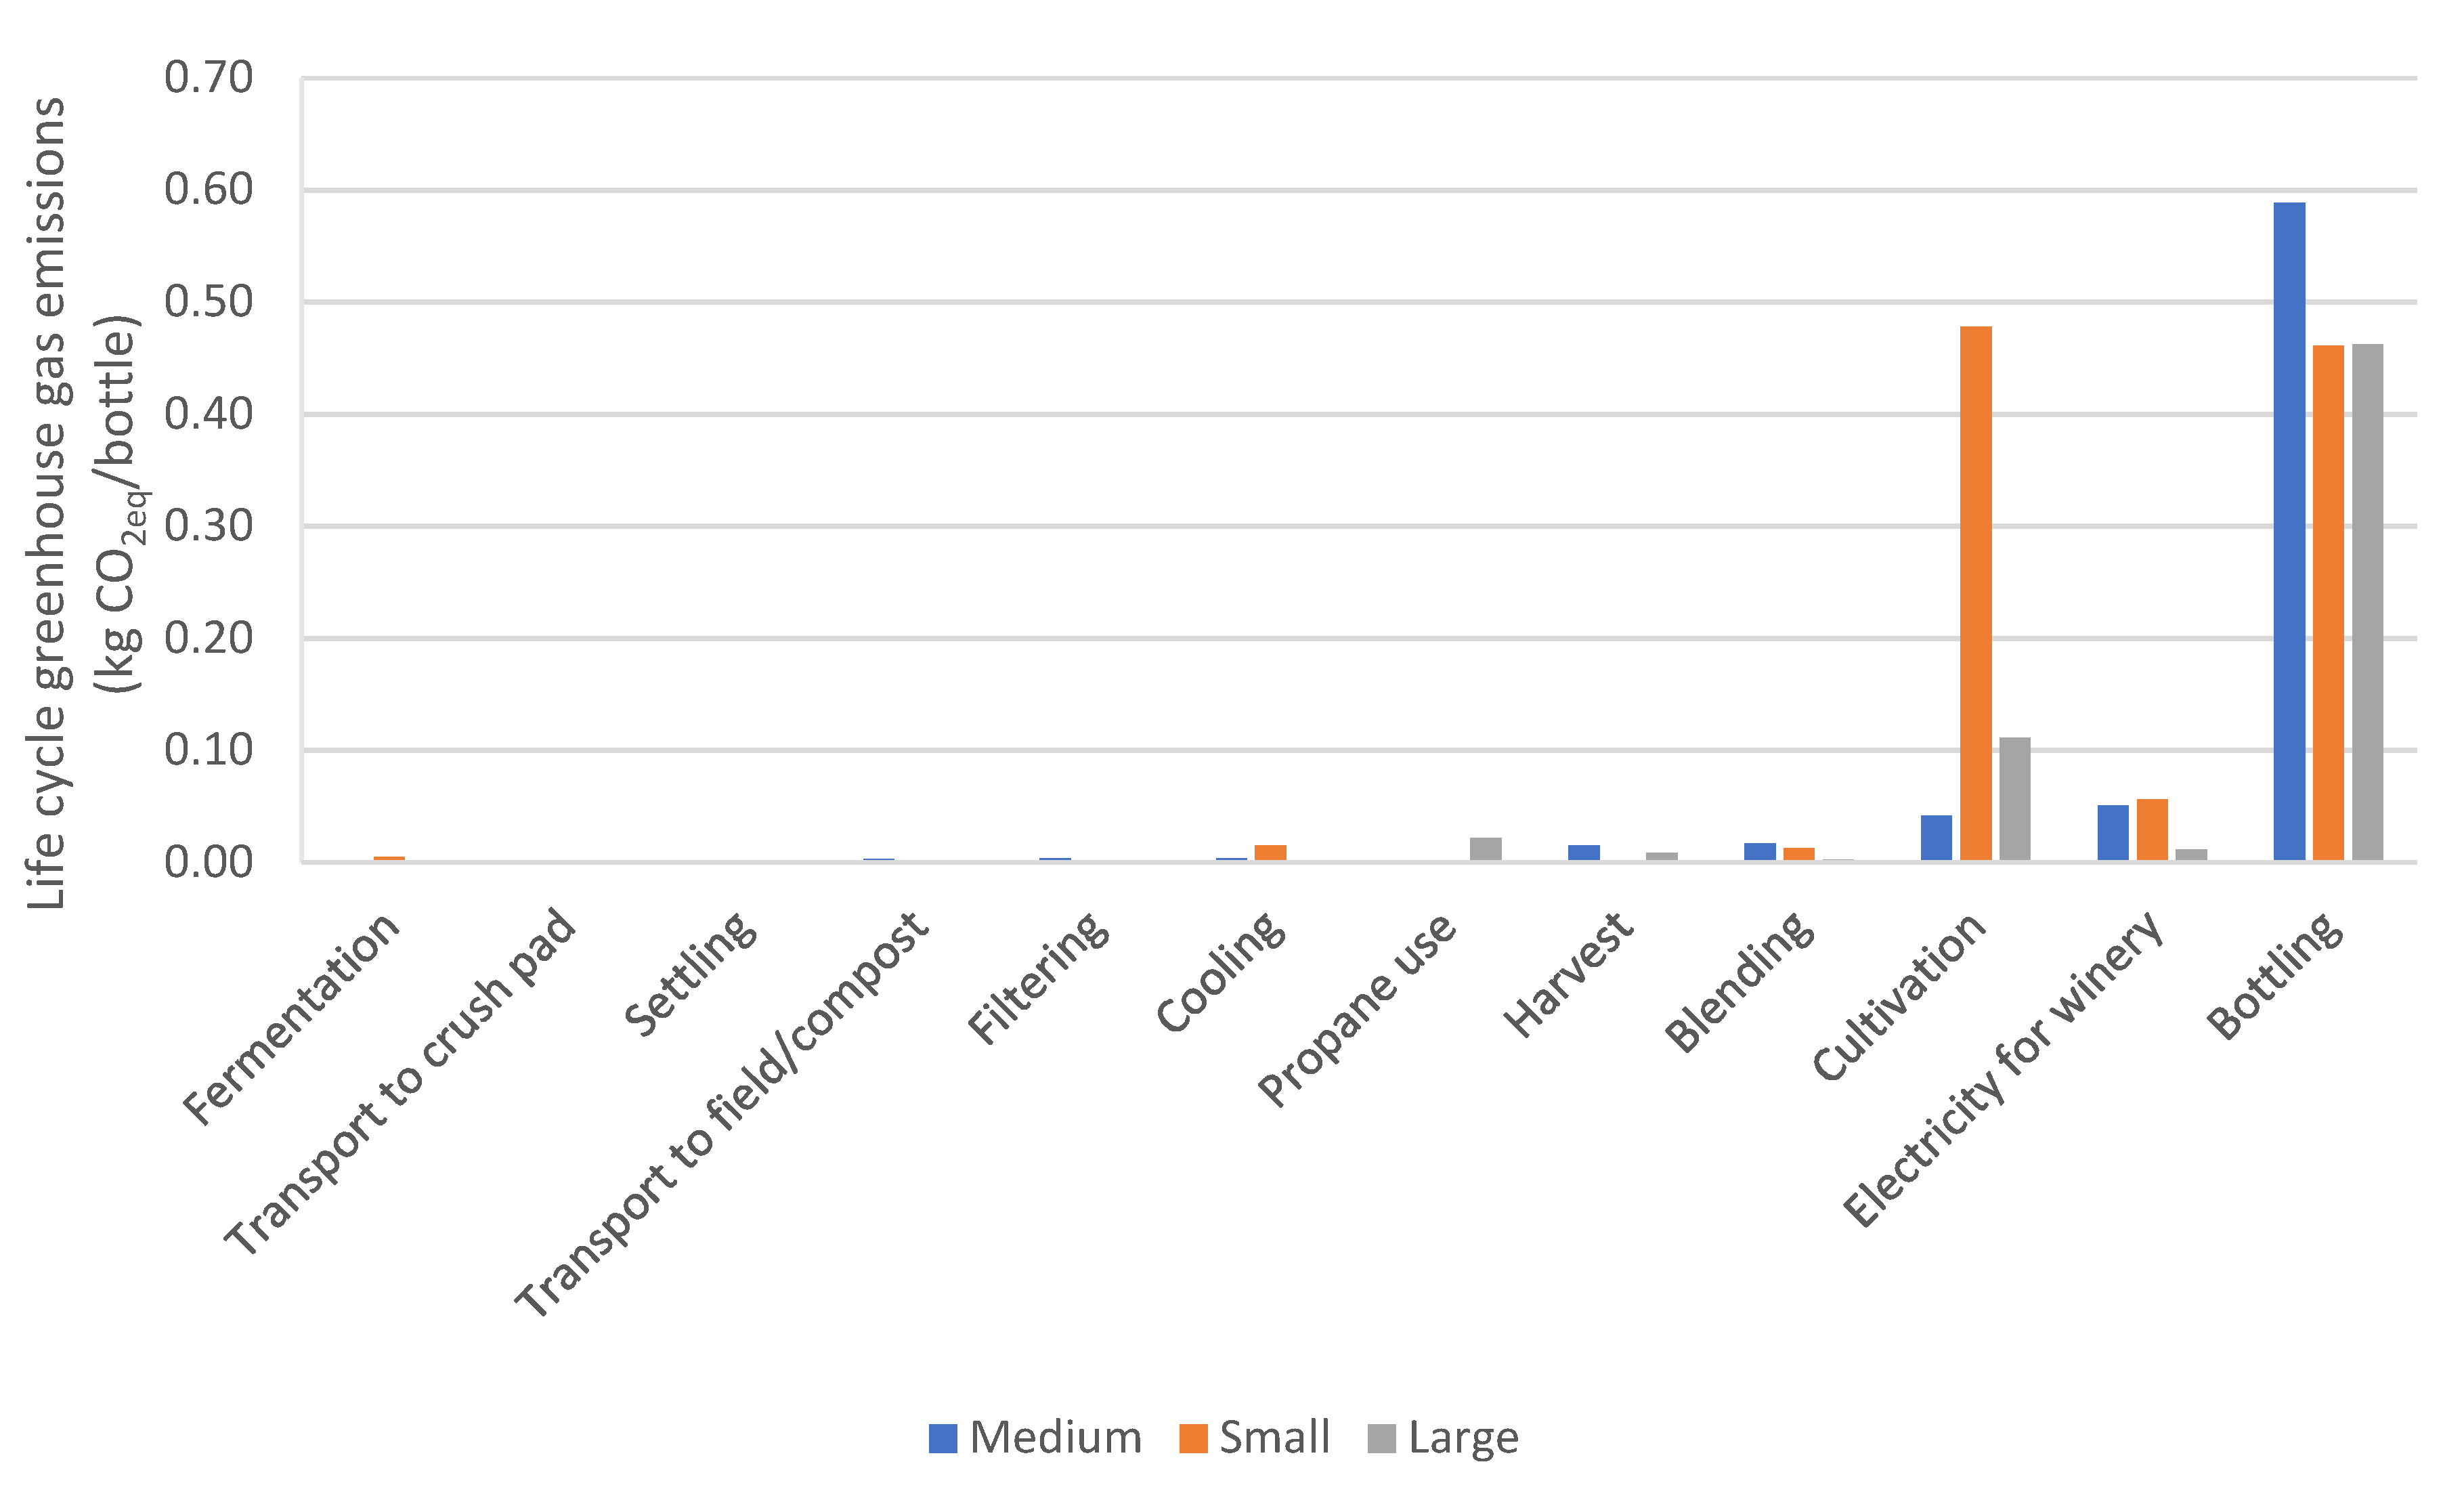
3.1. Baseline Results by Finger Lakes Case Study
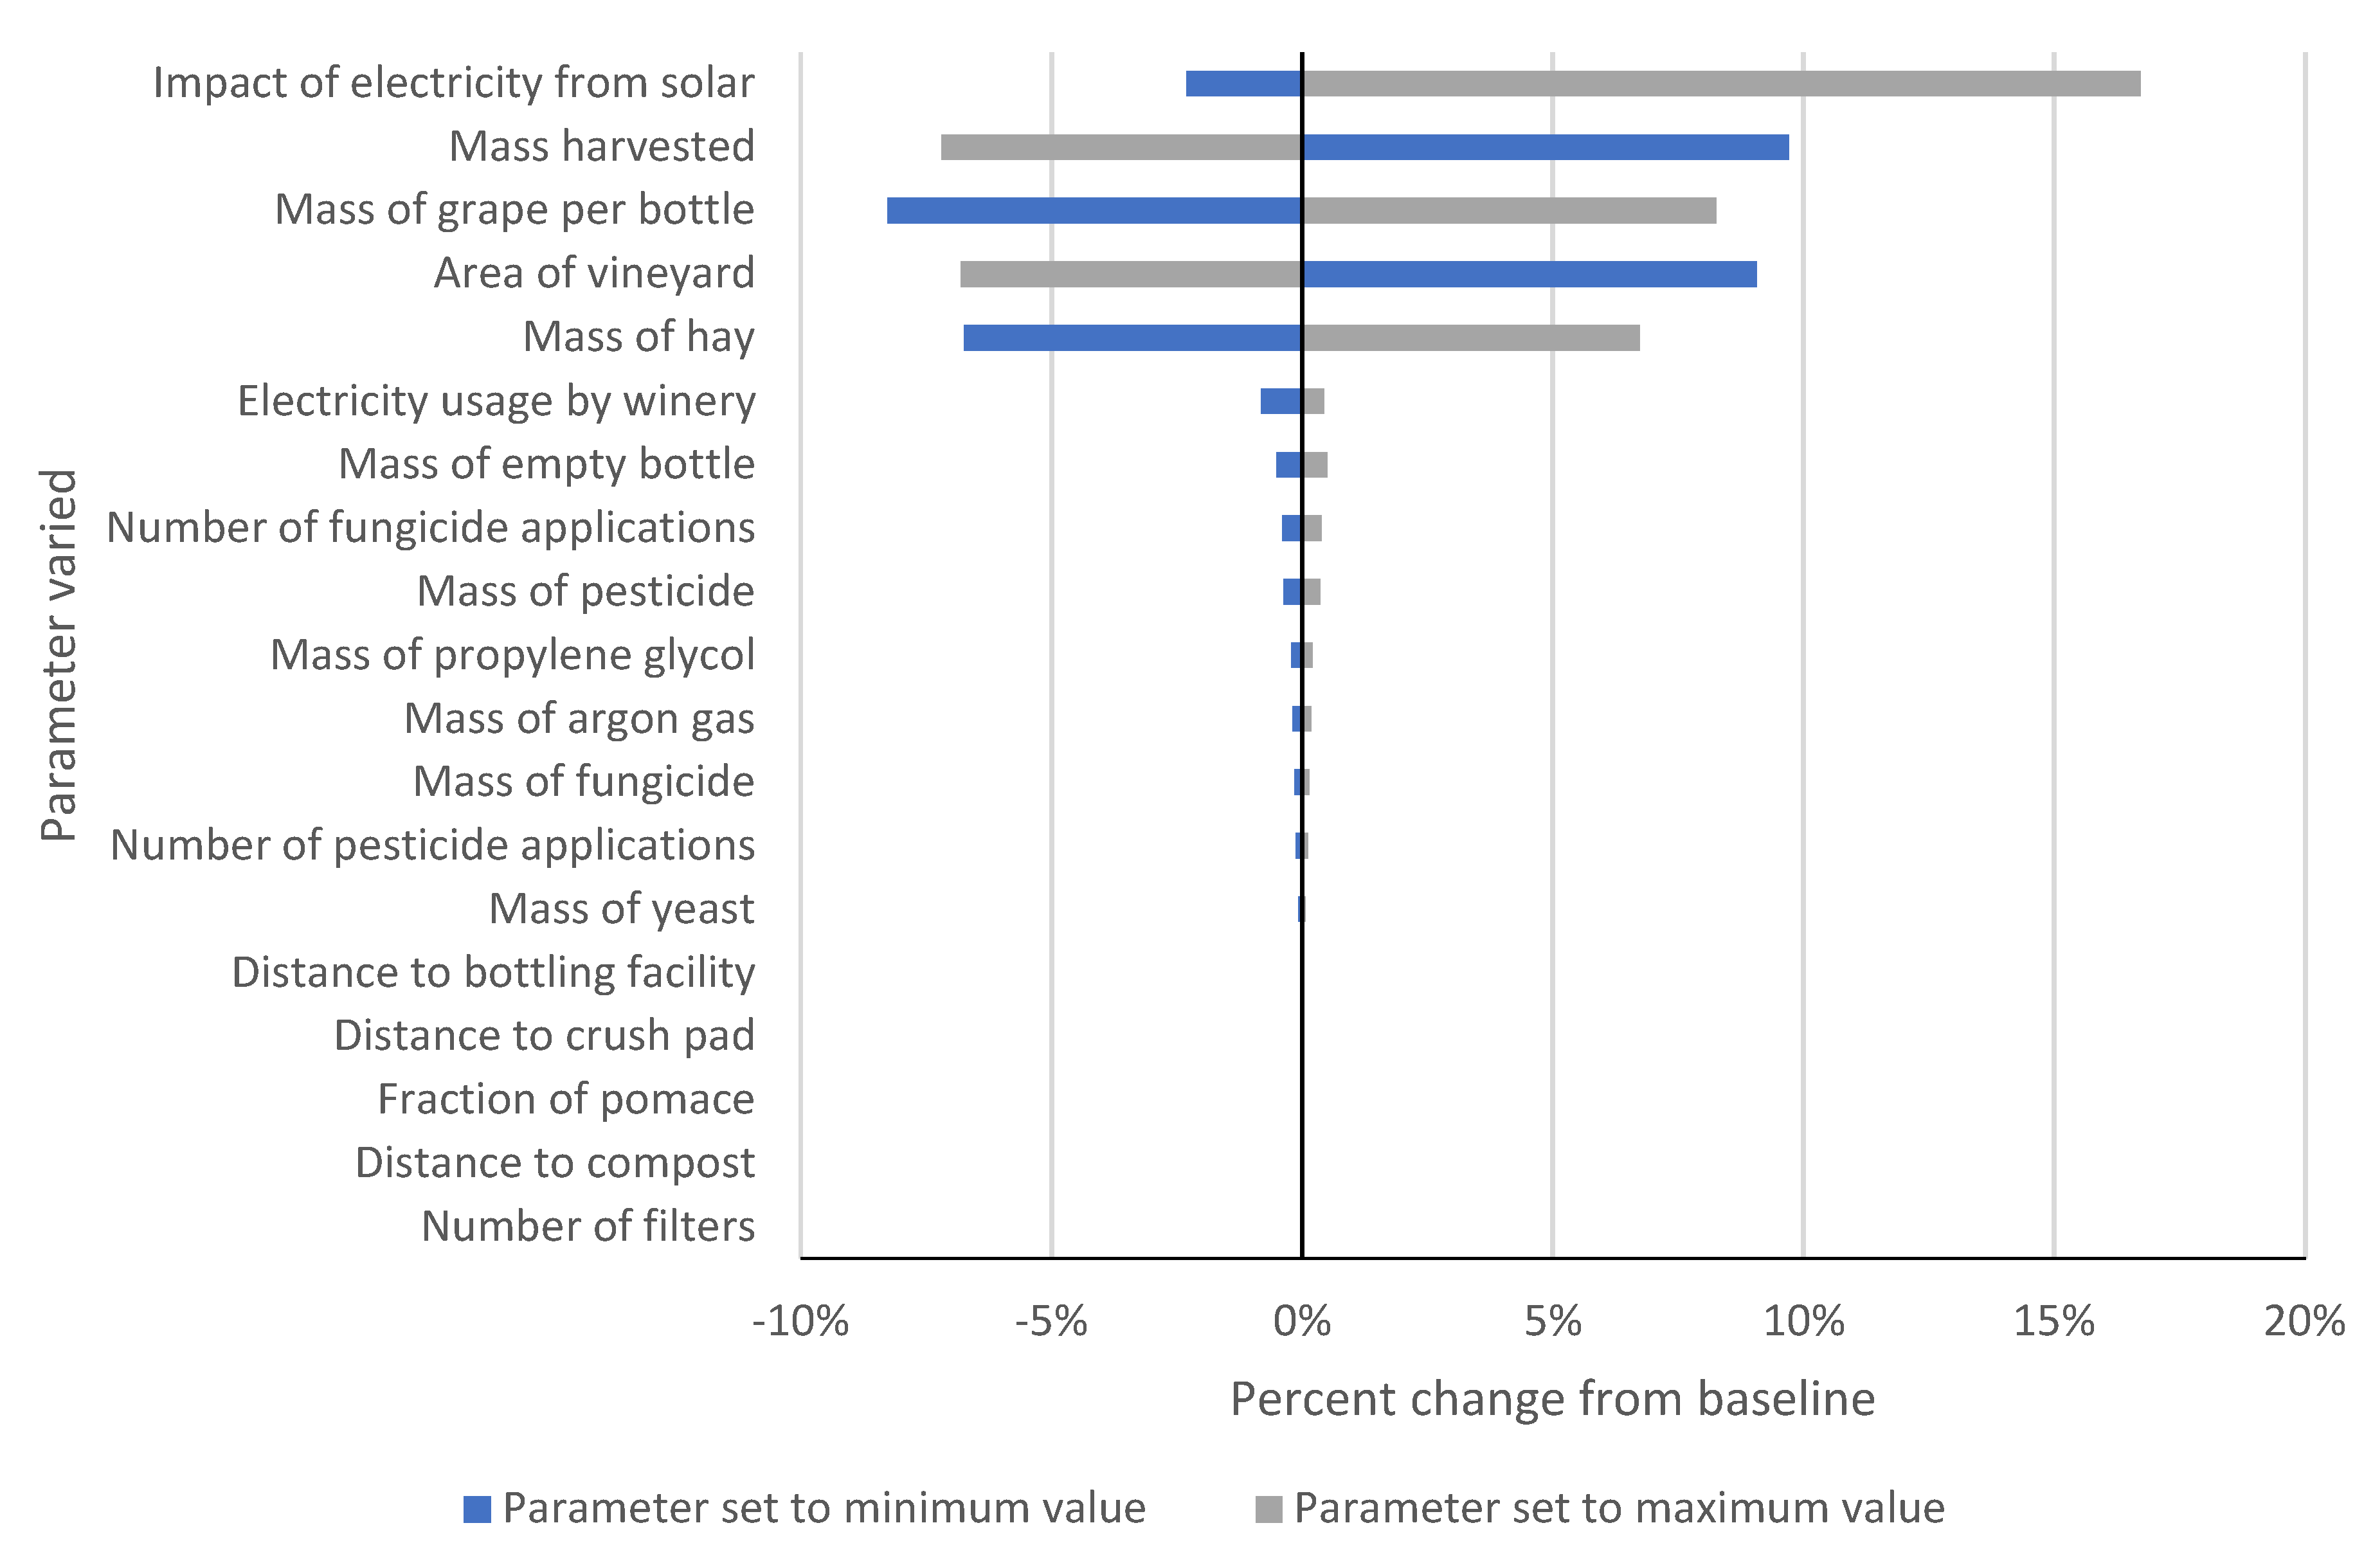
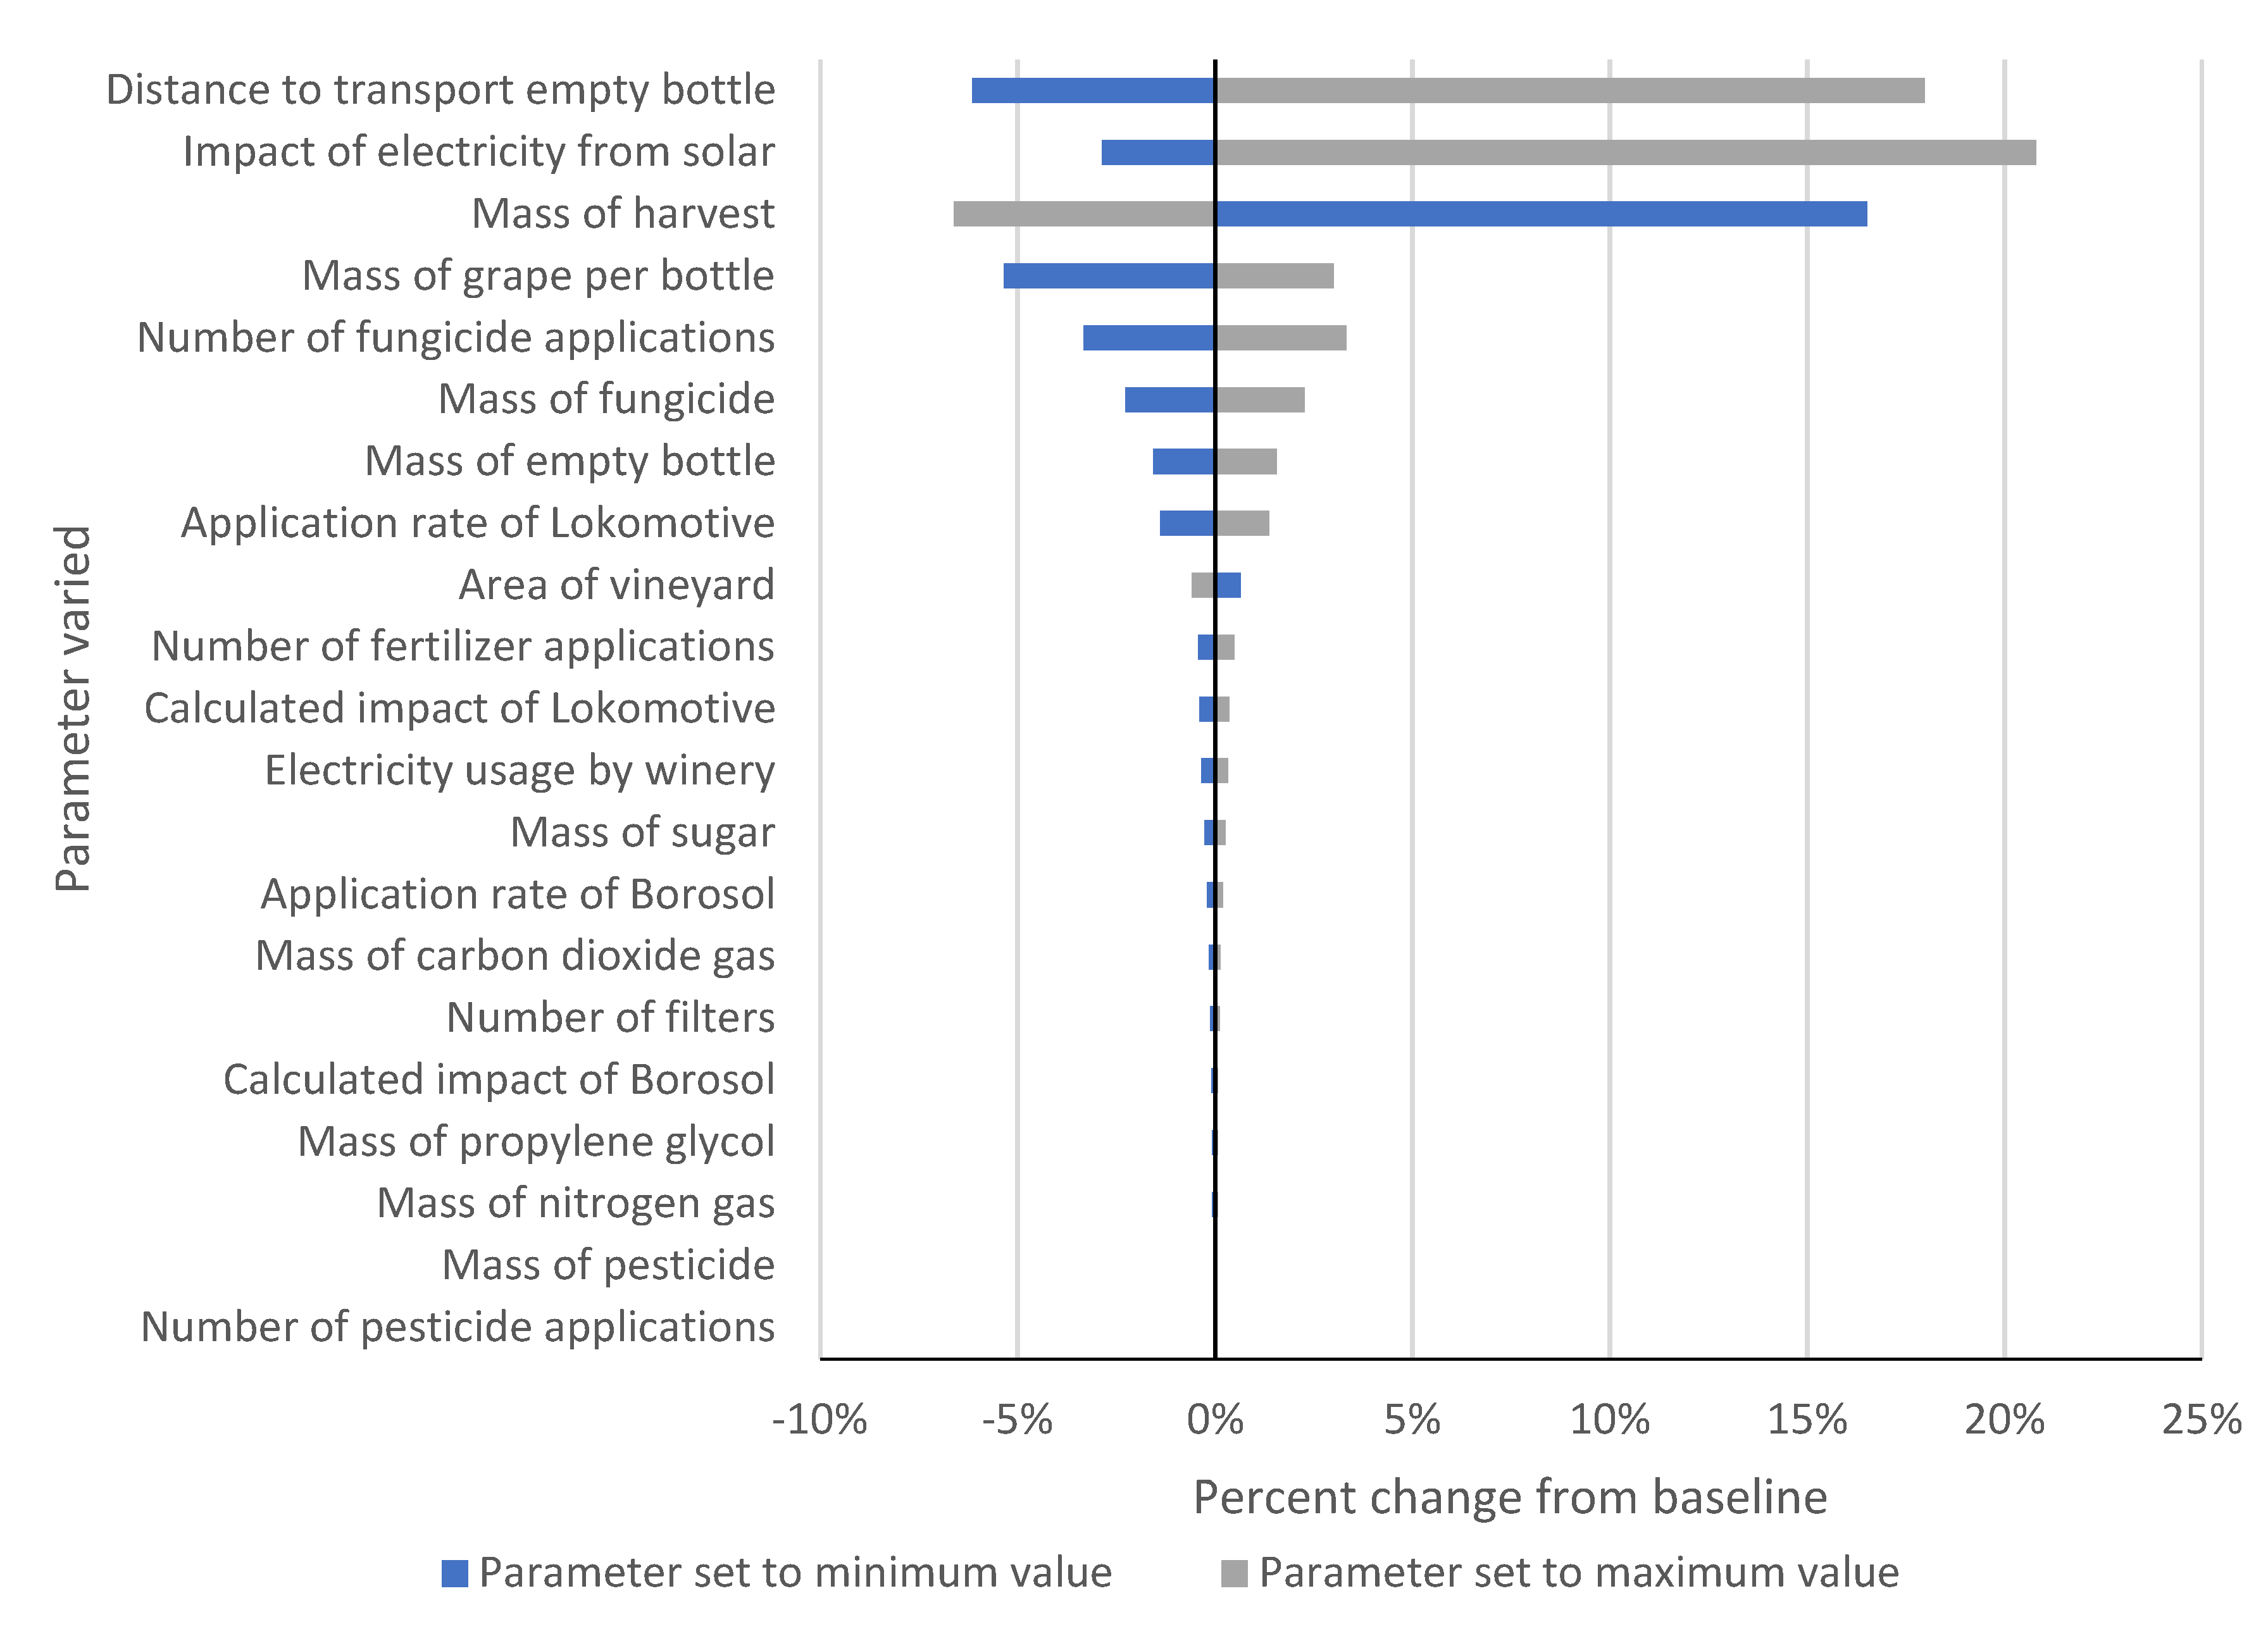
3.2. Sensitivity Analyses
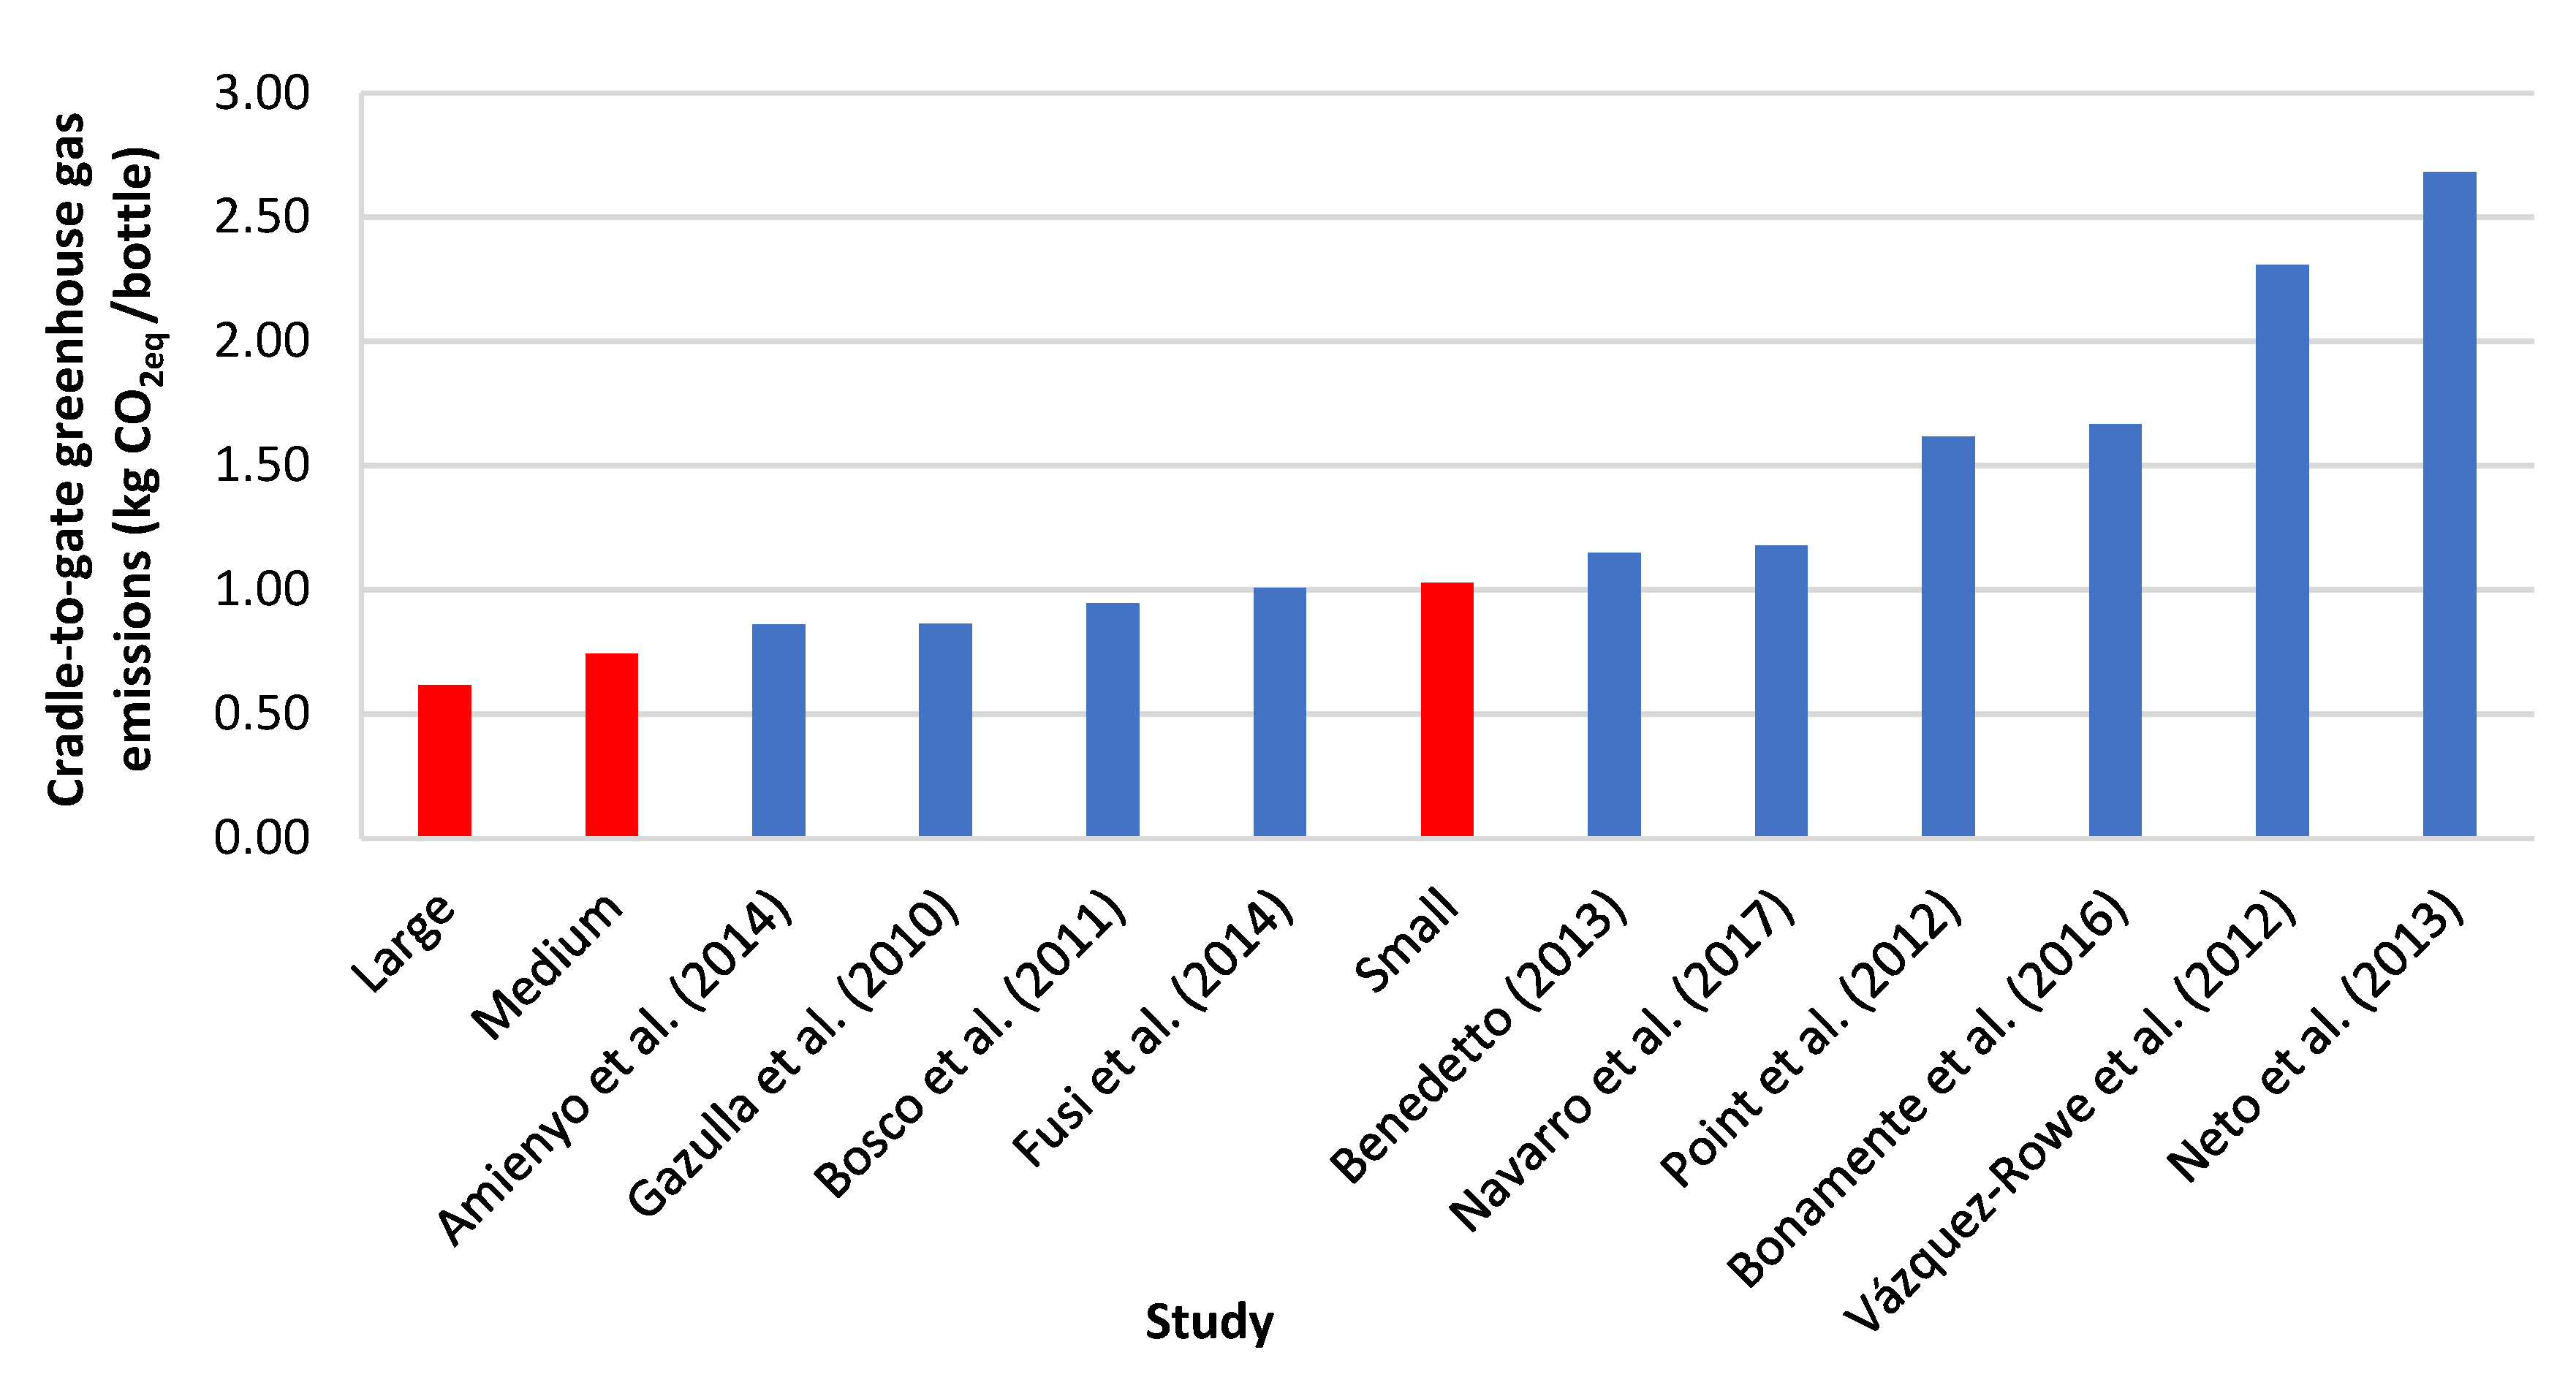
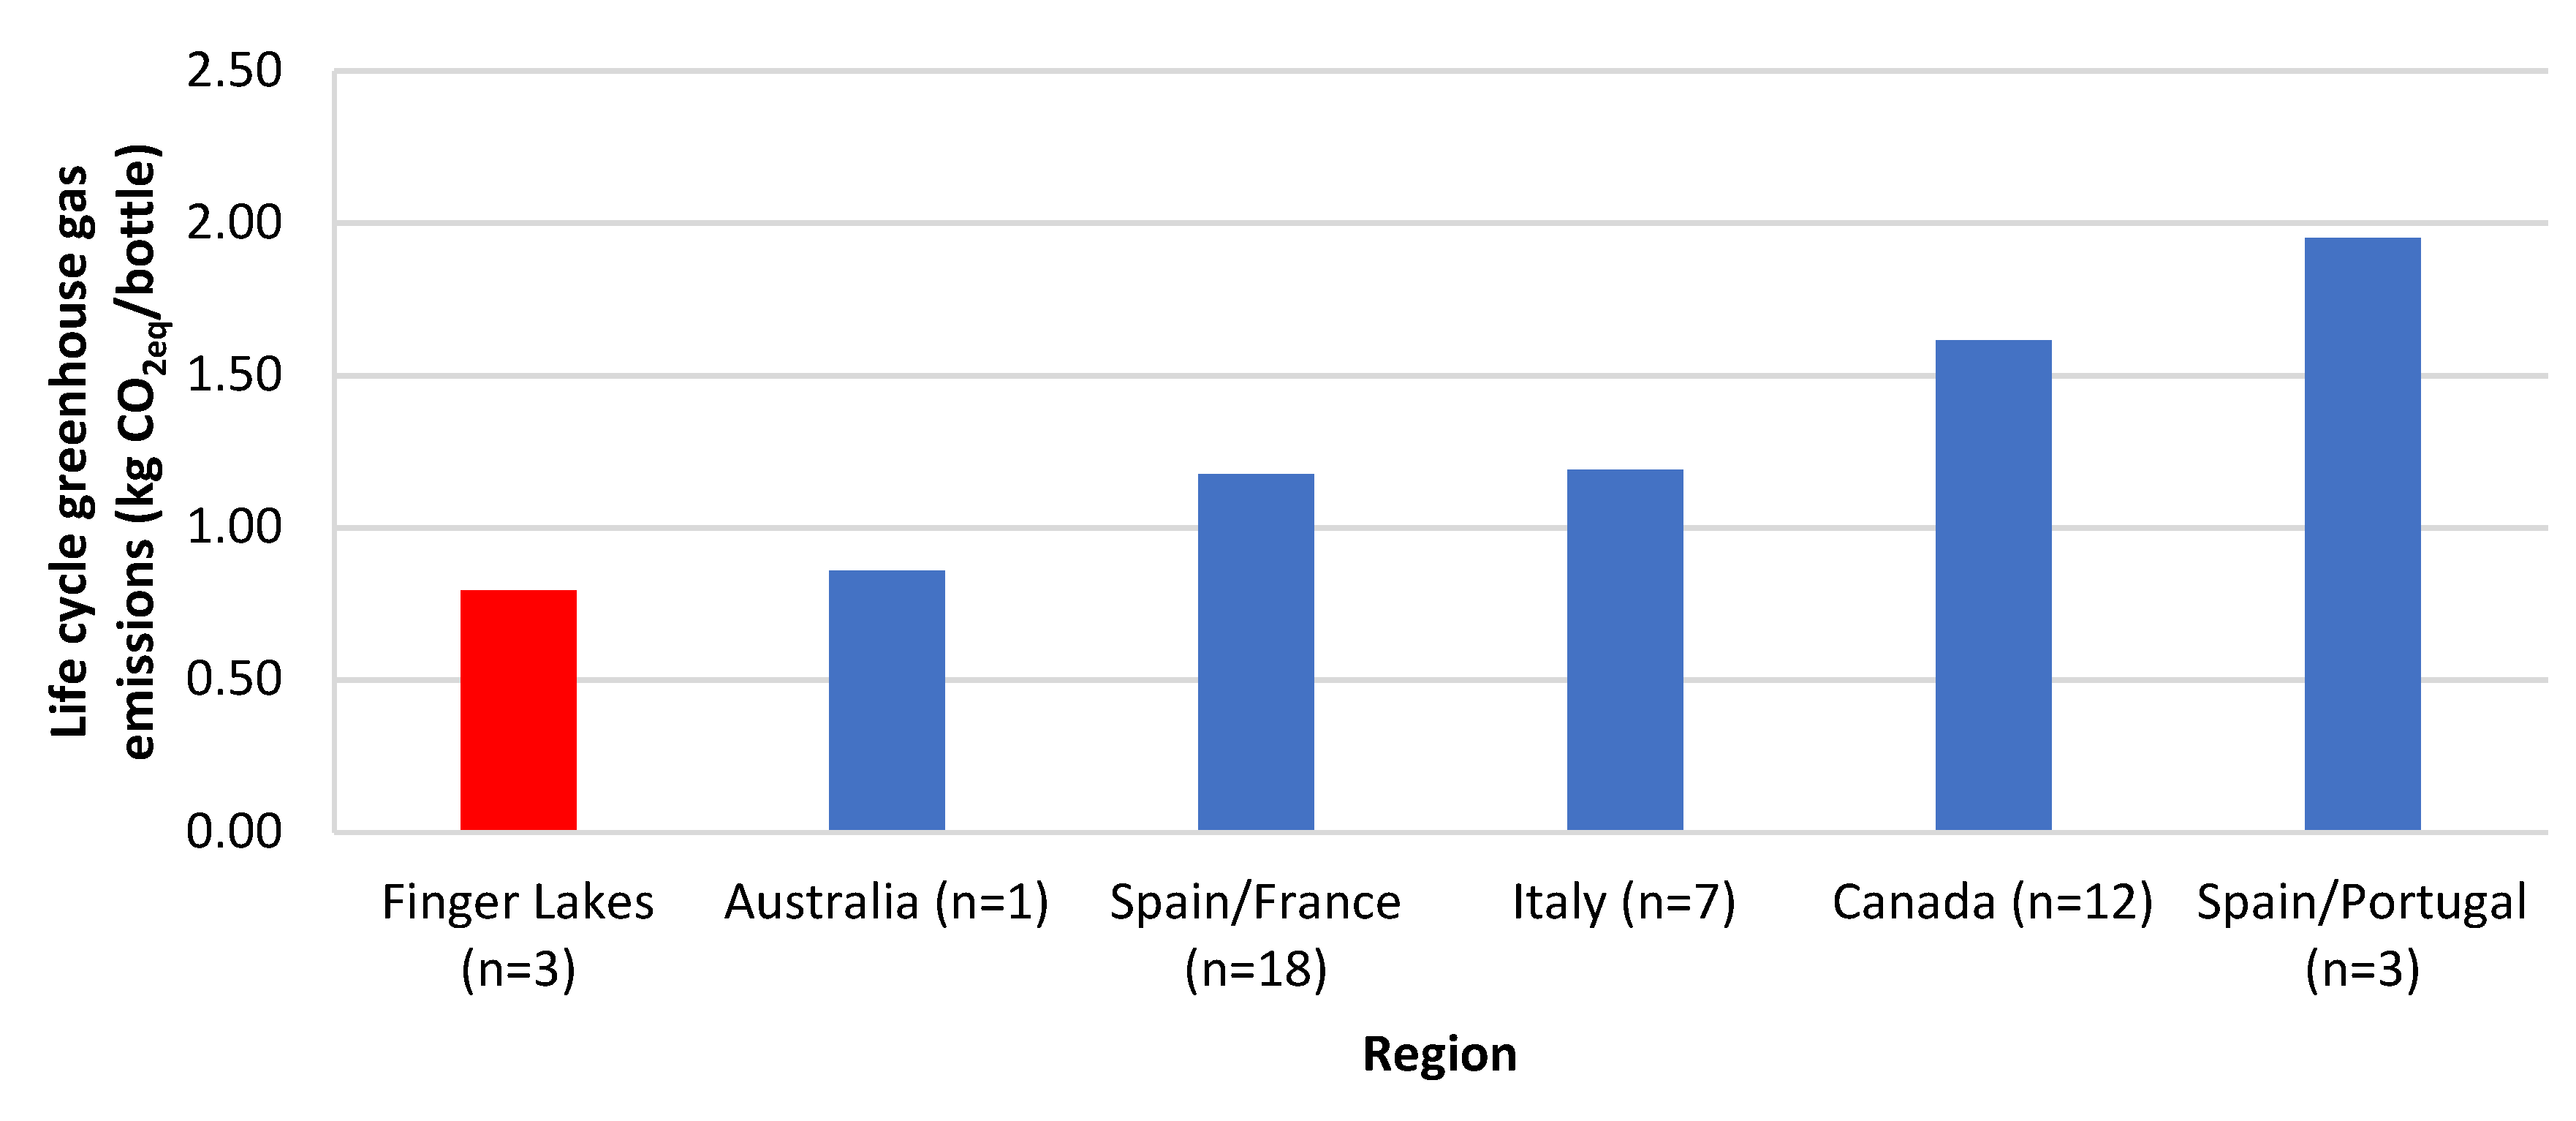
4. Comparison to Other Studies
5. Limitations and Future Work
6. Conclusions
Author Contributions
Funding
Acknowledgments
Conflicts of Interest
Appendix A

| Life Cycle Inventory Name | Source |
|---|---|
| Activated bentonite (RoW)| production | Ecoinvent 3 |
| Propylene glycol, liquid (RoW)| production | Ecoinvent 3 |
| Fodder yeast (RoW)| ethanol production from whey | Ecoinvent 3 |
| Sugar, from sugarcane (RoW)| cane sugar production with ethanol by-product | Ecoinvent 3 |
| Cellulose fibre, inclusive blowing in (RoW)| production | Ecoinvent 3 |
| Packaging glass, green (RoW)| production | Ecoinvent 3 |
| Carbon dioxide, liquid (RoW)| production | Ecoinvent 3 |
| Nitrogen, liquid (RoW)| air separation, cryogenic | Ecoinvent 3 |
| Captan (RoW)| production | Ecoinvent 3 |
| Pesticide, unspecified (RoW)| production | Ecoinvent 3 |
| Boric acid, anhydrous, powder (RoW)| production | Ecoinvent 3 |
| Monoethanolamine (RoW)| ethanolamine production | Ecoinvent 3 |
| Tap water (RoW)| tap water production, conventional treatment | Ecoinvent 3 |
| Potassium hydroxide (RoW)| production | Ecoinvent 3 |
| Urea, as N (RoW)| production | Ecoinvent 3 |
| Argon, liquid (RoW)| production | Ecoinvent 3 |
| Hay (RoW)| production & Hay, organic, intensive (RoW)| production (averaged) | Ecoinvent 3 |
| Propane (RoW)| natural gas production | Ecoinvent 3 |
| Sulfur (RoW)| natural gas production & Sulfur (RoW)| petroleum refinery operation (averaged) | Ecoinvent 3 |
| Transport, combination truck, average fuel mix | USLCI |
| Diesel, combusted in industrial equipment | USLCI |
| Acetic acid, at plant | USLCI |
| Polyethylene, high density, resin, at plant, CTR & Recycled postconsumer HDPE pellet (averaged) | USLCI |
References
- Bonamente, E.; Scrucca, F.; Rinaldi, S.; Merico, M.C.; Asdrubali, F.; Lamastra, L. Environmental impact of an Italian wine bottle: Carbon and water footprint assessment. Sci. Total Environ. 2016, 560, 274–283. [Google Scholar] [CrossRef] [PubMed]
- Bosco, S.; Di Bene, C.; Galli, M.; Remorini, D.; Massai, R.; Bonari, E. Greenhouse gas emissions in the agricultural phase of wine production in the Maremma rural district in Tuscany, Italy. Ital. J. Agron. 2011, 6, 15. [Google Scholar] [CrossRef]
- Fusi, A.; Guidetti, R.; Benedetto, G. Delving into the environmental aspect of a Sardinian white wine: From partial to total life cycle assessment. Sci. Total Environ. 2014, 472, 989–1000. [Google Scholar] [CrossRef] [PubMed]
- Iannone, R.; Miranda, S.; Riemma, S.; De Marco, I. Improving environmental performances in wine production by a life cycle assessment analysis. J. Clean. Prod. 2016, 111, 172–180. [Google Scholar] [CrossRef]
- Gazulla, C.; Raugei, M.; Fullana-i-Palmer, P. Taking a life cycle look at crianza wine production in Spain: Where are the bottlenecks? Int. J. Life Cycle Assess. 2010, 15, 330–337. [Google Scholar] [CrossRef]
- Meneses, M.; Torres, C.M.; Castells, F. Sensitivity analysis in a life cycle assessment of an aged red wine production from Catalonia, Spain. Sci. Total Environ. 2016, 562, 571–579. [Google Scholar] [CrossRef] [PubMed]
- Vázquez-Rowe, I.; Villanueva-Rey, P.; Moreira, M.T.; Feijoo, G. Environmental analysis of Ribeiro wine from a timeline perspective: Harvest year matters when reporting environmental impacts. J. Environ. Manag. 2012, 98, 73–83. [Google Scholar] [CrossRef] [PubMed]
- Neto, B.; Dias, A.C.; Machado, M. Life cycle assessment of the supply chain of a Portuguese wine: From viticulture to distribution. Int. J. Life Cycle Assess. 2013, 18, 590–602. [Google Scholar] [CrossRef]
- Navarro, A.; Puig, R.; Kılıç, E.; Penavayre, S.; Fullana-i-Palmer, P. Eco-innovation and benchmarking of carbon footprint data for vineyards and wineries in Spain and France. J. Clean. Prod. 2017, 142, 1661–1671. [Google Scholar] [CrossRef]
- Vázquez-Rowe, I.; Rugani, B.; Benetto, E. Tapping carbon footprint variations in the European wine sector. J. Clean. Prod. 2013, 43, 146–155. [Google Scholar] [CrossRef]
- Amienyo, D.; Camilleri, C.; Azapagic, A. Environmental impacts of consumption of Australian red wine in the UK. J. Clean. Prod. 2014, 72, 110–119. [Google Scholar] [CrossRef]
- Barry, M. Life Cycle Assessment and the New Zealand Wine Industry: A Tool to Support Continuous Environmental Improvement; Massey University: Wellington, New Zealand, 2011. [Google Scholar]
- Point, E.; Tyedmers, P.; Naugler, C. Life cycle environmental impacts of wine production and consumption in Nova Scotia, Canada. J. Clean. Prod. 2012, 27, 11–20. [Google Scholar] [CrossRef]
- Venkat, K. Comparison of Twelve Organic and Conventional Farming Systems: A Life Cycle Greenhouse Gas Emissions Perspective. J. Sustain. Agric. 2012, 36, 620–649. [Google Scholar] [CrossRef]
- Steenwerth, K.L.; Strong, E.B.; Greenhut, R.F.; Williams, L.; Kendall, A. Life cycle greenhouse gas, energy, and water assessment of wine grape production in California. Int. J. Life Cycle Assess. 2015, 20, 1243–1253. [Google Scholar] [CrossRef]
- New York Wine & Grape Foundation New York Wines & Wineries. Available online: https://www.newyorkwines.org/ (accessed on 19 May 2018).
- Finger Lakes Visitors Connection Seneca Lake Wine Trail. Available online: http://www.visitfingerlakes.com/about-the-finger-lakes/finger-lakes-facts-information/seneca-lake/ (accessed on 25 June 2018).
- National Climatic Data Center; National Oceanic and Atmospheric Administration Climate of New York. Available online: https://www.ncdc.noaa.gov/climatenormals/clim60/states/Clim_NY_01.pdf (accessed on 26 June 2018).
- WorldReach Marketing Wine Grape Varieties, Riesling Grape. Available online: http://www.wine-road.com/education/grape-varieties/riesling-grape.php (accessed on 25 June 2018).
- Simons, S.-A. Finger Lakes Wineries Slowly Reaping Benefits of Solar Switch. Available online: http://innovationtrail.org/post/watch-finger-lakes-wineries-slowly-reaping-benefits-solar-switch (accessed on 7 June 2018).
- New York State Energy Research & Development Authority NY-Sun. Available online: https://www.nyserda.ny.gov/All-Programs/Programs/NY-Sun (accessed on 7 June 2018).
- Solar Energy Industries Association. Finger Lakes Wine Region to Receive SEIA’s Solar Champion Award; Solar Energy Industries Association: Branchport, NY, USA, 2015. [Google Scholar]
- Benedetto, G. The environmental impact of a Sardinian wine by partial Life Cycle Assessment. Wine Econ. Policy 2013, 2, 33–41. [Google Scholar] [CrossRef]
- International Organization for Standardization. ISO 14040 Environmental Management-Life Cycle Assessment-Principles and Framework; ISO: Geneva, Switzerland, 2006. [Google Scholar]
- International Organization for Standardization. ISO 14044 Environmental Management-Life Cycle Assessment-Requirements and Guidelines; ISO: Geneva, Switzerland, 2006. [Google Scholar]
- Ferrara, C.; De Feo, G. Life Cycle Assessment Application to the Wine Sector: A Critical Review. Sustainability 2018, 10, 395. [Google Scholar] [CrossRef]
- Hsu, D.D.; O’Donoughue, P.; Fthenakis, V.; Heath, G.A.; Kim, H.C.; Sawyer, P.; Choi, J.-K.; Turney, D.E. Life Cycle Greenhouse Gas Emissions of Crystalline Silicon Photovoltaic Electricity Generation. J. Ind. Ecol. 2012, 16, S122–S135. [Google Scholar] [CrossRef]
- Sampaio, A.P.C.; Men de Sá, M.; Castro, A.L.A.; de Figueirêdo, M.C.B. Life cycle assessment from early development stages: The case of gelatin extracted from tilapia residues. Int. J Life Cycle Assess. 2017, 22, 767–783. [Google Scholar] [CrossRef]
- US National Environmental Protection Agency. Power Profiler. Available online: https://www.epa.gov/energy/power-profiler (accessed on 7 June 2018).
- Rugani, B.; Vázquez-Rowe, I.; Benedetto, G.; Benetto, E. A comprehensive review of carbon footprint analysis as an extended environmental indicator in the wine sector. J. Clean. Prod. 2013, 54, 61–77. [Google Scholar] [CrossRef]
- Liu, J.; Shonnard, D.R. Life Cycle Carbon Footprint of Ethanol and Potassium Acetate Produced from a Forest Product Wastewater Stream by a Co-Located Biorefinery. ACS Sustain. Chem. Eng. 2014, 2, 1951–1958. [Google Scholar] [CrossRef]


| Variable Parameter | Minimum | Baseline | Maximum | Units |
|---|---|---|---|---|
| Mass of fungicide | 2.699 | 3.175 | 3.651 | kg year−1 |
| Mass of pesticide | 1.361 | 4.309 | 7.257 | kg year−1 |
| Number of fungicide applications | 4 | 6.5 | 9 | unitless |
| Number of pesticide applications | 2 | 2.5 | 3 | unitless |
| Mass of hay | 21,591 | 25,401 | 29,211 | kg year−1 |
| Area of vineyard | 2.43 | 2.83 | 3.24 | ha |
| Mass of harvest | 5716 | 6725 | 7734 | kg ha−1 year−1 |
| Mass of grape per bottle | 0.964 | 1.134 | 1.304 | kg bottle−1 |
| Distance to crush pad | 0.155 | 0.183 | 0.210 | km |
| Distance to compost bin | 0.233 | 0.274 | 0.316 | km |
| Fraction of pomace | 0.0255 | 0.0300 | 0.0345 | unitless |
| Mass of propylene glycol | 62.12 | 73.08 | 84.04 | kg year−1 |
| Mass of yeast | 4.356 | 5.125 | 5.894 | kg year−1 |
| Mass of Argon gas | 89.87 | 105.73 | 121.59 | kg year−1 |
| Number of filters | 233.75 | 275.00 | 316.25 | filters year−1 |
| Mass of empty bottle | 0.440 | 0.445 | 0.450 | kg bottle−1 |
| Distance to bottling facility | 2.05 | 2.41 | 2.78 | km |
| Distance transportation of bottle | 45.35 | 47.91 | 50.48 | km |
| Electricity usage by winery | 22,193 | 26,109 | 28,233 | kWh year−1 |
| Impact of electricity from solar panels | 0.026 | 0.045 | 0.183 | kg CO2eq kWh−1 |
| Impact of electricity from grid (NY) | 0.148 | 0.174 | 0.200 | kg CO2eq kWh−1 |
| Compound | Compound Type | Minimum | Baseline | Maximum | Units |
|---|---|---|---|---|---|
| Sniper (Loveland Products, Inc., Loveland, CO, USA) | Pesticide | 0.22 | 0.35 | 0.44 | kg ha−1 |
| Danitol (Valent BioSciences, LLC., Dublin, CA, USA) | Pesticide | 0.12 | 0.17 | 0.25 | kg ha−1 |
| Captan (Arysta LifeScience Corp., Cary, NC, USA) | Fungicide | 2.37 | 2.79 | 3.21 | kg ha−1 |
| Revus Top (Syngenta International AG, Basel, Switzerland) | Fungicide | 0.12 | 0.15 | 0.17 | kg ha−1 |
| Rampart (Loveland Products, Inc., Loveland, CO, USA) | Fungicide | 3.39 | 6.77 | 10.18 | kg ha−1 |
| Roper (Loveland Products, Inc., Loveland, CO, USA) | Fungicide | 1.68 | 3.09 | 4.47 | kg ha−1 |
| Variable Parameter | Minimum | Baseline | Maximum | Units |
|---|---|---|---|---|
| Number of pesticide applications | 1 | 2 | 2 | unitless |
| Number of fertilizer applications | 6 | 7 | 8 | unitless |
| Number of fungicide applications | 2 | 5 | 8 | unitless |
| Mass of pesticide | 0.346 | 0.519 | 0.692 | kg ha−1 |
| Mass of fungicide | 7.59 | 12.82 | 18.06 | kg ha−1 |
| Application rate of Borosol | 4.67 | 8.18 | 11.69 | L ha−1 |
| Application rate of Lokomotive | 4.67 | 11.69 | 18.71 | L ha−1 |
| Calculated impact of Lokomotive | 0.908 | 1.089 | 1.264 | kg CO2eq kg−1 |
| Calculated impact of Borosol | 0.260 | 0.314 | 0.369 | kg CO2eq kg−1 |
| Area of vineyard | 18.2 | 19.2 | 20.2 | ha |
| Mass of harvest | 4483 | 7846 | 11,208 | kg ha−1 year−1 |
| Mass of grape per bottle | 0.91 | 1.20 | 1.36 | kg bottle−1 |
| Distance to crush pad | 0.16 | 0.28 | 0.40 | km |
| Distance to field | 0.18 | 0.20 | 0.23 | km |
| Fraction of pomace | 0.10 | 0.11 | 0.12 | unitless |
| Mass of bentonite | 38.56 | 45.36 | 52.16 | kg year−1 |
| Mass of propylene glycol | 88.4 | 104.0 | 119.6 | kg year−1 |
| Mass of sugar | 3856 | 4536 | 5216 | kg year−1 |
| Mass of yeast | 0.00016 | 0.00019 | 0.00022 | kg bottle−1 |
| Mass of nitrogen gas | 908 | 1044 | 1200 | kg year−1 |
| Mass of CO2 gas | 1346 | 1514 | 1682 | kg year−1 |
| Number of filters | 1700 | 2000 | 2300 | filters year−1 |
| Mass of empty bottle | 0.49 | 0.50 | 0.51 | kg bottle−1 |
| Distance to transport empty bottle | 337 | 1320 | 4200 | km |
| Electricity usage by winery | 133,950 | 141,000 | 148,050 | kWh year−1 |
| Impact of electricity from solar | 0.026 | 0.045 | 0.183 | kg CO2eq kWh−1 |
| Impact of electricity from grid (NY) | 0.148 | 0.174 | 0.200 | kg CO2eq kWh−1 |
| Variable Parameter | Minimum | Baseline | Maximum | Units |
|---|---|---|---|---|
| Mass of sulfur (fungicide) | 1166 | 1372 | 1578 | kg year−1 |
| Mass of hay | 129,546 | 152,407 | 175,269 | kg year−1 |
| Area of vineyard | 41.3 | 48.6 | 49.0 | ha |
| Lifetime of pattern tile | 50 | 75 | 100 | years |
| Mass of harvest | 6725 | 12,329 | 17,934 | kg ha−1 year−1 |
| Mass of grape per bottle | 0.9550 | 1.1235 | 1.2920 | kg bottle−1 |
| Distance to crush pad | 1.163 | 1.368 | 1.573 | km |
| Distance to compost bin | 0.181 | 0.213 | 0.245 | km |
| Fraction of pomace | 0.1751 | 0.2060 | 0.2369 | unitless |
| Mass of yeast | 11.57 | 13.61 | 15.65 | kg year−1 |
| Mass of gelatin | 0.000064 | 0.000075 | 0.000086 | kg bottle−1 |
| Number of filters | 47.6 | 56 | 64.4 | filters year−1 |
| Mass of empty bottle | 0.425 | 0.445 | 0.475 | kg bottle−1 |
| Distance to transport empty bottle | 41.04 | 41.68 | 45.38 | km |
| Mass of propane | 24,463 | 28,780 | 33,097 | kg year−1 |
| Electricity usage by winery | 110,466 | 129,960 | 149,454 | kWh year−1 |
| Impact of electricity from solar panels | 0.026 | 0.045 | 0.183 | kg CO2eq kWh−1 |
| Impact of electricity from grid (NY) | 0.1480 | 0.1741 | 0.2002 | kg CO2eq kWh−1 |
| Characteristic | Small Winery | Medium Winery | Large Winery |
|---|---|---|---|
| Annual wine production volume | Approximately 21,000 bottles year−1 | 68,000 to 190,000 bottles year−1 | 291,000 to 775,000 bottles year−1 |
| Capacity of on-site solar array | 28 kW | 151 kW | 93 kW |
| Fertilizers used | Timothy hay; compost | Borosol; Lokomotive | Timothy hay; compost |
| Fungicide and pesticide life cycle inventories used in the model | “Undefined” pesticides to capture general pesticides | Captan | Sulfur |
| Pomace management | Composted on-site | Deposited on nearby field (~0.2 km away) | Composted on-site |
| Source of bottles | Local manufacturer | Various locations (337 to 4200 km from winery) | Local manufacturer |
| Bottling location | Off-site facility (approximately 2.41 km from winery) | On-site | On-site |
| On-site grape production for wines | 80% of production from on-site grapes | 100% of production from on-site grapes | 100% of production from onsite grapes |
© 2019 by the authors. Licensee MDPI, Basel, Switzerland. This article is an open access article distributed under the terms and conditions of the Creative Commons Attribution (CC BY) license (http://creativecommons.org/licenses/by/4.0/).
Share and Cite
Trombly, A.J.; Fortier, M.-O.P. Carbon Footprint of Wines from the Finger Lakes Region in New York State. Sustainability 2019, 11, 2945. https://doi.org/10.3390/su11102945
Trombly AJ, Fortier M-OP. Carbon Footprint of Wines from the Finger Lakes Region in New York State. Sustainability. 2019; 11(10):2945. https://doi.org/10.3390/su11102945
Chicago/Turabian StyleTrombly, Amanda J., and Marie-Odile P. Fortier. 2019. "Carbon Footprint of Wines from the Finger Lakes Region in New York State" Sustainability 11, no. 10: 2945. https://doi.org/10.3390/su11102945
APA StyleTrombly, A. J., & Fortier, M.-O. P. (2019). Carbon Footprint of Wines from the Finger Lakes Region in New York State. Sustainability, 11(10), 2945. https://doi.org/10.3390/su11102945