Article

Regional Integration in the Inter-City Technology Transfer System of the Yangtze River Delta, China

1
Institute for global Innovation and Development, East China Normal University, Shanghai 200062, China
2
School of Urban and Regional Science, East China Normal University, Shanghai 200241, China
*
Authors to whom correspondence should be addressed.
Sustainability 2019, 11(10), 2941; https://doi.org/10.3390/su11102941
Submission received: 15 April 2019 / Revised: 7 May 2019 / Accepted: 20 May 2019 / Published: 23 May 2019
(This article belongs to the Special Issue Metropolitan Geographies and Sustainable Regional Development)

Abstract

:
Recently, the Chinese government decided to support the integrated development of the Yangtze River Delta (YRD) in a national strategic way. On this background, this paper investigates the regional integration in the technology transfer system of the YRD based on patent transfer from three levels: overall, technology supply chain, and technology sales chain. It also uses the modularity maximization method to detect the community structure of the inter-city patent transfer network in China. The results show that regional integration of the technology transfer system of the YRD at both overall level and technology supply chain level had not been realized up to 2015, but had been achieved at the technical sales chain level. Technology flow in the YRD was increasingly moving across the border, and the intra-region technology transfer network was increasingly unable to meet the needs of technological development of the cities in the YRD. This paper has several limitations concerning the representativeness of patent data, the manifestation of patent data in technological transfer and international comparison.

1. Introduction

Recently, regional integration is increasingly regarded as a tool for reaping the benefits and countering the negative impacts of globalization. Although globalization is often considered as a worldwide phenomenon of regional integration [1], we have to admit that the core-periphery structure of global economy under globalization is becoming more prominent [2,3,4], which means that marginal countries or regions are being more marginalized [5,6,7]. Beginning with the elimination of trade barriers between countries in the same region to achieve economic integration [8], regional integration has been putting emphasis on promoting the economic development of developing and underdeveloped regions [9,10,11,12], and narrowing the gap of internal development within a country [13,14], especially in China [15,16,17,18].
Regional integration has been used by the Chinese government both at the national and local level as a main policy tool to deal with the development gap within specific region [15,17,18]. Obviously, there has been a significant increase in the literature documenting the regional integration in China in recent years, within which the YRD is an important example [19,20,21,22]. At the just-concluded China First International Import Expo, Chinese President Xi Jinping pointed out that the Chinese government decided to support the integrated development of the YRD in a national strategic way. Regardless of inter-country or intra-country integration, existing studies mainly explain integration in terms of trade costs, investment costs, and transportation costs [23,24]. Few attentions have been paid to discover the regional integration from the perspective of technology flows.
The purpose of this paper is to understand the YRD’s regional integration by describing a technology trading market-based integration based on patent transfer. Technology transfer (transaction) is one of the core research topics in the fields of management, economics and science & technology policy. Research on technology transfer originated from the problems highlighted in the international technology transfer, which was dominated by multinational corporations in the 1960s and 1970s [25,26]. With universities and research institutions, such as laboratories, playing a more important role, there are more concerns about the technology transfer between universities and enterprises within a country [27,28,29,30]. Through these works, a large number of inter- or intra-regional technology transfer issues within a country charactering by patent transactions including licensing or transferring were widely revealed [22,31,32,33,34]. However, empirical studies at the city level have not been observed so far.
The objective of this paper is achieved in the following three consecutive steps. First, we construct the inter-city patent transfer network by identifying the address information of each patent’s assignor and assignee, thereby enabling the analysis of technical flows on a city scale. Secondly, we use the network community detection technology to examine whether the YRD is an internally connected community in China’s inter-city technology transfer network. Third, by constructing the internal and external inter-city technology transfer network of the YRD, we discuss the integration process in the technology transfer system of the YRD from the perspective of technology supply chain and technology sales chain respectively.
The paper is organized as follows. The second section provides a general discussion of concepts and measures of regional integration, and the practice of the YRD in regional integration, followed by data and methods in Section 3. The subsequent results section consists of three parts, which are a network community detection for China’s inter-city patent transfer network and discussions of integration in technology supply chain and technology sales chain of the YRD. The final section concludes with a discussion about the major findings, policy implications and suggestions for future studies.

2. Theoretical Framework

2.1. Regional Integration: Concepts and Measures

Regional integration has been in full swing throughout the world. As of 1 May 2018, 673 regional trade agreements (RTAs) have been notified to the World Trade Organization (WTO), of those some 287 were in force. But when talking about regional integration, we first think of the European Union (EU), which is a particularly successful case [1,35]. Although the Brexit will hinder the EU integration process in some respects, it is undeniable that the process of global economic integration is still accelerating, as evidenced by the increasing regional trade agreements. Other good examples are the North American Free Trade Agreement (NAFTA), the Asia-Pacific Economic Cooperation (APEC) and the Association of Southeast Asian Nations (ASEAN) [36,37,38]. According to the five levels of regional integration commonly discussed in the management literature, the EU is the only one at the fourth level (economic union) and is moving towards the fifth level (political union) [1,8]. Here, we need to explore the concepts and measurements of regional integration, and that is, what is regional integration and how to measure it? In fact, the theoretical development of regional integration is inseparable from the practice of EU integration, and the EU is also supporting the integration of other parts of the world with its own experiences [1,38,39]. The establishment of the European Economic Community (EEC) in 1957 achieved the market integration of six countries (France, Germany, Italy, Belgium, The Netherlands, and Luxembourg), which greatly promoted trades and investments among member countries. At that time, the goal of regional integration was to remove barriers to free trade in that region, promoting the free flow of people, labor, goods, and capital [8], which is still the goal that many regions of the world are struggling for in their regional integration [9,10,11,12]. The official establishment of the EU in 1993 and the issuance of euro banknotes and coins in 2002 made that the goal of regional integration, in addition to eliminating trade barriers, was to achieve economic policy reunification.
While there is little controversy over the concepts of regional integration, empirical studies trying to quantify the integration face major problems. In general, although various studies have used a time trend to describe integration process, it is still difficult to operationalize it [1]. The observation indicator, which is widely used in regional integration evaluation systems, such as the European Central Bank Index (ECBI), the Asia-Pacific Regional Cooperation and Integration Index (APRCII), and the Africa Regional Integration Index (ARII), is the intra-region trade share. Besides, regional integration evaluation systems also track the integration processes of intra-regional commodity supply chains and intra-regional commodity markets from the intra-regional trade import share and intra-regional trade export share respectively [12,40]. According to the Eurostat (https://ec.europa.eu/eurostat/statistics-explained/index.php/Intra-EU_trade_in_goods_-_recent_trends#Evolution_of_intra-EU_trade_in_goods:_2002-2018), the EU Member States as a whole have more traded goods with other Member States than with countries outside the EU. The continuous exchange of over 60% of the intra-regional trade is also strong evidence of EU integration. As a result, the measures of integration can be found in the models of trade theory, particularly in New Economic Geography (NEG) models that define integration as the inverse of trade costs mainly quantified by transportation costs [23,24,41]. Of course, the NEG models also abstracts the trade costs as distance-decay functions [42,43]. With the continuous development of economic globalization, countries, regions, and cities are embedded in different levels of organizations and networks. Using social network analysis to study world city networks (WCNs), especially the network community detection for exploring the close communities in WCNs, provides theoretical innovation for regional integration measurements [44,45,46].

2.2. Integrated Development in the YRD

While benefited from globalization and regional integration, China’s economy has experienced a period of rapid development for 40 years after the reform and opening-up [47], the uneven development between regions has been a central theme of China’s inequality and the main factor that constrains China’s economic development from high-rate to high-quality [48,49,50]. Due to its outstanding contribution to narrowing the development gap within the region, regional integration has always been an effective policy tool for the Chinese government to improve the quality of regional development [15,17,18]. As the junction area of BRI (Belt and Road Initiative) and the Yangtze River Economic Belt (YREB), the YRD, one of the sixth megalopolis of the world [51], is the leading area of China in terms of innovation-driven development, industrial structure transformation and upgrading, economic restructuring, and further opening-up to the outside world [52]. In fact, it has been a long time for the integration of the YRD both at the national and at the regional level [21]. In 1992, 15 cities in the YRD established the joint meeting framework for cooperative department between cities, and the YRD Economic Coordination Society was set up in 1996. On 11 May 2016, the Executive Meeting of the State Council of China adopted the ‘Development Plan of YRD urban agglomeration (2016–2020)’, which expanded the scope of the YRD from ‘two provinces and one municipality’ (Zhejiang, Jiangsu, and Shanghai) to ‘three provinces and one municipality’ (Zhejiang, Jiangsu, Anhui and Shanghai). In January 2018, the YRD Regional Cooperation Office (YRDRCO) was jointly established by Shanghai, Zhejiang, Jiangsu and Anhui, and in June, the YRDRCO issued the ‘Three-year action plan (2018–2020) for YRD’s integrated development’. After nearly 30 years of integrated development, both at the institutional level and at the practical level, the YRD is moving towards integration in such aspects as public infrastructure, public service, industrial transfer [19,21,22]. However, relatively little attention has been paid to the integration of YRD from the perspective of technology flows. In this paper, we seek to address this research lacuna by examining the integration in patent transfer system of the YRD.

2.3. Technology Transfer and Regional Development

After experiencing a transition from space of places to space of flows, economic geography is increasingly focusing on cross-regional flows and transfers of technology [53,54]. Regional (city) economic growth is increasingly dependent on technological advancement and innovation, especially on the ability to acquire external knowledge and technology [55,56]. Inter-city technology transfer is one of the most important ways for cities to combine their local knowledge capital base with high levels of innovative regions. Evidence has shown that technology transfer can narrow regional gaps and promote the integrated development of urban agglomerations [57]. For example, international technology transfer led by multinational companies is crucial to global economic integration. In the technology transfer research literature, patent transfer is often used to measure university-industry technology transfer, international technology transfer and inter-region technology transfer [53,54,55,56,57]. This is not only because patent transfer itself is a way of technology transfer, but also because patent data is easier to obtain than other data (such as project cooperation, technical consultation, etc.).
Patent transfer records can be obtained from its legal status. The Patent Search and Analysis Database (PSAD) of the State Intellectual Property Office of China (SIPO) has been tracking and recording the legal status of each patent since 2001. In a patent transfer record, we can know the transfer time, transferor, transferee, patent type, patent application number, transferor address, transferee address of the patent. In this article, by using this information to construct the internal and external inter-city technology transfer network of the YRD, we attempt to understand the YRD’s regional integration by describing a technology trading market-based integration based on patent transfer.

3. Methods

3.1. Deriving Patent Transfer Data from SIPO

Patent transfer data from 2001 to 2015 (the research period of this paper) here was extracted and downloaded via a Python script from PSAD. By associating the zip code of the transferor and the assignee’s address with the administrative division code issued by the National Bureau of Statistics of China (NBSC), we constructed a spatial-temporal network database of China’s inter-city patent transfer. In order to exclude singular values in individual years, we segmented and aggregated the data, specifically 2001–2005 (the first period), 2006–2010 (the second period) and 2011–2015 (the third period). Given the concern of patent transfer contract privacy, our data does not contain the transfer price.

3.2. Network Construction

By using graph principles where vertices represent cities and links represent patent transfer relationships between cities, we constructed two weighted and directed networks depicting the inter-city patent transfer relations of the YRD from two perspectives, internal and external, respectively. The internal inter-city patent transfer network describing the patent transfer activities occurring within the YRD has a significant network boundary, namely the administrative boundary of the YRD (see Appendix A for a detailed description of the study area). In the internal network, there is only one kind of vertices, namely the cities in the YRD, which are abstracted as vertices set A (a1, a2, …, ai). The external inter-city patent transfer network describes the patent transfer relationships between the YRD and the outside (also in China), and the network boundaries are not clear, changing with the variations of external cities. Therefore, in the external network, there are two kinds of vertices with significant boundary attributes, one is the cities inside the YRD which are abstracted as vertices set B (b1, b2, …, bj), and the other is the cities outside the YRD, which are abstracted as vertices set C (c1, c2, …, ck). Meanwhile, in the external network, the connections only exist between nodes set A and set B, and there are no connections among set A or set B. In short, the external network is a bipartite (two-mode) network consisting of two separate nodal sets and one edge set that links the nodes in the two different sets [58].
In addition, in order to detect the position of the YRD in China’s inter-city patent transfer network and its changing trend, we also constructed the inter-city patent transfer network throughout China. Similar to the external network of the YRD, this china’s network also has two types of vertices, one is the inner cities of the YRD named set D (d1, d2, …, dl), and the other is the cities outside the YRD named set E (e1, e2, …, en). However, although nodes are classified for distinguishing the cities in the YRD from those outside the YRD, China’s inter-city patent transfer network is obviously a unipartite (single-layer or one-mode) network due to that the connections in this network exist not only between the set D and set E, but also among the vertices of set D or set E. Therefore, if the 26 cities in the YRD are regarded as the set V (v1, v2, …, vp, …, v26) as a whole, then the relationships among the set A, set B, set D and set V should be: A, B, DV, D = AB, and the relationship between set C and set E is CE.

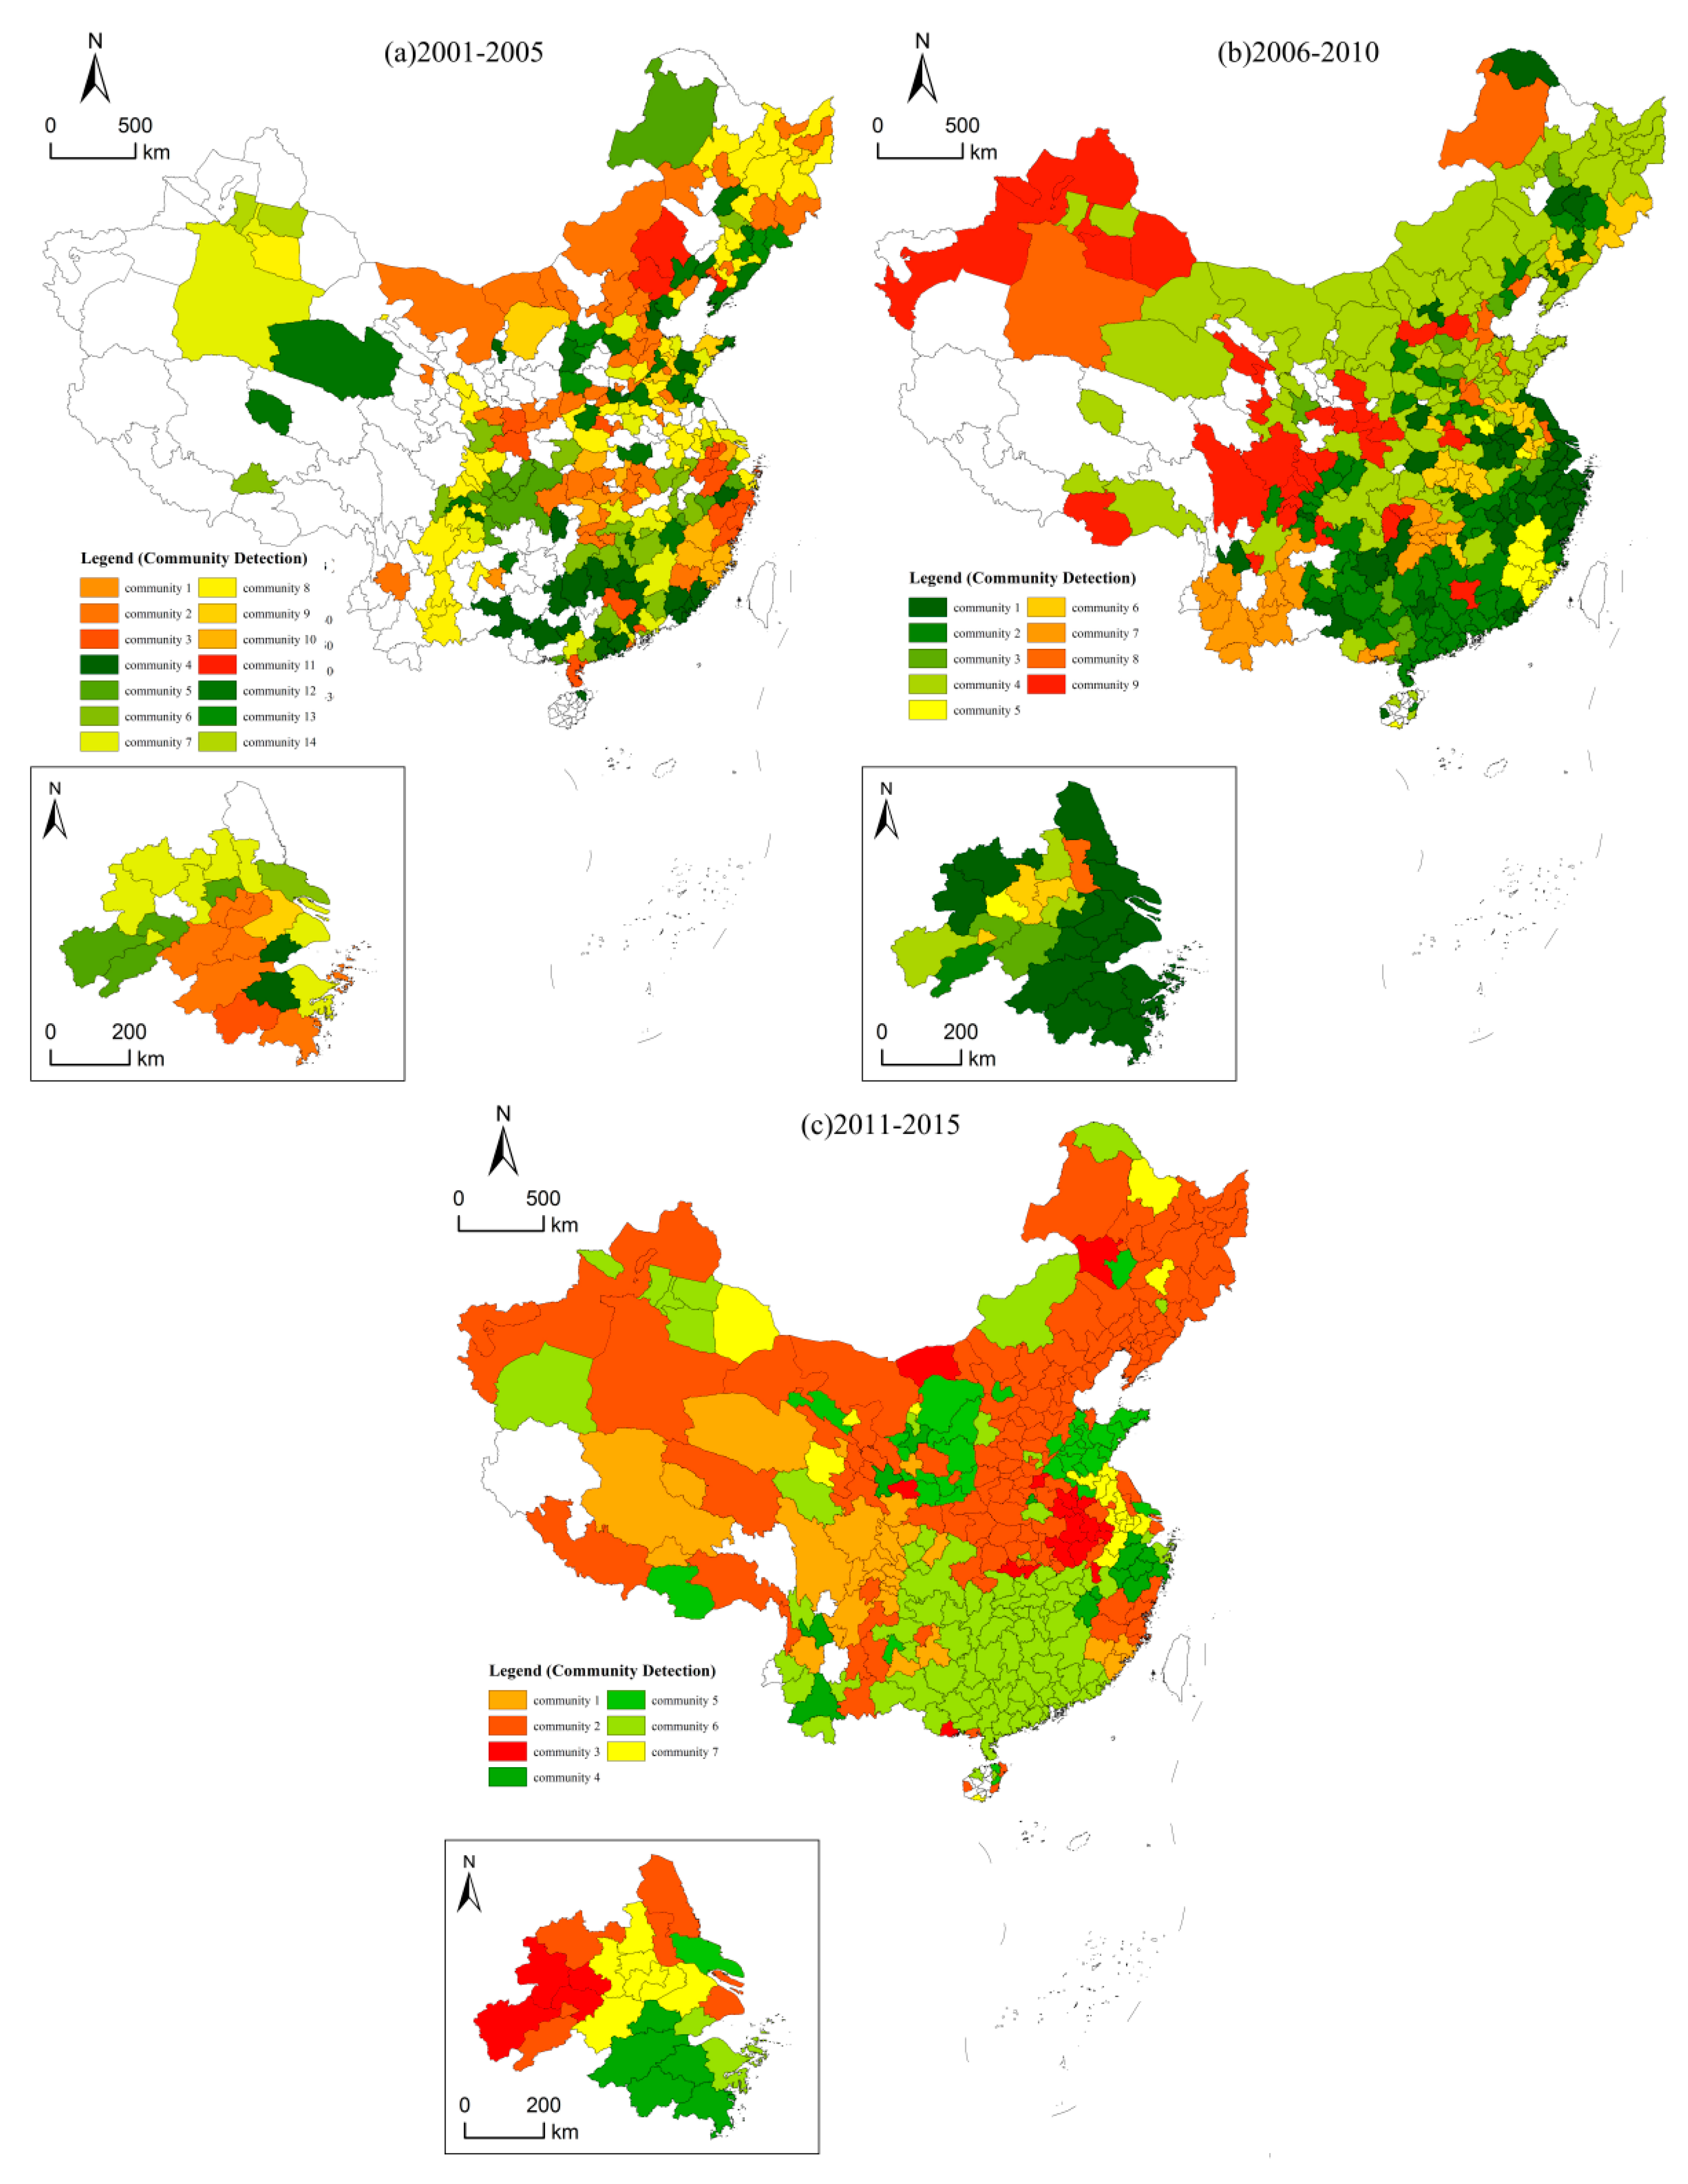
3.3. Community Detection

Community, one of the keywords in network science, is often used to describe the structural characteristics of a network—Groups of vertices within which connections are dense but between which connections are sparser [59]. Due to the outstanding contributions in understanding spatial agglomeration, industrial clusters, commodity chains, regionalism, social integration and so on [45], social network analysis centered on community detection is gradually applied to regional studies and economic geography. Especially in city network science that is booming, community detection presents to be an analytical innovation for understanding the clustering of cities [46,60]. Obviously, the concept of network community is highly consistent with regional integration, and that is, both of them emphasize the closeness of connections within the community (region) [44]. Several methods for community detection have been developed, such as minimum-cut, hierarchical clustering, Girvan-Newman algorithm, modularity maximization. Among them, due to the faster algorithm and the application to small networks without limitations, the modularity maximization method has become one of the most widely used methods for community detection [55]. In this paper, we also use the maximum modularity method to detect the community structure of the inter-city patent transfer network in China. All operations are carried out by the software of Gephi 0.9.2.

3.4. Integration Measured by Weighted Indegree Centrality and Weighted Outdegree Centrality

Inspired by the indicators commonly used in regional integration evaluation system such as intra-regional import share and intra-regional export share [40], the two most popular centrality indices (weighted indegree centrality and weighted outdegree centrality) in network theory are used to measure the integration of technology transfer system in the YRD. In the weighted and directed inter-city patent transfer network, weighted indegree centrality of a city ( C D i n w ) is defined as the number of patents that obtaining from other cities and its weighted outdegree centrality ( C D o u t w ) is the number of patents that selling to other cities. Thereby, for a city in the YRD, its weighted indegree centrality in the internal, external and China overall network can be separately defined as C D i i n w ( i A ) , C D j i n w ( j B ) and C D l i n w ( l D ) , and its weighted outdegree centrality also can be separately defined as C D i o u t w ( i A ) , C D j o u t w ( j B ) and C D l o u t w ( l D ) . In addition, due to the relationships between these three networks, for a specific city p (pV) in the YRD, we can also conclude that:
i n _ C D p C h i w = i n _ C D p i n t e r w + i n _ C D p e x t e r w
  o u t _ C D p C h i w = o u t _ C D p i n t e r w + o u t _ C D p e x t e r w
where i n _ C D p C h i w , i n _ C D p i n t e r w and i n _ C D p e x t e r w separately represent the weighted indegree centrality of city p in the China overall, internal and external network. o u t _ C D p C h i w , o u t _ C D p i n t e r w and   o u t _ C D p e x t e r w separately represent the weighted outdegree centrality of city p in the China overall, internal and external network.
According to the trade share indicators in regional integration evaluation systems, we divide the types of technology transfer activities for city p in the YRD as follows:
T p = { i n _ t o t a l _ i n p o r t , i f ( i n _ C D p i n t e r w > 0 ) a n d ( i n _ C D p e x t e r w = 0 ) o u t _ t o t a l _ i n p o r t , i f ( i n _ C D p i n t e r w = 0 ) a n d ( i n _ C D p e x t e r w > 0 ) i n _ m a i n l y _ i n p o r t , i f ( i n _ C D p i n t e r w > i n _ C D p e x t e r w > 0 ) o u t _ m a i n l y _ i n p o r t , i f ( i n _ C D p e x t e r w > i n _ C D p i n t e r w > 0 ) i n _ t o t a l _ e x p o r t , i f ( o u t _ C D p i n t e r w > 0 ) a n d ( o u t _ C D p e x t e r w = 0 ) o u t _ t o t a l _ e x p o r t , i f ( o u t _ C D p i n t e r w = 0 ) a n d ( o u t _ C D p e x t e r w > 0 ) i n _ m a i n l y _ e x p o r t , i f ( o u t _ C D p i n t e r w > o u t _ C D p e x t e r w > 0 ) o u t _ m a i n l y _ e x p o r t , i f ( o u t _ C D p e x t e r w > o u t _ C D p i n t e r w > 0 )
where In_total_input represents that for city p, its technical supply relies entirely on the interior of the YRD; Out_total_input represents that for city p, its technical supply relies entirely on the outside of the YRD. In_mainly_input represents that for city p, its technical input is mainly from the interior of the YRD; Out_mainly_input represents that for city p, its technical input is mainly from the outside of the YRD; In_total_output represents that for city p, its technical output is completely oriented to the YRD; Out_total_output represents that for city p, its technical output is completely oriented to the outside of the YRD. In_mainly_output represents that for city p, its technical output is mainly for the YRD, and Out_mainly_output represents that for city p, its technical output is mainly for the outside of the YRD.
Based on the above analysis, we can generalize the types of technology transfer of the cities in the YRD into three types (see Table 1). The first type is In-flow type, and that is, the patent input and output behavior of the city is completely (or mainly) oriented to the YRD. The second type is Out-flow type, and that is, the patent input and output behavior of the city is completely (or mainly) oriented to the outside of the YRD. And the third is Mixed-flow type, the exception of the above two types. Then, for the measurements of the integration in the technology transfer system of the YRD, we proceed from three levels: overall, technology supply chain and technology sales chain (see Table 2).

4. Results

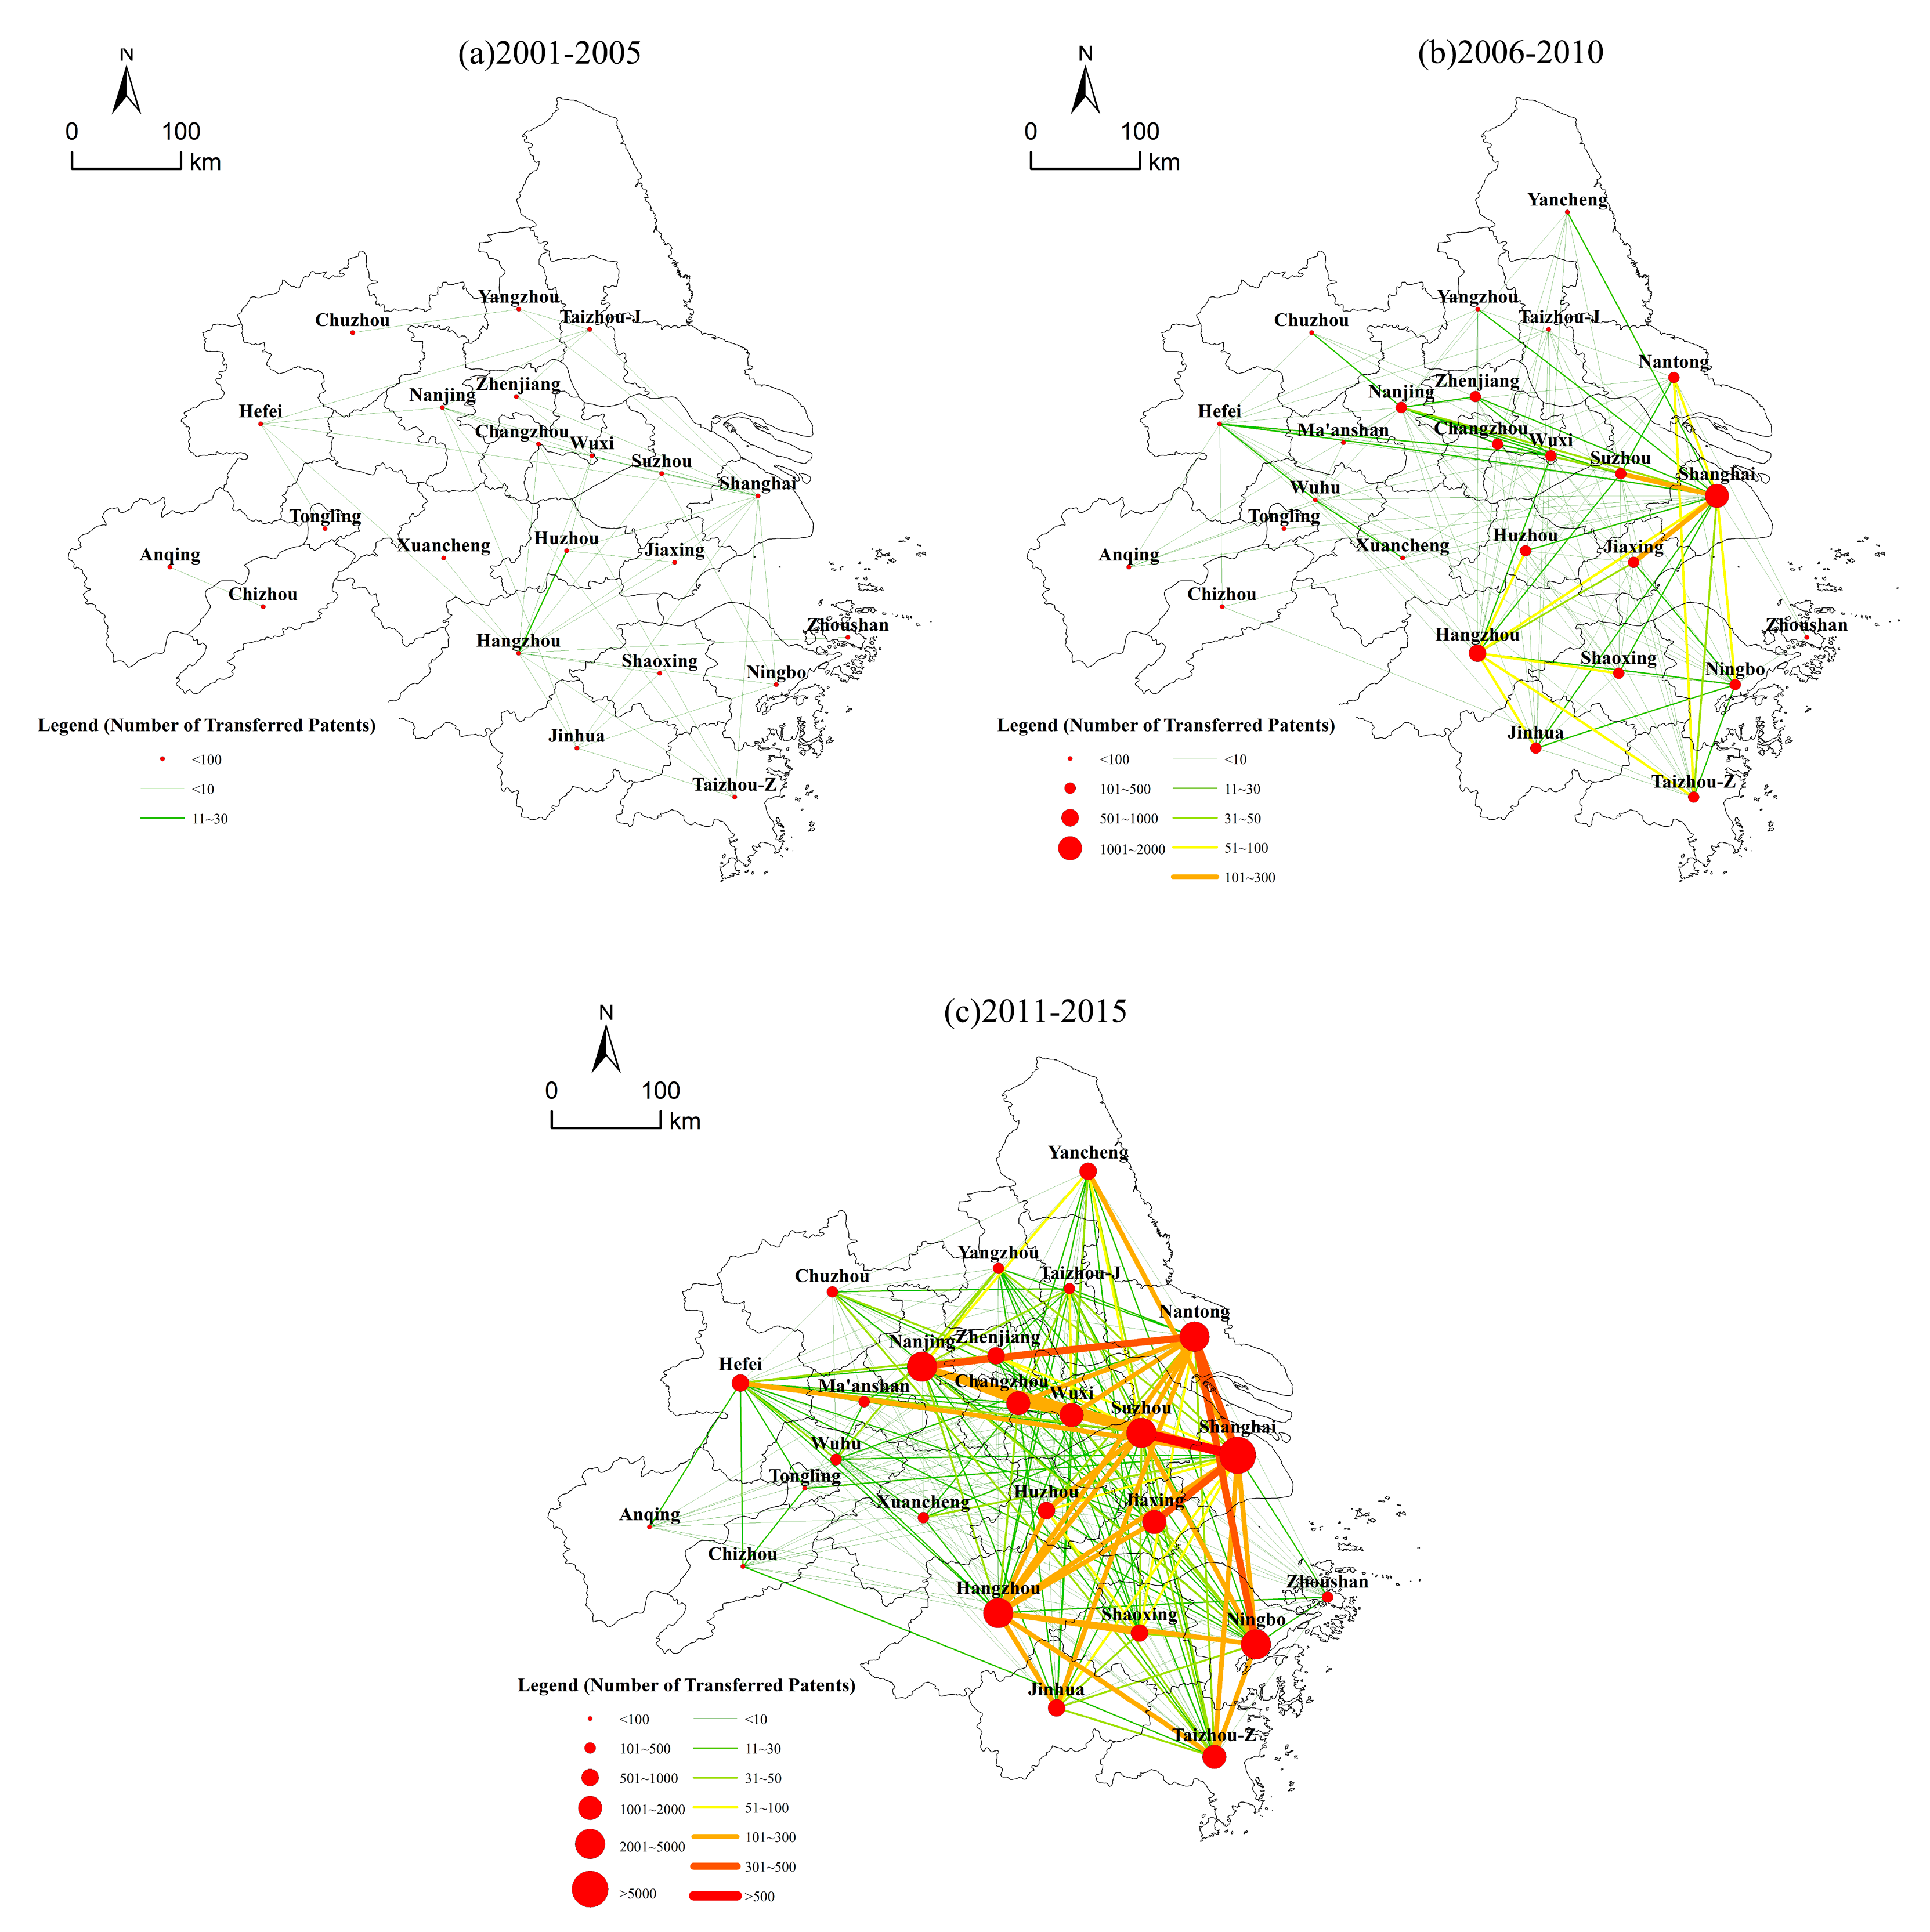
4.1. Overall Integration in Technology Transfer System of the YRD

As can be seen from Table 3, the number of cities in China’s inter-city patent transfer network increased from 239 in the first period to 347 in the third period, and the number of patents circulated in the network increased from 3147 in the first period to 104,483 in the third period. For the 26 cities in the YRD, only 2 cities in the first period were excluded, and all the cities in the second and third periods participated in China’s inter-city patent transfer network. Simultaneously, the number of patents transferred in the internal network increased rapidly from 167 in the first period to 15,707 in the third period. 4 cities in the first period were excluded, and all 26 cities in the second and third periods participated in the internal technology transfer network (see Table 3 and Figure 1).
Figure 2 shows the evolution of external inter-city patent transfer network of the YRD. The number of patents transferred in the external network increased rapidly from 1027 in the first period to 34,433 in the third period. Five cities of the YRD did not transfer patents with the outside in the first period, while in the second and third periods, all 26 cities of the YRD participated in the external network. In terms of the external cities, the number of cities outside the YRD participating in the external network increased from 68 in the first period to 278 in the third period. Overall, in the three periods, although the proportion of patents circulated in the internal network increased from 13.9% in the first period to 31.3% in the third period, the patents transferred in the external network were always greater than the patents circulated in the internal network, indicating that the integration of the patent transfer system in the YRD still needs efforts.
Evidence also can be found in the community detection results of China’s inter-city patent transfer network. Although the maximum modularity of community division in the three periods were all more than 0.4, 26 cities of the YRD did not form an independent community at the three periods. In the first period, China’s inter-city patent transfer network was divided into 14 communities, of which the largest had 49 cities and the smallest only consisted of 2 cities. 24 cities of the YRD at this period were assigned to 7 communities. In the second period, 9 communities were detected in China’s inter-city patent transfer network, of which the largest had 101 cities and the smallest consisted of 9 cities. 26 cities of the YRD at this period were also divided into 7 communities. In the third period, China’s inter-city patent transfer network was divided into 7 communities, of which 139 cities were among the largest community and the smallest community had 14 cities. 26 cities in the YRD were still divided into 6 communities at this period (see Figure 3).
In summary, although more and more YRD’s cities were divided into a community, the segmented characteristics of the YRD in China’s inter-city technology transfer system had always been maintained, showing that the integration of the YRD’s technology transfer system had not yet been realized up to 2015.

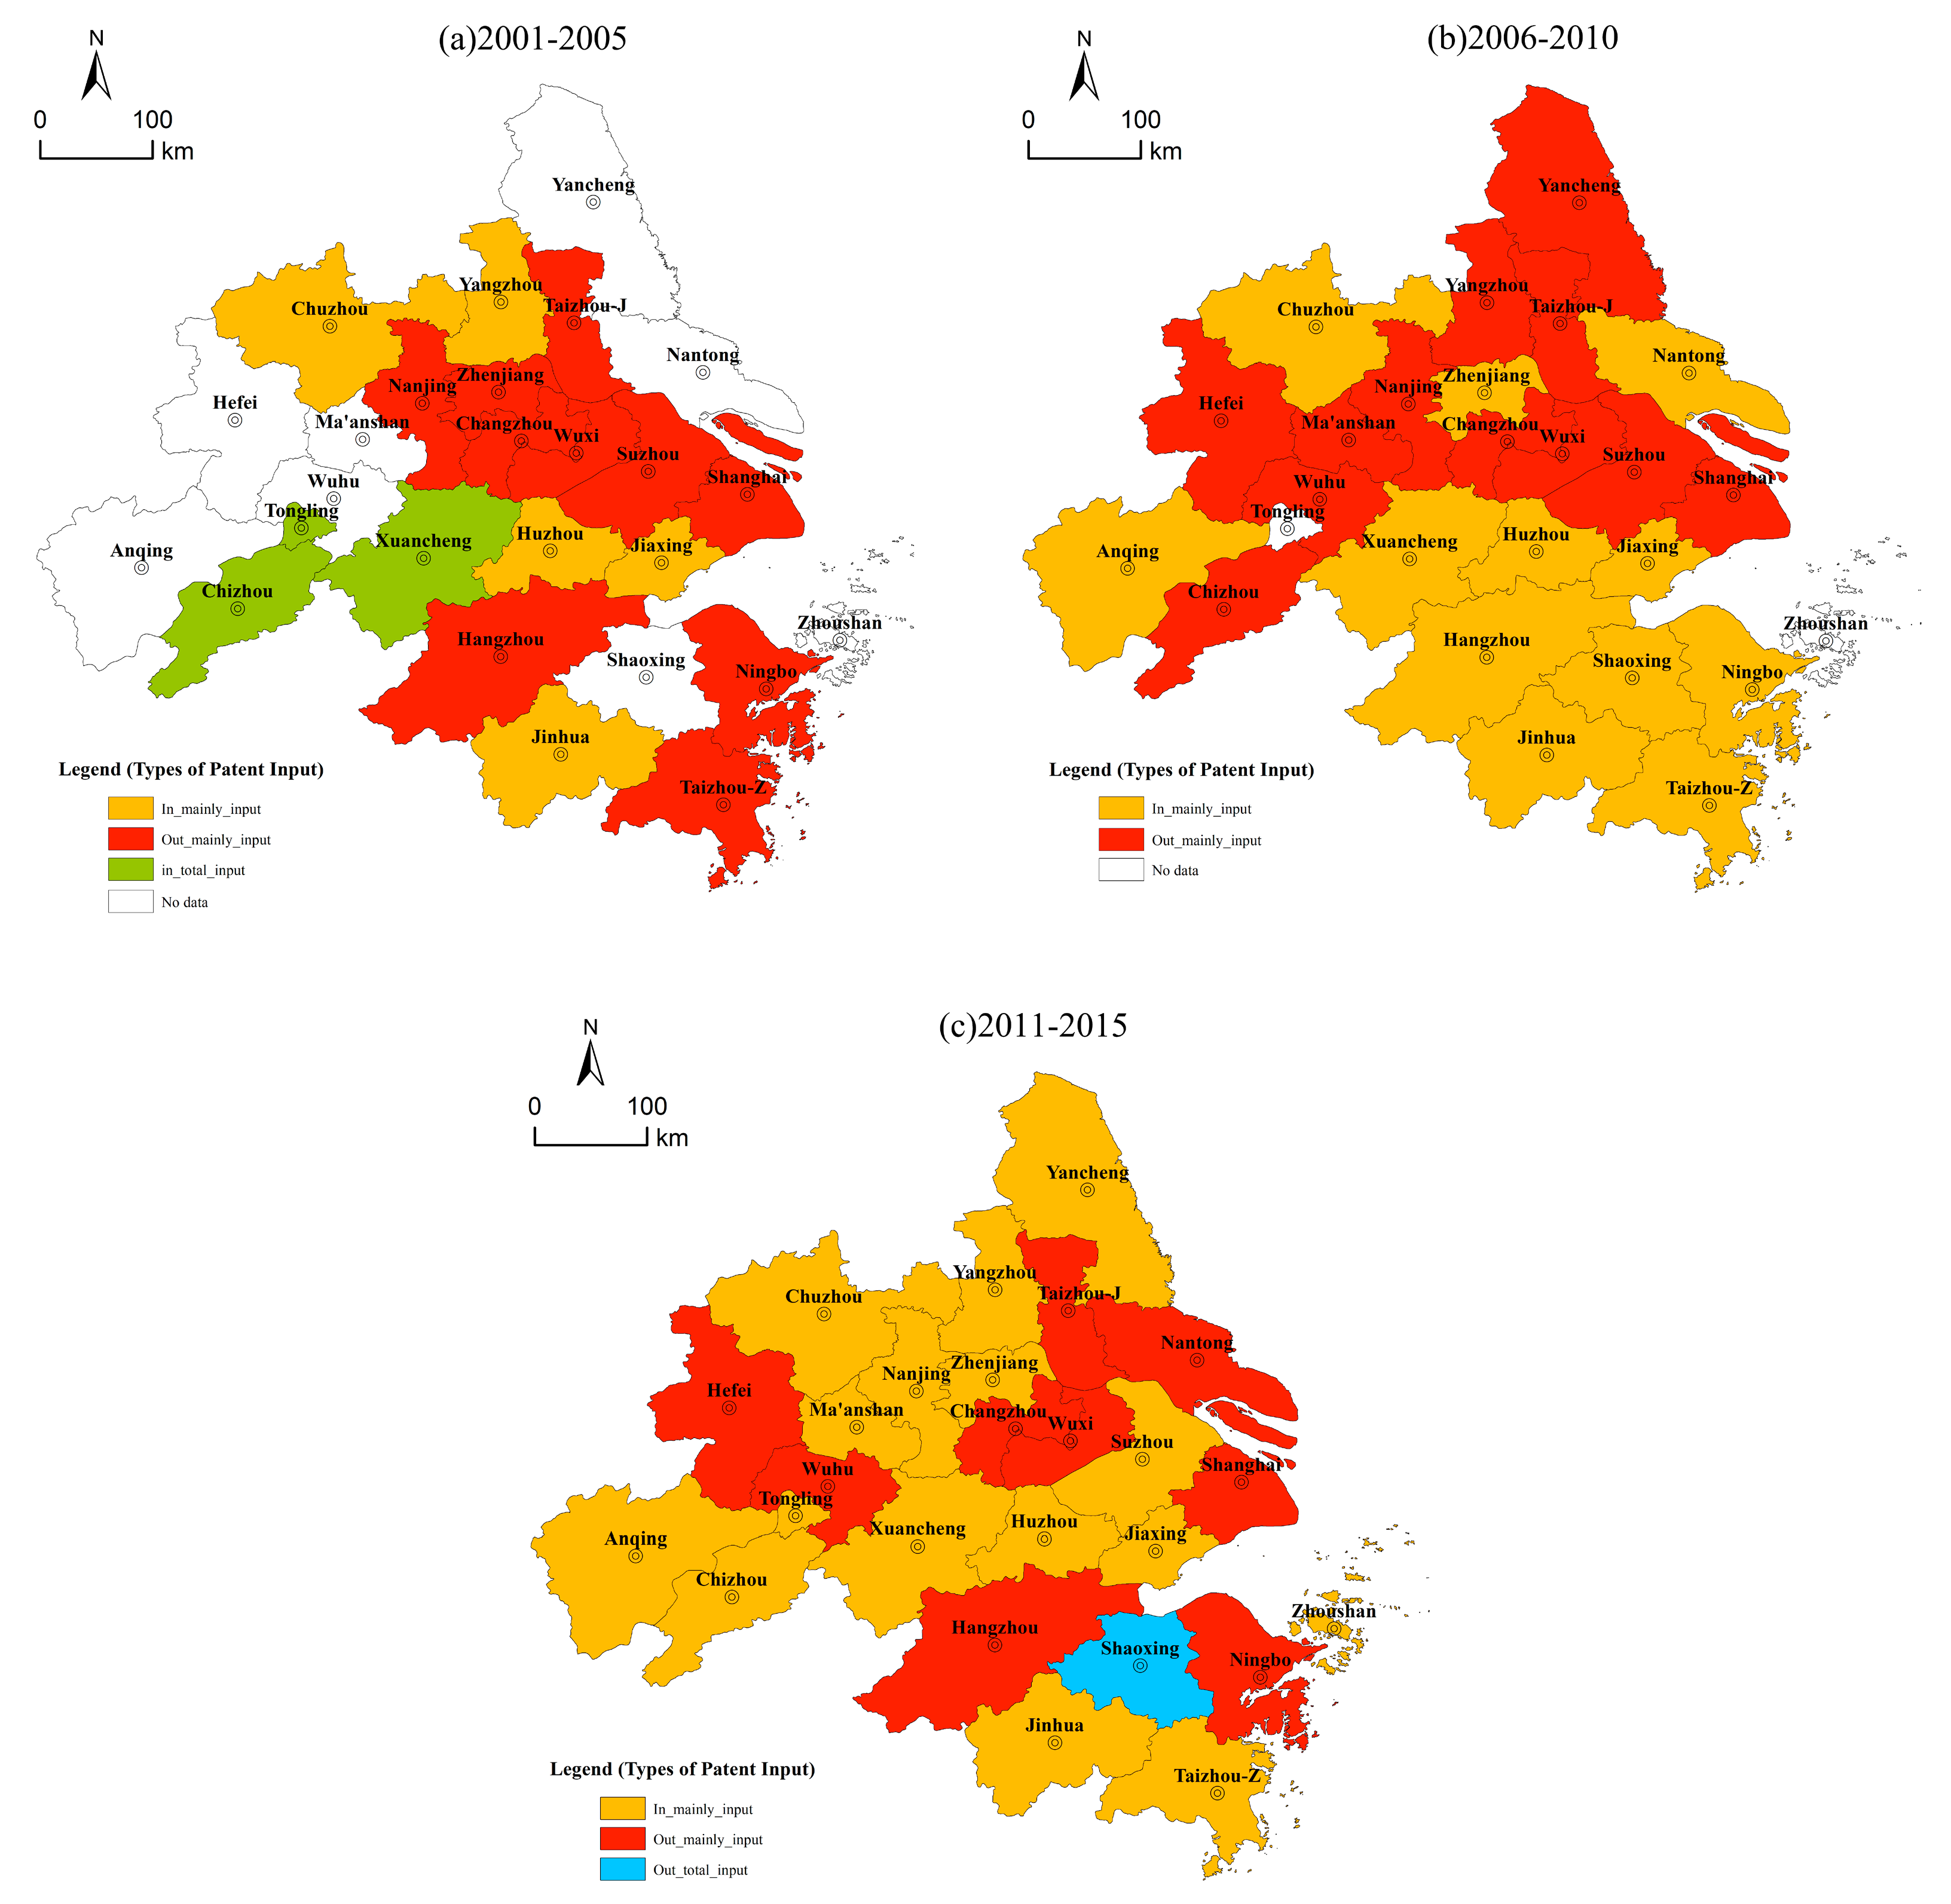
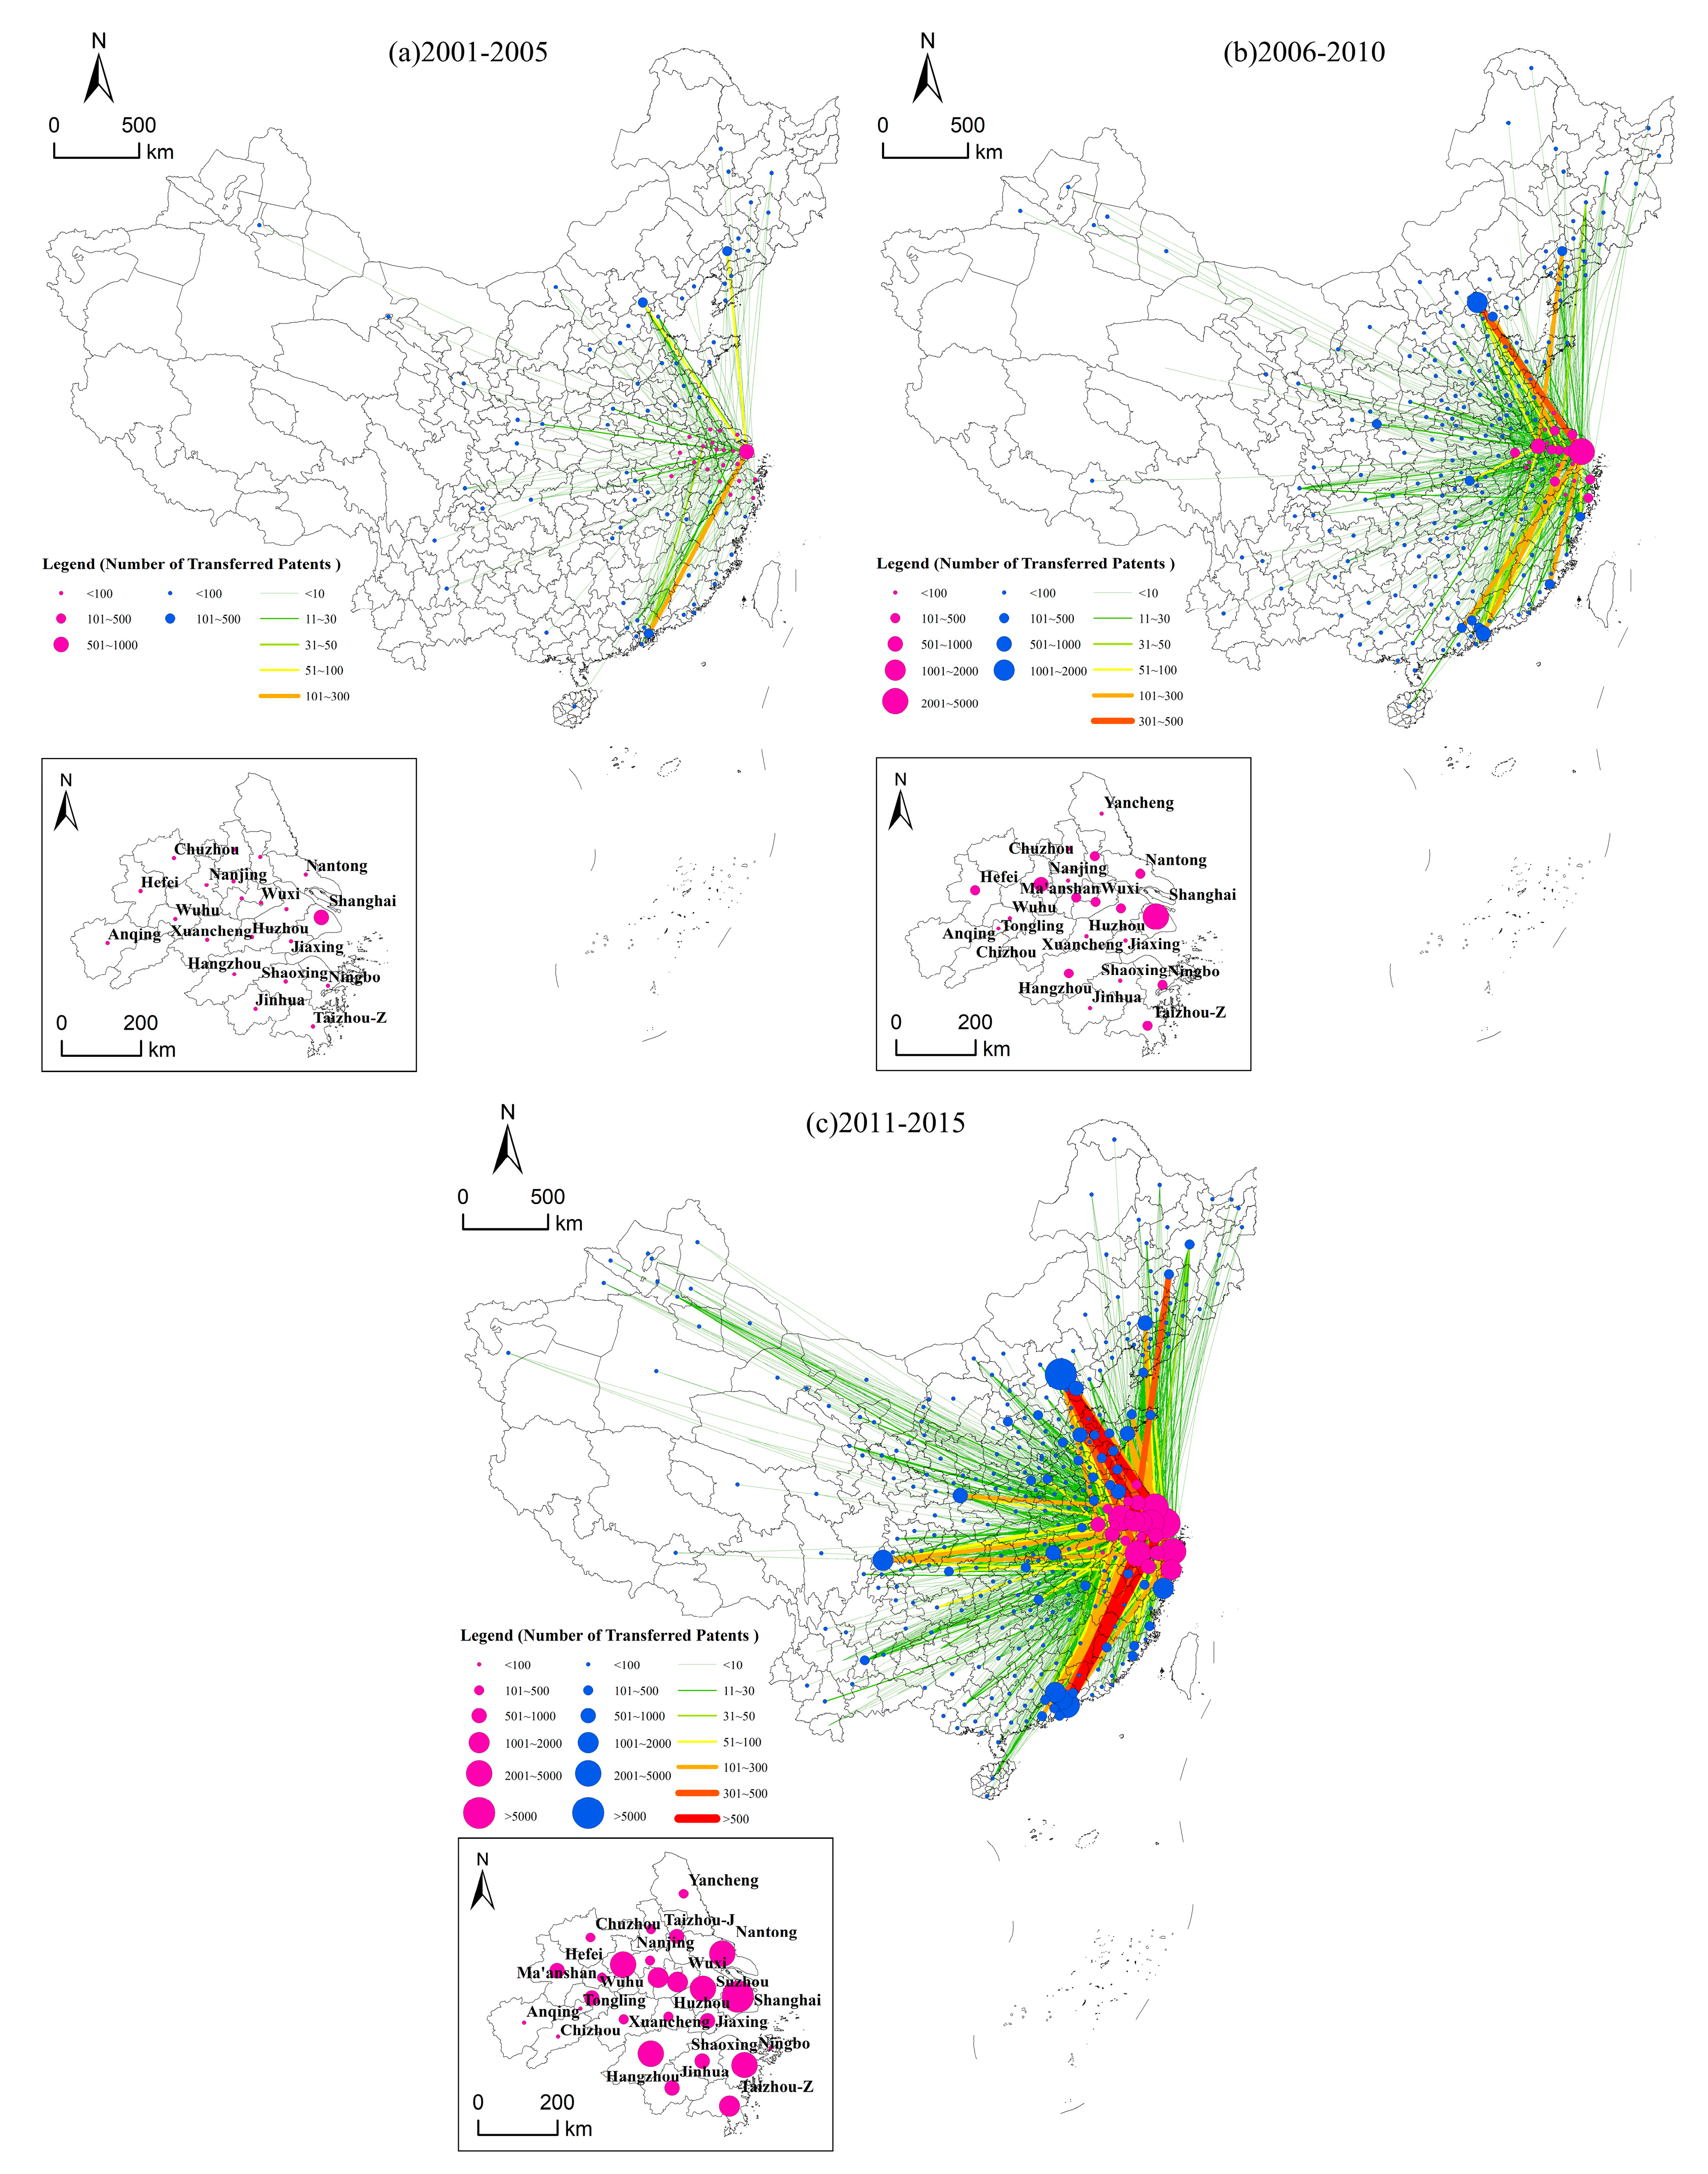
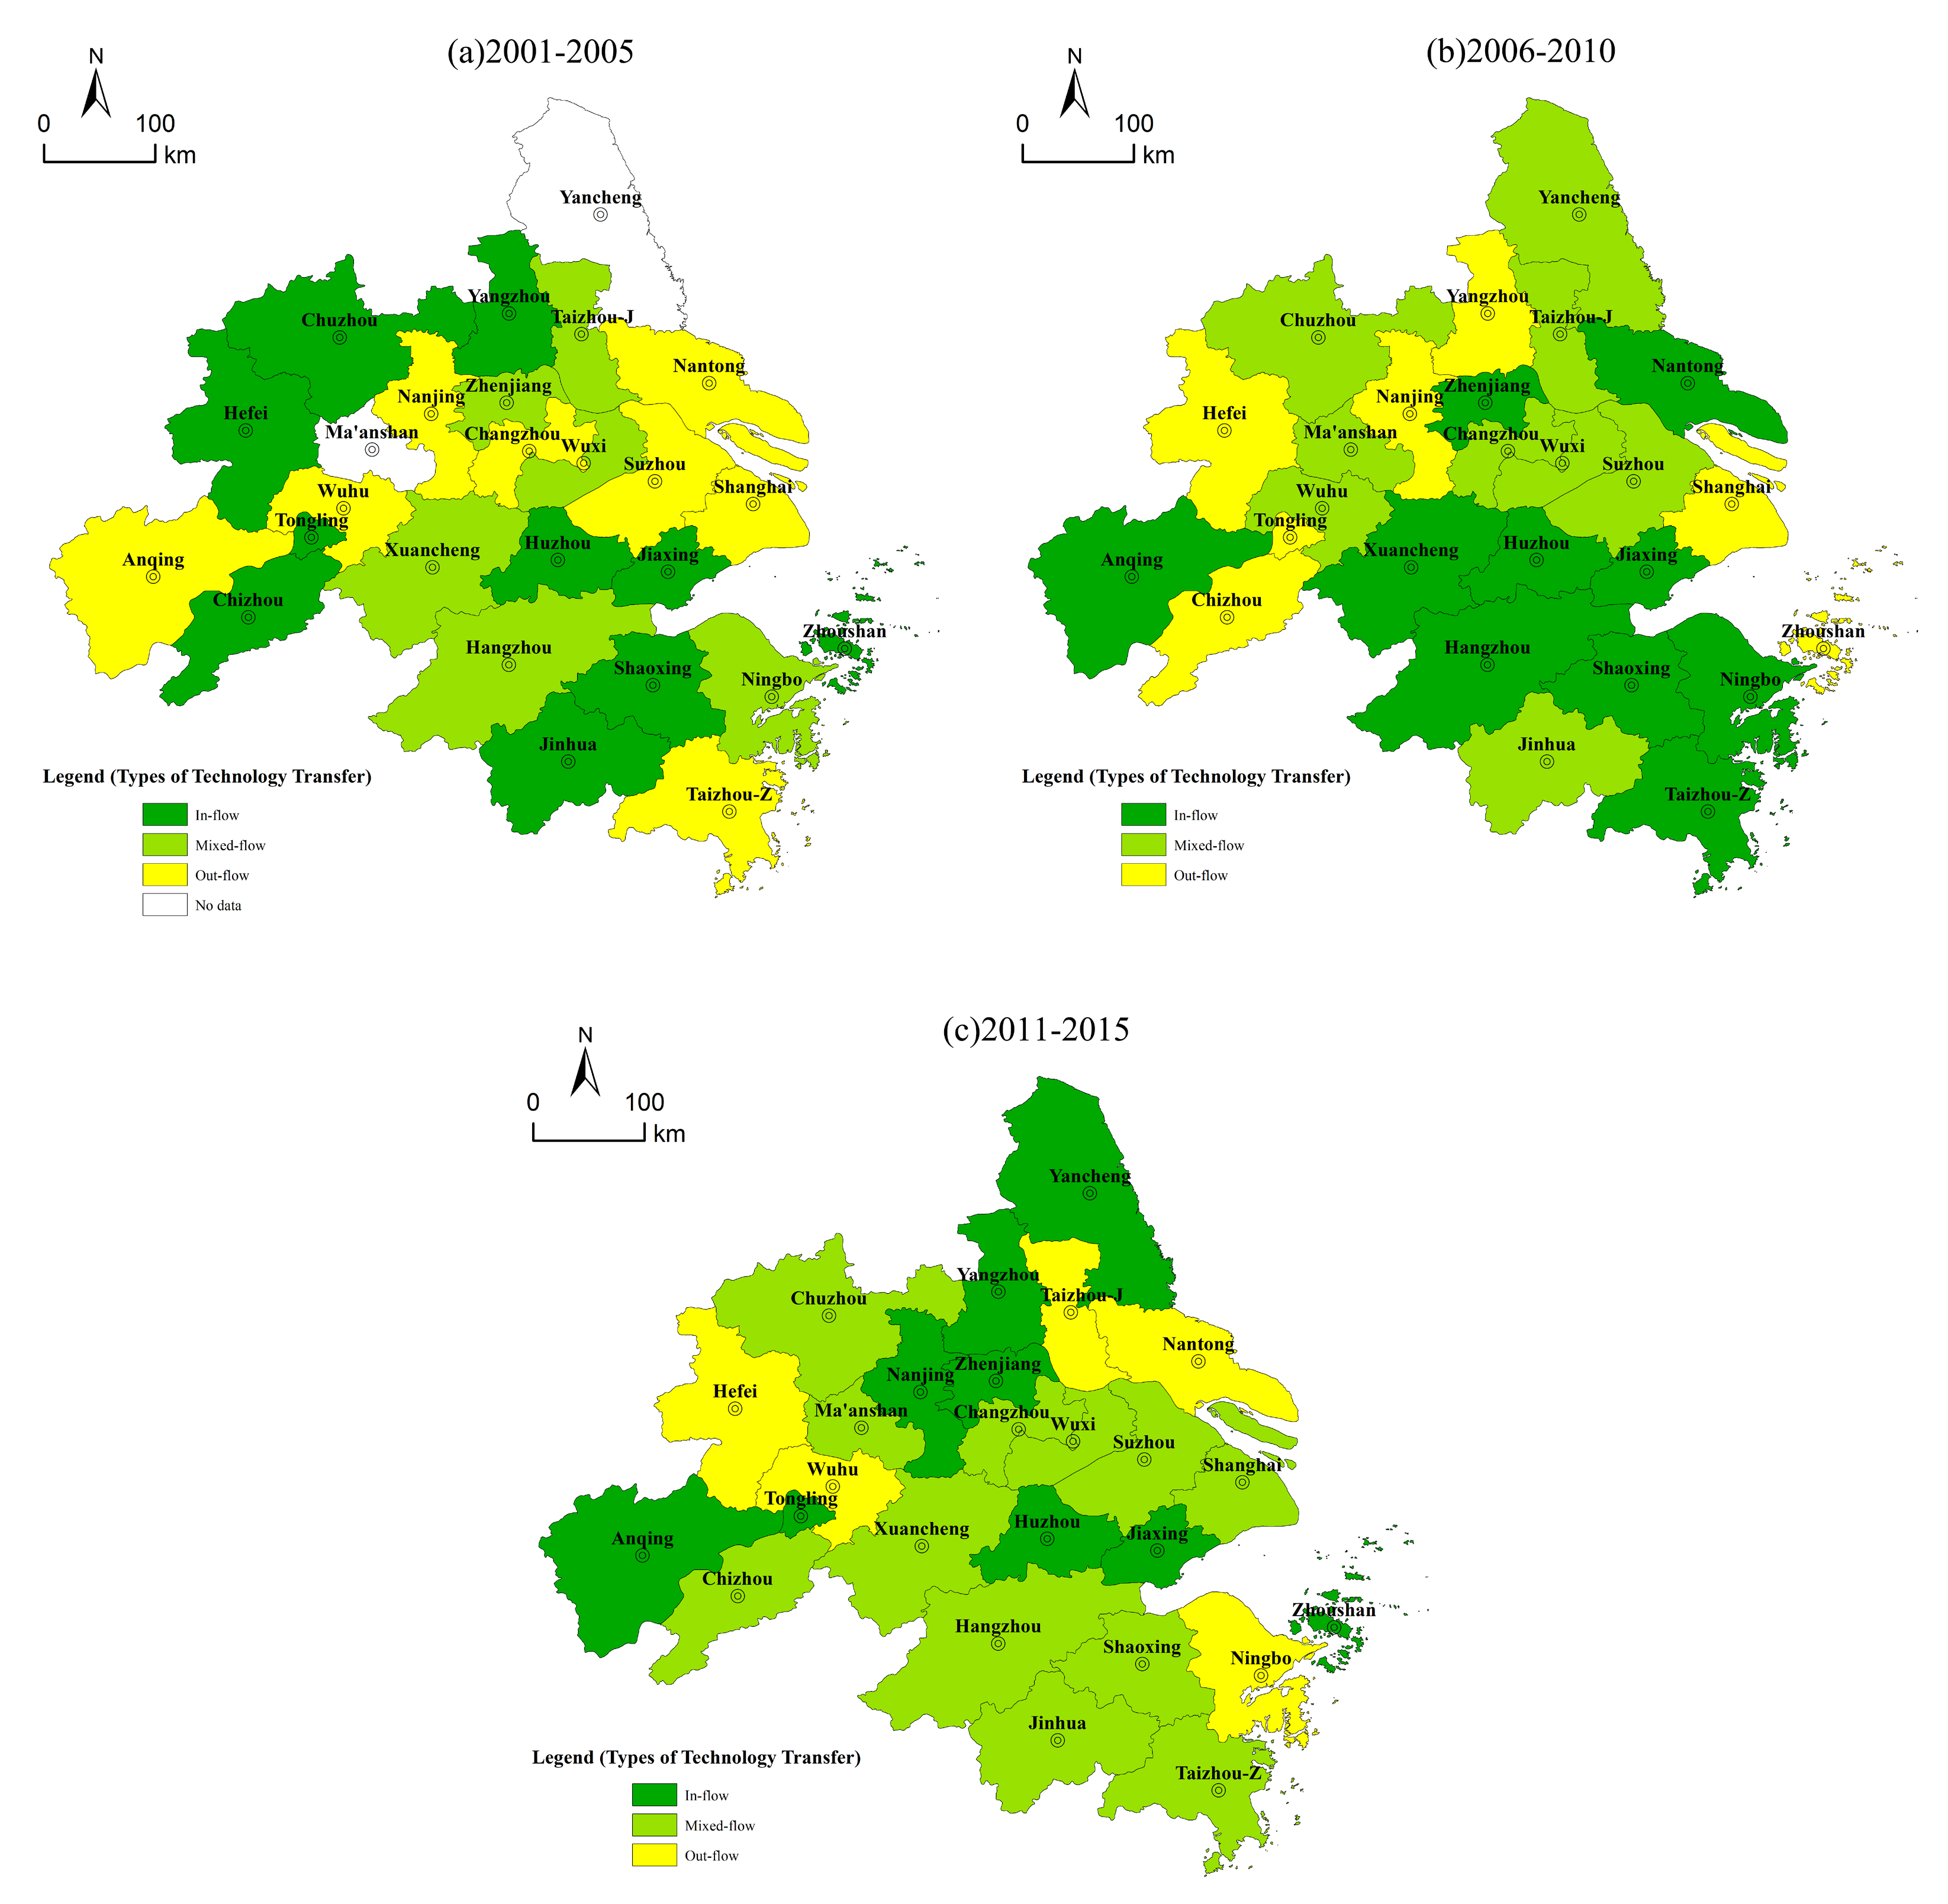
4.2. Integration in the Technology Supply Chain of the YRD

The number of patents obtained separately from the inside and outside of the YRD increased from 167 and 579 in the first period to 15,707 and 18,930 in the third period. In terms of the number of patent input, Shanghai ranked first in the first two periods both in internal patent input and external patent input. But in the third period, Shanghai was surpassed by Nantong, precisely ranking second. Apart from Shanghai, the cities with high patent input mainly concentrated in Jiangsu and Zhejiang provinces, such as Suzhou, Hangzhou, Nanjing, Jiaxing, Wuxi, Changzhou, and Ningbo. Cities in Anhui province always had a low input of patents. Overall, the share of intra-region patent input increased from 22.48% in the first period to 45.35% in the third period, meaning that the integration in technology supply chain of the YRD had not yet been achieved up to 2015, but it was developing rapidly towards integration (see Table A1 in Appendix B).
In detail, in the first period, 8 cities (i.e., Nantong, Hefei, Wuhu, Shaoxing, Yancheng, Ma’anshan, Anqing, and Zhoushan) had neither acquired patents internally nor externally, and 3 cities, namely Chizhou, Tongling, and Xuancheng, obtained all their patents within the YRD. There were also 5 cities obtaining more than 50% (including 50%) of their input from the YRD, such as Jinhua, Huzhou, Yangzhou, Jiaxing, and Chuzhou. The remaining 10 cities mainly obtained patents from the outside of the YRD, especially for Shanghai with intra-region inputs shares of no more than 10%. In the second period, only 2 cities (Tongling and Zhoushan) had no patent input activities, while the remaining 24 cities obtained patents both internally and externally. There were 12 cities with an intra-region patent input share of more than 50%. In the third period, all the 26 cities of the YRD had patent input activities, of those 17 cities obtained more than 50% of their input from the YRD. In the remaining 9 cities, Shaoxing’s patent input entirely relied on the outside of the YRD. Figure 4 shows the patterns of patent input’s types for the cities in the YRD at the three periods. The number of cities with the types of In_total_input and In_mainly_input increased from 8 in the first period to 17 in the third period, indicating that technological advances in the YRD’s cities were increasingly dependent on the internal technology spillovers.

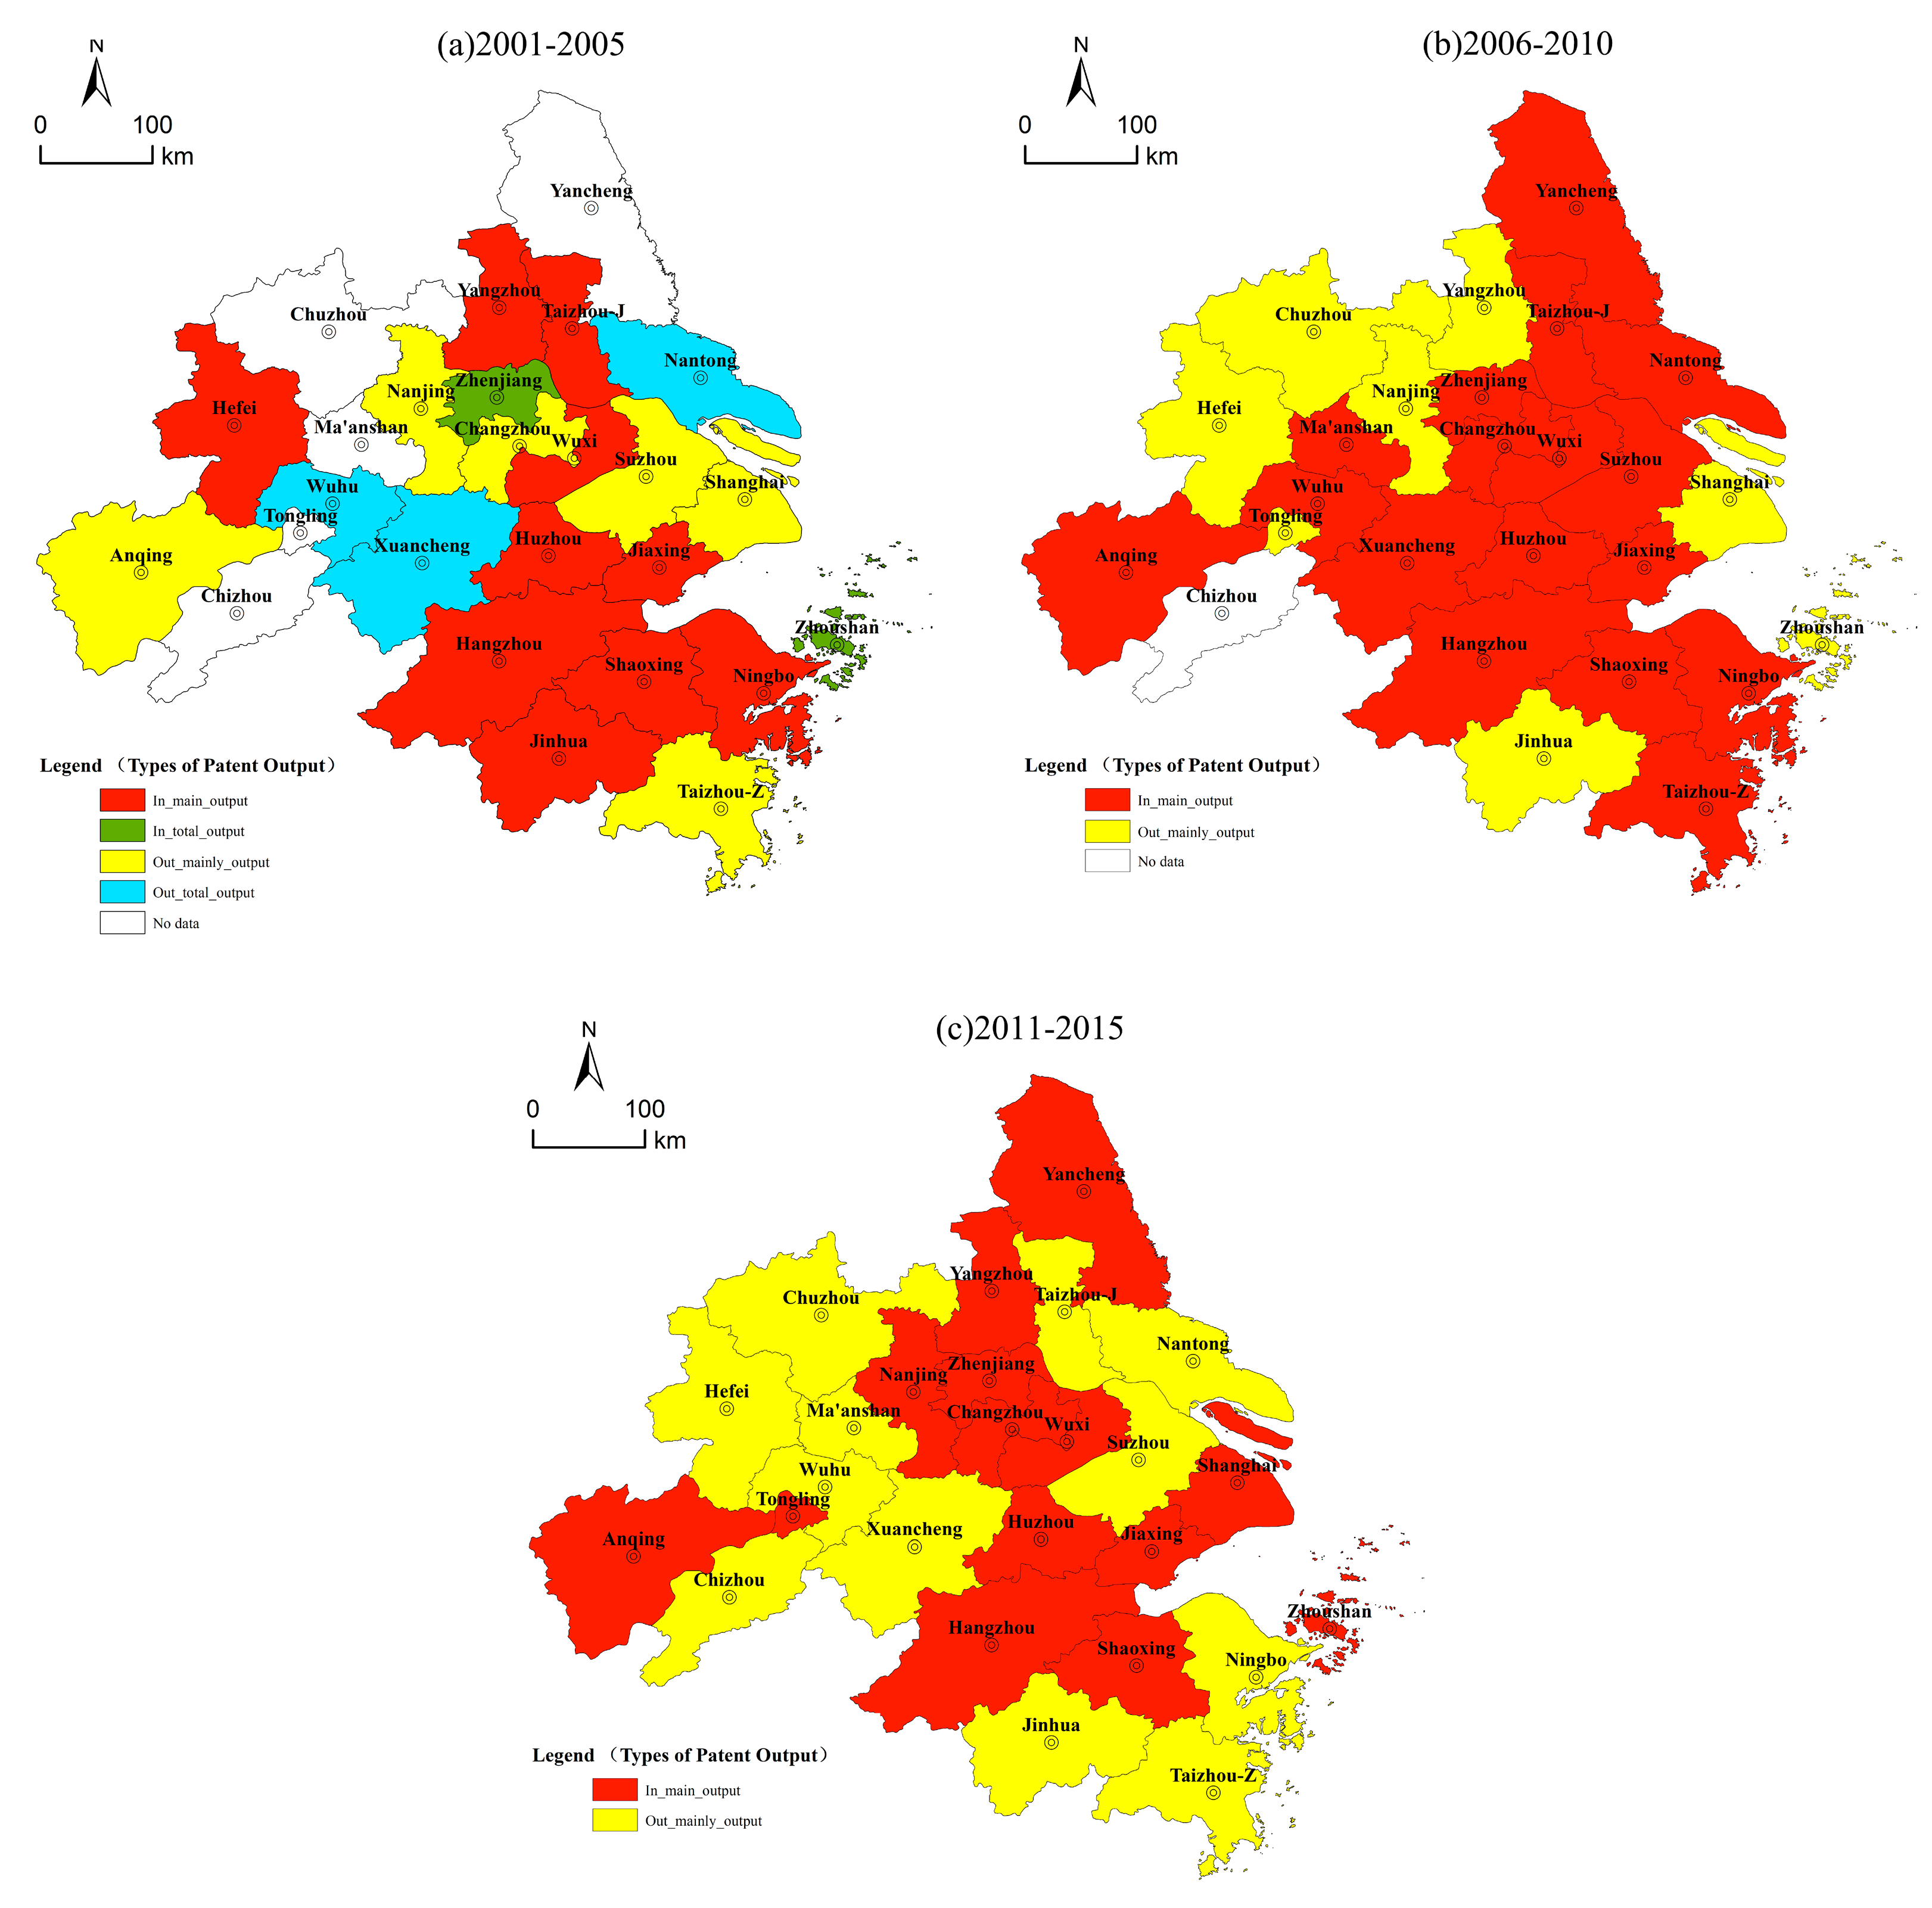
4.3. Integration in the Technology Sales Chain of the YRD

The number of patents transferred to the inside and outside of the YRD separately increased from 167 and 451 in the first period to 15,707 and 15,503 in the third period (see Table A2 in Appendix B). In terms of the number of patent output, Shanghai always ranked first in the three periods both in internal patent output and external patent output. In addition to Shanghai, cities with high patent output also mainly concentrated in Jiangsu and Zhejiang provinces, such as Suzhou, Hangzhou, Nanjing, Ningbo, Wuxi, and Changzhou. Cities in Anhui province always had low patent output. However, unlike patent inputs, the share of intra-region patent outputs increased from 27.02% in the first period to 50.33% in the third period (54.5% in the second period), indicating that the integration in technology sales chain of the YRD had been achieved (or just been achieved).
In detail, in the first period, 5 cities mainly concentrated in Anhui Province (i.e., Ma’anshan, Chuzhou, Tongling, and Chizhou) did not have any patent output activities. The patent output of 2 cities (Zhenjiang and Zhoushan) were completely oriented to the interior of the YRD, while 3 cities (Nantong, Wuhu, and Xuancheng) were totally the opposite, transferring patents to the outside of the YRD. There were also 10 cities mainly concentrated in Zhejiang Province transferring more than 50% (including 50%) of their patents to the YRD, such as Hangzhou, Huzhou, Jiaxing, Ningbo, Taizhou-J, Shaoxing and Jinhua. The remaining 6 cities mainly sold patents to the outside of the YRD, especially Shanghai that had an intra-region outputs share of 12.43%. In the second period, only 1 city (Chizhou) had no patent output activities, while the remaining 25 cities sold patents both internally and externally. The number of cities with an intra-region output share of more than 50% increased to 17. In the third period, all the 26 cities of the YRD had patent output activities, of those 14 cities sold more than 50% of their output to the YRD. Figure 5 shows the patterns of patent output’s types for the cities in the YRD at the three periods. The number of cities with the types of In_total_output and In_mainly_output rose from 12 in the first period to 17 in the second period, and then fell to 14 in the third period. And cities with the types of Out_total_output and Out_mainly_output mainly concentrated in Anhui province. We also noticed that as the city with the largest patent output in the YRD, the type of Shanghai had changed from Out_mainly_output in the first two periods to In_total_output in the third period. In general, the technical output of most cities in the YRD was oriented to the interior of the YRD, indicating that the YRD occupied a higher position in the technology sales markets for the cities in the YRD.

5. Discussion and Conclusions

The discussion of the integration in the technology transfer system of the YRD is rooted in the particular context of China’s national policies and regional development. In this paper, we investigated the regional integration in the technology transfer system of the YRD from three levels. We concluded by discussing the key findings, some of which can enhance our understanding of the integrated development of the YRD. By firstly comparing the number of patents flowing in the internal inter-city technology transfer network and the external inter-city technology transfer network of the YRD, we found that the inter-region patent transfer share was always greater than the intra-region patent transfer share. Secondly, based on the community detection method in network analysis, we studied the community structure of China’s inter-city technology transfer network, and found that cities in the YRD were always not in the same independent community. The above two points explained from the overall level that the regional integration of the technology transfer system of the YRD had not been realized up to 2015. We have also studied the integrated development of technology transfer system in the YRD from the technical supply chain and the technical sales chain. In the technology supply chain, although the inter-region patent input share was always greater than the intra-region patent input share, technological advances in the YRD’s cities were increasingly dependent on internal technology spillovers. In terms of technical sales chain, the intra-region patent output share exceeded 50%, indicating that the integration in the technology sales chain of the YRD had been achieved.
These empirical findings also generally deepen our understanding of the network boundary of technology flows in regional studies or economic geography. The concepts of regional innovation systems (RISs) and Regional innovation networks (RINs) have been widely applied to account for the successful development of many high-performing or innovative regions [61,62]. However, recent researches have criticized the localized or regional-fixed perspectives embodied in this concept by emphasizing the roles of extra-regional networks [63,64]. The regional integration of the YRD’s technology transfer system is clearly bounded, but the technology transfer networks of the YRD are not restricted by the regional boundary. Our findings based on Figure 6 also confirmed that the number of cities with their technology transfer types of Mixed-flow was continuous increasing. Technology flows in the YRD was increasingly moving across the border, and the intra-region technology transfer network was increasingly unable to meet the needs of technological development for the cities in the YRD.
Policy implications of our research are based on the observation that the Chinese governments are paying more attention to the integrated development in the YRD, especially in the current era of knowledge economy, the integrated technology transfer system has become an important part of the regional integration development of the YRD. Our research found that although most cities in the YRD did obtain patents internally, the integrated technology transfer system in the YRD had not yet been established up to 2015, especially in the technology supply chain. This shows that the technology supply of the YRD could not meet the needs of 26 cities in the YRD, which may be mainly caused by the unsmooth technology transfer channels. Although China has adopted a series of decentralization policies that empower local states since the reform and opening-up, regional administrative boundaries still hinder the free flow of various elements to a great extent [22,65]. Thereby, we suggest that while building an integrated technology transfer network in the Yangtze River Delta with Shanghai as the core, we should also design at the top level to break down administrative barriers, such as building a technology transfer alliance for the YRD. In addition, we also noticed that cities in different levels of technology development measured by patent applications have different types of technology transfer activities. For cities with high technological development level, such as Shanghai, Hangzhou, Wuxi and Changzhou, their patent input mainly came from the outside of the YRD, and their patent output mainly faced the inside of the YRD. While in cities with low technological development level, which mainly concentrated in Anhui province, the types of patent transfer activities were contrary to the above. Therefore, narrowing the gap of cities’ technology development in the YRD should be the goal of the integrated development of technology transfer system of the YRD, and of course, this is also the premise.
The research presented here also has several limitations, which are worthy of further study. One limitation relates to the concern for the representativeness of patent transfer data. Although patent transfer has been widely recognized as an effective indicator for measuring the technology flows between regions or cities [31,34], patent transfer is only one of many ways of technology transfer and the data here only contains the address information of the rights holder before and after the patent transfer, and it does not involve the transfer price which is seen as the best indicator of the patent quality. Secondly, patent transfer is just an external manifestation of technology transfer. The construction of integrated technology transfer system involves many deep-seated factors, such as integrated technology transfer policies, integrated technology transfer organizations and personnel, integrated technology transfer platforms. Thirdly, this paper only focuses on inter-city technology flows. It does not pay attention to which actors (such as enterprises, universities, research institutions, governments or individuals) play an important role in the process of technology transfer. Also, this research only concentrated on the integration of the YRD. It did not investigate the technology integration performance of other world high-integrated regions, such as the EU. We will try to find more representative data to study the technology integration of YRD as well as other highly-integrated region, such as the EU, and make an international comparison. What’s more, many studies have shown that China’s technology transfer is driving the international technology transfer from North-South to the coexistence of North-South and South-South, and the China-led South-South technology transfer gradually breaks the cooperation paradigm between North and South technology transfer [66]. with the continuous advancement of the Belt and Road initiative, it would be meaningful to study whether China’s technology transfer promotes the integration of the Belt and Road.

6. Note

The cities in this paper are the municipalities, prefecture-level cities, autonomous prefectures and leagues in China’s administrative divisions, and do not include county-level cities.

Author Contributions

D.D. (Dezhong Duan) developed the original idea of this study, revised the manuscript and supervised the research project. Y.Z and Y.C. performed the data analysis and original draft preparation under the supervision of the corresponding authors. D.D. (Debin Du) directed research comments and provided quality assurance. All authors read and approved the final manuscript.

Funding

This research was funded by the Philosophical and Social Science Foundation of Shanghai, grant number 2018EJL003, MOE (Ministry of Education in China) Project of Humanities and Social Sciences, grant number 19YJC790023, and the Fundamental Research Funds for the Central Universities, ECNU, grant number 2019ECNU-JP003.

Conflicts of Interest

No potential conflict of interest was reported by the authors.

Appendix A

Study Area

According to the “Plan of Yangtze River Delta Urban Agglomeration Development” approved by the State Council of China in May 2016, the YRD, the study area of this paper, consists of ‘three provinces and one municipality’, i.e., Jiangsu, Zhejiang, Anhui and Shanghai. Jiangsu province contains 9 prefecture-level cities (Nanjing, Wuxi, Changzhou, Suzhou, Nantong, Yancheng, Yangzhou, Zhenjiang, Taizhou). Zhejiang province contains 8 prefecture-level cities (Hangzhou, Ningbo, Jiaxing, Huzhou, Shaoxing, Jinhua, Zhoushan, Taizhou). Anhui province contains 8 prefecture-level cities (Hefei, Wuhu, Ma’anshan, Tongling, Anqing, Zhangzhou, Chizhou and Xuancheng). Since there are two cities with the same name of Taizhou in this study area, they are re-named to Taizhou-J (Jiangsu province) and Taizhou-Z (Zhejiang province) according to the provinces they belong to.

Appendix B

Table A1. Number of patents separately obtained from the inside and outside of the YRD for cities in the YRD at the three periods.
City2001–20052006–20102011–2015
i n _ C D p i n t e r w   i n _ C D p e x t e r w i n _ C D p i n t e r w   i n _ C D p e x t e r w i n _ C D p i n t e r w   i n _ C D p e x t e r w  
Shanghai43390430117521473599
Hangzhou264128218210511066
Nanjing714126546947923
Hefei006682398484
Suzhou125433440721291914
Wuxi4101221596831192
Changzhou5851676621178
Zhenjiang246225296178
Yangzhou1032228270239
Nantong001075626314312
Taizhou-J5620215327341
Yancheng002631458191
Chuzhou11355166122
Wuhu003144174479
Tongling10003318
Ma’anshan0021311085
Chizhou305128315
Xuancheng1017212875
Anqing00534221
Jiaxing6416248859495
Huzhou1329124532173
Ningbo1221153115636814
Zhoushan0000488
Shaoxing0075240304
Jinhua141210755321281
Taizhou-Z2617690576423
Table A2. Number of patents separately sold to the inside and outside of the YRD for cities in the YRD at the three periods.
City2001–20052006–20102011–2015
o u t _ C D p i n t e r w   o u t _ C D p e x t e r w o u t _ C D p i n t e r w   o u t _ C D p e x t e r w o u t _ C D p i n t e r w   o u t _ C D p e x t e r w
Shanghai42296862101536823601
Hangzhou241431318015641333
Nanjing215219119615371213
Hefei622857309436
Suzhou7261569216832239
Wuxi83159100940766
Changzhou2128070621368
Zhenjiang30412261138
Yangzhou11162511992
Nantong099366358365
Taizhou-J55133151167
Yancheng0084132120
Chuzhou008943106
Wuhu02151163321
Tongling006264622
Ma’anshan00976073
Chizhou00001431
Xuancheng011815389
Anqing39775049
Jiaxing1116312329266
Huzhou1413216299231
Ningbo841408514201751
Zhoushan106185518
Shaoxing329942707490
Jinhua222934496575
Taizhou-Z6911518615643

References

  1. Krieger-Boden, C.; Soltwedel, R. Identifying European Economic Integration and Globalization: A Review of Concepts and Measures. Reg. Stud. 2013, 47, 1425–1442. [Google Scholar] [CrossRef]
  2. Krugman, P.; Venables, A.J. Globalization and the Inequality of Nations. Q. J. Econ. 1995, 110, 857–880. [Google Scholar] [CrossRef]
  3. Július, H.; Richard, G. Core and periphery in the world economy: An empirical assessment of the integration of the Ddeveloping countries into the world economy. Int. Econ. J. 1999, 13, 35–51. [Google Scholar] [CrossRef]
  4. Fidrmuc, J. The core and periphery of the world economy. J. Int. Trade Econ. Dev. 2004, 13, 89–106. [Google Scholar] [CrossRef]
  5. Rodrik, D. Globalisation and Labour, or: If Globalisation is a Bowl of Cherries, Why Are There so Many Glum Faces around the Table? In Market Integration, Regionalism and the Global Economy; Baldwin, R., Cohen, D., Sapir, A., Venables, A., Eds.; Cambridge University Press: Cambridge, UK, 1999; pp. 117–150. [Google Scholar]
  6. Zhang, X.; Zhang, K.H. How does globalization affect regional inequality within a developing country? Evidence from China. J. Dev. Stud. 2003, 39, 47–67. [Google Scholar] [CrossRef]
  7. Venables, A.J. Winners and losers from regional integration agreements. Econ. J. 2010, 113, 747–761. [Google Scholar] [CrossRef]
  8. Kiggundu, M.N.; Deghetto, K. Regional integration: Review of the management literature and implications for theory, policy, and practice. Afr. J. Manag. 2015, 1, 303–332. [Google Scholar] [CrossRef]
  9. Geyikdagi, N.V. Regional integration in Central Asia. J. Asia-Pac. Bus. 2005, 6, 61–74. [Google Scholar] [CrossRef]
  10. Thonke, O.; Spliid, A. What to expect from regional integration in Africa. Afr. Secur. Rev. 2012, 21, 42–66. [Google Scholar] [CrossRef]
  11. Curran, L.; Zignago, S. Regional integration of trade in South America: How far has it progressed and in which sectors? Int. Trade J. 2013, 27, 3–35. [Google Scholar] [CrossRef]
  12. Jordaan, A.C. Regional integration in Africa versus higher levels of intra-Africa trade. Dev. South. Afr. 2014, 31, 515–534. [Google Scholar] [CrossRef] [Green Version]
  13. Paluzie, E.; Pons, J.; Tirado, D.A. Regional Integration and Specialization Patterns in Spain. Reg. Stud. 2001, 35, 285–296. [Google Scholar] [CrossRef]
  14. Berkowitz, D.; Dejong, D.N. Integration: An empirical assessment of Russia. William Davidson Inst. Work. Pap. 2002, 53, 541–559. [Google Scholar] [CrossRef]
  15. Chung, H. Unequal Regionalism: Regional Planning in China and England. Plan. Pract. Res. 2015, 30, 570–586. [Google Scholar] [CrossRef]
  16. Ke, S. Domestic Market Integration and Regional Economic Growth—China’s Recent Experience from 1995–2011. World Dev. 2015, 66, 588–597. [Google Scholar] [CrossRef]
  17. Liu, W.; Dunford, M.; Song, Z.; Chen, M. Urban–rural integration drives regional economic growth in Chongqing, Western China. Area Dev. Policy 2016, 1, 132–154. [Google Scholar] [CrossRef]
  18. Crane, B.; Albrecht, C.; Duffin, M.K.; Albrecht, C. China’s special economic zones: An analysis of policy to reduce regional disparities. Reg. Stud. Reg. Sci. 2018, 5, 98–107. [Google Scholar] [CrossRef]
  19. Luo, X.; Shen, J. A study on inter-city cooperation in the Yangtze River Delta region, China. Habitat Int. 2009, 33, 52–62. [Google Scholar] [CrossRef]
  20. Zhang, G.; Duan, H.; Zhou, J. Investigating determinants of inter-regional technology transfer in China: A network analysis with provincial patent data. Rev. Manag. Sci. 2016, 10, 345–364. [Google Scholar] [CrossRef]
  21. Li, Y.; Wu, F. Understanding city-regionalism in china: Regional cooperation in the Yangtze River Delta. Reg. Stud. 2018, 52, 313–324. [Google Scholar] [CrossRef]
  22. Zhang, W.; Derudder, B.; Wang, J.; Shen, W. Regionalization in the Yangtze River Delta, China, from the perspective of inter-city daily mobility. Reg. Stud. 2018, 52, 528–541. [Google Scholar] [CrossRef]
  23. Anderson, J.E.; Eric, V.W. Trade costs. J. Econ. Lit. 2004, 42, 691–751. [Google Scholar] [CrossRef]
  24. Combes, P.P.; Lafourcade, M. Transport costs: Measures, determinants and regional policy implications for France. J. Econ. Geogr. 2005, 5, 319–349. [Google Scholar] [CrossRef]
  25. Markman, G.D.; Gianiodis, P.T.; Phan, P.H.; Balkin, D.B. Innovation speed: Transferring university technology to market. Res. Policy 2005, 34, 1058–1075. [Google Scholar] [CrossRef]
  26. McCarthy, I.P.; Ruckman, K. Licensing Speed: Its Determinants and Payoffs. Soc. Sci. Electron. Publ. 2017, 46, 52–66. [Google Scholar] [CrossRef]
  27. Etzkowitz, H.; Leydesdorff, L. The dynamics of innovation: From national systems and “Mode 2” to a Triple Helix of university–industry–government relations. Res. Policy 2000, 29, 109–123. [Google Scholar] [CrossRef]
  28. Link, A.N.; Siegel, D.S.; Fleet, D.D.V. Public science and public innovation: Assessing the relationship between patenting at U.S. National Laboratories and the Bayh-Dole Act. Res. Policy 2011, 40, 1094–1099. [Google Scholar] [CrossRef] [Green Version]
  29. Bozeman, B.; Rimes, H.; Youtie, J. The evolving state-of-the-art in technology transfer research: Revisiting the contingent effectiveness model. Res. Policy 2015, 44, 34–49. [Google Scholar] [CrossRef]
  30. Etzkowitz, H. Innovation lodestar: The entrepreneurial university in a stellar knowledge firmament. Technol. Forecast. Soc. Chang. 2017, 123, 122–129. [Google Scholar] [CrossRef]
  31. Drivas, K.; Economidou, C. Is geographic nearness important for trading ideas? Evidence from the US. J. Technol. Transf. 2015, 40, 629–662. [Google Scholar] [CrossRef]
  32. Wang, Y.; Pan, X.; Ning, L.; Li, J.; Chen, J. Technology exchange patterns in China: An analysis of regional data. J. Technol. Transf. 2015, 40, 252–272. [Google Scholar] [CrossRef]
  33. Marco, A.D.; Scellato, G.; Ughetto, E.; Caviggioli, F. Global markets for technology: Evidence from patent transactions. Res. Policy 2017, 46, 1644–1654. [Google Scholar] [CrossRef]
  34. Sun, Y.; Grimes, S. The actors and relations in evolving networks: The determinants of inter-regional technology transaction in China. Technol. Forecast. Soc. Chang. 2017, 125, 125–136. [Google Scholar] [CrossRef]
  35. Feng, Y.; Genna, G.M. Regional integration and domestic institutional homogeneity: A comparative analysis of regional integration in the Americas, pacific Asia and western Europe. Rev. Int. Political Econ. 2003, 10, 278–309. [Google Scholar] [CrossRef]
  36. Frankel, J.A. Regional Trading Blocs; The Institute for International Economics: Washington, DC, USA, 1997. [Google Scholar]
  37. Duina, F. Varieties of regional integration: The EU, NAFTA and Mercosur. J. Eur. Integr. 2006, 28, 247–275. [Google Scholar] [CrossRef]
  38. Jetschke, A.; Murray, P. Diffusing Regional Integration: The EU and Southeast Asia. West Eur. Politics 2012, 35, 174–191. [Google Scholar] [CrossRef]
  39. Farrell, M. EU policy towards other regions: Policy learning in the external promotion of regional integration. J. Eur. Public Policy 2009, 16, 1165–1184. [Google Scholar] [CrossRef]
  40. Huh, H.S.; Park, C.Y. Asia-Pacific regional integration index: Construction, interpretation, and comparison. J. Asian Econ. 2018, 54, 22–38. [Google Scholar] [CrossRef] [Green Version]
  41. Nazarko, J.; Czerewacz-Filipowicz, K.; Kuzmicz, K.A. Comparative analysis of the Eastern European countries as participants of the New Silk Road. J. Bus. Econ. Manag. 2017, 18, 1212–1227. [Google Scholar] [CrossRef]
  42. Hanson, G.H. Market potential, increasing returns and geographic concentration. J. Int. Econ. 2005, 67, 1–24. [Google Scholar] [CrossRef] [Green Version]
  43. Brakman, S.; Garretsen, H.; Schramm, M. Putting New Economic Geography to the test: Freeness of trade and agglomeration in the EU regions. Reg. Sci. Urban Econ. 2006, 36, 613–635. [Google Scholar] [CrossRef]
  44. Bassens, D.; Derudder, B.; Taylor, P.J.; Ni, P.; Hoyler, M.; Huang, J.; Witlox, F. World city network integration in the Eurasian realm. Eurasian Geogr. Econ. 2010, 51, 385–401. [Google Scholar] [CrossRef]
  45. Brown, E.D.; Derudder, B.; Parnreiter, C.; Pelupessy, W.; Taylor, P.J.; Witlox, F. World city networks and global commodity chains: Towards a world-systems’ integration. Glob. Netw. 2010, 10, 12–34. [Google Scholar] [CrossRef]
  46. Taylor, P.; Derudder, B.; Hoyler, M.; Ni, P.; Witlox, F. City-Dyad Analyses of China’s Integration into the World City Network. Urban Stud. 2014, 51, 868–882. [Google Scholar] [CrossRef]
  47. Zhou, J. Economic Globalization, Regional Economic Integration and China’s Economic Development Strategy. In Regional Integration and Economic Development; Saavedra-Rivano, N., Hosono, A., Stallings, B., Eds.; Palgrave Macmillan: London, UK, 2001. [Google Scholar]
  48. Wei, Y.D.; Fan, C.C. Regional inequality in china: A case study of Jiangsu province. Prof. Geogr. 2000, 52, 455–469. [Google Scholar] [CrossRef]
  49. Zhao, X.; Tong, S. Unequal economic development in China: Spatial disparities and regional policy reconsideration, 1985–1995. Reg. Stud. 2000, 34, 549–561. [Google Scholar] [CrossRef]
  50. Wang, Z. The Imbalance in Regional Economic Development in China and Its Reasons. In Private Sector Development and Urbanization in China; Palgrave Macmillan: New York, NY, USA, 2015. [Google Scholar]
  51. Gottmann, J. Megapolis: The Urbanized Northeastern Seaboard of the United States; MIT Press: Boston, MA, USA, 1961. [Google Scholar]
  52. Wei, Y. Regional development in China: Transitional institutions, embedded globalization, and hybrid economies. Eurasian Geogr. Econ. 2007, 48, 16–36. [Google Scholar] [CrossRef]
  53. Van Egeraat, C.; Kogler, D.F. Global and regional dynamics in knowledge flows and innovation networks. Eur. Plan. Stud. 2013, 21, 1317–1322. [Google Scholar] [CrossRef]
  54. Dicken, P. Geographers and ‘globalization’: (yet) another missed boat? Trans. Inst. Br. Geogr. 2014, 29, 5–26. [Google Scholar] [CrossRef]
  55. Bathelt, H.; Malmberg, A.; Maskell, P. Clusters and knowledge: Local buzz, global pipelines and the process of knowledge creation. Prog. Hum. Geogr. 2004, 28, 31–56. [Google Scholar] [CrossRef]
  56. Boix, R.; Trullen, J. Knowledge, networks of cities and growth in regional urban systems. Pap. Reg. Sci. 2007, 86, 551–574. [Google Scholar] [CrossRef] [Green Version]
  57. Chen, H.; Xie, F. How technological proximity affect collaborative innovation? An empirical study of China’s Beijing–Tianjin–Hebei region. J. Manag. Anal. 2018, 5, 287–308. [Google Scholar] [CrossRef]
  58. Latapy, M.; Magnien, C.; Vecchio, N.D. Basic notions for the analysis of large two-mode networks. Soc. Netw. 2008, 30, 31–48. [Google Scholar] [CrossRef]
  59. Newman, M.E.J. Modularity and community structure in networks. Proc. Natl. Acad. Sci. USA 2006, 103, 8577–8582. [Google Scholar] [CrossRef] [Green Version]
  60. Liu, X.; Derudder, B.; Wu, K. Measuring polycentric urban development in china: An intercity transportation network perspective. Reg. Stud. 2015, 50, 1302–1315. [Google Scholar] [CrossRef]
  61. Cooke, P.; Morgan, K. The regional innovation system in Baden–Wurttemberg. Int. J. Technol. Manag. 1994, 9, 394–429. [Google Scholar] [CrossRef]
  62. Asheim, B.T.; Coenen, L. Knowledge bases and regional innovation systems: Comparing Nordic clusters. Res. Policy 2005, 34, 1173–1190. [Google Scholar] [CrossRef]
  63. Chaminade, C.; Plechero, M. Do regions make a difference? Regional innovation systems and global innovation networks in the ICT industry. Eur. Plan. Stud. 2015, 23, 215–237. [Google Scholar] [CrossRef]
  64. Chen, L.C. Building extra-regional networks for regional innovation systems: Taiwan’s machine tool industry in China. Technol. Forecast. Soc. Chang. 2015, 100, 107–117. [Google Scholar] [CrossRef]
  65. Zhang, J.; Wu, F. China’s changing economic governance: Administrative annexation and the reorganization of local governments in the Yangtze River Delta. Reg. Stud. 2006, 40, 3–21. [Google Scholar] [CrossRef]
  66. Urban, F. China’s rise: Challenging the North-South technology transfer paradigm for climate change mitigation and low carbon energy. Energy Policy 2018, 113, 320–330. [Google Scholar] [CrossRef]
Figure 1. Internal inter-city patent transfer network of the YRD at the three periods.
Sustainability 11 02941 g001
Figure 2. External inter-city patent transfer network of the YRD at the three periods.
Sustainability 11 02941 g002
Figure 3. Community detection of China’s inter-city patent transfer at the three periods.
Sustainability 11 02941 g003
Figure 4. Types of patent input for the cities in the YRD at the three periods.
Sustainability 11 02941 g004
Figure 5. Types of patent output for the cities in the YRD at the three periods.
Sustainability 11 02941 g005
Figure 6. Types of technology transfer for the cities in the YRD at the three periods.
Sustainability 11 02941 g006
Table 1. Types of division of technology transfer for the cities in the Yangtze River Delta (YRD).
Types of Technology TransferTypes of Technology InputsTypes of Technology Outputs
In-flowIn_total_inputIn_total_input
In_total_input/In_mainly_input/
In_total_output/In_mainly_output/
In_mainly_inputIn_mainly_output
Mixed-flowIn_mainly_inputIn_mainly_output
In_mainly_outputIn_mainly_input
Out-flowOut_total_inputOut_total_output
Out_total_input/Out_mainly_input/
Out_total_output/Out_mainly_output/
Out_mainly_inputOut_mainly_output
Table 2. Three evaluation levels of integration in the technology transfer system of the YRD.
Evaluation LevelIndicatorsDescription
Overall I n t e r p a t > E x t e r p a t Intra-region transfer share is greater than inter-region transfer share.
Network community detectionThe YRD has become an independent community in China’s inter-city patent transfer network.
Technology supply chains I n t e r p a t i n p u t > E x t e r p a t i n p u t Intra-region input share is greater than inter-region input share.
Technology sales chains I n t e r p a t o u t p u t > E x t e r p a t o u t p u t Intra-region output share is greater than inter-region output share.
Note: I n t e r p a t is the number of patents transferring in the internal network; E x t e r p a t is the number of patents circulating in the external network; I n t e r p a t i n p u t represents the number of patents obtained from the YRD for cities in the YRD; E x t e r p a t i n p u t represents the number of patents obtained from the outside of the YRD for cities in the YRD; I n t e r p a t o u t p u t represents the number of patents transferred to the YRD for cities in the YRD; E x t e r p a t o u t p u t represents the number of patents transferred to the outside of the YRD for cities in the YRD.
Table 3. Number of vertices and patents in the three networks at the three periods.
2001–20052006–20102011–2015
China’s overall network
vertices (dl)242626
vertices (en)215292321
vertices (dl) + vertices (en)239318347
NPT314719,101104,483
Internal network
vertices (ai)222626
I n t e r p a t 167250715,707
External network
vertices (bj)212626
vertices (ck)68184278
vertices (bj) + vertices (ck)89210304
E x t e r p a t 1027549434,433
Note: NPT is the Number of patents transferring in the network.

