1. Introduction
The disruptive impacts on the safety and efficiency of transport systems due to man-made calamities or natural disasters are now a major concern. This challenge is intensified by the safety and security concerns post the 9/11 terrorist attacks in the U.S.A. [
1]. Therefore, in recent years, the mobility and safety issues of passengers in metro (underground railway) systems has been a growing area of transportation research [
2]. As a typical mode of mass rapid transit (MRT), metro systems often serve as the backbone of urban transportation system, especially in metropolitan regions with dense populations [
3]. For example, by the end of 2017, the total length of urban railways in 34 Chinese mainland cities had reached 5033 km, including 3884 km of metro [
4]. A total of 165 urban railway lines and 3234 stations have already been put into operation.
The large passenger traffic volumes in the metro system bring challenges to the safe, efficient and comfortable operations of pedestrian flows [
5,
6]. Previous researches have focused on the improvement of transit capacity and quality of service under normal condition, as well as the safe and rapid evacuation in emergency situations, for both train stations and train carriages [
7,
8,
9,
10,
11,
12,
13,
14,
15,
16,
17]. Regarding efficiency, the overall goals are to minimize the total walking time of passengers, reduce the dwelling delay of trains and maximize the capacity of passenger facilities inside the stations [
18,
19]. With respect to comfort, the commonly used discomfort measures are level of service (LOS) for platforms and degree of crowding (DOC) for trains [
11,
13,
14]. In terms of safety, the prevention of passenger injuries and crowd stampedes on the platform and inside the trains as well as the safe and rapid egress out of metro stations in emergency events are the major objectives [
7,
15,
16,
17]. To this end, previous studies have also devoted to understanding the flow characteristics and route choice behaviors in metro stations, optimal design of pedestrian facilities inside the train stations such as the layout of ticket machines, stairs, escalators and ramps and the optimization of evacuation routes at the metro stations [
7,
8,
10,
12,
18,
20].
Apart from the pedestrian injuries arising from passenger crowd stampedes, the safety of the metro rail system is also under threats of terrorisms. As a mass gathering public place with wide accessibility, metro systems are particularly vulnerable to terrorist attacks. This weakness has been discovered by over 150 terrorist organizations skilled with using improvised explosive devices [
21]. Although metro is typically considered as one of the safest modes of transportation, the metro systems are still vulnerable under the threat of terrorism and personal crimes. To safeguard the vulnerable metro systems against potential threats, a counter-terrorism security check (SC) system has been gradually implemented into the entrance of metro stations in China.
However, this action has raised debates among metro passengers in China as it may cause delays in their metro rides along with potential privacy issues. Therefore, SCs can incorporate trade-off across efficiency, privacy, comfort and safety at both individual and crowd levels [
22,
23]. From policy making aspect, understanding the public opinions on metro SCs is imperative for the improvement of SC infrastructure as well as passenger crowd management [
24,
25].
Previously, several studies have examined the metro SC trade-offs between privacy, liberty, security and safety among European metro passengers at individual level [
22,
23,
24]. Potoglou et al. (2010) conducted a series of stated-choice experiments to quantify passengers’ trade-offs between privacy and security among U.K. metro passengers. Estimation results from a conditional multinomial logit model showed that passengers’ valuation on security, privacy and liberty were statistically significant with personal characteristics. In addition, it was discovered that U.K. people were in general willing to pay for the improvements of SCs against the potential privacy and security concerns. Later, Patil et al. (2014) expanded the investigating targets to the metro passengers from three European Member States. Apart from the consistent findings with their previous survey in the U.K., they also found that people had negative perceptions towards the travel delays resulting from SCs. Further, the results show that people were unwilling to pay the additional costs of security and surveillance measures. Similarly, Fletcher et al. (2016) investigated the public acceptance of security measures in public transport (PT) stations from European passengers. PT passengers’ feelings of safety and acceptability for different security measures were examined. It was discovered that the majority of passengers claimed not to be affected by potential terrorist treat in terms of PT usage. Instead, ticket price, convenience and travel time were their major concerns, while privacy and station design were found to be the least valued items.
In summary, although there have been some studies on passenger surveys to understand passenger perceptions of safety and security checks at train stations, there is lack of comprehensive studies that consider the impact of SCs on the pedestrian flow operation and emergency evacuations. In addition, the relationship of SCs with the trip efficiency and comfort among metro passengers has not been sufficiently investigated. For example, SC processes can be also be regarded as a type of passengers’ crowd control method that can prevent a passenger flow surge by slowing down the passenger flow at the entrance or platforms [
26]. Therefore, the on-platform LOS can be improved and in-vehicle DOC can be reduced. However, the passengers’ willingness of sacrificing their individual trip efficiency or potential privacy disclosure in exchange for more comfortable waiting and riding experiences needs further investigation. Moreover, little attention has been paid to the likely behaviors of passengers undergoing SCs when emergency events (e.g., fire) occur. For example, passengers’ self-awareness of the emergency evacuation procedure and the consequences of their irrational behavior, such as rushing to take their bags, are still undiscovered.
Therefore, the objective of this study is to examine the passenger perceptions of SCs, particularly their personal trade-offs across trip efficiency, comfort, privacy and safety via a questionnaire survey.
The remainder of this article is organized as follows. The next section presents the description of data collection of this survey. Then, the results from the data analysis along with some discussions are demonstrated. The final section provides the conclusion, limitations and future work recommendations.
3. Data Analysis
3.1. Distribution of Ratings
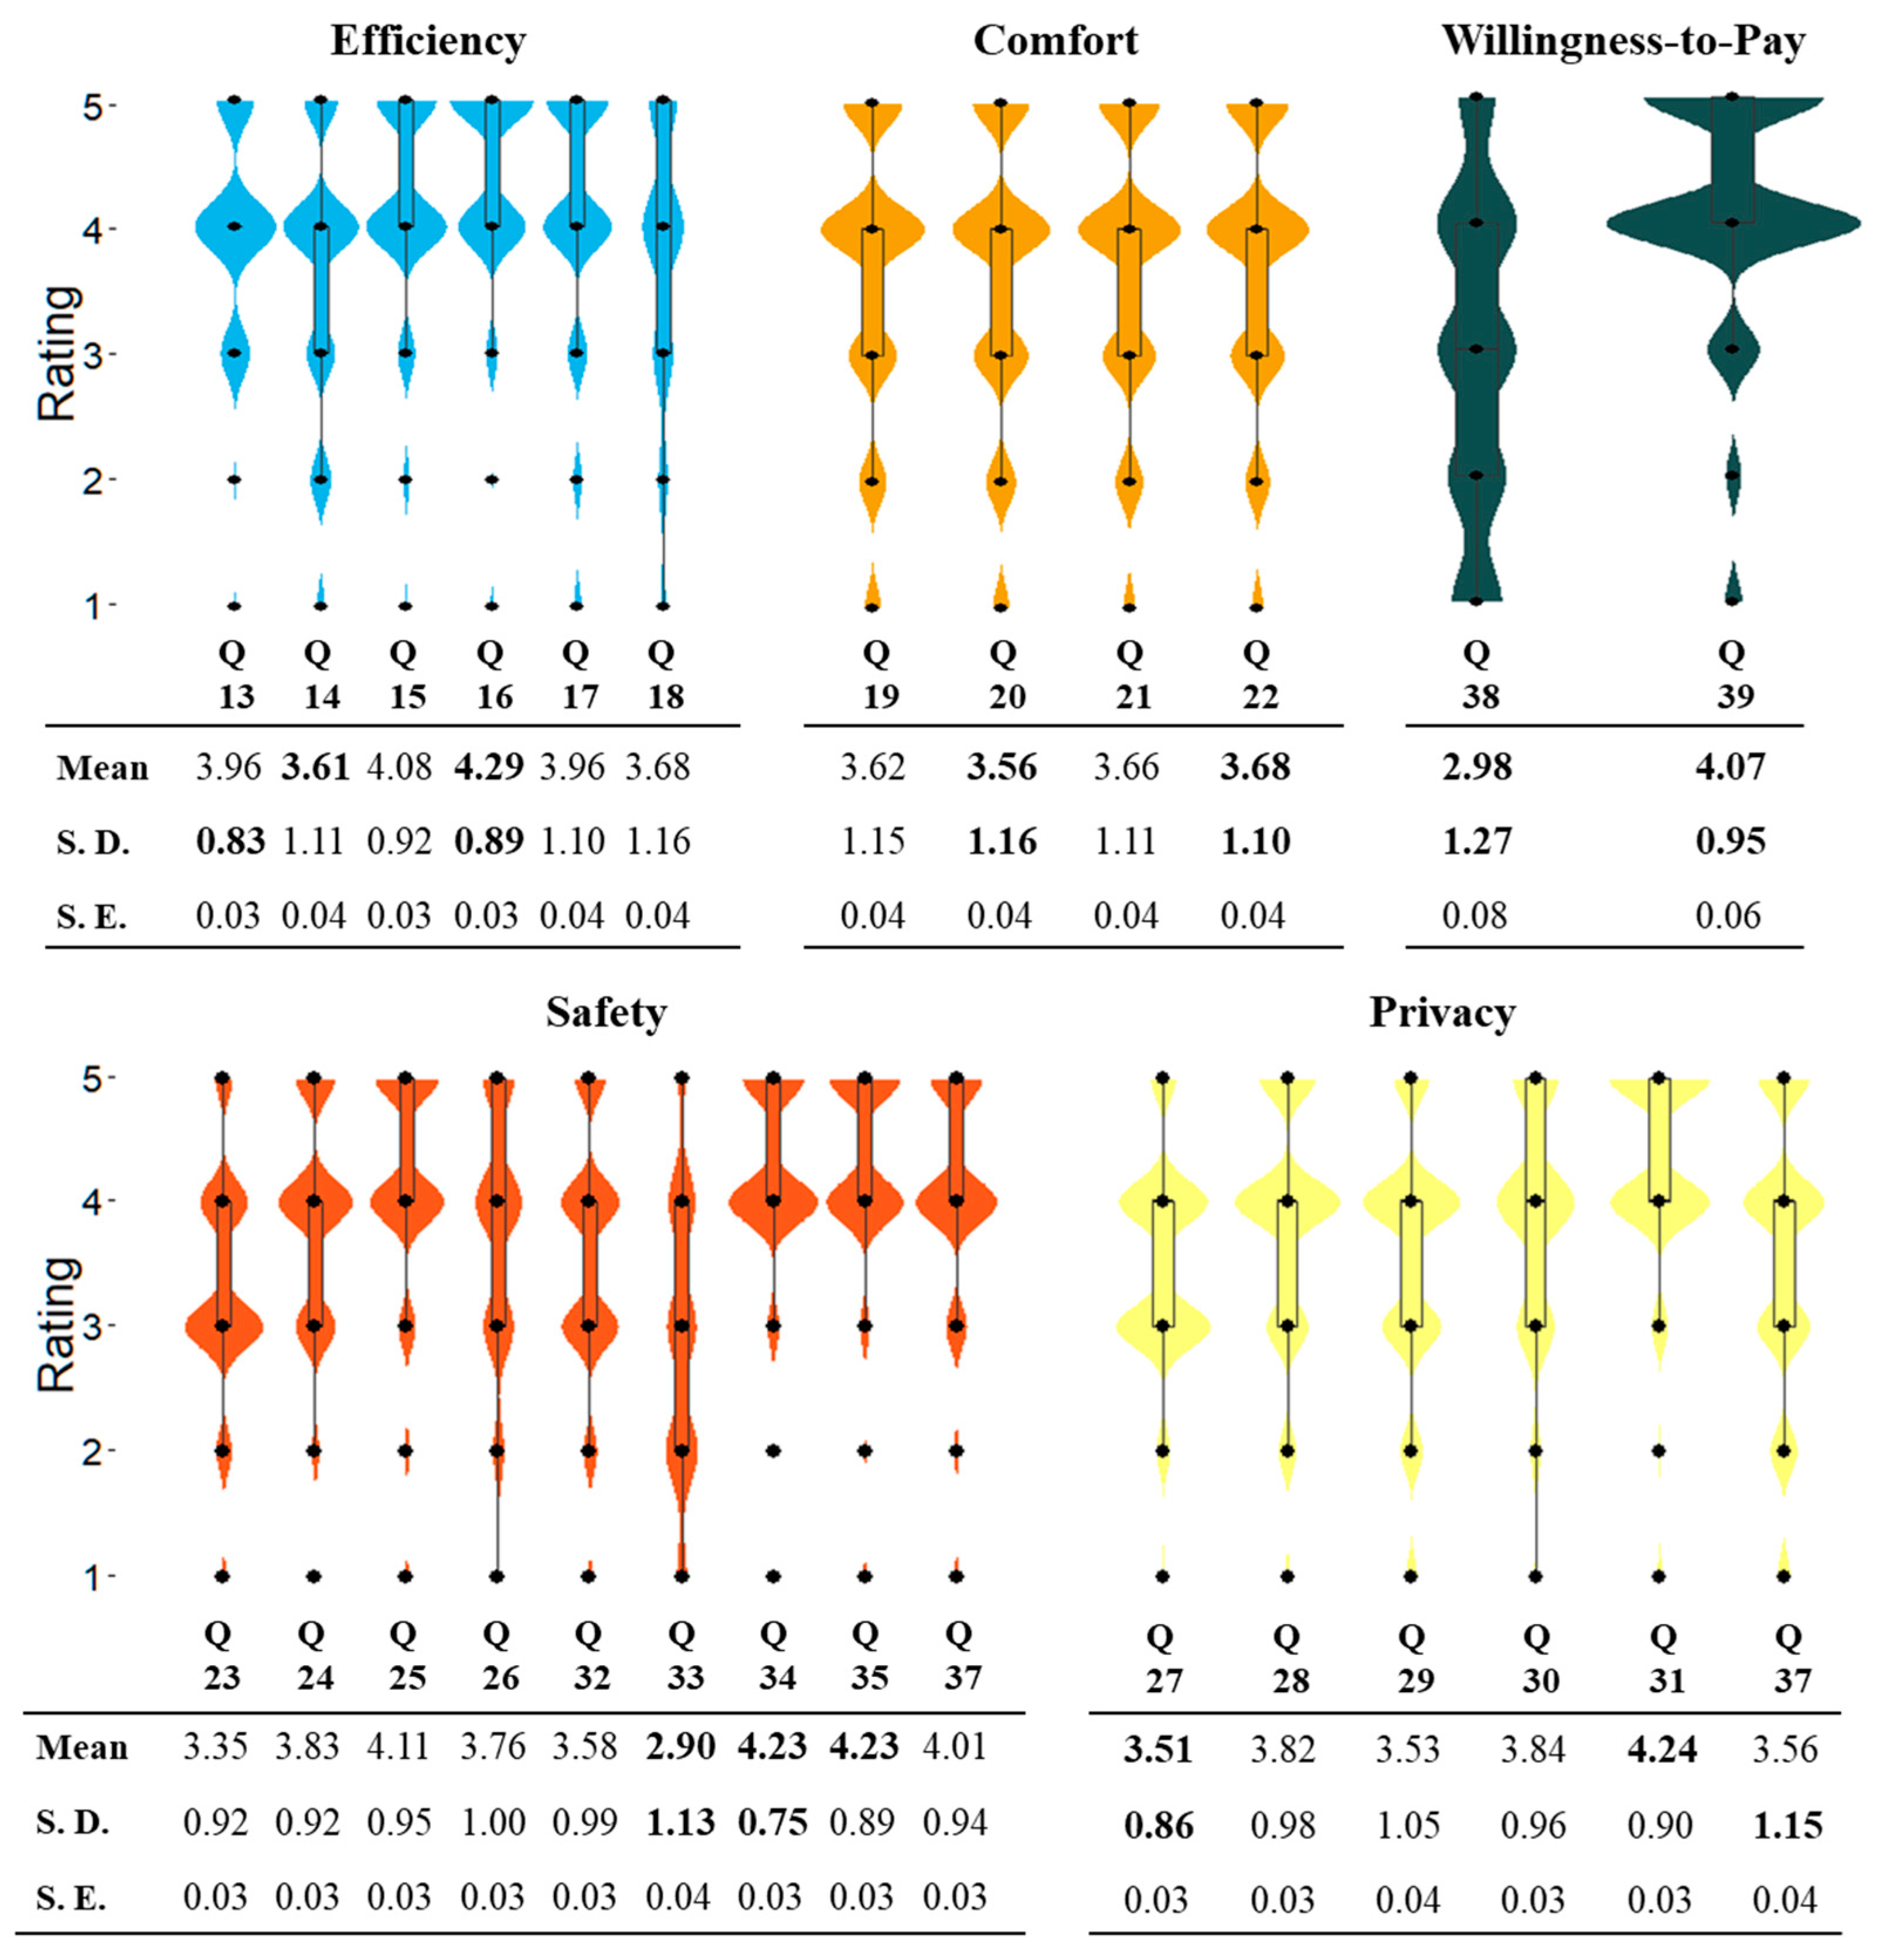
Box-Violin plots along were used to examine the distribution of ratings from the responses, as shown in
Figure 3. Apart from the outliers, from the bottom to the top of the boxplot, the minimal value, lower quartile, median, upper quartile, and maximal values of the data could be observed. Therefore, we are able to see the overall trends and patterns of rating distribution from the responses in each item through the shape of the Box-Violin plots. For a single Box-Violin plot, a short box suggested overall that respondents had a high level of agreement with each other, while a tall box reflected the respondents held different opinions. For a series of Box-Violin plots in different groups, when one box was significantly higher or lower than another, it suggested a large difference between groups. Moreover, the length of whiskers could indicate the data outside the median. And the width of the violin body could reflect the probability distribution (normal distribution in our case). The length of the violin body represented the confidence interval.
In addition, one-sample t-tests and Wilcoxon sign-tests were conducted for each item against the neutral rating of 3. If the null hypothesis was rejected, then the statistical significance of the respondents overall perception of each item could be confirmed. For instance, a mean rating above 3 would indicate the responses on average agree with the item, vice versa. All the items were statistically significant at 95% confidence level.
3.2. Confirmatory Factor Analysis
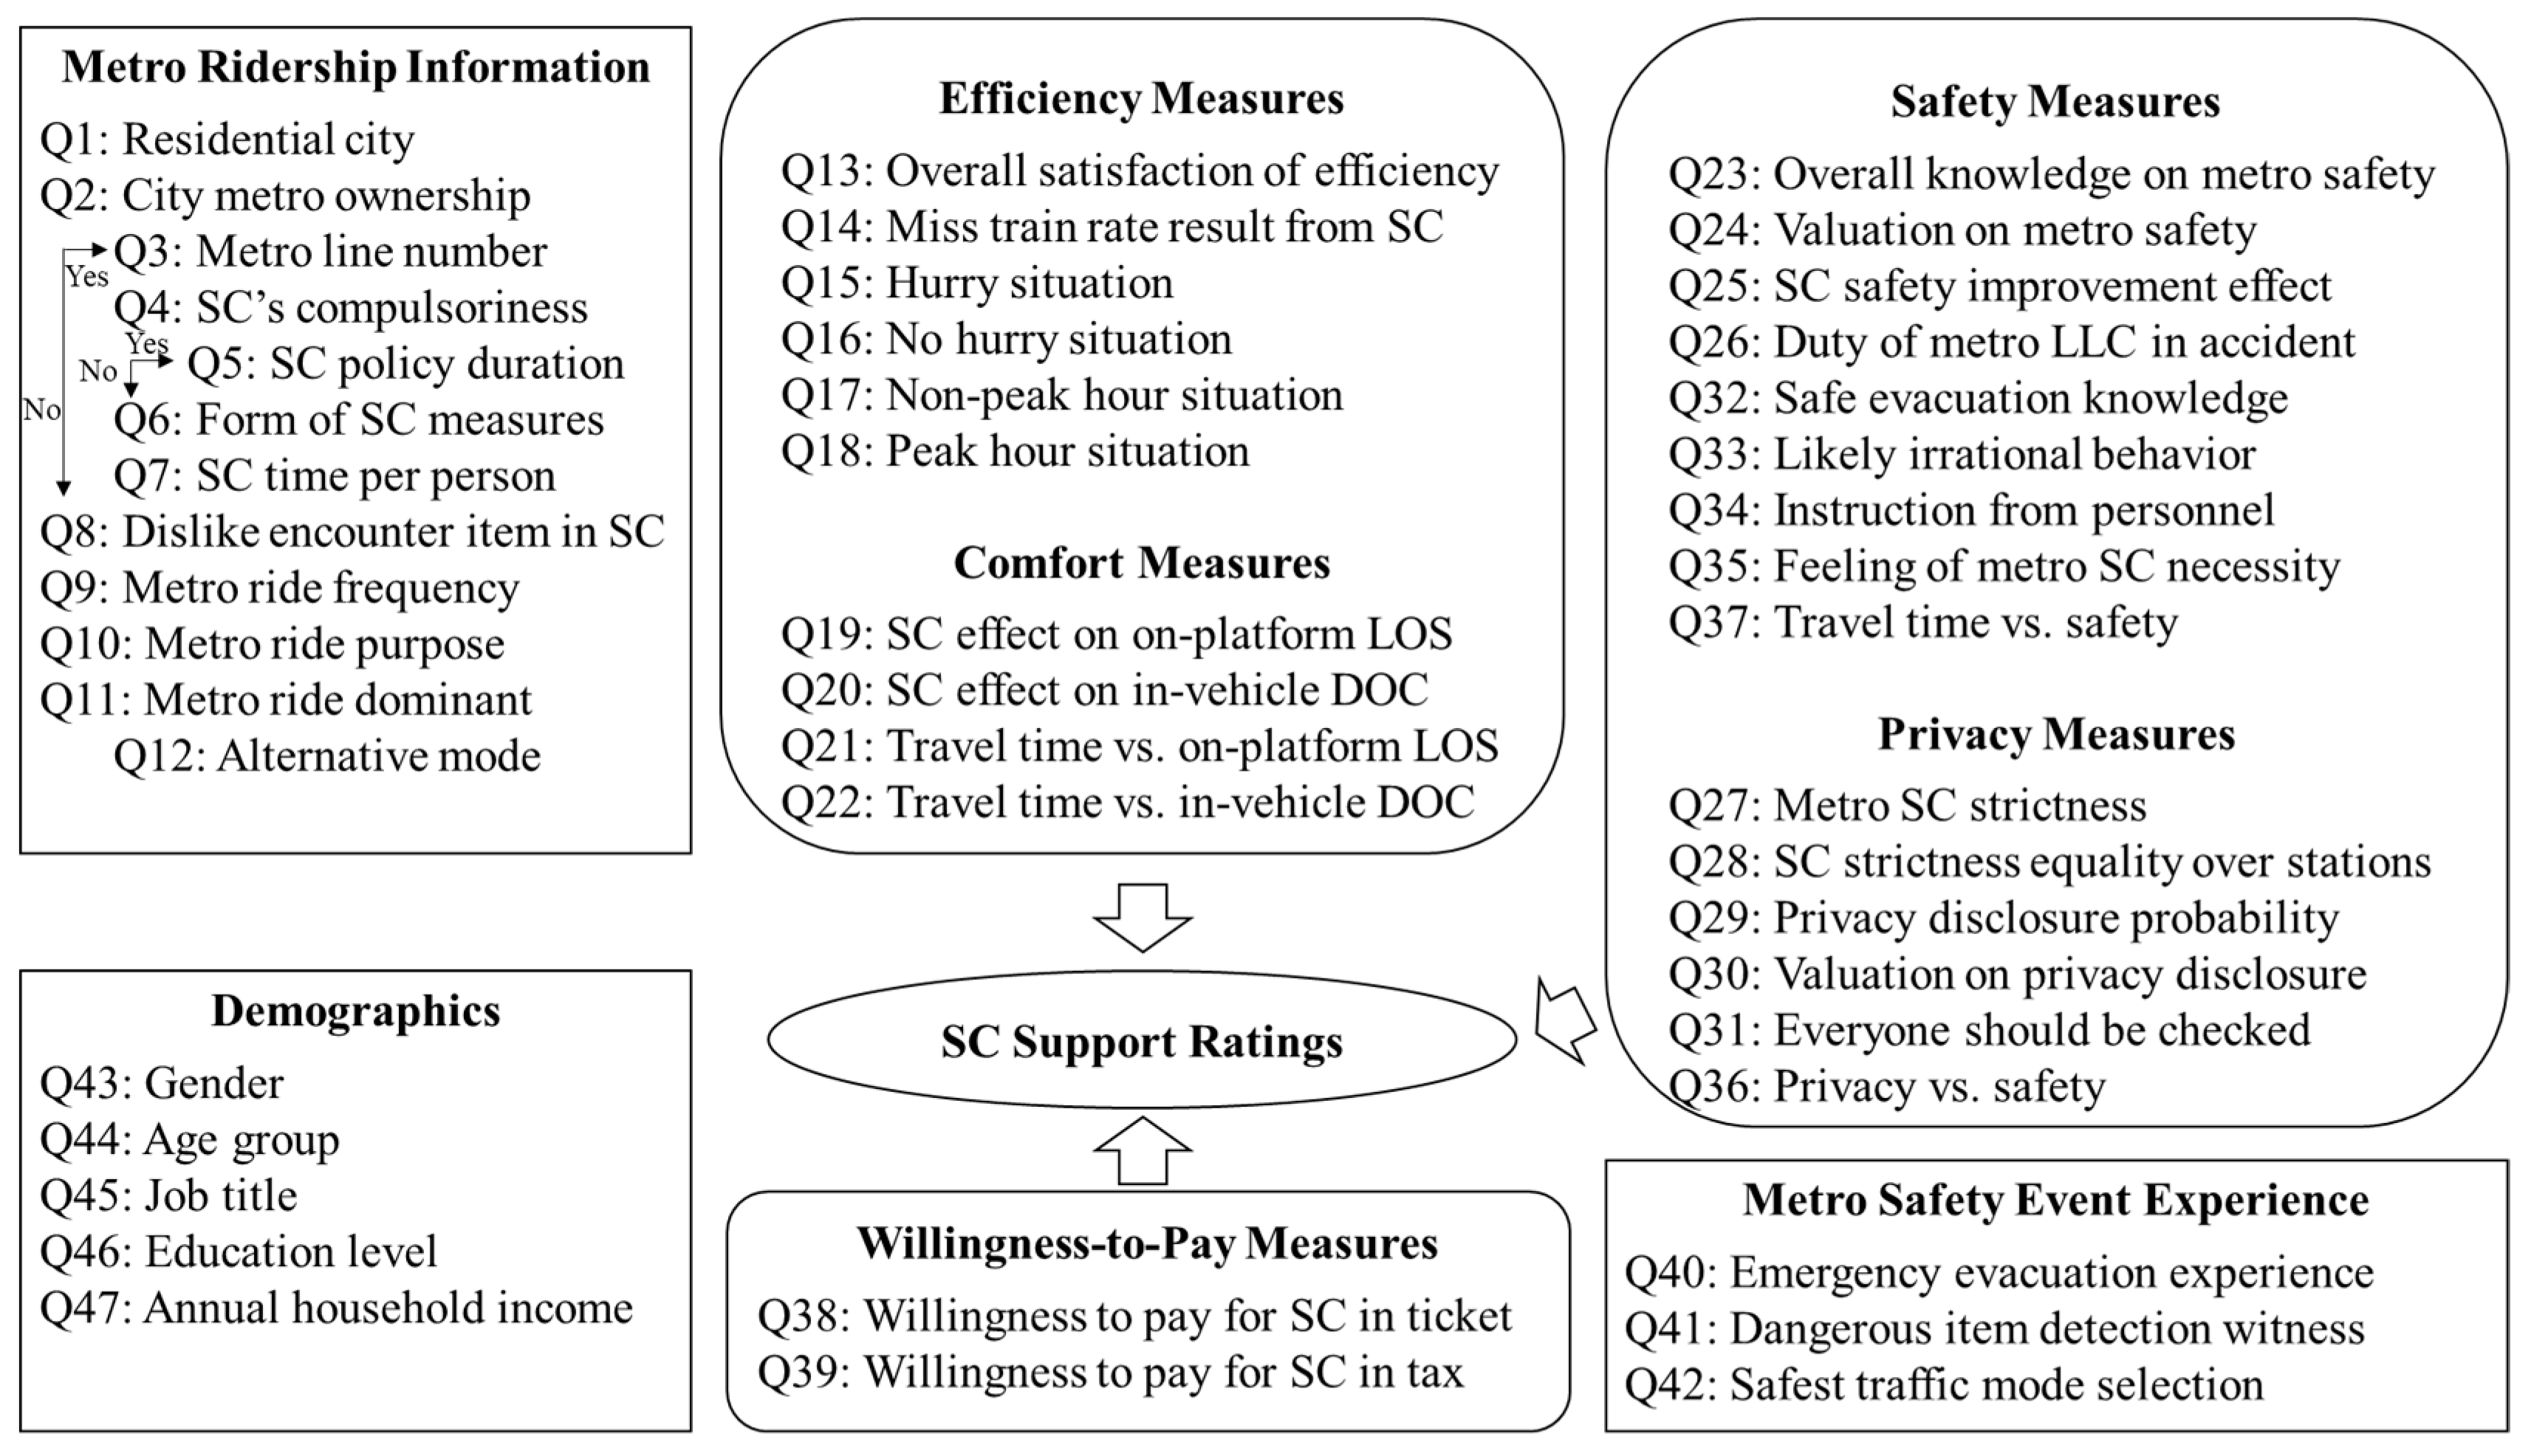
As shown in
Figure 1, we assumed the structure of perception, measuring items in five variables: Efficiency, Comfort, Safety, Privacy and Willingness-to-Pay. In order to measure the internal consistency of the items, reliability and validity tests were conducted to examine the 27 items from the 5 variables measured by using a Likert Scale (from Q13–Q39). Internal reliability was assessed using the Cronbach’s Alpha. If the alpha value is above 0.7, the internal consistency could be regarded as good [
28]. Meanwhile, to examine the sample adequacy as well as the suitability of data for factor analysis, internal validity was tested with Kaiser-Meyer-Olkin (KMO) statistics and Bartlett’s test of sphericity. When KMO value is over 0.5 and the Bartlett test of sphericity is significant (
p-value <0.05), it is considered as suitable for factor analysis [
28].
For the original 5-factor model, the communality of alpha value for all 27 items was 0.918 > 0.7 and the singular alpha value for each item was also above 0.9. This result indicated that the 27-item scale exhibited a good internal consistency. Meanwhile, the KMO value was 0.93 and the Bartlett’s test of sphericity was significant with a 99% confidence level (p-value <0.01), suggesting an acceptable measure of reliability. Therefore, the 27 items were suitable for factor analysis.
To test whether the data fit our hypothesized 5-factor measurement model, Confirmatory Factor Analysis (CFA) was conducted by use of the “
lavaan” package in “
R”: a free open source software for statistical analysis [
29]. NLMINB function was adopted as the optimization method and the diagonally weighted least squares (DWLS) was utilized as the estimator. Goodness of fit tests were conducted to evaluate the original 27-item, 5-factor model through the commonly adopted indices: Chi-Square/Degree of Freedom (χ
2/DF) = 3.402 > 3 (
p <0.0001), Comparative Fit Index (CFI) = 0.977 > 0.9, Tucker-Lewis Index (TLI) = 0.974 > 0.9, and Root Mean Square Error of Approximation (RMSEA) = 0.052 < 0.07. It was noted that χ
2/DF was above 3, which failed to satisfy the commonly recognized threshold, i.e., χ
2/DF < 3 [
30]. Therefore, to improve the reliability of the CFA model, we omitted the items with less factor loadings and modified the CFA model. Only the factor loading correlations greater than 0.40 were considered as suggested in the literature [
30]. From the CFA results for the original five-factor, 7 items with factor loadings less than 0.4 were removed (Q14, Q23, Q26, Q27, Q30, Q32, Q33).
Further, utilizing the remaining 20 items, another 5-factor model was re-specified. Repeating the above reliability and validity test, the updated Cronbach’s Alpha value was 0.938 > 0.7, KMO value was 0.94 and Bartlett’s test of sphericity was still significant (
p-value <0.01). This result suggested the improved model exhibited a better fit for factor analysis. The final factor structure correlation matrix for the improved 5-factor model was illustrated in
Table 3.
Goodness of fit of the improved CFA model was evaluated via the following indices: Chi-Square/Degree of Freedom (χ2/DF) = 2.244 < 3 (p <0.0001), Comparative Fit Index (CFI) = 0.993 > 0.9, Tucker-Lewis Index (TLI) = 0.992 > 0.9, and Root Mean Square Error of Approximation (RMSEA) = 0.038 < 0.07. The results suggested that the improved CFA model could provide an acceptable measure for the current 5 variables containing 20 items.
In addition, the correlation matrix of the five latent variables was calculated as shown in
Table 4. The paths, standardized loadings and the estimated errors of the five factor CFA model are illustrated in
Figure 3. The values of standardized factor loadings could be interpreted as the regression coefficient of latent variables. The relatively large loading could be more capable to explain the correlations between latent variables and observed variables.
3.3. Ordinal Logistics Regression
As the passengers’ perceptions were measured using a 5-point Likert scale, the rating from 1 to 5 could be considered as an ordinal scale. Therefore, to grasp a better understanding of the effects of demographic characteristics on the 27 items, separate Ordered Logistics Regression (Proportional Odds Logistic Regression) were performed by use of the “MASS” package in “R”. The independent variable in each regression model was one of the 27 items for the respondents’ ratings, while the dependent variables included the gender, age group, education level and annual household income.
The estimated coefficients (Coef.) values along with the standard errors (S. E.) for each item were aggregated and shown in
Table 5. Only when the association between the response and the terms was statistically significant (
p <0.05) at a 95% confidence level, the estimated results remained. General test results showed that several items did not have any significant result for all the four dependent variables. Therefore, the 7 items were reduced from the table (Q15, Q16, Q17, Q30, Q33, Q34, Q39). We could observe that there was no significant association with job title, and therefore it was omitted in
Table 5.
4. Results & Discussions
4.1. Summary Statistics for Basic Measures
Two parts of the survey (i.e., metro ridership information, metro safety critical event experience) only utilized basic measures e.g., single and multiple-choice items. The following paragraph described the frequency statistics for the 14 items.
With regards to the metro ridership information (Q2–Q12), 492 respondents (55.91%) were residence in a city with metro while 388 were from cities without a metro. Among the 492 responses, 467 (94.92%) of respondents claimed that they require mandatory SCs in metro stations in their cities. The average SC passing time distribution was as follows: less than half a minute (49.8%), half a minute to one minute (39.84%), two to three minutes (7.32%) and above three minutes (3.05%). The majority of SC measures were X-ray bag check machines (398 choices), metal detectors (303 choices), but less with SC gates (231 choices). Further, the time duration of the implement of mandatory SC policy among the 467 responses was also investigated and the distribution was as follows: less than one year (7.07%), one year to two years (26.98%), three to five years (32.12%) and above five years (33.83%).
For all the 880 valid responses, the top item that passengers would not like to encounter due to metro SCs was a long queue (44.2%). It was followed by privacy disclosure issues (19.66%) and missing trains (19.55%). Passengers displayed less valuation on dirty SC equipment (10.8%) and strict SC personnel (5.8%). Furthermore, the metro ride frequency displays a general average distribution from every day to every year. Meanwhile, the purpose of travel by metro were mostly commuting (33.41%) and leisure (34.77%) but less in business (7.84%). Of the respondents, 55.8% claimed the metro as their primary traffic mode in the city, while the majority of the other 44.2% selected driving (195 choices), ride-sharing (179 choices) and PT bus (216 choices) as their main modes.
Regarding metro safety event experiences (Q40–Q42), the majority of respondents (93.98%) claimed that they did not witness or experience an evacuation event in metro system. Likewise, 80.11% of them never saw any hazardous item been checked out at a SC site. At last, all the 880 respondents stated their preference for the safest mode of urban transportation. Of the respondents, 43.18% still selected the metro, followed by walking (28.64%) and bus (12.61%). Meanwhile, driving (6.93%) and cycling (5%) were not popular choices, while the least recognized traffic mode in terms of safety were travel by e-scooter (2.39%) and using a ride-sharing service (1.25%).
4.2. Interpretations of Perception Measures
As shown in
Figure 3, the mean rating for all the six items for efficiency were above 3 and the median rating was 4 (
Figure 3). As indicated from the ratings of Q13 (3.96), metro passengers in China were satisfied with the current metro system in terms of service efficiency. This rating could reflect that passengers almost had consensus on this item, as it had the lowest standard deviation (0.83) and the three quartiles of the boxplot nearly reached the same value of 4, as shown in
Figure 3. The highest ratings were spotted in Q15: “I’ll accept SC when I’m in a hurry and the train is about to leave” (4.08) and Q16: “I’ll accept SC when I’m not in hurry and the train has not arrived yet” (4.29). This result suggested that people display highly cooperative behavior under the mandatory SC policy, regardless of the potential consequences resulting from this action that could cause their trip efficiency loss. It is to be noted that respondents tend to agree that SC would not often make them miss the train (Q14). Additionally, referring from the results of mandatory SC implements during peak and non-peak hours (Q17 and Q18), respondents also tended to agree that mandatory SCs were necessary, without paying much attention to the queue length. However, the ratings in peak hour situation were a little lower than non-peak hour case (3.68 vs. 3.96), which could to some extent reflect many peoples’ dislike of encountering long queues, as mentioned in Q8.
Regarding comfort measures, the boxplots in
Figure 3 showed a consistency for the four items (Q19–Q22) as they were almost the same shape. Also, from the high ratings (over 3 mean rating and 4 median rating), it could be indicated that the majority of passengers were inclined to sacrifice their trip efficiency in exchange for higher comfort levels both on platforms and in vehicles. However, compared with other items, the standard deviations for the four items were relatively large. This result showed that such trade-offs were also very controversial.
In terms of safety measures, the results from the ratings displayed a relatively diverse trend. Overall, passengers valued safety as the highest priority of their metro rides. As observed from the high ratings in Q24: “I care about the potential threats in metro system” (3.83), passengers were generally concerned with the safety of metro systems. As a result, many passengers were in favor of metro SC for safety consideration as indicated from the high agreements in Q25: “I think SC can make the metro system safer” (4.11) and Q35: “I think it is necessary to implement SC for safety purpose” (4.23). Regarding the safety issues and knowledge, the average rating of Q23: “I know the safety situation and threats of metro systems in China”, was 3.35, suggesting that passengers had some knowledge on the threats and safety issues at metro systems. These results were perhaps due to people being familiar with reported terrorist attacks in metro systems (e.g., the London Underground Bombings) around the world as covered in news media. It is interesting to note that the respondents were of the opinion that the responsibility for safety events should be taken by the metro company (Q26). Although, most respondents stated that they know the evacuation procedure and are able to evacuate orderly and safely (Q32), they were still likely to follow the instructions from the SC personnel (Q34). The majority of respondents were likely to behave rationally by not rushing to pick up the bags/luggage during evacuation (Q 33). Finally, most of the respondents were willing to trade-off trip efficiency in exchange for safer trips as reflected in the high ratings in Q37 (4.01).
With regards to the privacy measures, the average ratings for the six items were above 3.0. Generally, passengers were concerned about potential privacy breach and disclosure (Q30, with a mean rating of 3.84). Peoples’ perceptions were affected by whether a metro SC would affect their privacy (Q29, with a standard deviation of 1.05). Despite the privacy concerns, the majority of passengers still insisted that every passenger should be checked for public safety (Q29, with the highest mean rating of 4.24) and all the stations should have applied SC rules at the same strict level (Q28, with a mean rating of 3.82). At last, in terms of the trade-offs between privacy and safety, passengers had slight agreement and a relatively large diversity from Q36 (mean rating of 3.56 and standard deviation of 1.15). This result was different from the European passenger survey, where it was reported that passengers were willing to sacrifice their privacy in exchange for safety [
23]. This discrepancy might be due to two reasons: On one hand, European passengers have experienced threats from terrorisms in recent time as the majority of terrorist attacks on railway systems occurred in Europe [
21], while in China such attacks have never been reported, though there have been occasional stampede in train station [
31]. On the other hand, consciousness of human rights has grown among Chinese people in recent decades, resulting in increased awareness of individual rights to privacy [
32].
The last measure was passengers’ perceived willingness to pay for the improvement of metro SCs, which has also been studied in Europe [
22,
24]. In the current metro systems, the costs of SCs included equipment and personnel, and the costs are usually borne by the metro companies. In Europe, such additional expenses are often directly transferred to the metro passengers through increased ticket prices. In contrast, in China the form of cost transfer is different compared to European countries. The current bearer of additional metro SC costs in China is Chinese government, in the form of financial allocation to the metro companies. However, indirectly, the metro SC costs are borne by the taxpayers in China. In our survey, we stated the European mode in Q38: “As a passenger, I’m willing to pay for the cost of SC improvement in the ticket fee to the metro company”. However, passengers responded with a relatively high unacceptable attitude towards such mechanism, given the mean rating for this item was 2.98, and the standard deviation was as high as 1.27. On the contrary, the majority of passengers were more likely to accept the current mode of cost payment reflected from the 4.07 mean rating of Q39: “As a taxpayer, I support the Chinese government to make further investment into the metro SC system”.
4.3. Structures for Perception Measures
Through the CFA, the 27-item perception measure was reduced to 20 items. Given the good internal consistency (α >0.7, KMO >0.5) and the acceptable goodness of fit in the re-specified 5-factor model (χ2/DF <3, CFI >0.9, TLI >0.9, RMSEA <0.07), the final model could be able to represent the structure of the perception measures. In addition, the standardized factor loadings of each item and their correlation coefficients with each variable were shown in
Figure 4.
Correlation coefficients of the five latent variables in the final CFA model were shown in
Table 4. Overall, the five variables displayed high correlations with each other. Particularly, the coefficients across safety, privacy and willingness-to-pay were over 0.9. This was perhaps the result of the strong correlations of the items from the three variables. For instance, the privacy issue proposed in the survey had strong interrelationships with public safety such as the trade-off between privacy and safety, the SC strictness level and frequency. Likewise, the payment of the additional costs arose from the need of safety improvements.
4.4. Impacts of Demographics on Perceptions
To explore the demographic differences in passengers’ perceptions of metro SCs, a series of ordinal logistic regression models were estimated for each item under demographic characteristics. It was observed that not all the items were statistically significant at a 95% confidence interval (
Table 5).
About the gender effects, 9 models were statistically significant. Only one efficiency measure (Q18) was observed to be significant with gender. The positive coefficient indicated that females favored of SCs during peak hours. The gender effects were more noticeable in comfort measures, as the ratings in all the four items (Q19–Q22) were found to be statistically significant with gender. This result showed that females were more concerned with trip comfort both on the platform and in the train. In addition, not only would they support SC implementation, but they also were also more willing to trade-off their travel efficiency for less crowded waiting and riding experiences. This was probably because that women are more vulnerable to sexual harassment which sometimes occurs in metro systems, especially in congested situations [
33]. Regarding safety measures, three models passed the statistical test (Q23, Q35, Q37). Males were reported to have more knowledge on the overall safety situation of metro systems in China, as the ratings in Q23 displayed a negative correlation with gender. Meanwhile, females were inclined to have high ratings of mandatory SCs and they would also like to trade-off trip efficiency for a safer ride. Only one item in privacy measure (Q27) was significant with gender, with females scoring lower rates to the strictness level of the current metro SC in China. No gender effect was found in willingness-to-pay measures.
Regarding the effects of age group, 12 models passed the statistical test. In terms of efficiency measures (Q13, Q14), younger passengers were more dissatisfied with the current service of metro systems. Furthermore, they were more likely to disagree that metro SCs would not often make them miss the train. No age group effect was spotted in comfort measures. With regards to safety measures, four models passed the statistical test (Q23–Q26). Older passengers were observed to know and care more about the overall safety situations in metro systems. They were perceived to be in favor of SCs and held the opinion that metro companies should be responsible for the safety events. In terms of privacy measures, except for Q30, all the other five items were significant with age group. It was indicated that older people tended to compromise their privacy for safety, as they tended to agree the strictness level should be the same for every passenger in every station, while they were inclined to agree that metro SCs would not offend their privacy. Finally, one willingness-to-pay measure passed the test, suggesting that older people were more willing to pay for the SC costs in the ticket price as compared with younger people.
In terms of the effects of education level, only 3 models passed the statistical test and the correlation coefficients were all negative. For comfort purposes, passengers with a lower education level tended to support the SC implementation for both peak and non-peak hours, but this trend could not be observed in their willingness to trade their trip efficiency for comfort. Another interesting finding in Q32 was that passengers with a higher education level tended to have less knowledge on how to evacuate orderly and safely under emergency conditions. This result suggested that high education level did not necessarily correlate to high level of safety knowledge.
At last, the effects of annual household income range were also investigated. Only one model passed the statistical test (Q31). It was observed that passengers with higher income tend to disagree with the policy that every passenger should be mandatorily checked.
5. Conclusions
Passengers’ crowd mobility and safety in metro stations is an emerging challenge due to the surge of passenger volumes and the threats from terrorism and personal crime. To ensure the safety of metro system, security check systems have been implemented into the majority of metro stations in China. Previous socio-psychological surveys on metro systems have not systematically investigated passengers’ perceptions of metro SCs effects, incorporating the tradeoffs across efficiency, comfort, safety, privacy and willingness-to-pay from the passengers’ perspective.
To fulfill these critical knowledge gaps in the literature, this study performed a questionnaire survey of 880 metro passengers in China. The questionnaire consisted of 47 items, among which 27 items were developed to capture passengers’ perceptions of metro SC in terms of efficiency, comfort, safety, privacy and willingness-to-pay. Results from a series of statistical analyses showed that most passengers tend to agree with the service and safety situation of current metro systems in China. Most of them would support and cooperate with the introduction of mandatory metro SCs for every passenger in every station at the same strict level. Under normal conditions, passengers would accept mandatory SCs for both peak and non-peak hours regardless of whether they were in a ‘hurry’. Under emergency situations, passengers reported they would follow the instructions from personnel in metro stations and would not perform irrational behaviors such as rushing to pick their bags. Chinese passengers would like to accept the current form of paying for SC costs via tax rather than the European method of paying through increased ticket prices. In terms of the tradeoffs, most passengers valued safety more than trip efficiency and privacy and they would trade-off their travel time and privacy for safer metro rides. Likewise, some passengers would like to sacrifice their trip efficiency to exchange for more comfort and less crowded trip experience.
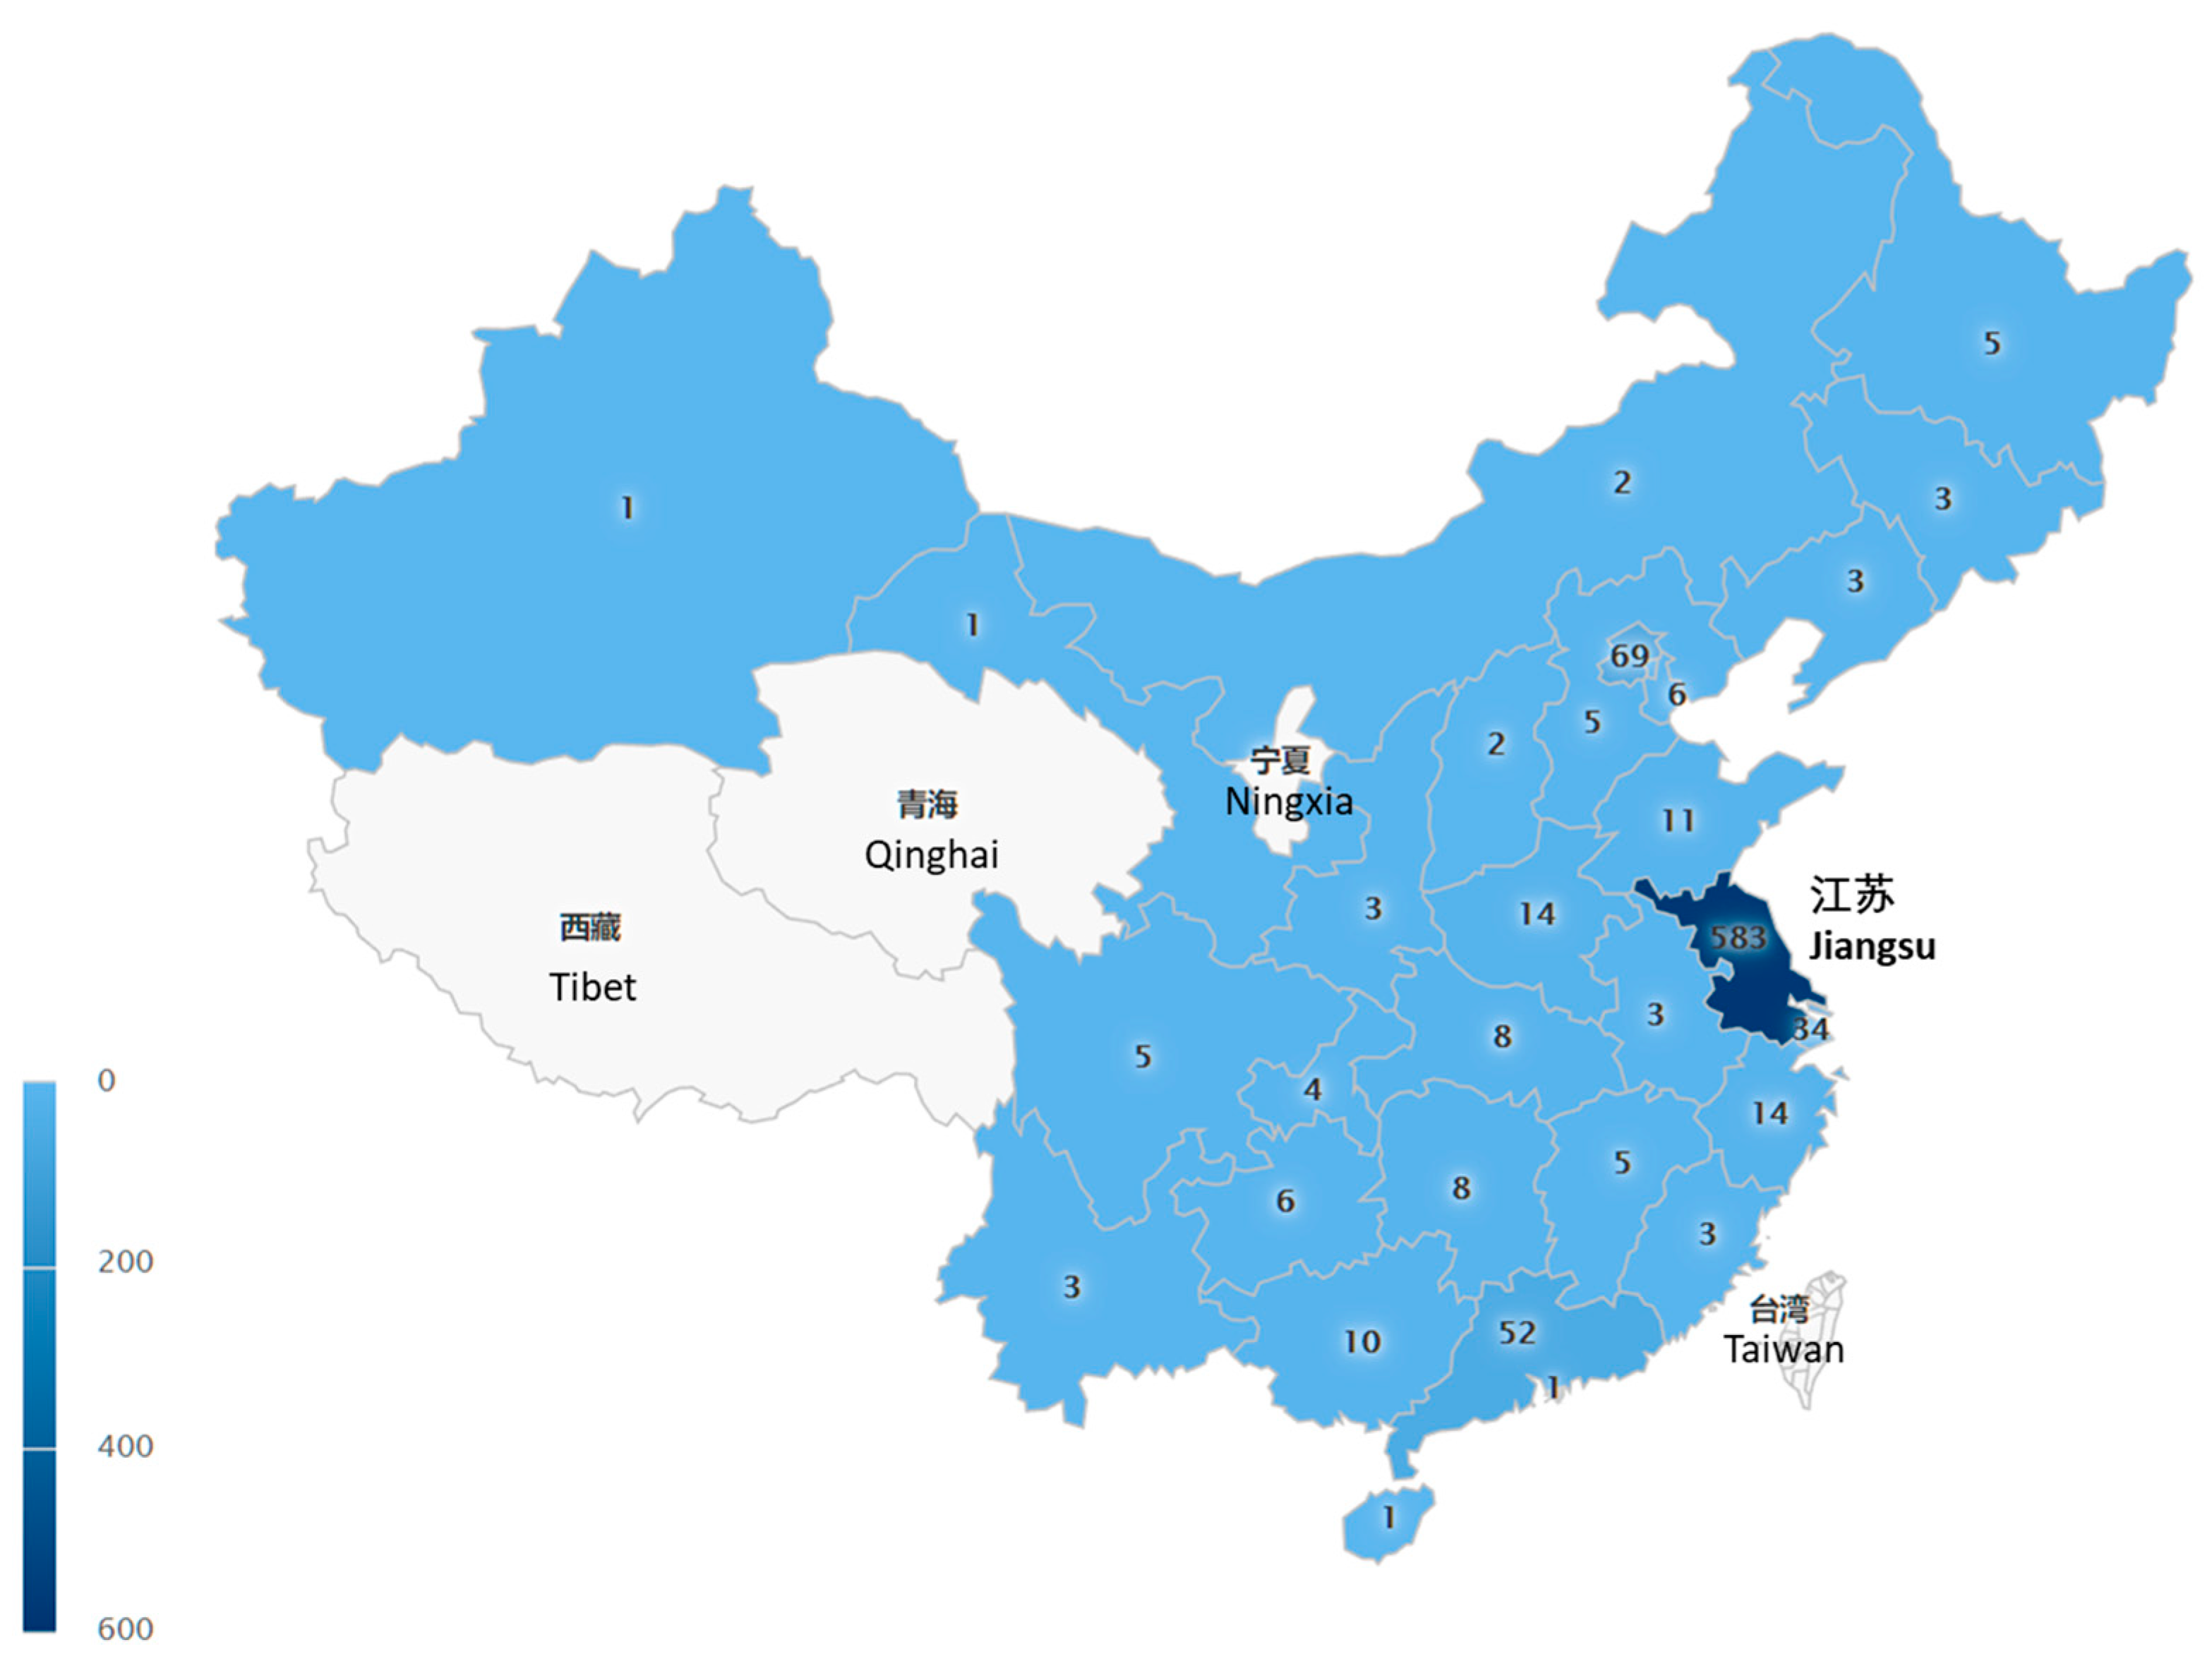
There were several limitations of this study. Most of the responses were from students and teachers with relative high education level and the majority of respondents were from Jiangsu province, which may not represent diversity of the users of the metro system. In addition, it is to be noted that the survey only measured their reported perceptions, while there might be differences in their perceptions and actual behavior in real life. Nevertheless, this study provided some valuable insights on the prospects and likely barriers on the implementation of SC system in major train stations. In future, similar study is encouraged to be carried out in different geographic regions facing the safety and security challenges at railway system and learn from each other experiences.


