Article

Evaluation of Sustainable Livelihoods in the Context of Disaster Vulnerability: A Case Study of Shenzha County in Tibet, China

1
Institute of Geographic Sciences and Natural Resources Research, Chinese Academy of Sciences, Chaoyang District, Beijing 100101, China
2
University of Chinese Academy of Sciences, Beijing 100049, China
3
Department of the Human-Earth System and Regional Development, Xinjiang Institute of Ecology and Geography, Chinese Academy of Sciences, Urumqi 830011, China
*
Author to whom correspondence should be addressed.
Sustainability 2019, 11(10), 2874; https://doi.org/10.3390/su11102874
Submission received: 26 March 2019 / Revised: 16 May 2019 / Accepted: 17 May 2019 / Published: 21 May 2019
(This article belongs to the Section Sustainability in Geographic Science)

Abstract

:
The issue of achieving sustainable livelihoods (SL) is a persistent problem that has gained significant interest for all countries. Even though contexts of vulnerability have been highlighted to be critical to SL, the difference of SL under vulnerability contexts, particularly disaster, has been ignored. As one disaster-prone area, there is an urgent need to conduct studies on SL in Shenzha, within the context of the construction of a national park. This paper proposes to address this research gap by evaluating SL under various disaster contexts in Shenzha, China. According to the frequency of natural disasters, towns in Shenzha can be divided into three groups: Snowstorm and windstorm-dominated towns (SWT), mixed towns (MT) and drought-dominated towns (DT). The results showed that (1) a great disparity of SL can be observed among the three vulnerability groups. The scores of these SL were sorted into descending order as: DT > SWT > MT. (2) In detail, herdsmen in DT have a high value of SL because they have high livelihood assets, livelihood strategies and disaster management capabilities. (3) Herdsmen in SWT have high livelihood assets, particularly human and financial assets, and livelihood strategies. (4) The low livelihood assets and livelihood strategies have restricted the SL of herdsmen in MT. An analysis of SL under various disaster contexts helped to depict the characteristics of SL. Accordingly, targeted policies were developed for the development of SL under various disaster contexts.

1. Introduction

The long-lasting climate change on a global scale will continue to change for decades, at rates projected to be unprecedented in human history [1]. Global climate change research in recent years has seen increasing interest in livelihoods enhancement [2]. Livelihoods are a combination of resources, which include capabilities, assets and activities that are necessary for the support of living activities [3,4]. Even though the rate of global poverty has been decreased sharply since 2000, the issue of livelihoods is a persistent issue worldwide. Livelihoods are considered to be sustainable only if they can cope with and recover from stress and shocks, as well as maintain and strengthen assets, activities and capabilities without destroying the natural resource base [5]. Studies on sustainable livelihoods (SL) have direct implications in achieving the Sustainable Development Goals (SDGs), which is a global development agenda issued by the United Nations (UN) in 2015 [6].
Recent years have seen rising interests in sustainable livelihood approaches in order to understand the accessibility of livelihood assets to different households [4,5,
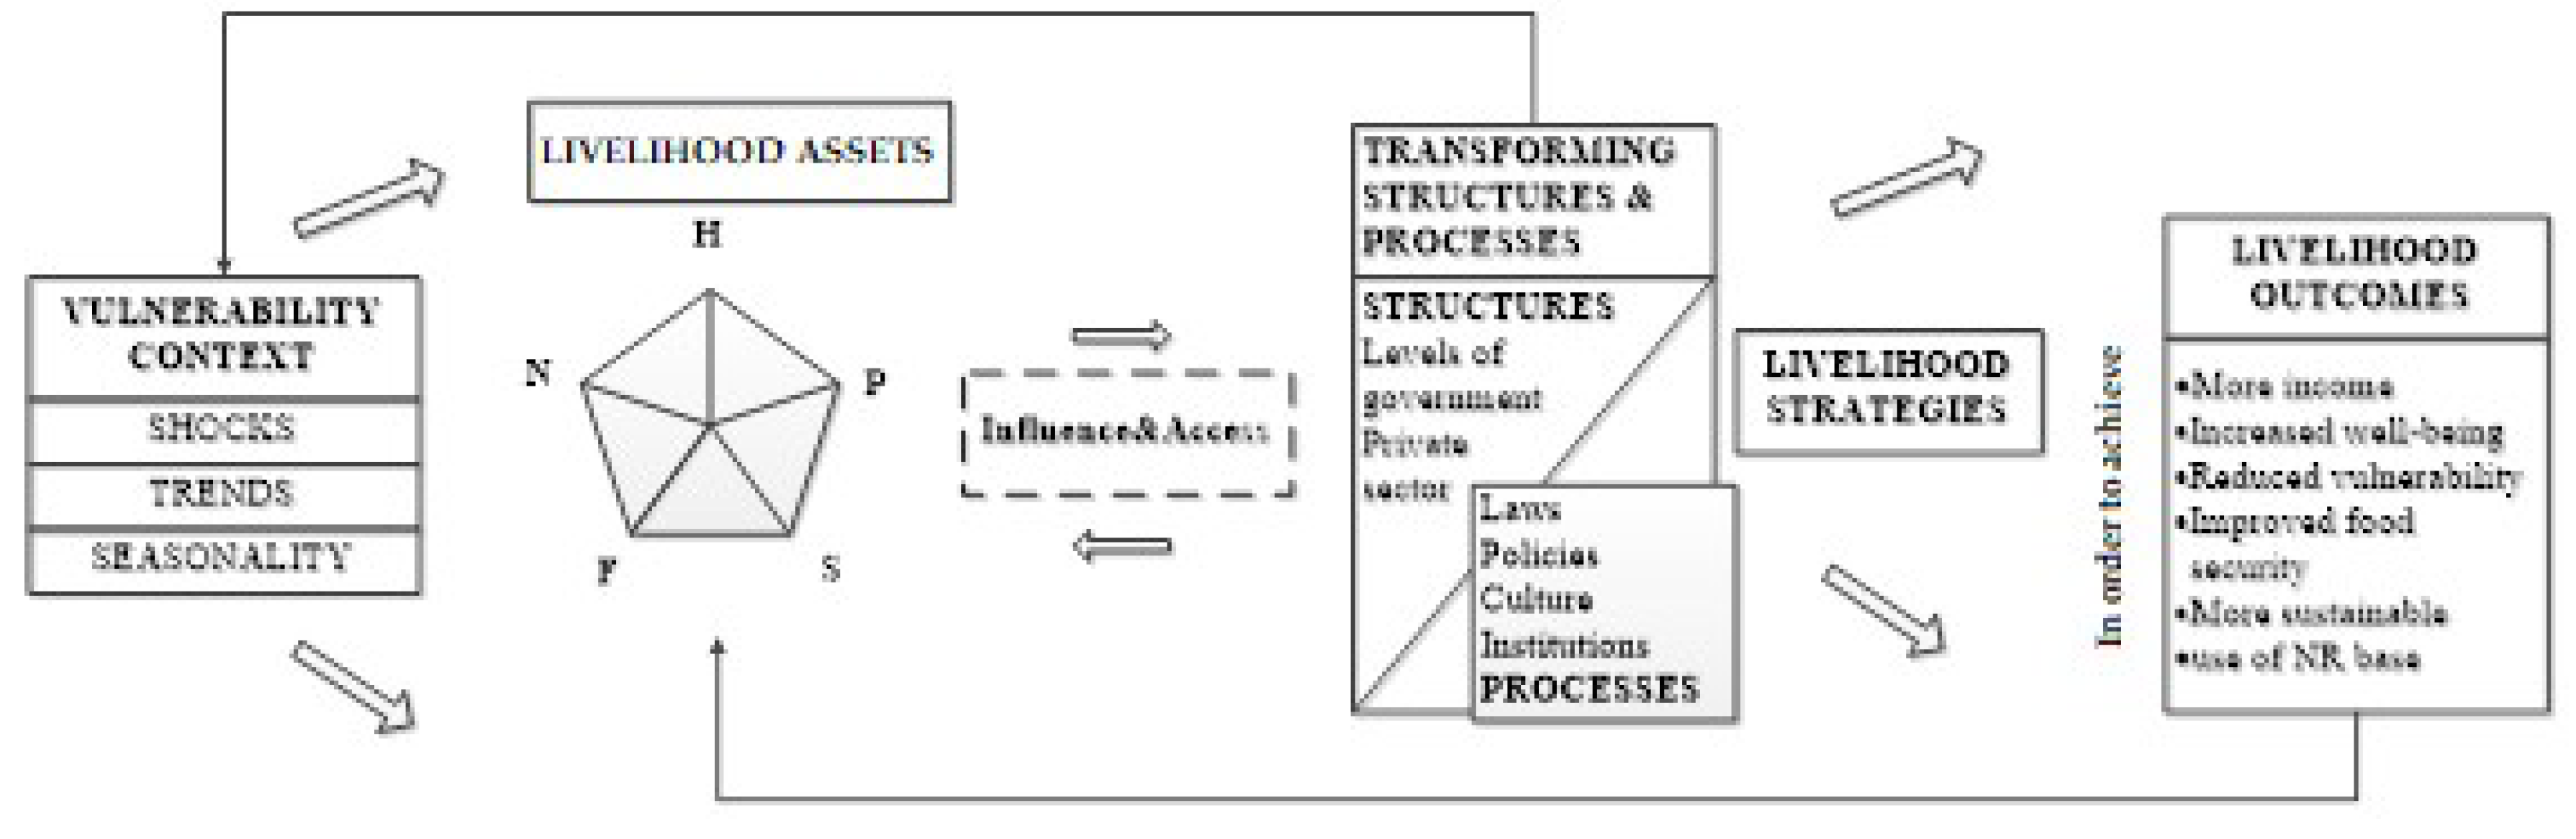
7]. The most commonly used framework for these studies is the sustainable livelihoods framework (SLF), which was established by the United Kingdom’s Department for International Development (DFID) [8] (Figure 1). In the framework, there are five main components, including vulnerability context, livelihood assets, transforming structure and processes, livelihood strategies and outcomes. Specifically, the vulnerability context refers to the external environment which is vulnerable. In general, it can include shocks, trends and seasonality, which are beyond the control of people. Livelihood assets include five forms of assets, which are human (H), physical (P), social (S), financial (F) and natural (N) assets. The choices that people make and the activities that people undertake in order to achieve their livelihood goals are mentioned as livelihood strategies.
In general, the current studies on SL focus on three main research agendas from a geographical perspective. The first agenda is to address the relations among the five components. Under certain vulnerability contexts, livelihood strategies can always be adopted in order to seek livelihood assets and outcomes [9,10]. Transforming structures and processes can affect all elements at a high level by determining the availability of resources, thus affecting the exchange conditions among livelihood assets and strategies [11]. The second research agenda focuses on assessing SL and its temporal and spatial differences. The key components can always be identified, and thus help to understand SL and provide development references for policy assessment [12,13]. The third research agenda is to address external factors’ impact on SL and their components. In particular, environmental changes, land use and rural tourism have been well-examined to have great impacts on SL [14,15].
It is the second research agenda that we aim to address in this analysis. While reviewing the literature on the livelihood sustainability index (LSI), the most commonly used indicators are mainly based on livelihood assets and strategies [16]. Even though vulnerability contexts have been highlighted to be critical to SL, the literatures on the difference of SL under vulnerability contexts are thin. In general, vulnerability can be defined in a number of ways, depending on the multi-disciplinary context [17]. Among these, one of the widely accepted definitions is that vulnerability is the ability or inability of individuals or social groupings to respond to, cope with, recover from, or adapt to, any external stress placed on their livelihoods and well-being [18,19]. Moreover, vulnerability has been functioned by sensitivity, exposure unit and adaptive capacity [20]. The exposed factors (e.g., climate disasters) have made profound impacts on agriculture in the form of increased crop pests and disease outbreaks, frequency and severity of droughts, high livestock mortality and reduced yields [21]. What is worse, is that the vulnerability of poor and mountain-dwelling people is sensitive, because of their associations with natural systems [22]. Adaptation ensures quality and functional out-production, maximizing profit, positive changes of attributes on a system and long-term sustainability [20]. In this context, livelihood assets and strategies will be different because of the difference in vulnerability.
Therefore, depicting the characteristics of SL to the vulnerability to various disasters is an important step in reducing vulnerability and accelerating resilience.
Climate change’s impact on rural populations in developing countries is apparent, since their main livelihoods are constituted by agriculture and many other components [
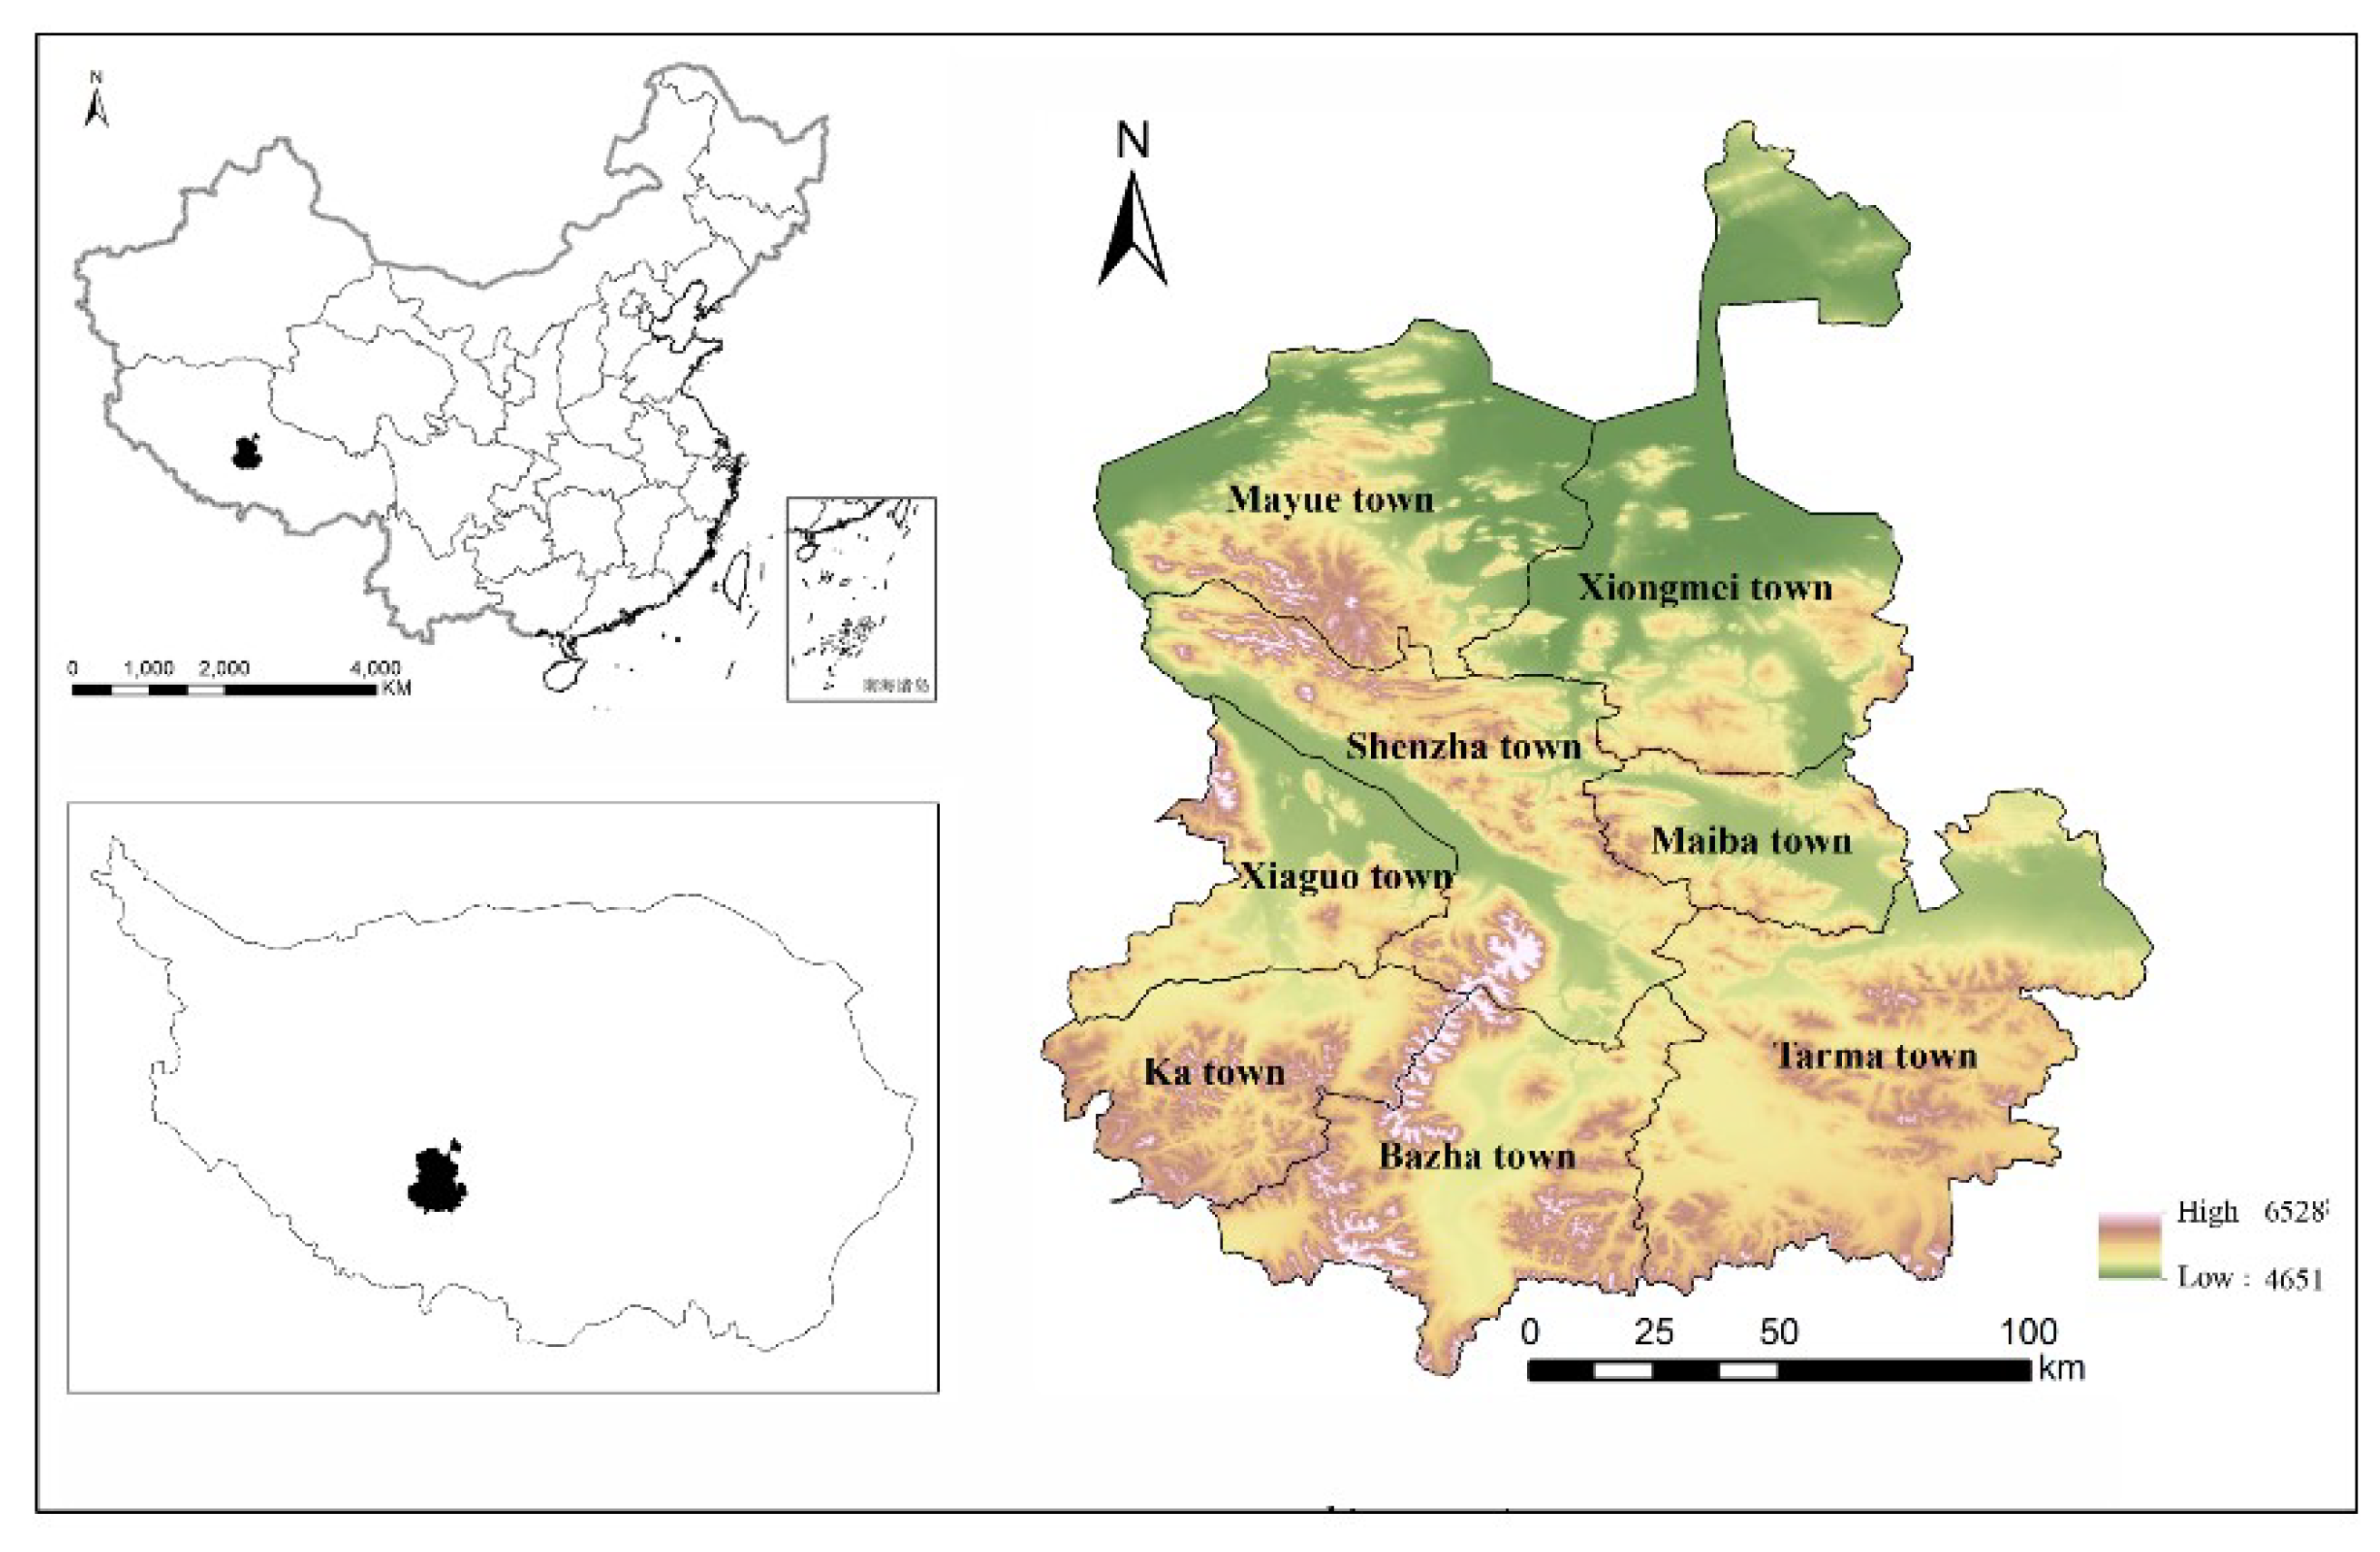
18]. Shenzha County, located in the most economically-undeveloped province (Tibet) in China, has the highest incidence of poverty, with a high proportion above 18.06% [23]. Population has increased rapidly, with the average annual growth rate of 26.89% in Shenzha County. Shenzha is a typical husbandry county where grassland is the dominant ecosystem type, accounting for more than 81.52% of the total land area [24]. Herdsmen there traditionally depend upon agriculture and animal husbandry for survival. However, influenced by changeable climate and disasters which are largely shaped by the complex terrain and atmospheric circulation [25,26], recent decades have seen a serious problem of grassland degradation in the Tibetan Plateau [27,
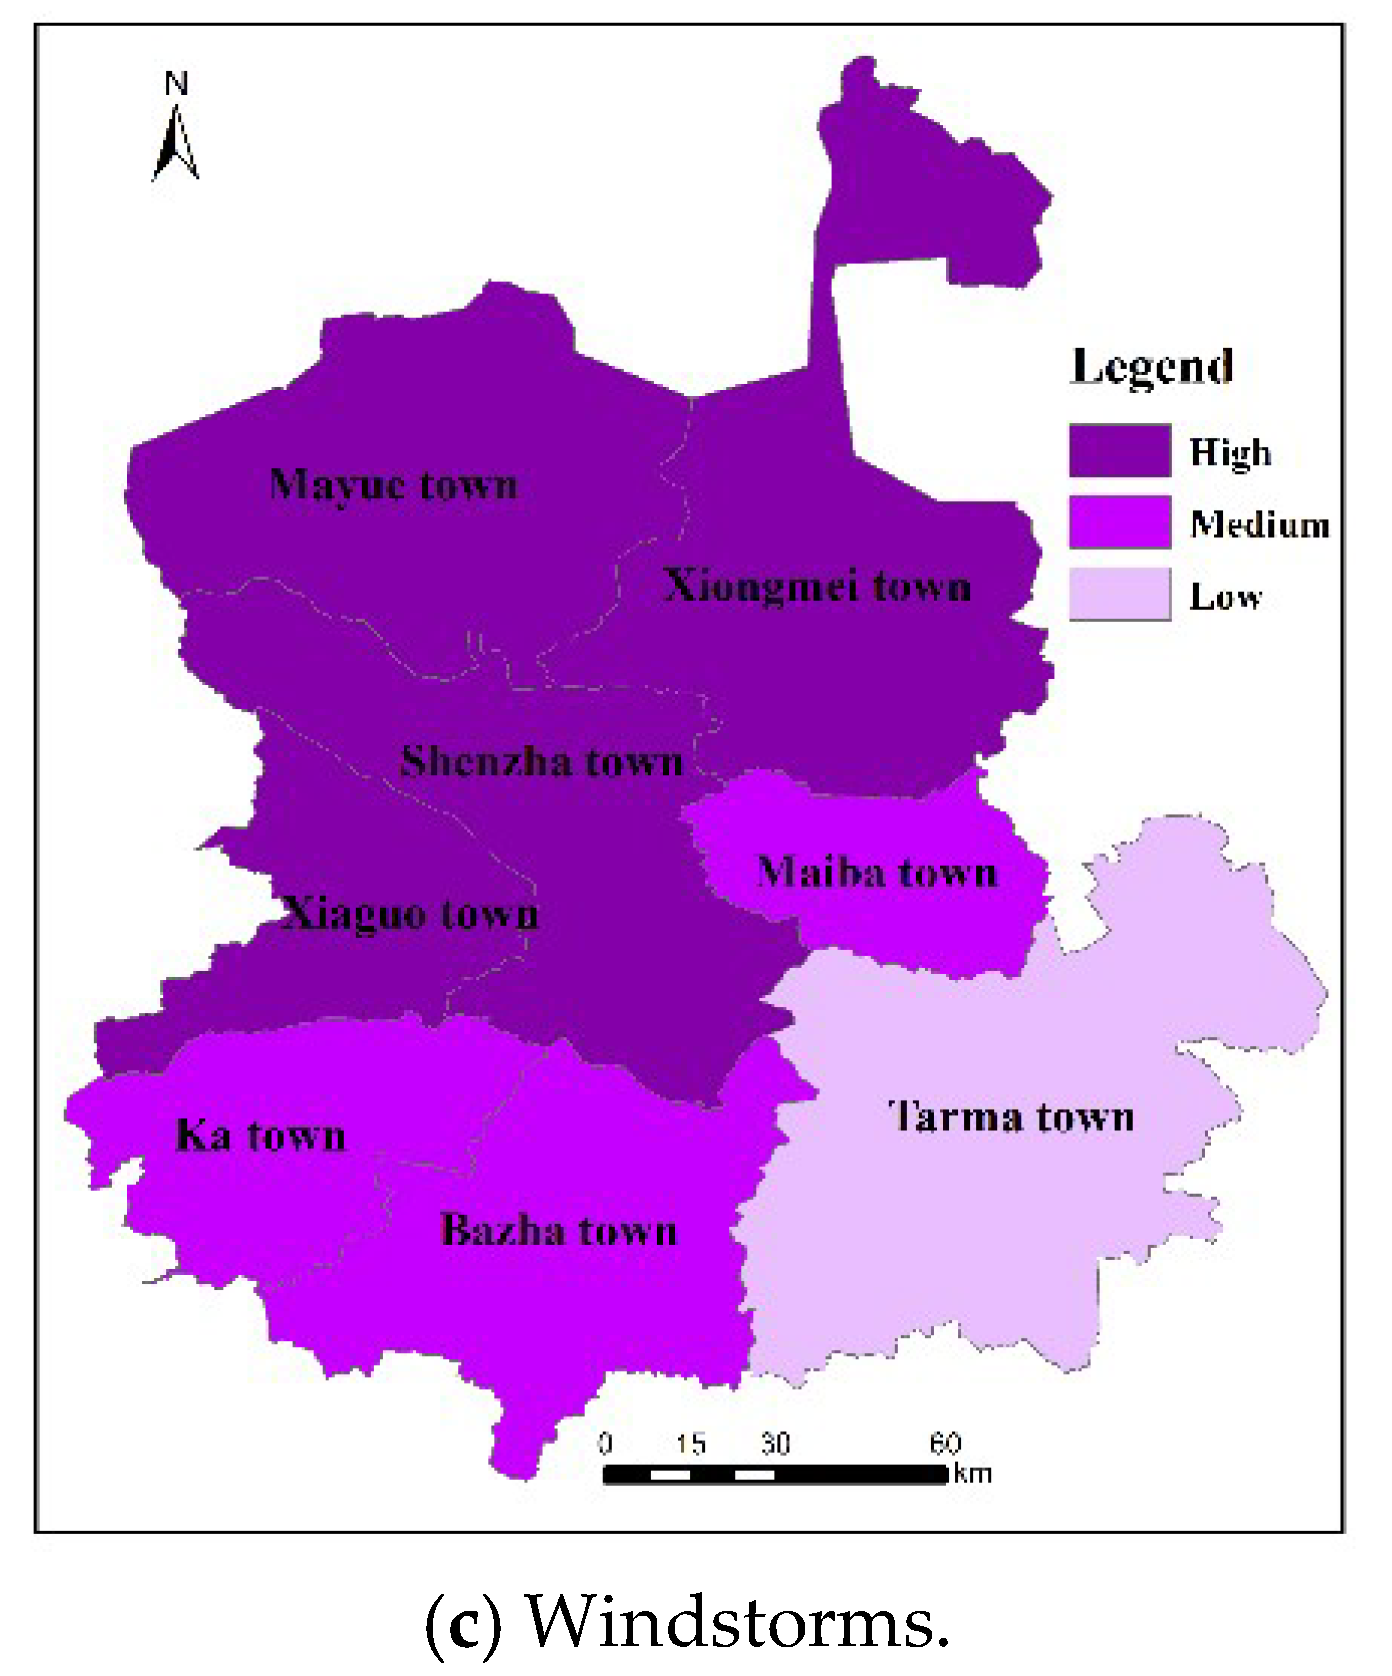
28]. What is worse than this, is that snowstorms, combined with other environmental stressors, such as drought and windstorms, have led to extremely harsh conditions for livestock grazing, and even a high livestock mortality rate [29,30,31]. Rapid population growth, poverty, grassland degradation and climate disaster have intensified vulnerability in this county. As a result, the impacts of climate disasters in Shenzha have already led to great loss in agriculture and animal husbandry. Moreover, according to the report by the International Panel on Climate Change, winter precipitation in most parts of the Tibetan Plateau will continually increase [32]. Therefore, the increasing frequency of natural disasters is foreseeable, and thus will cause more challenges for the sustainable livelihoods of herder communities in Tibet.
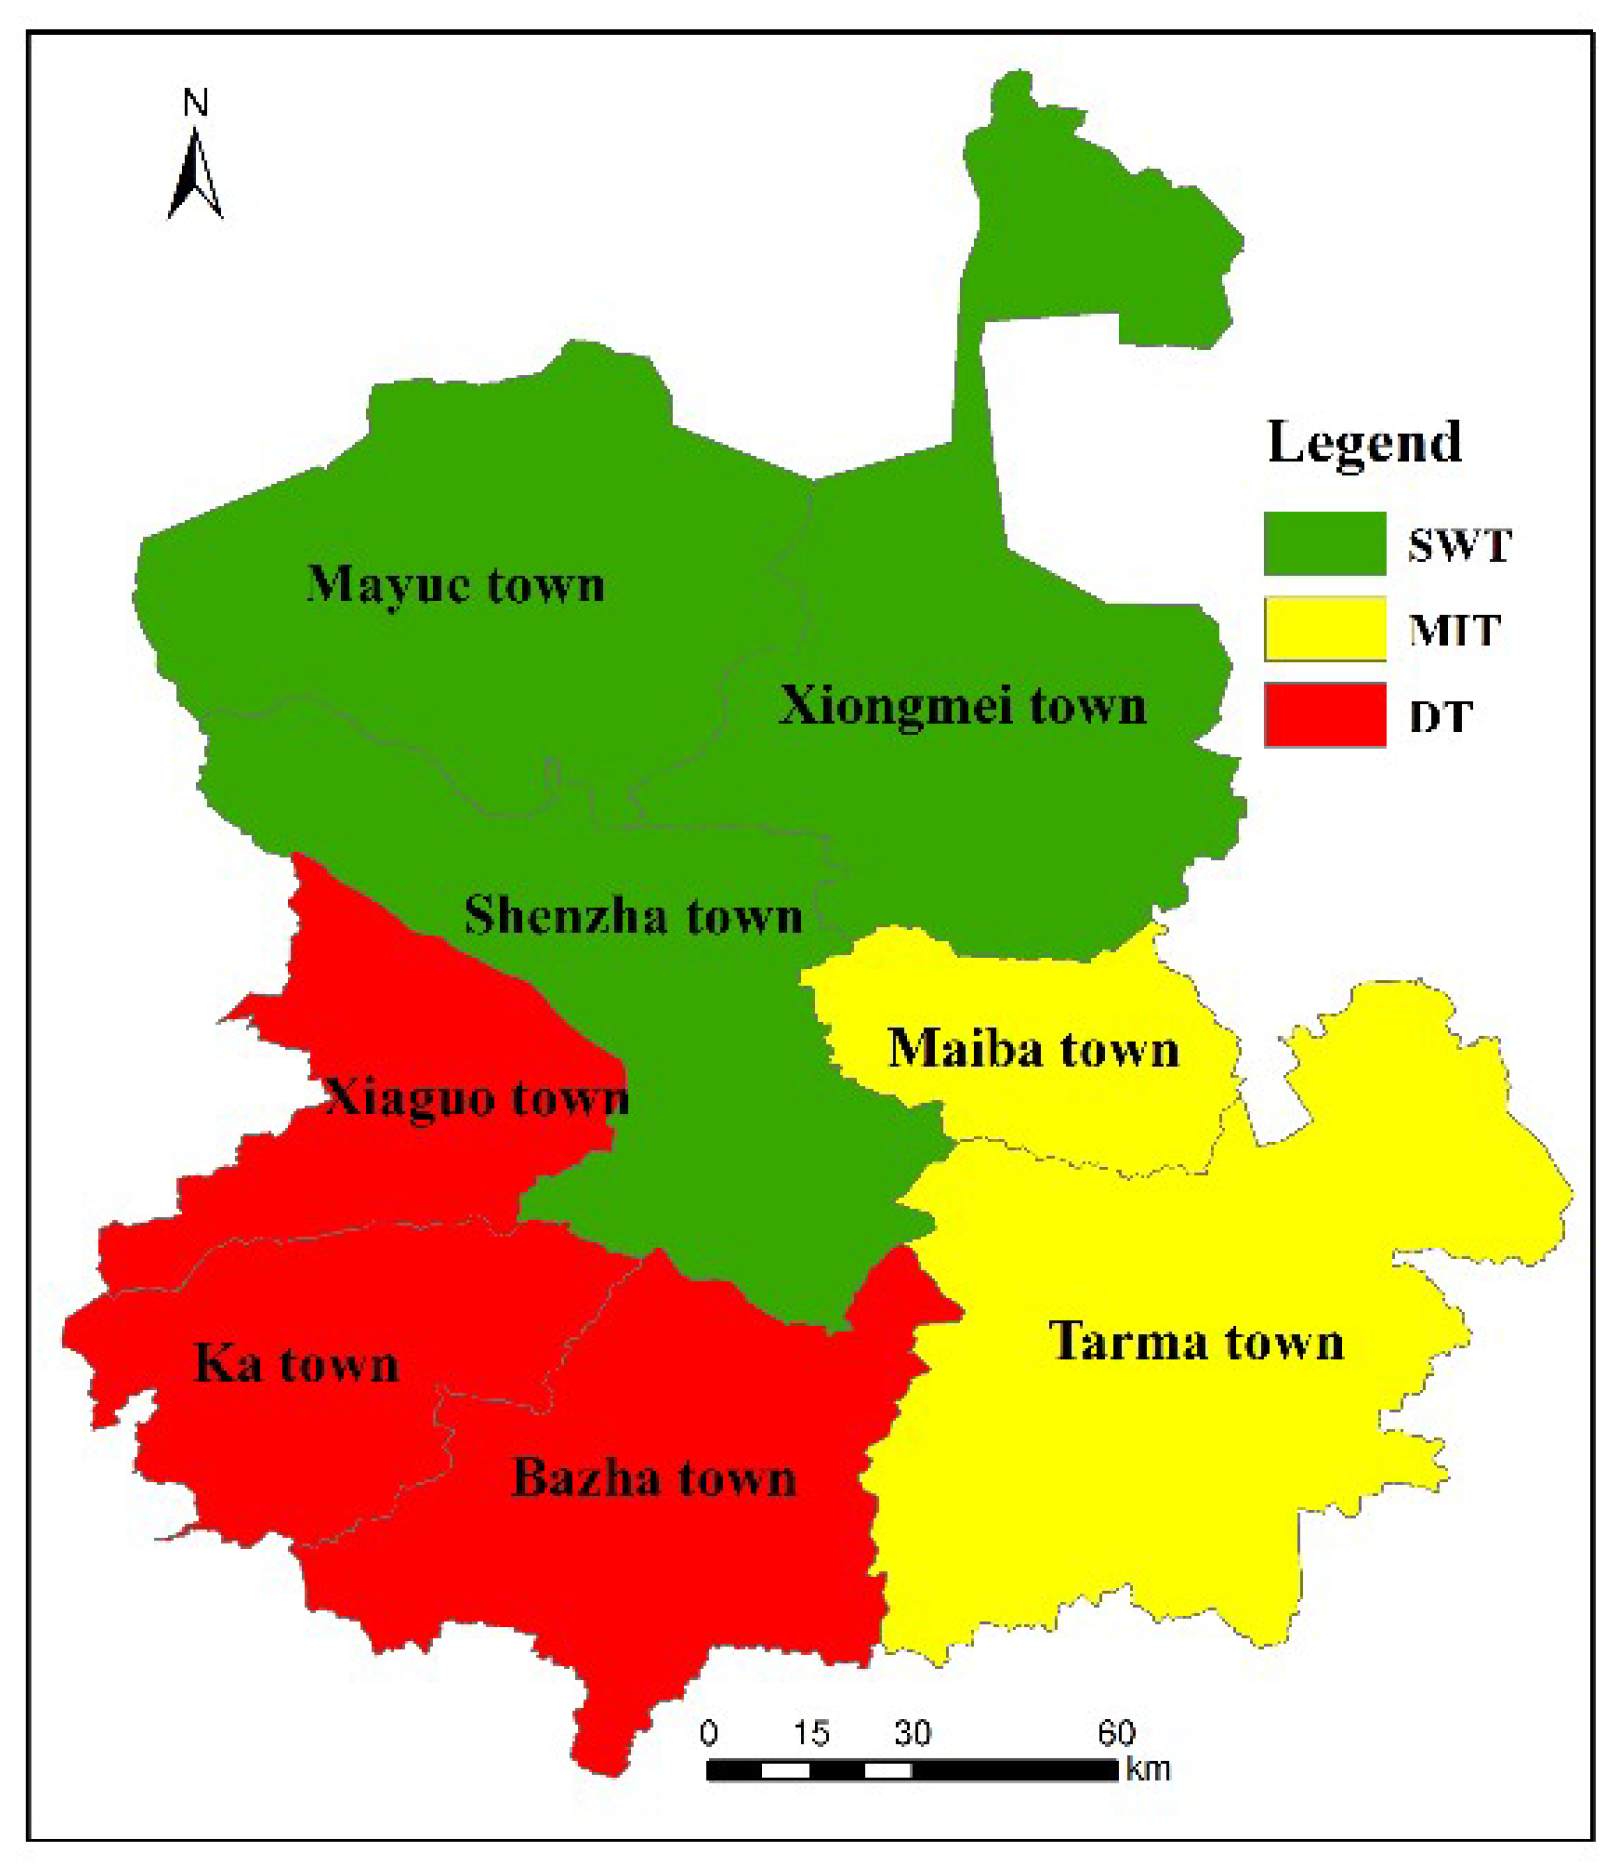
The aim of our analysis is to evaluate the SL in Shenzha under diverse disaster contexts based on the SLF. Our analysis has three main research contents: (1) First, we divide the disaster vulnerability into three contexts, according to the occurrence probability of common disasters in Shenzha. (2) Then we construct a series of sustainable livelihood indices (SLI), which are applied in disaster contexts. (3) The SL and their main components under various vulnerability contexts are compared. Carrying out the SL evaluation of herdsmen communities has a practical significance for reducing vulnerability and avoiding livelihood risks for herdsmen. The rest of the paper is divided into four main sections as follows: Section 2 introduces the methodology used in this paper. Section 3 reports on the main results. Section 4 discusses the main results, as well as some of the limitations of our analysis. The last section finishes by giving the main conclusions of our analysis. Moreover, the policy implications based on the research results are also discussed in the last section.

2. Methodology

2.1. Overview of the Study Area

Shenzha County is located in the south of the Qinghai-Tibet Plateau (Figure 2). It is located at the east longitude 87°33′ and the north latitudes 30°10′~32°10′. The total area of the county is 25,500 square kilometers (about 9,845.6 square miles). The terrain in Shenzha is high in the south and low in the north, with an average elevation of over 4700 m. Shenzha County governs eight towns: Shenzha Town, Xiongmei Town, Mayue Town, Maiba Town, Tarma Town, Xiaguo Town, Ka Town and Bazha Town.
Shenzha County was chosen as the case study because of two considerations: (1) Shenzha County, belonging to the semi-arid type of plateau sub-frigid zone with windy weather, is one of the typical areas with the worst climatic conditions in China. Various vulnerability contexts can be seen in Shenzha County. The annual average temperature is 0.2 °C, the highest temperature is 25.1 °C, the extreme minimum temperature is −30.1 °C and the average annual precipitation is 299 mm. Due to the unstable geological structure, high altitude, high mountainous terrain and steep terrain, Shenzha County faces the risk of various disasters, mainly windstorms, snowstorms and drought. (2) The proportion of herdsmen in Shenzha County accounts for more than 90% of the total population. Frequent disasters have caused great threats to the development of husbandry in Shenzha County [33].

2.2. Analysis Framework

2.2.1. Disaster Contexts in Shenzha

Drought, snowstorms and windstorms have been the main disasters in Shenzha County. Precipitation in Shenzha County is much less than evaporation, thus leading to the frequent occurrence of drought. The drought has led to a decline in grass production and a lack of pasture and water to support the survival of livestock. Moreover, once a snowstorm occurs, the grassland is covered by snow, and a layer of ice shell forms upon the surface. As a result, livestock are unable to eat grass any more. What is worse, the hunger and severe cold cause a large number of livestock to die, greatly affecting the development of animal husbandry. Northern Tibet, where Shenzha County is located, is one of the regions with the largest number of windy days in China. The strong wind erosion and accumulation have caused grassland areas to become wind-eroded and buried. As a result, the sustainable livelihoods (SL) of herdsmen communities have been threated greatly. For instance, the heavy snowstorm that occurred in 1997 has caused great loss to Shenzha County. According to the statistics, there were 16,314 livestock deaths and 13,013 people lacked fuel. Furthermore, 2,435 herdsmen had insufficient grain to survive, 1,953 herdsmen suffered from frostbite, eight people were disabled, 773 people suffered from influenza, 842 people suffered from typhoid fever and 618 people suffered from urticaria (hives) [34].
Considering the complexity (type and frequency) of disaster contexts in Shenzha County, our analysis applied the clustering method, which is the process of partitioning a given set of patterns into disjoint clusters [35]. K-means clustering is one of the most classic algorithms, and a large number of case studies have shown its excellent clustering effect [36]. This algorithm is a partition-based clustering algorithm, with distance as the criterion for the similarity measure between data objects. Given the data set P R m n and the number of clusters K, K-means clustering makes the difference within the class as small as possible, and the difference between classes as large as possible. It can be obtained by the following formula [37]:
min ( E ) = min k = 1 k x Y k ( y k x ) 2
where Y k is the kth group, y k is the centroid in the kth group, and x is a point in the kth group.

2.2.2. Construction of Livelihood Sustainability Index

Critical attributes and variables which are related to SL are necessary to be identified before constructing a livelihood sustainability index (LSI). During the field survey, we found that basic livelihood needs (e.g., clothing, shelter, infrastructure (roads, buses, electricity)) were mostly satisfied, and showed little disparity among the selected towns. Livelihood assets, including human assets, natural assets, physical assets, social assets and financial assets, are the key components according to the British Department for International Development (DFID), and thus were chosen in our analysis. Moreover, livelihood strategy is one of components developed in the DFID. While livelihood diversification has been well-examined to be a sustainable pathway, most researchers have also proven that non-farm income is critical to sustainable livelihood strategies [38,39]. Besides, the frequent occurrence of disasters in Shenzha County has caused great loss of assets. Therefore, disaster management capabilities are critical to rural sustainability and food security in Shenzha County. Disaster management capability is particularly important in our analysis. Our analysis selects storage indicators to ensure the survival of human beings (e.g., food and fuel) and livestock (e.g., forage grass), in case of a disaster. Thus, three pivotal components—livelihood assets, livelihood strategies and disaster management capability—were selected (Table 1). Finally, we obtained key attributes and proxy variables to measure the SL of Shenzha County.

2.2.3. Entropy Method

After choosing the indicators of SL, the entropy method, which is based on Shannon’s Entropy Method, was applied to determine weights for each indicator [40]. The concept of entropy is to measure the relative intensities of contrasting criteria to represent the average intrinsic information for decision-making [41].
Our analysis uses the entropy method to determine weight in order to eliminate subjective factors. In general, the higher the entropy, the more balanced, and the less fluctuation there will be in the system structure. On the contrary, lower levels of entropy mean more unevenness and greater differences in the system structure. The main steps are as follows:
(1) Data standardization: Due to the dimensional difference of each index, the initial data need to be standardized. Adopting the positive index calculation method, the result showed that the bigger the index, the better the system development.
X ij = ( X ij min ( X j ) / ( max ( X j ) min ( X j ) ) .
(2) The value of the ith town and the jth indicator is:
Y ij = X ij / i = 1 m X ij .
(3) The value of the information entropy is:
E j = k i = 1 m ( Y ij ) ( lnY ij ) ,   k = 1 lnm ,   0 e j 1 .
(4) The redundancy value of information entropy is:
d j = 1 e j .
(5) The index value is:
w j = d i / i = 1 n d j .
(6) The score of a single index in the kth group is:
S kj = w j X kj .
The comprehensive sustainable livelihood score in the kth group is:
S k = j n S kj .
Here,   X ij represents the original value of the ith town and the jth indicator. The max ( X j ) and min ( X j ) represent the maximum and minimum values in the jth indicator among all towns. X kj is the standardized indicators in the kth group, and m is the number of towns being assessed, while n is the number of the indicators. Here, m = 8 and n = 16.

2.3. Data Source

The data issue has been the main obstacle, since the dataset in Tibet has been either unavailable or in poor quality. We conducted the investigations on the local area several times, and obtained valuable data from various sources. During data collection, our analysis was supported by the local government, who provided us with a lot of valuable data (e.g., annual reports, statistical yearbooks, atlases, county annals). In addition, we visited local research departments in order to further complete our database. The main data sources are tracked in Table 2.

3. Result

3.1. Disaster Contexts in Shenzha

In terms of snowstorms, Mayue Town and Xiongmei Town had the highest degree of vulnerability, followed by Shenzha Town, Maiba Town and Tarma Town (see Figure 3a). The lowest degree of vulnerability was held by Xiaguo Town, Ka Town and Bazha Town. The degree of snowstorm proneness showed a trend from north to south. Referring to drought, the distribution trend was opposite that of snowstorms (see Figure 3b). Xiaguo Town, Ka Town and Bazha Town had the highest occurrence of drought. The lowest degree of drought was found in Mayue Town and Xiongmei Town, indicating a decreasing trend from south to north. In terms of windstorms, the number of windy days showed a decreasing trend from northwest to southeast (see Figure 3c). Tarma Town had the lowest occurrence of windstorms. In comparison, Xiongmei Town, Mayue Town, Shenzha Town and Xiaguo Town had the highest occurrence rates of windstorms.
With the application of K-means, disaster contexts can be divided into three groups: Snowstorm and windstorm-dominated towns (SWT), mixed towns (MT) and drought-dominated towns (DT) (Figure 4). The results showed that SWT were mainly distributed in the north of Shenzha County, including Shenzha Town, Xiongmei Town and Mayue Town. MT were mainly distributed in the east of Shenzha County, including Maiba Town and Tarma Town. DT were mainly distributed in the west of Shenzha County, including Xiaguo Town, Ka Town and Bazha Town.

3.2. Livelihood Assets

In sum, livelihood assets showed great disparity among the three vulnerability groups (Table 3). Herdsmen in DT and SWT had relatively high values of livelihood assets: 3.5931 and 3.4870, respectively. In comparison, herdsmen in MT had the lowest livelihood assets value (3.622), which was 6.47% lower than those in SWT and DT, respectively.

3.2.1. Human Assets

For the perspective of the overall human assets index, the results showed that there were large disparities among the three groups. In particular, herdsmen in SWT had the highest value, followed by MT and the lowest value in DT. This is related to the household laborers (Table 4). Two variables were selected to represent human assets: The number of laborers and the gender of laborers, which measure the human assets from the perspective of both labor quantity and quality. Households in SWT and DT both presented high numbers of laborers in general, and male laborers in particular, indicating both a high quantity and quality of human assets. In comparison, the values in MT were relatively low, and thus indicating low human assets.

3.2.2. Natural Assets

Looking at natural assets, the results showed that there were minor differences among the three groups. The natural assets of herdsmen in MT were the highest, while those in SWT were the lowest. Two variables were selected to represent natural assets: Grassland area and fenced grassland area, which measure the quantity and quality of grassland. In general, fenced grassland areas are of higher quality than normal grassland, and thus can lead to high livestock productivity. Therefore, although herdsmen in DT had the lowest grassland area (only 1,215 Mu/per capita), the fenced grassland per capita area (306 Mu/per capita) was the highest (Table 4). Even though herdsmen in MT own the lowest area of fenced grassland area, the large area of grassland compensated this factor to some extent. In detail, herdsmen in MT had the highest grassland area (1,549 Mu/per capita) and lowest fenced grassland area (145 Mu/per capita). As a result, herdsmen in DT and MT had high natural assets. In comparison, herdsmen in SWT had neither high grassland area, nor fenced grassland area, thus leading to the lowest value of natural assets.

3.2.3. Physical Assets

Two variables were selected to reflect the physical assets of herdsmen: Livestock assets and equipment assets. In sum, a great disparity in the physical assets was observed. For the overall physical asset index, herdsmen in DT had the highest physical assets, followed herdsmen in SWT and MT, in that order. The general rank sequences were the same for livestock assets and equipment assets. For instance, the indices of livestock and equipment assets of herdsmen in DT were 6.402 and 0.134, respectively, indicating both the highest average livestock assets and equipment assets (Table 4). In contrast, the livestock and equipment assets of herdsmen in MT were 4.363 and 0.099, being 31.85% and 26.12% lower than that values in DT, respectively.

3.2.4. Social Assets

Minor differences were observed for the overall social asset index. The values for SWT, MT and DT were 0.9117, 1.0579 and 1.0273, respectively. Three indicators, including township cadres, health technical persons and veterinarians, were selected. The general rank sequence was not consistent with the three selected variables. Moreover, large disparities were seen in the selected variables among the three groups. In detail, the township cadres per household in the three groups were 0.123, 0.174 and 0.161, respectively, indicating large differences. In comparison, health technical persons per household in the three groups were 0.030, 0.038 and 0.033, indicating minor differences among the three groups.

3.2.5. Financial Assets

Minor disparities were seen concerning financial assets. The scores of financial assets for the three groups were sorted in descending order as: DT > SWT > MT. In general, financial assets are consistent with livelihood strategies. Two variables were selected to represent the financial assets: Primary industrial income and non-primary industrial income. However, great disparities were observed among them. The primary industrial income in the three groups was sorted in descending order as: DT > MT > SWT. In detail, influenced by snowstorms, herdsmen in SWT had the lowest husbandry income of 10,511 yuan (circa 1,520 US Dollars), being 7.4% and 13.4% lower than those in MT and DT. In contrast, the non-primary industrial income in the three groups was sorted in descending order as: SWT > DT > MT. In detail, the herdsmen in SWT had highest non-primary industrial income, 17,110 yuan (circa 2,475 US Dollars). In comparison, the herdsmen in DT had relative high husbandry productivity, leading to the highest primary income and financial assets among the three groups. Meanwhile, the herdsmen in MT had an intermediate income.

3.3. Livelihood Strategies

In the face of different disaster contexts, herdsmen from different towns showed great disparities in the arrangement of livelihood activities (Table 5). In general, the livelihood strategy index was sorted in descending order as: DT > SWT > MT. A high value of the livelihood strategy index indicates flexible livelihood strategies. Herdsmen in DT and SWT had similar values (0.7072 and 0.6938), which were much higher than herdsmen in MT (0.4833). Moreover, the general rank sequence was consistent with the selected two variables, which were the diversification of livelihoods and non-agricultural livelihoods.

3.3.1. Diversification of Livelihoods

The results show that the diversification of livelihoods under various disaster contexts was quite different. Specifically, herdsmen in DT and SWT had the most various livelihoods, with values of 0.3582 and 0.3489, respectively. In comparison, herdsmen in MT had the least diverse livelihoods with the value of 0.244, being 32% lower than that in DT. Herdsmen in DT and SWT had high values because there are opportunities to engage in diverse livelihoods. For instance, about 12% of herdsmen engage in the construction industry, 5% in transportation and 10% in retailing services.

3.3.2. Non-Agricultural Livelihoods

The general rank of non-agricultural livelihoods was consistent with that in the diversification of livelihoods: DT > SWT > MT. The values under the three disaster contexts were 0.349, 0.345 and 0.2393, respectively (Table 6). Similarly, herdsmen in DT and SWT had high values because there was a large proportion (more than 31%) of herdsmen that engaged in non-farm activities, such as construction industry, transportation and retailing services, as described above.

3.4. Disaster Management Capability

Minor disparity was seen in reference to disaster management capability. The disaster management capability in DT was the highest, while that in SWT was the lowest (Table 6). Even though a minor disparity was observed among the three vulnerability groups, a great disparity could be observed when tracking back to the original indices. Two variables were selected to represent the disaster management capability: storage of grain, fuel and forage grass.
Moreover, large disparities were seen in the selected variables among the three groups. The grain storage in the three groups was sorted in descending order as: SWT > MT > DT. The fuel storage in the three groups was sorted in descending order as: MT > DT > SWT. The storage of forage grass in the three groups was sorted in descending order as: DT > MT > SWT. Once disaster occurs, livestock in SWT and MT will be more vulnerable than that in DT. In sum, SWT had quite a high amount of grain storage, MT had quite a high amount of forage grass storage, and DT had a high amount of fuel storage, indicating great disparities in coping with disaster across the vulnerability contexts.

3.5. Livelihood Sustainability Index

A great disparity in LSI was observed among the three vulnerability groups (Table 7). The scores of the LSI for the three groups were sorted in descending order as: DT (5.2) > SWT (5.06) > MT (4.74). In detail, herdsmen in DT had a high LSI because they had high livelihood assets, livelihood strategies and disaster management capability. Herdsmen in MT had a low LSI, due to their low scores in terms of livelihood assets and livelihood strategies.

4. Discussion

The SLF is gaining attention for the purposes of addressing SL in a wide range of development organizations. The DFID framework introduces the main factors that influence livelihoods and relationships among them [8]. This framework contains a wide range of assets, considering not only traditional land resources, but also financial and social resources. Specifically, this framework highlights the importance of vulnerability contexts, and thus provides additional tools to assess impacts of vulnerability. The frequent occurrence of disasters and poverty in Shenzha make herdsmen communities highly susceptible to disaster vulnerability. What is worse, the frequent disasters have led to great loss to the production of agriculture and animal husbandry there. This is consistent with previous studies in which natural disasters have been established to have a great impact on the livelihoods of farmers and herdsmen [46,47,48,49].
From the perspective of the SLI constructed in our analysis, the results showed that (1) great disparity in the LSI can be observed among the three disaster groups. The scores of LSI for three groups were sorted in descending order as: DT > SWT > MT. In sum, herdsmen in DT and SWT had high LSI scores. Herdsmen have different livelihood assets under various disaster vulnerability contexts and thus have their own methods of collocation. (2) In detail, herdsmen in DT had a high LSI because they had high scores in terms of livelihood assets, livelihood strategies and disaster management capability. (3) Herdsmen in SWT had high scores in terms of livelihood assets, particularly human and financial assets, and livelihood strategies. However, herdsmen in SWT had low natural assets and social assets, and are thus forced to pursue other livelihood strategies. As a result, diversified livelihood strategies and high non-agricultural employment were observed. The diverse non-agricultural activities have not only increased the financial assets, but they have also promoted the SL of herdsmen in SWT. This is consistent with the findings of a previous study indicating that livelihood assets are complementary to obtaining SL [50].
(4) In comparison, herdsmen in MT had neither livelihood assets nor strategies, which restricted the SL of herdsmen there. In particular, herdsmen in MT had low physical assets and financial assets. It is difficult for herdsmen to use their existing livelihood assets to develop their livelihood strategies, which makes it difficult to enhance the SL of herdsmen. This elucidates some clues of the relationship between livelihood assets and strategies, even though this was not one of the aims of our paper. That is to say, under vulnerability contexts, livelihood strategies adopted by herdsmen depend on the status of the livelihood assets they own [51,52]. Herdsmen own one asset on the premise of acquiring another asset. In particular, human, financial and natural assets have significant positive impacts on farmers’ livelihood strategies [39]. A diverse portfolio of livelihood activities is one of the key objectives of SL [53].
Complex disaster contexts in Tibet have been observed to cause great loss to SL [49]. The vulnerability of SL to disaster has been well-examined in previous studies, and great loss has been seen while coping with disasters [49,54]. Once disaster occurs, relief supplies from surrounding regions of the disaster area are costly. Adequate storage supplies for both human and livelihood are necessary conditions for a region to achieve SL. Moreover, the occurrence of disaster has a deep impact upon herdsmen and livestock. Thus, it is necessary to improve disaster management capabilities and increase storage supplies for the survival of humans and livestock in SWT. This is consistent with previous studies that demonstrate adaptions can improve livelihoods, and enhance the coping mechanisms of resilience from climatic shocks [20,55]. Failure of autonomous adaptation causes large economic consequences [56]. Placing the disaster management capability under analysis can help to further the understanding of SL.

5. Conclusions

The vulnerability contexts in Shenzha, Tibet are quite complex. Frequent climate disasters have greatly restricted normal productivity and influenced the SL of herdsmen. The vulnerability contexts of Shenzha are highlighted in our analysis. The LSI in our analysis was constructed based on livelihood assets and strategies, as well as disaster management capability, and the evaluation results reflect the practical conditions of the study area. According to the frequency of natural disasters, the towns in Shenzha were divided into three groups: SWT, MT and DT.
Moreover, our analysis provides guidance on how SL can be achieved in practice. It is noteworthy that diverse vulnerability contexts have various foundations of resource development, thus leading to disparity in the livelihoods of herdsmen. Based on the different disaster vulnerability contexts, strategies for improving SL should be considered differently. Furthermore, the third pole national park group is being constructed in Tibet, with the aim of achieving environment protection and sustainable development [57]. Therefore, by reducing dependence on grassland, the diverse strategies for herdsmen can not only led to an increase in the income of herdsmen, but also alleviate the vulnerability contexts. Moreover, with the construction of this national park, the development of tourism can promote diversified employment of herdsmen and contribute to SL, as has been well-confirmed in previous studies [58,59]. Therefore, this paper explored policy implications for the improvement of pre-disaster defense capability, disaster emergency relief and the reconstruction of post-disaster livelihood. In general, further strategies for dealing with SL should be employed for different types of disaster contexts. (1) For herdsmen in SWT, disaster management capability must be improved. Moreover, herdsmen in SWT have relevant non-agricultural experience, and thus could serve as employees for the national park. (2) Herdsmen in DT, who have been observed to own great natural assets, prefer to engage in husbandry activities. Therefore, in order to diversify their livelihood strategies, these herdsmen should be trained in non-agricultural skills. (3) For herdsmen in MT, active financial support should be adopted. Farmers with more financial assets tend to engage in diverse livelihood strategies and obtain more income.
Our analysis makes two contributions to the literature. The first is to remind researchers to take various vulnerability contexts into account when evaluating SL in disaster-prone areas. Little attention has been paid to the differentiation of SL caused by various vulnerability contexts. In this regard, our analysis offers empirical evidence for differentiating disasters, as they can result in various livelihood assets and strategies. The second contribution of our analysis is to present an LSI. The LSI raised in our analysis permits practical applications in other vulnerability cases. In sum, our analysis is of great significance, as it sheds new light on the comprehensive understanding of vulnerability contexts and disaster management capability. Moreover, it is noteworthy that SL encompasses the economic, social, and environmental aspects, which are also key hurdles to achieve the SDGs [60,61]. Among these, environmental systems are difficult to be separated, as they are usually interlinked [62]. In the context of the SDGs and climate changes, future studies on environmental components’ effect on SL should be further explored.

Reference

Author Contributions

All authors contributed to this work. Conceptualization, methodology, software, validation, formal analysis, investigation, resources, data curation, Y.Z.; Writing—original draft preparation, Y.Z., L.Z. and B.L.; Writing—review and editing, Y.Z., L.Z. and J.F.; Visualization, Y.Z., L.Z.; Supervision, J.F.; Project administration, J.F.; Funding acquisition, J.F.

Funding

This research was funded by the National Natural Science Foundation of China (41630644). And the APC was funded by the National Natural Science Foundation of China (41630644).

Acknowledgments

This work was supported by the National Natural Science Foundation of China.

Conflicts of Interest

The authors declare no conflict of interest.

References

  1. Adger, W.N.; Huq, S.; Brown, K.; Conway, D.; Hulme, M. Adaptation to climate change in the developing world. Prog. Dev. Stud. 2003, 3, 179–195. [Google Scholar] [CrossRef] [Green Version]
  2. Smit, B.; Wandel, J. Adaptation, adaptive capacity and vulnerability. Glob. Environ. Change 2006, 16, 282–292. [Google Scholar] [CrossRef]
  3. Hahn, M.B.; Riederer, A.M.; Foster, S.O. The Livelihood Vulnerability Index: A pragmatic approach to assessing risks from climate variability and change—A case study in Mozambique. Glob. Environ. Change 2009, 19, 74–88. [Google Scholar] [CrossRef]
  4. Chambers, R.; Conway, G. Sustainable Rural Livelihoods: Practical Concepts for the 21st Century; Institute of Development Studies (UK): Brighton, UK, 1992. [Google Scholar]
  5. Serrat, O. The sustainable livelihoods approach. In Knowledge Solutions; Serrat, O., Ed.; Springer: Berlin, Germany, 2017; pp. 21–26. [Google Scholar]
  6. Editorial. Tracking progress on the SDGs. Nat. Sustain. 2018, 1, 377. [Google Scholar] [CrossRef]
  7. Wu, L. The international progress of sustainable development research: A comparison of vulnerability analysis and the sustainable livelihoods approach. Prog. in Geo. 2003, 22, 11–21. [Google Scholar]
  8. DFID. Sustainable Livelihoods Guidance Sheets, Department for International Development; DFID: London, UK, 1999; p. 445.
  9. Scoones, I. Livelihoods perspectives and rural development. J. Peasant Stud. 2009, 36, 171–196. [Google Scholar] [CrossRef] [Green Version]
  10. Udmale, P.D.; Ichikawa, Y.; Manandhar, S.; Ishidaira, H.; Kiem, A.S.; Ning, S.; Panda, S.N. How did the 2012 drought affect rural livelihoods in vulnerable areas? Empirical evidence from India. Int. J. Disaster Risk Reduct. 2015, 13, 454–469. [Google Scholar] [CrossRef] [Green Version]
  11. Zhao, X. Sustainable livelihoods research from the perspective of geography: The present status, questions and priority areas. Geogr. Res. 2017, 36, 1859–1872. [Google Scholar]
  12. Wang, C.; Zhang, Y.; Yang, Y.; Yang, Q.; Kush, J.; Xu, Y.; Xu, L. Assessment of sustainable livelihoods of different farmers in hilly red soil erosion areas of southern China. Ecol. Indic. 2016, 64, 123–131. [Google Scholar] [CrossRef]
  13. Liu, Y.; Huang, C.; Wang, Q.; Luan, J.; Ding, M. Assessment of Sustainable Livelihood and Geographic Detection of Settlement Sites in Ethnically Contiguous Poverty-Stricken Areas in the Aba Prefecture, China. ISPRS Int. J. Geo-Inf. 2018, 7, 18. [Google Scholar] [CrossRef]
  14. Shah, K.U.; Dulal, H.B.; Johnson, C.; Baptiste, A. Understanding livelihood vulnerability to climate change: Applying the livelihood vulnerability index in Trinidad and Tobago. Geoforum 2013, 47, 125–137. [Google Scholar] [CrossRef]
  15. Ma, J.; Jie, Z.; Li, L.; Zeng, Z.; Sun, J.; Zhou, Q.; Zhang, Y. Study on Livelihood Assets-Based Spatial Differentiation of the Income of Natural Tourism Communities. Sustainability 2018, 10, 353. [Google Scholar] [CrossRef]
  16. Zhao, X.; Guo, F.; Zhang, L.; Li, W. The livelihood sustainability evaluation of the Gannan plateau. J. Northwest Norm. Univ. 2014, 50, 104–109. [Google Scholar]
  17. Younus, M.A.F.; Harvey, N. Community-based flood vulnerability and adaptation assessment: A case study from Bangladesh. J. Environ. Assess. Policy Manag. 2013, 15, 1350010. [Google Scholar] [CrossRef]
  18. Kelly, P.M.; Adger, W.N. Theory and practice in assessing vulnerability to climate change andFacilitating adaptation. Clim. Change 2000, 47, 325–352. [Google Scholar] [CrossRef]
  19. Adger, W.N. Vulnerability. Glob. Environ. Change 2006, 16, 268–281. [Google Scholar] [CrossRef]
  20. Younus, M.A.F.; Kabir, M.A. Climate change vulnerability assessment and adaptation of bangladesh: Mechanisms, Notions and Solutions. Sustainability 2018, 10, 4286. [Google Scholar] [CrossRef]
  21. Harvey, C.A.; Rakotobe, Z.L.; Rao, N.S.; Dave, R.; Razafimahatratra, H.; Rabarijohn, R.H.; Rajaofara, H.; Mackinnon, J.L. Extreme vulnerability of smallholder farmers to agricultural risks and climate change in Madagascar. Philos. Trans. R. Soc. B Biol. Sci. 2014, 369, 20130089. [Google Scholar] [CrossRef]
  22. Nelson, V. Gender, Generations, Social Protection & Climate Change: A Thematic Review; Overseas Development Institute: London, UK, 2011. [Google Scholar]
  23. Ren, Z.; Ge, Y.; Wang, J.; Mao, J.; Zhang, Q. Understanding the inconsistent relationships between socioeconomic factors and poverty incidence across contiguous poverty-stricken regions in China: Multilevel modelling. Spat. Stat. 2017, 21, 406–420. [Google Scholar] [CrossRef]
  24. Yearbook, T.S. Tibet Statistical Yearbook-2016; Tibet Autonomous Bureau of Statistics and Tibet General Team of Investigation under the NBS: Tibet, China, 2016. [Google Scholar]
  25. Ye, D. Some characteristics of the summer circulation over the Qinghai-Xizang (Tibet) Plateau and its neighborhood. Bull. Am. Meteorol. Soc. 1981, 62, 14–19. [Google Scholar] [CrossRef]
  26. Cui, X.; Graf, H.-F. Recent land cover changes on the Tibetan Plateau: A review. Clim. Change 2009, 94, 47–61. [Google Scholar] [CrossRef]
  27. Yan, J.; Wu, Y.; Zhang, Y. Adaptation strategies to pasture degradation: Gap between government and local nomads in the eastern Tibetan Plateau. J. Geogr. Sci. 2011, 21, 1112–1122. [Google Scholar] [CrossRef]
  28. Cao, J.; Yeh, E.T.; Holden, N.M.; Yang, Y.; Du, G. The effects of enclosures and land-use contracts on rangeland degradation on the Qinghai–Tibetan plateau. J. Arid Environ. 2013, 97, 3–8. [Google Scholar] [CrossRef]
  29. Foggin, J.M. Biodiversity Protection and the Search for Sustainability in Tibetan Plateau Grasslands (Qinghai, China); Arizona State University Tempe: Phoenix, AZ, USA, 2000. [Google Scholar]
  30. Gao, M.; Qiu, J. Characteristics and distribution law of major natural disasters in Tibetan plateau. J. Arid Land Resour. Environ. 2011, 25, 101–106. [Google Scholar]
  31. Wang, W.; Liang, T.; Huang, X.; Feng, Q.; Xie, H.; Liu, X.; Chen, M.; Wang, X. Early warning of snow-caused disasters in pastoral areas on the Tibetan Plateau. Nat. Hazards Earth Syst. Sci. 2013, 13, 1411–1425. [Google Scholar] [CrossRef]
  32. IPCC. Climate Change 2007: Impacts, Adaptation and Vulnerability. In Contribution of Working Group II to the Fourth Assessment Report of the Intergovernmental Panel on Climate Change; Parry, M., Canziani, O., Palutikof, J., Linden, P.v.d., Hanson, C., Eds.; Cambridge University Press: Cambridge, UK, 2007; p. 976. [Google Scholar]
  33. Liu, X.; Ma, Y. Climatic Regionalization of Animal Husbandry of Naqu Region; China Meteorological Press: Beijing, China, 2003. (In Chinese) [Google Scholar] [Green Version]
  34. Committee at the Local Government Chronicle. County Annals of Shenzha County; China Tibetology Publishing House: Lhasa, China, 2012. [Google Scholar]
  35. Rokach, L.; Maimon, O. Clustering methods. In Data Mining and Knowledge Discovery Handbook; Springer: Berlin, Germany, 2005; pp. 321–352. [Google Scholar]
  36. Tzortzis, G.F.; Likas, A.C. The global kernel k-means algorithm for clustering in feature space. IEEE Trans. Neural. Netw. 2009, 20, 1181–1194. [Google Scholar] [CrossRef] [PubMed]
  37. Yang, Z.; Hua, X.; Ye, Y.; Shao, Y. Spatial Combination of Finance and Center Level Identify Based on K-means Clustering: A Case Study of the Changjiang River Delta. Sci. Geogr. Sin. 2015, 35, 144–150. [Google Scholar]
  38. Zhang, L.; Zhang, Y.; Yan, J.; Wu, Y. Livelihood diversification and cropland use pattern in agro-pastoral mountainous region of eastern Tibetan Plateau. J. Geogr. Sci. 2008, 18, 499–509. [Google Scholar] [CrossRef]
  39. Fang, Y.-p.; Fan, J.; Shen, M.-y.; Song, M.-q. Sensitivity of livelihood strategy to livelihood capital in mountain areas: Empirical analysis based on different settlements in the upper reaches of the Minjiang River, China. Ecol. Indic. 2014, 38, 225–235. [Google Scholar] [CrossRef]
  40. Weaver, W.; Shannon, C.E. The Mathematical Theory of Communication; University of Illinois Press: Champaign, IL, USA, 1949; pp. 379–423. [Google Scholar]
  41. Zeleny, M. Multiple Criteria Decision Making Kyoto 1975; Springer: Berlin, Germany, 1976; p. 212. [Google Scholar]
  42. National Bureau of Statistics of the People’s Republic of China. China County Statistical Yearbook; National Bureau of Statistics of the People’s Republic of China: Beijing, China, 2017.
  43. Committee at the Local Government Chronicle. Shenzha County Yearbook; Zhongzhou Ancient Books Publishing House: Zhengzhou, China, 2017. [Google Scholar]
  44. Bureau of Surveying and Mapping of Tibet Autonomous Region. Tibet Autonomous Region Atlas; Shenzhen Yachang Colour Printing Co., Ltd.: Shenzhen, China, 2012. [Google Scholar]
  45. Zhang, Y.; Li, B.; Zheng, D. Qinghai-Tibet Plateau Scope and Boundary Geographic Information System Data. June, 2014 ed.; Global Change Research Data Publishing & Repository: Washington, DC, USA, 2014. [Google Scholar]
  46. Iwasaki, S. Linking disaster management to livelihood security against tropical cyclones: A case study on Odisha state in India. Int. J. Disaster Risk Reduct. 2016, 19, 57–63. [Google Scholar] [CrossRef]
  47. Khayyati, M.; Aazami, M. Drought impact assessment on rural livelihood systems in Iran. Ecol. Indic. 2016, 69, 850–858. [Google Scholar] [CrossRef]
  48. Oniki, S.; Dagys, K. Recovery from a winter disaster in Töv Province of Mongolia. J. Arid Environ. 2017, 139, 49–57. [Google Scholar] [CrossRef]
  49. Qiu, X.; Yang, X.; Fang, Y.; Yun, X.; Zhu, F. Impacts of snow disaster on rural livelihoods in southern Tibet-Qinghai Plateau. Int. J. Disaster Risk Reduct. 2018, 31, 143–152. [Google Scholar] [CrossRef]
  50. Anderson, B. Converting Asset Holdings into Livelihood: An Empirical Study on the Role of Household Agency in South Africa. World Dev. 2012, 40, 1394–1406. [Google Scholar] [CrossRef]
  51. Bebbington, A. Capitals and capabilities: A framework for analyzing peasant viability, rural livelihoods and poverty. World Dev. 1999, 27, 2021–2044. [Google Scholar] [CrossRef]
  52. Koczberski, G.; Curry, G.N. Making a living: Land pressures and changing livelihood strategies among oil palm settlers in Papua New Guinea. Agric. Syst. 2005, 85, 324–339. [Google Scholar] [CrossRef] [Green Version]
  53. Ellis, F. Household strategies and rural livelihood diversification. J. Dev. Stud. 1998, 35, 1–38. [Google Scholar] [CrossRef]
  54. Sanderson, D. Cities, disasters and livelihoods. Risk Manag. 2000, 2, 49–58. [Google Scholar] [CrossRef]
  55. Adger, W.N.; Hughes, T.P.; Folke, C.; Carpenter, S.R.; Rockstrom, J. Social-ecological resilience to coastal disasters. Science 2005, 309, 1036–1039. [Google Scholar] [CrossRef] [PubMed]
  56. Younus, M.A.F.; Harvey, N. Economic consequences of failed autonomous adaptation to extreme floods: A case study from Bangladesh. Local Econ. 2014, 29, 22–37. [Google Scholar] [CrossRef]
  57. Fan, J.; Zhong, L.; Li, J.; Chen, T.; Huang, B.; Yu, H.; Chen, D.; Wang, Y.; Guo, R. Third Pole National Park Group Construction is Scientific Choice for Implementing Strategy of Major Function Zoning and Green Development in Tibet, China. Bull. Chin. Acad. Sci. 2017, 32, 932–944. [Google Scholar]
  58. Hiwasaki, L. Toward sustainable management of national parks in Japan: Securing local community and stakeholder participation. Environ. Manag. 2005, 35, 753–764. [Google Scholar] [CrossRef] [PubMed]
  59. Adiyia, B.; Vanneste, D.; Rompaey, A.V. The poverty alleviation potential of tourism employment as an off-farm activity on the local livelihoods surrounding Kibale National Park, western Uganda. Tour. Hosp. Res. 2016, 17, 34–51. [Google Scholar] [CrossRef]
  60. Lusseau, D.; Mancini, F. Income-based variation in Sustainable Development Goal interaction networks. Nat. Sustain. 2019, 1, 242–247. [Google Scholar] [CrossRef]
  61. Kurian, M.; Scott, C.; Reddy, V.R.; Alabaster, G.; Nardocci, A.C.; Portney, K.; Boer, R.; Hannibal, B. One Swallow Does Not Make a Summer: Siloes, Trade-Offs and Synergies in the Water-Energy-Food Nexus. Front. Environ. Sci. 2019, 7, 32. [Google Scholar] [CrossRef]
  62. Avellan, T.; Roidt, M.; Emmer, A.; von Koerber, J.; Schneider, P.; Raber, W. Making the water–soil–waste nexus work: Framing the boundaries of resource flows. Sustainability 2017, 9, 1881. [Google Scholar] [CrossRef]
Figure 1. The sustainable livelihoods framework of the United Kingdom’s Department for International Development (DFID).
Sustainability 11 02874 g001
Figure 2. Location of Shenzha County.
Sustainability 11 02874 g002
Figure 3. Vulnerability contexts in Shenzha County.
Sustainability 11 02874 g003aSustainability 11 02874 g003b
Figure 4. Vulnerability contexts in towns.
Sustainability 11 02874 g004
Table 1. Sustainable livelihoods (SL) framework-based indicators for assessing the livelihood sustainability index (LSI).
Major ComponentsSub-ComponentsProxy Indicators and WeightsDescriptions
Livelihood assets (E1)Human assets (0.1294)Number of laborers (0.0651)Able-bodied = 1, semi-able-bodied workers = 0.5
Gender of laborers (0.0643)Male laborer = 0.59, Female laborer = 0.41
Natural assets (0.1224)Grassland (0.0606)Grassland area (Mu/per capita)
Fenced grassland (0.0618)Fenced grassland (Mu/per capita)
Physical assets (0.1213)Livestock assets per capita (0.0586)1 cow = 0.85, 1 horse = 0.05, 1 sheep = 0.1
Equipment assets per capita (0.0627)1 truck = 1, 1 car = 0.8, 1 tractor = 0.8, 1 motorcycle = 0.8
Social assets (0.1998)Township cadres (0.0726)Township cadres per household
Health technical persons (0.0647)Health technical persons per household
Veterinarian (0.0625)Veterinarians per household
Financial assets (0.1232)Primary industrial income per capita (0.0575)
Non-primary industrial income per capita (0.0657)
Livelihood strategies (E2)Diversification of livelihoods (0.0634)Number of livelihood activities (0.0634)
Non-agricultural livelihoods (0.0622)Ratio of non-agricultural employment (0.0622)
Disaster management capability (E3)Human survival storage (0.1213)Grain per capita (0.0589)
Fuel per capita (0.0623)
Livestock survival storage (0.0623)Forage grass per sheep (0.0571)Forage ratio conversion: 1 cow = 5 sheep, 1 horse = 6 sheep, 1 goat = 0.8 sheep
Note: The unit of land area in China is the Mu; 1 Mu = 0.1647 acres (where one acre = 4,840 square yards = 0.404686 hectares = 4,046.86 square meters).
Table 2. Data sources of main indicators in Shenzha County.
IndicatorsData Sources
Number of laborers Annual Production Report of Farming and Animal Husbandry in Shenzha, Xiongmei, Mayue, Maiba, Tarma, Xiaguo, Ka and Bazha Towns.
Gender of laborers
Area of grassland
Area of fenced grassland
Livestock assets per capita
Equipment assets per capita
Township cadres
Health technical persons
Veterinarians
Primary industrial income per capita
Non-primary industrial income per capita
Number of livelihood activities
Ratio of non-agricultural employment
Grain per capita
Fuel per capita
Forage grass per sheep
PopulationChina County Statistical Yearbook 2017 [42].
Income per capitaShenzha County Yearbook 2017 [43].
Nation/province/countyNational Catalogue Service For Geographic Information (www.webmap.cn).
Township boundariesTibet Autonomous Region Atlas 2012 [44].
Disaster dataRegionalization of Animal Husbandry of Naqu Region [33].
Qinghai-Tibet Plateau boundariesGlobal Change Research Data Publishing & Repository [45].
Digital Elevation Model (DEM)Geospatial Data Cloud site, Computer Network Information Center, Chinese Academy of Sciences (The data set is provided by Geospatial Data Cloud site, Computer Network Information Center, Chinese Academy of Sciences. (http://www.gscloud.cn).
Table 3. Results of livelihood assets in vulnerability groups and original indicators.
GroupHuman AssetsNatural AssetsPhysical AssetsSocial AssetsFinancial AssetsLivelihood Assets
Snowstorm and windstorm-dominated towns (SWT)0.7956 0.5842 0.5620 0.9117 0.6335 3.4870
Mixed towns (MT)0.5886 0.6236 0.5137 1.0579 0.5769 3.3607
Drought-dominated towns (DT)0.5575 0.6277 0.7434 1.0273 0.6373 3.5931
Table 4. Description of indicators of livelihood assets for different vulnerability groups in Shenzha County, China.
GroupLaborersGender of LaborersGrasslandFenced GrasslandLivestockEquipmentTownship CadresHealth Technical Persons VeterinariansPrimary Industrial Income Non-Primary Industrial Income
SWT2.292 1.271 1312203 4.904 0.105 0.1230.0300.039 10,51117,110
MT2.114 1.152 1549145 4.363 0.099 0.1740.038 0.035 11,352 15,499
DT2.093 1.131 1215306 6.402 0.134 0.161 0.033 0.038 12,139 15,566
Table 5. Livelihood strategies for different vulnerability groups in Shenzha County, China.
GroupDiversification of LivelihoodsNon-Agricultural LivelihoodsLivelihood Strategy Index
SWT0.3489 0.3450 0.6938
MT0.2440 0.2393 0.4833
DT0.3582 0.3490 0.7072
Table 6. Disaster management capability and original indicators.
GroupIndexGrain Per CapitaFuel Per Capita Forage Grass Per Sheep
SWT0.8832 242.544 117.206 2.292
MT0.8956 170.382 122.585 3.429
DT0.8960 177.634 117.512 16.245
Table 7. Values of the livelihood sustainability index in Shenzha County.
GroupLivelihood AssetsLivelihood StrategiesDisaster Management CapabilityLivelihood Sustainability Index
SWT3.4870 0.6938 0.8832 5.0641
MT3.3607 0.4833 0.8956 4.7396
DT3.5931 0.7072 0.8960 5.1964

