Article

Effects of Artificial Light Treatments on Growth, Mineral Composition, Physiology, and Pigment Concentration in Dieffenbachia maculata “Compacta” Plants

by
Pedro García-Caparrós
1,†,
Eva María Almansa
1,†,
Rosa María Chica
2,† and
María Teresa Lao
1,*,†
1
Agronomy Department of Superior School Engineering, University of Almeria, CIAIMBITAL, Agrifood Campus of International Excellence ceiA3. Ctra. Sacramento s/n, La Cañada de San Urbano, 04120 Almería, Spain
2
Engineering Department of Superior School Engineering, University of Almería, CIAIMBITAL, Agrifood Campus of International Excellence ceiA3, Ctra. Sacramento s/n, La Cañada de San Urbano, 04120 Almería, Spain
*
Author to whom correspondence should be addressed.
The authors contributed equally to this work.
Sustainability 2019, 11(10), 2867; https://doi.org/10.3390/su11102867
Submission received: 30 March 2019 / Revised: 13 May 2019 / Accepted: 14 May 2019 / Published: 20 May 2019
(This article belongs to the Special Issue Lighting at the Frontiers of Sustainable Development)

Abstract

:
Specific wavebands may allow precise control of plant growth. However, light sources must be carefully evaluated before the large-scale use of supplemental light sources can be implemented. Dieffenbachia maculata “Compacta” plants were grown for 8 weeks in pots in a growth chamber under tightly controlled temperature and humidity in order to assess the effects of supplemental light. Three treatments were applied: (i) using 18-W fluorescent bulbs (T1), (ii) using the same bulbs with supplemental light emitting diodes (LEDs) (Pure Blue and Pure Red Mix-Light-Emitting Diodes (BR-LEDs)) (T2), and (iii) using high-efficiency TL5 fluorescents (T3). Plant biomass, mineral composition, and physiological and photosynthetic parameters were assessed under each light treatment. Total plant dry weight was highest in plants grown under treatments T1 and T3. Other differences were observed between different light treatments, including variation in biomass partitioning as well as N and K concentrations in roots, stems, and leaves. Further, proline and indole 3-acetic acid (IAA) levels were higher in plants grown under the T1 treatment, whereas total soluble sugars and starch were higher in plants grown under treatment T3. Plants grown under treatment T1 had the lowest chlorophyll concentrations. No differences were observed in organ water content and P concentration. T2 was not the best treatment, as expected. The model proposed a linear regression between integrated use of spectral energy (IUSE) and total dry weight (TDW), which showed a good relationship with an R2 value of 0.83. Therefore, we recommend this methodology to discern the effects of the different spectral qualities on plant biomass.

1. Introduction

Foliage plant production represents an important agricultural industry worldwide with a net wholesale value of €50 billion [1,2]. The most-used lamps for greenhouse plant production are metal halide, high-pressure sodium, fluorescent lamps, and incandescent lamps [3]. Currently, in a highly demanding market, growers are using light emitting diodes (LEDs) since they can produce more saleable plants with the desired characteristics, and LEDs may also optimize the spectra for each crop and stage of development [4,5]. The main advantages of LEDs in commercial plant production are the following: spectral specificity, relative energy efficiency, and longer lifetimes than the current industry standard lamps (e.g., fluorescent and high-pressure sodium ones) [6,7].
Light parameters such as spectral specificity and quantity strongly influence plant development and physiology through photosynthesis and photomorphogenetic photoreceptors [8]. Wavelengths in red (R) and blue (B) regions are more effective in the photosynthetic process than wavelengths in other regions [9]. Blue light plays a role in many physiological plant processes such as photomorphogenesis, phototropism, stomatal opening, and photosynthesis [10]. Red light is involved in stem elongation, root-to-shoot ratio, chlorophyll content, and photosynthetic apparatus development [11].
We investigated the responses of Dieffenbachia maculata “Compacta” grown under different light treatments. D. maculata, or “dumb cane”, is an ornamental perennial monocot plant native to the tropical Americas, belonging to the family Araceae. It is prized for its attractive variegated foliage, tolerance to interior environments, and ease of production [12]. There is little information on the effects of light conditions on the growth of this species, with one of the few studies being an experiment conducted by Heo et al. [13] concerning the effect of supplementary LED lighting on the biomass and physiological parameters in Dieffenbachia amoena. Therefore, in this trial, a pot experiment with D. maculata plants was carried out in order to determine the effects of different light treatments on growth, nutritional, physiological, and photosynthetic parameters and to establish a methodology to evaluate the effect of photosynthetically active radiation (PAR) emitted by lamps on biomass.

2. Materials and Methods

2.1. Plant Material and Experimental Conditions

One hundred rooted cuttings (plants) of D. maculata “Compacta” were acquired from a commercial nursery with an initial total dry weight (TDW) of 3.40 ± 0.20 g. Each plant was transplanted into 1.5-L plastic containers filled with Sphagnum peat-moss. During the trial (8 weeks), the pots were organized for the research in a growth chamber where they were randomly assigned to each light treatment. The growth chamber was set at a constant (day/night) temperature of 25 ± 2 °C, and a relative humidity of 55% ± 3% to minimize any potentially confounding effect of a diurnal difference in temperature or relative humidity on extension growth.

2.2. Experimental Design and Treatments

Fluorescent lamps have traditionally been used in indoor garden designs due to their low power consumption and acceptable light conditions for the human eye. Nevertheless, the implementation of new lighting technologies (LEDs) may allow for an improvement in the spectral light available in indoor gardens. The experiment was made up of three light treatments: treatment T1 (fluorescent TLD 18 W), treatment T2 (fluorescent TLD 18 W + Pure Blue and Pure Red Mix-Light-Emitting Diodes (BR-LEDs), and treatment T3 (high-efficiency fluorescent TL5 35 W). The first treatment used 4 light Philips TCS097 luminaires × 2 lamps (Philips Lighting Spain, Madrid, Spain) with a total power of 144 W. The second treatment used 3 light Philips TCS097 luminaires × 2 lamps (Philips Lighting Spain, Madrid) + BR-LEDs RGB (4 lines ALUM 40 x 25 LED SMD RGB x 9 W with console DN-RGB FIBER LIGHT, Modular Signs, Murcia, Spain) with the same power as T1. The third treatment used 2 light MAXOS 4M691 luminaires × 2 lamps (Philips Lighting Spain, Madrid, Spain) with a total power of 140 W. To determine the spectral distribution scans of the different light treatments, recordings were conducted at 400–1100 nm with 1-nm steps using a calibrated spectroradiometer (LI-COR 1800, Lincoln, NE, USA) at the canopy level.
Agronomic characterization of each light treatment was assessed following the methodology established by Baille et al. [14]. The plants were grown under a photoperiod of 16 h of light and 8 h of dark and were irrigated manually every day with a Steiner nutrient solution [15] in order to avoid any water or nutrient limitation. The experimental design consisted of three light treatments, four blocks for each treatment, and five plants (one plant per pot) per block, giving a total of 60 plants plus border plants. The selection of these light treatments was undertaken following the recommendations given by local nursery growers for Dieffenbachia plants.
The quantum flux is defined as the number of photons (in µmol) per second and unit area on a surface (µmol·m−2·s−1). To calculate the quantum flux considering the value of each wavelength, we used the following abbreviated equation:
EQF = I × λ × 0.836 × 10⁻²
where I is irradiance expressed in W·m−2.
To calculate the integral quantum flux of PAR, we used the following equation:
E QF   PAR   = 400 700 E QF λ .
According to these equations, the values of the integral quantum flux were the following: 112.38, 77.37, and 101.22 µmol·m−2·s−1 for treatments T1, T2, and T3, respectively.

2.3. Growth Parameters

At the end of the experimental period, the plants were harvested, and the substrate was gently washed from the roots of five plants per treatment. The plants were divided into roots (R), stems (S), and leaves (L), and the respective fresh weights (FW) were measured. Roots, stems, and leaves were then oven-dried at 60 °C until they reached a constant weight to measure their respective dry weights (DW). These dry weights were used to calculate several plant parameters as indicated by Ryser and Lambers [16] and García-Caparrós et al. [2]: the leaf weight ratio (LWR; leaf DW per unit plant DW), the stem weight ratio (SWR; stem DW per unit plant DW), and the relative root weight ratio (RWR; root DW per unit plant DW). The TDW was calculated as the sum of leaf, stem, and root DWs. The fresh and dry weights of roots, stems, and leaves were used to calculate the water content (WC) as indicated by Ben Amor et al. [17]:
WC = (FW − DW)/FW.

2.4. Analysis of Mineral Elements

The determination of nutrient concentrations in roots, stems, and leaves was carried out on oven-dried samples which were ground in a mill and divided into two subsamples. In one subsample, the soluble ionic form of nitrate (NO3) was quantified using water extraction and HPLC, as described by Csáky and Martínez-Grau [18]. The other subsample was mineralized with sulphuric acid (H2SO4, 96%) in the presence of P-free hydrogen peroxide (H2O2, 30% (w/v)) at 300 °C and used for the determination of organic N [19], total P [20], and K+ [21] concentrations. The total N concentration was calculated as the sum of the organic N and NO3-N concentration.

2.5. Physiological Parameters

The concentrations of proline, total soluble sugars (TSS), starch, and indole 3-acetic acid (IAA) were determined in the leaves of five plants randomly selected per treatment at harvest. The free proline, TSS, starch, and IAA concentrations were determined in the alcoholic extract supernatant. The free proline concentration was determined by the ninhydrin reagent method. Free proline concentration was expressed as µg·g−1·FW. The total soluble sugars concentration was determined by the anthrone reagent method. The starch concentration was determined using the oven-dried residue of total soluble sugars determination. The total soluble sugars and starch concentration was expressed as mg glucose g−1·FW [22]. The IAA concentration was determined by the Salkowski reagent method and was expressed as mg·g−1·FW [23].

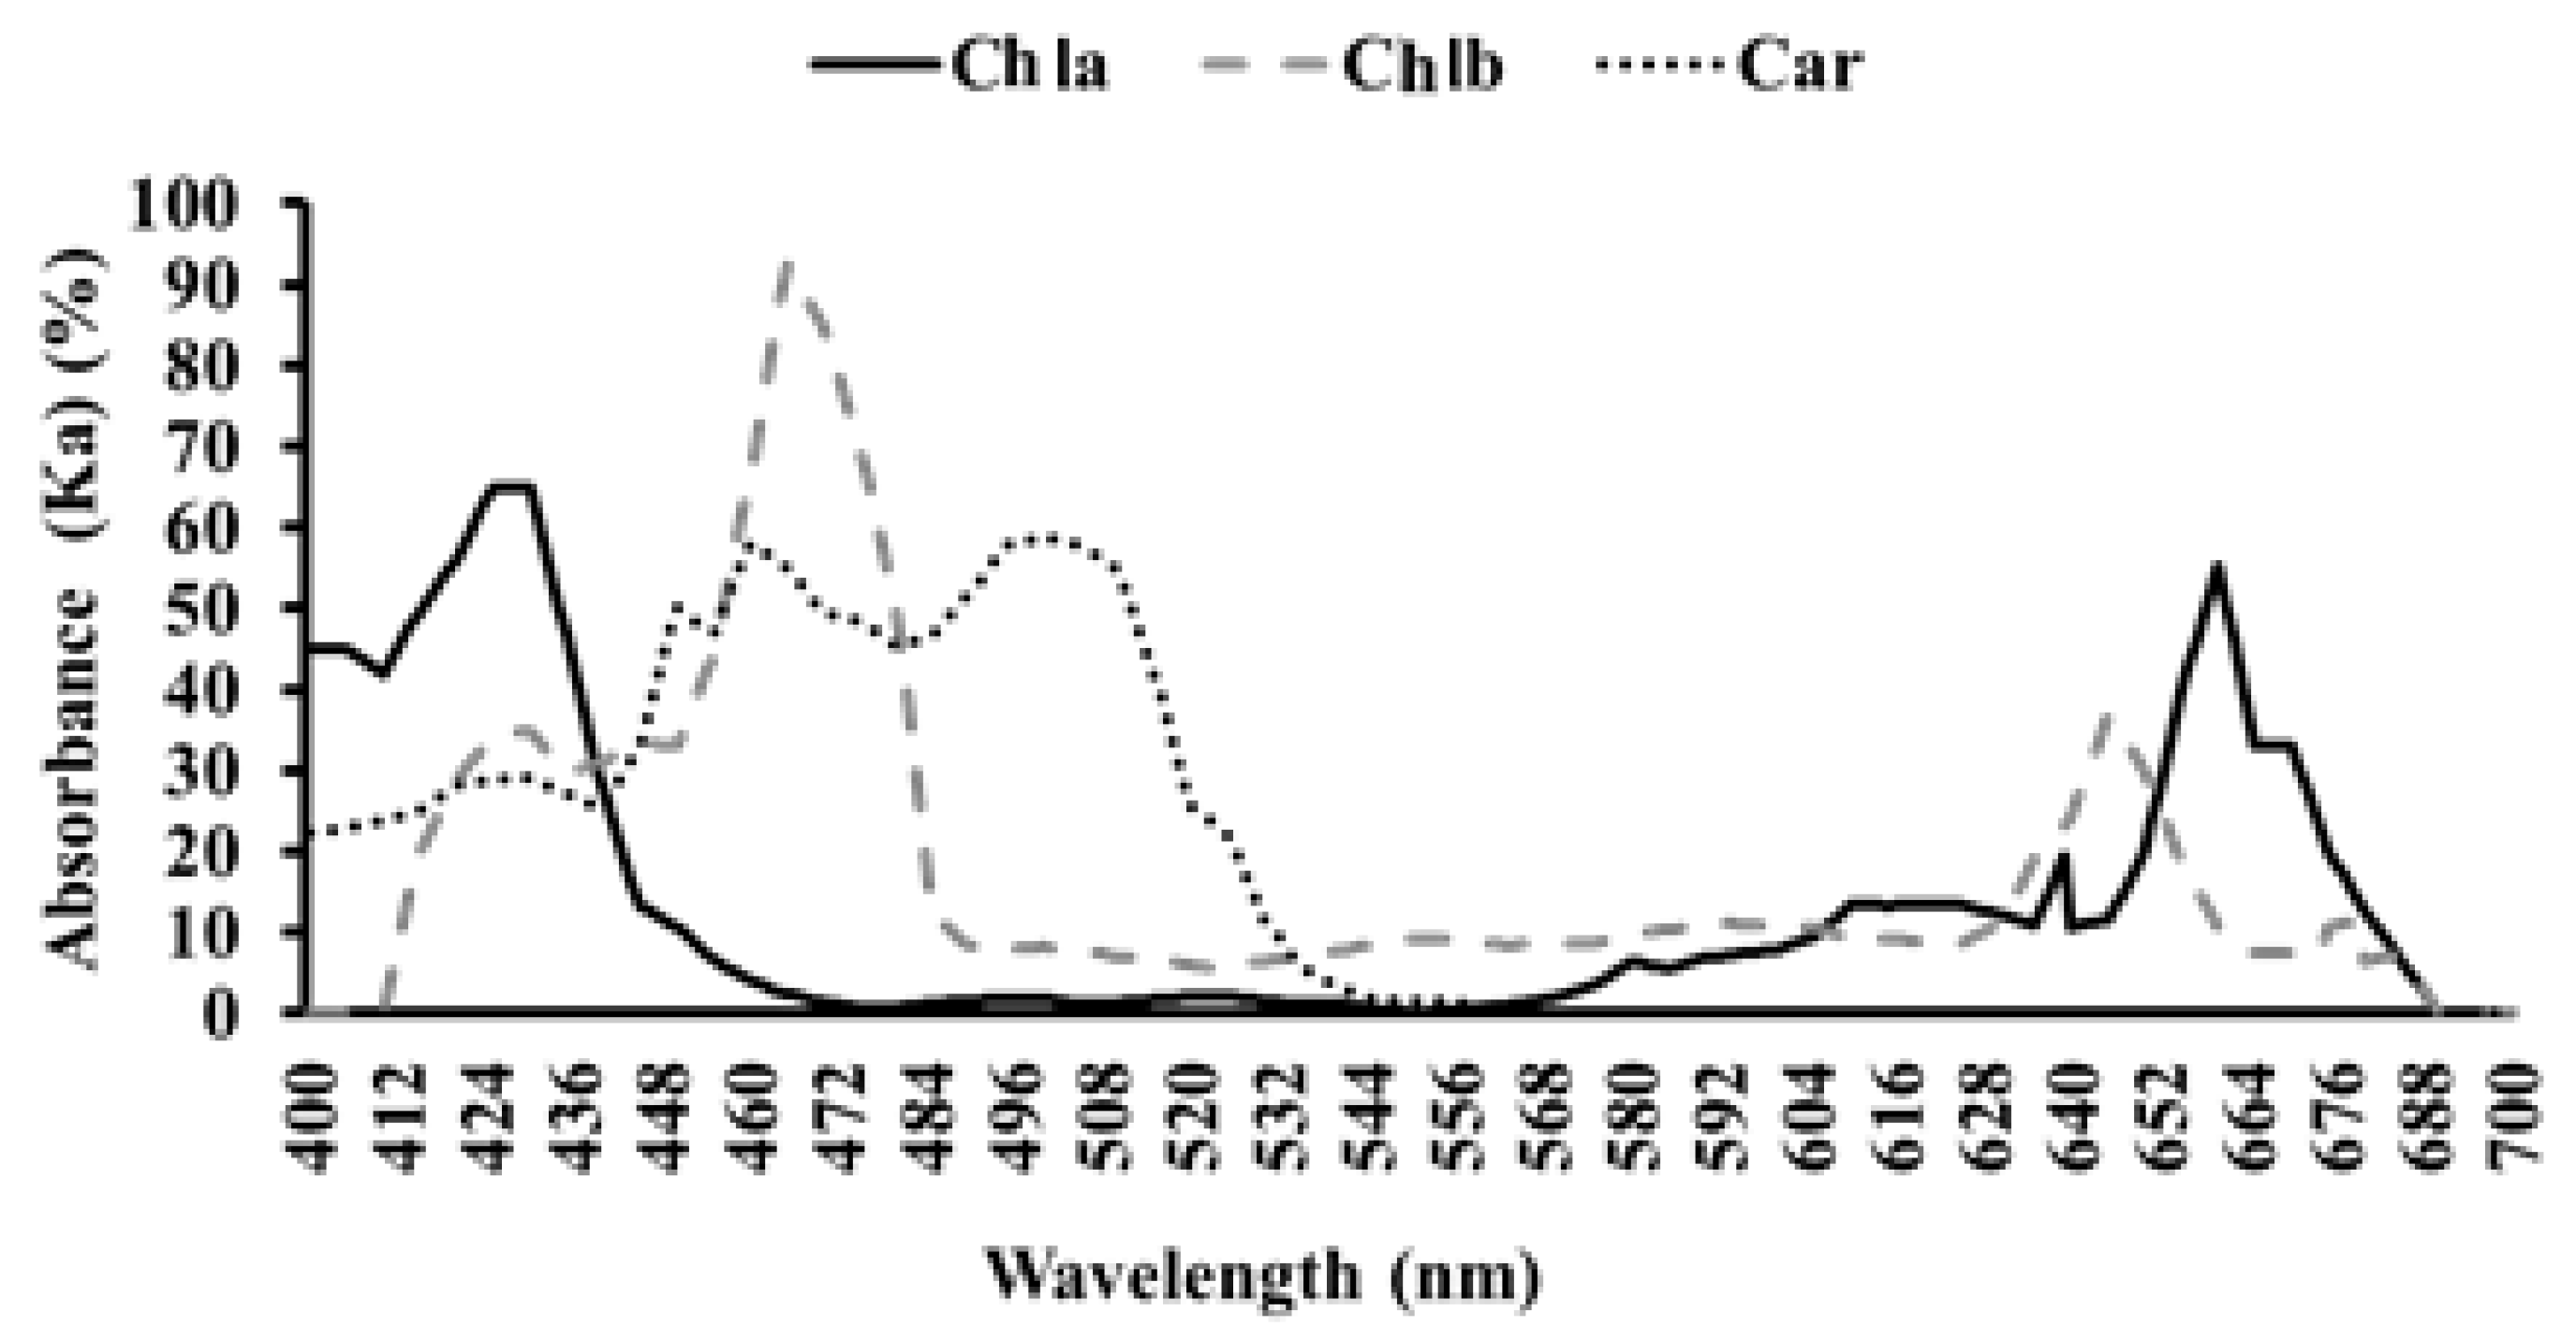
2.6. Pigment Concentrations

To determine the concentrations of pigments (chlorophylls and carotenoids) in leaves, five plants were randomly selected per treatment at harvest. Extraction of chlorophyll a and b (Chl a and Chl b) and carotenoids were performed by submerging 0.2 g of fresh mature leaf material in methanol in the dark at room temperature (15 °C) for 24 h. The supernatant was removed, and the photosynthetic pigment concentrations were determined colorimetrically at their respective wavelengths following the methodology of Wellburn [24]. Pigment concentrations were expressed as mg·g−1·FW.

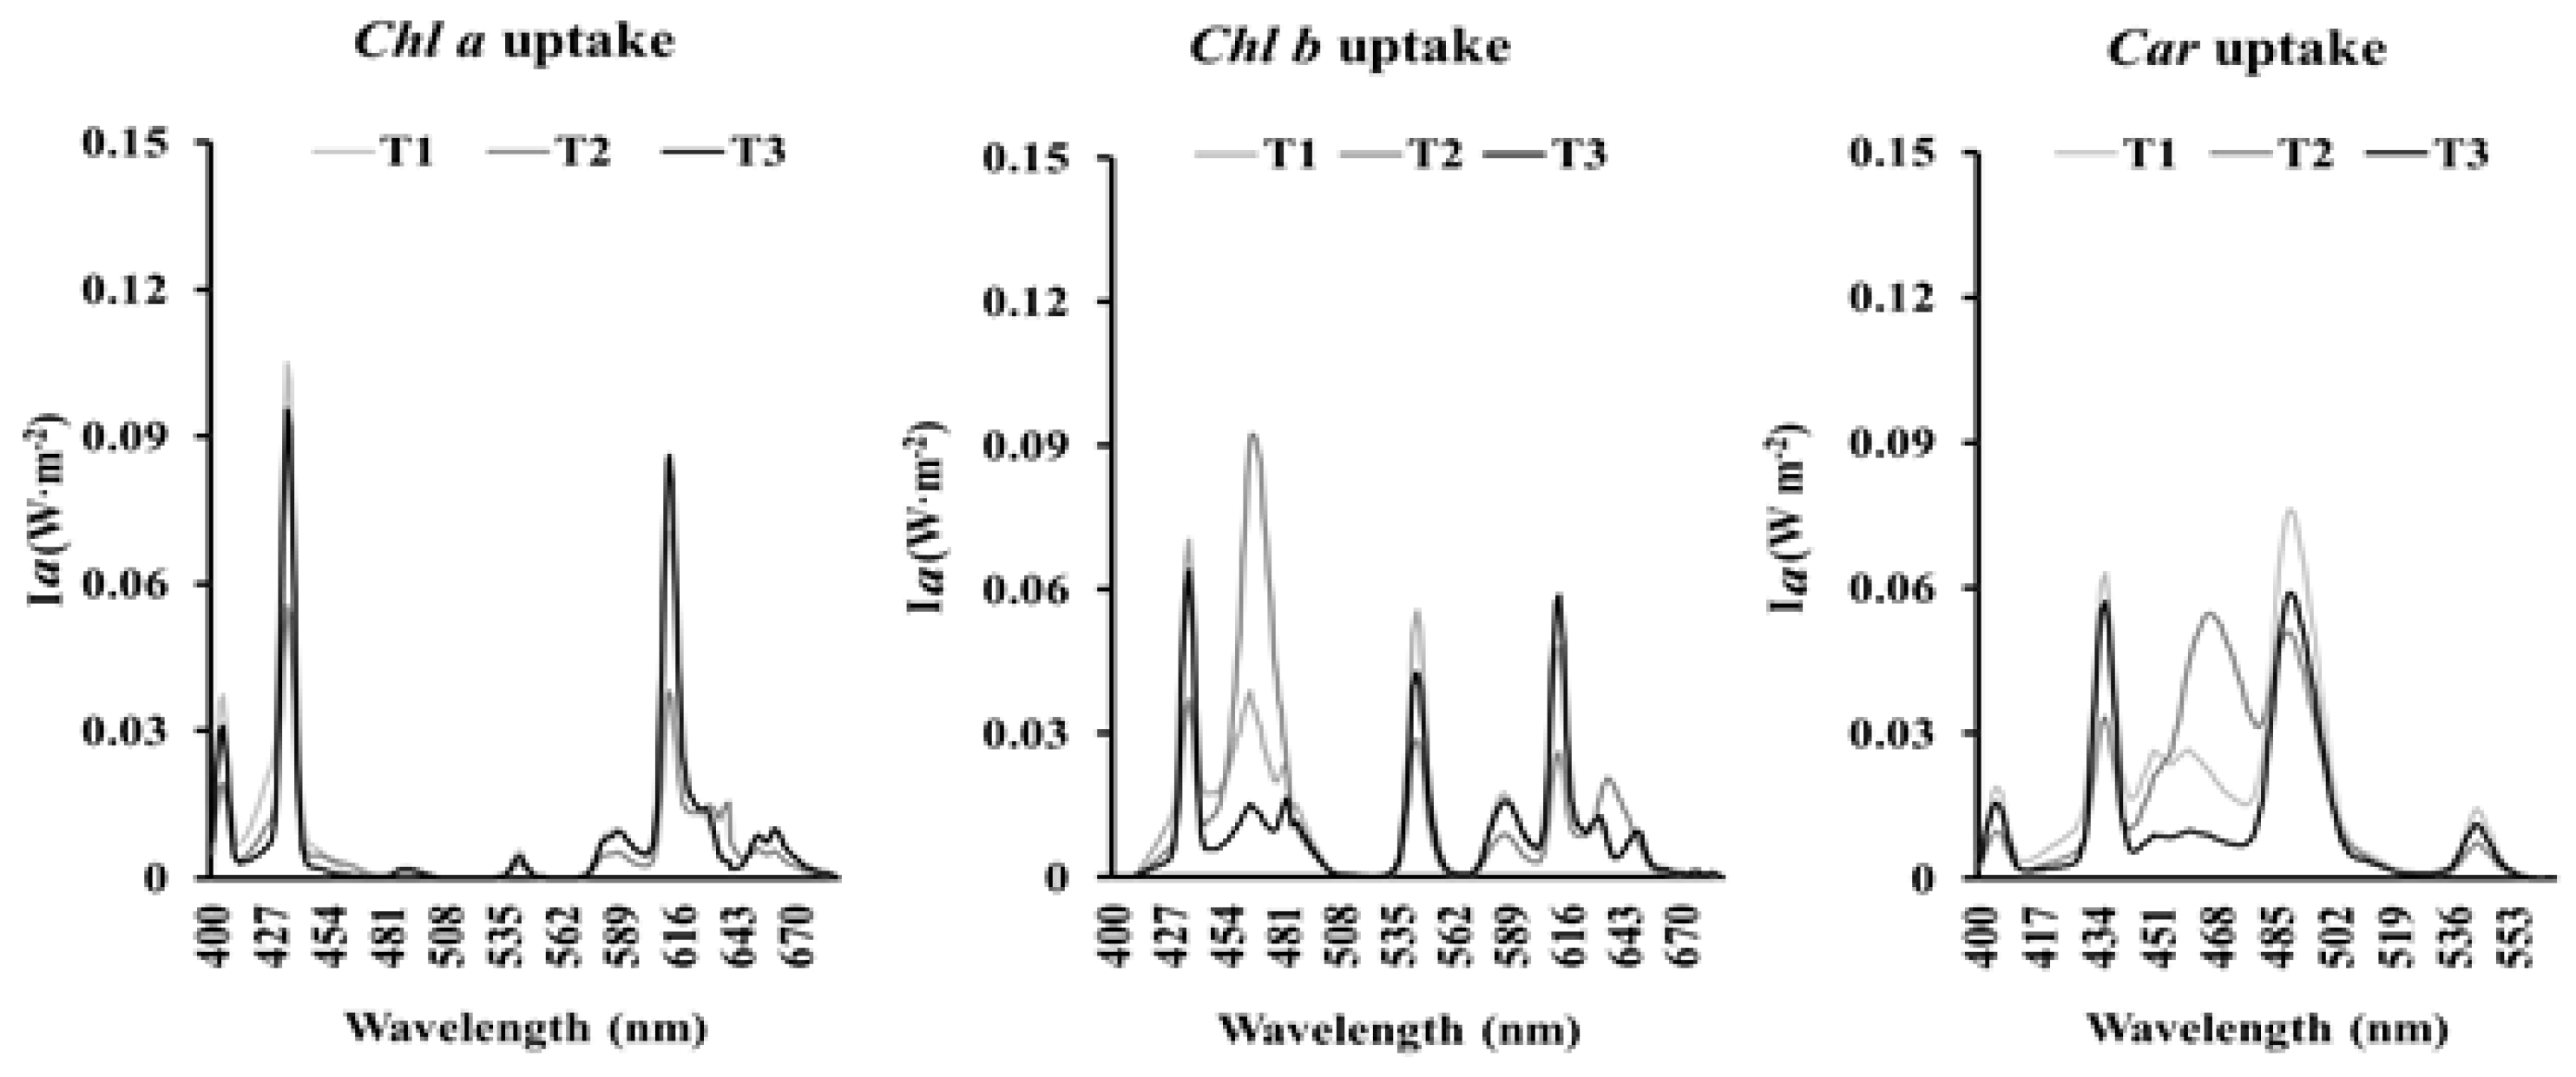
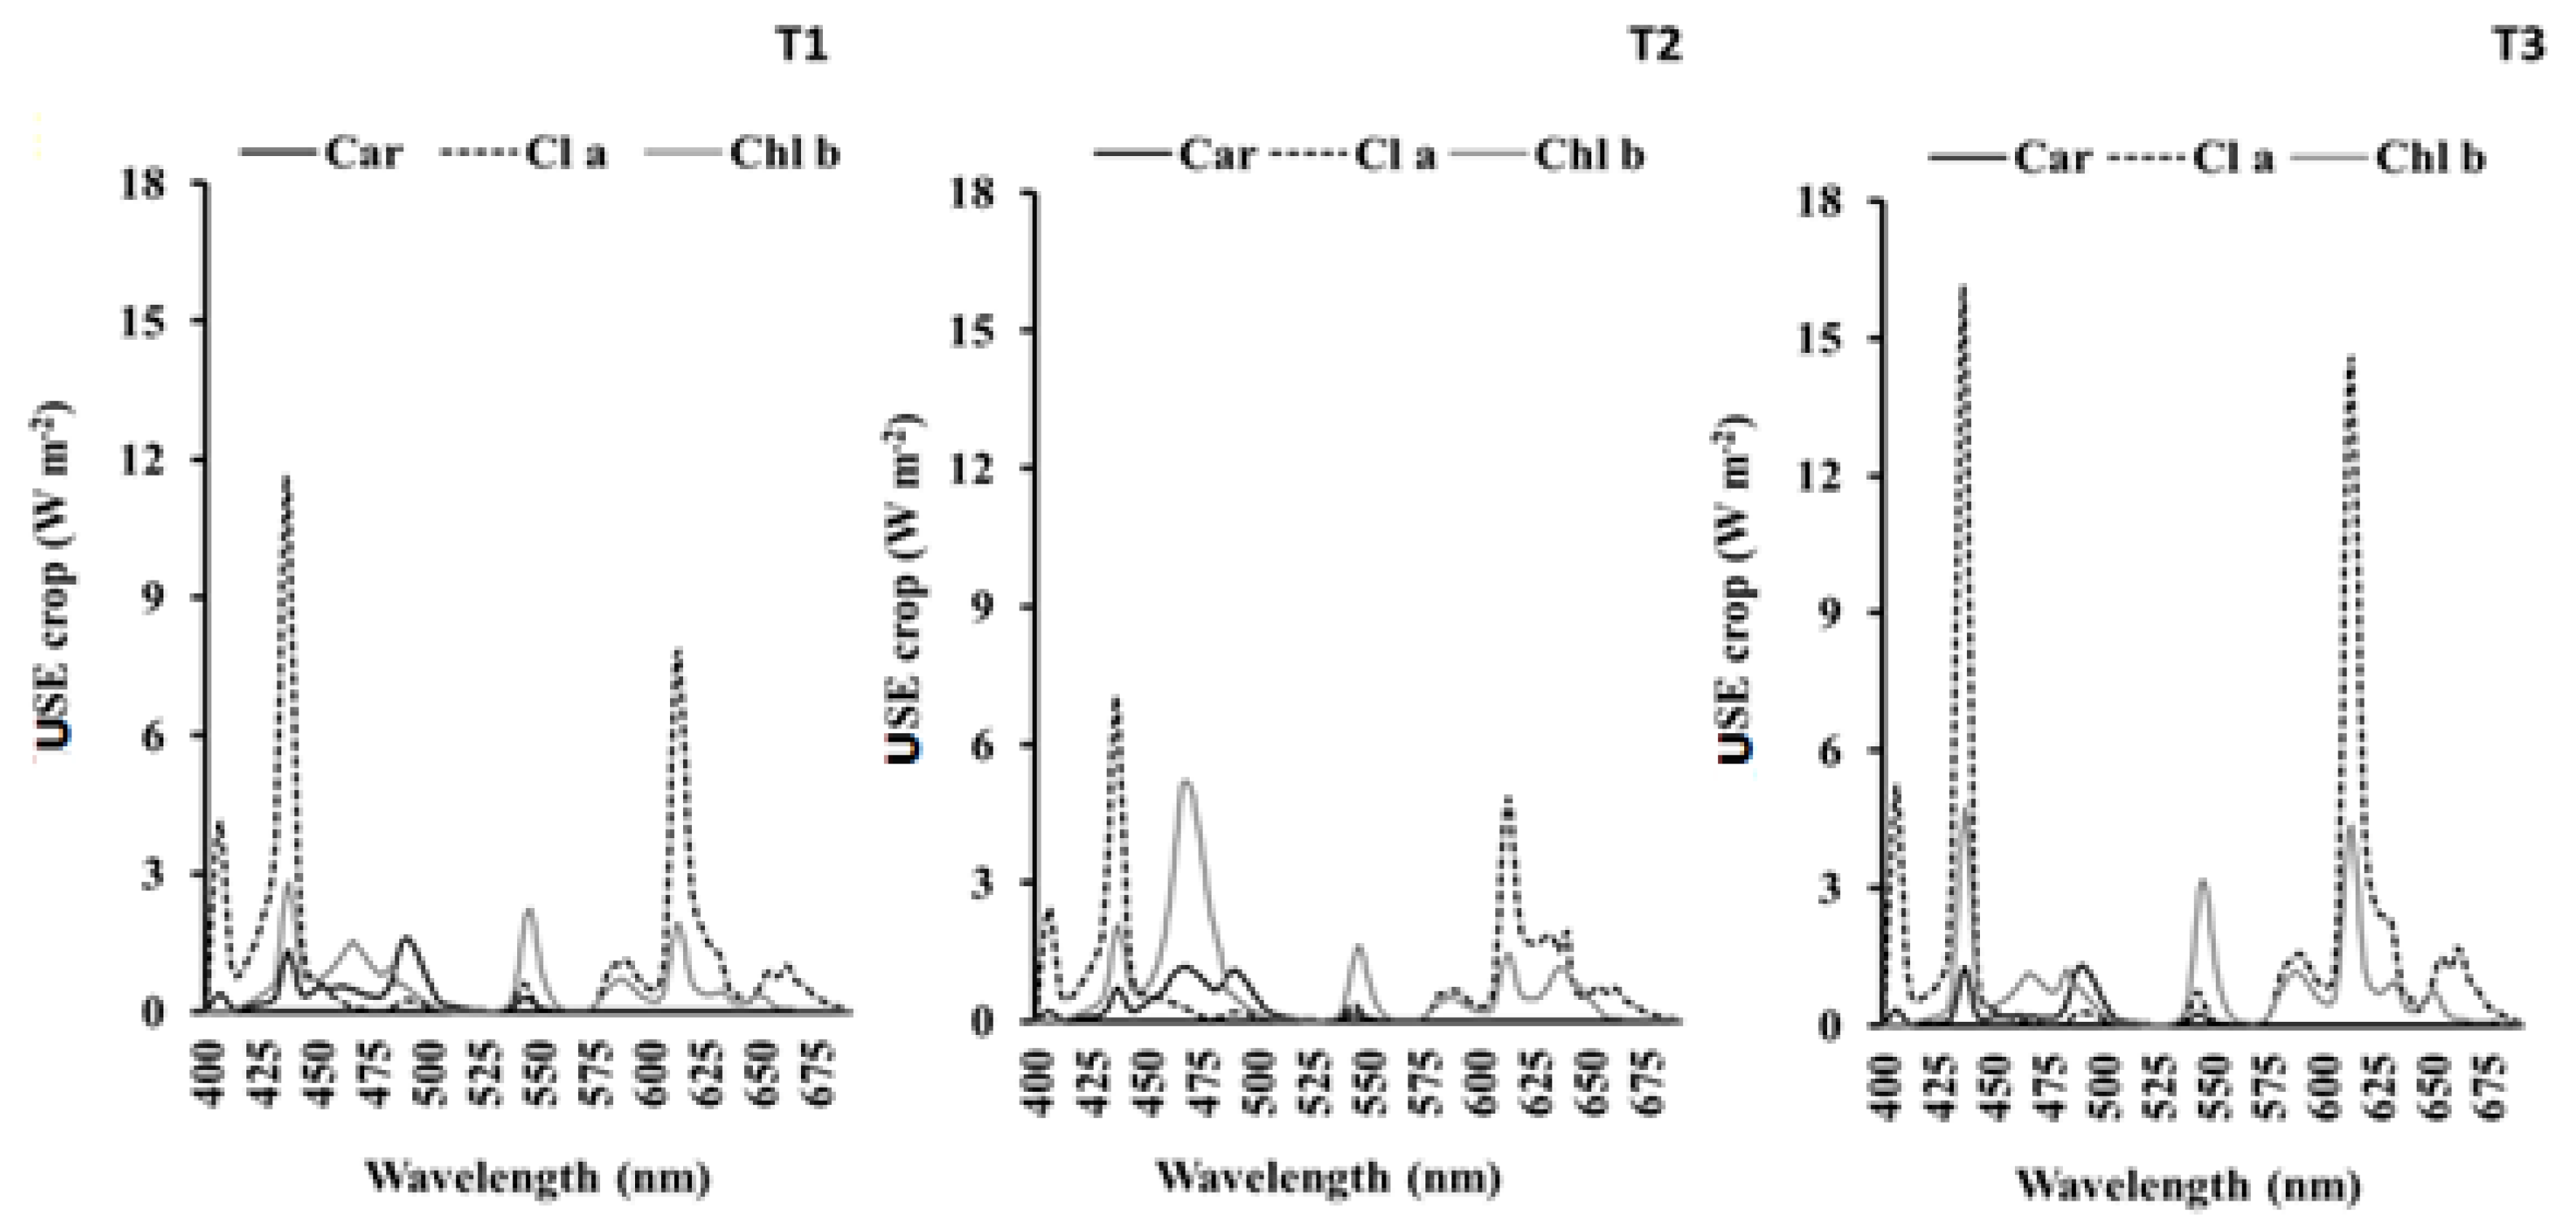
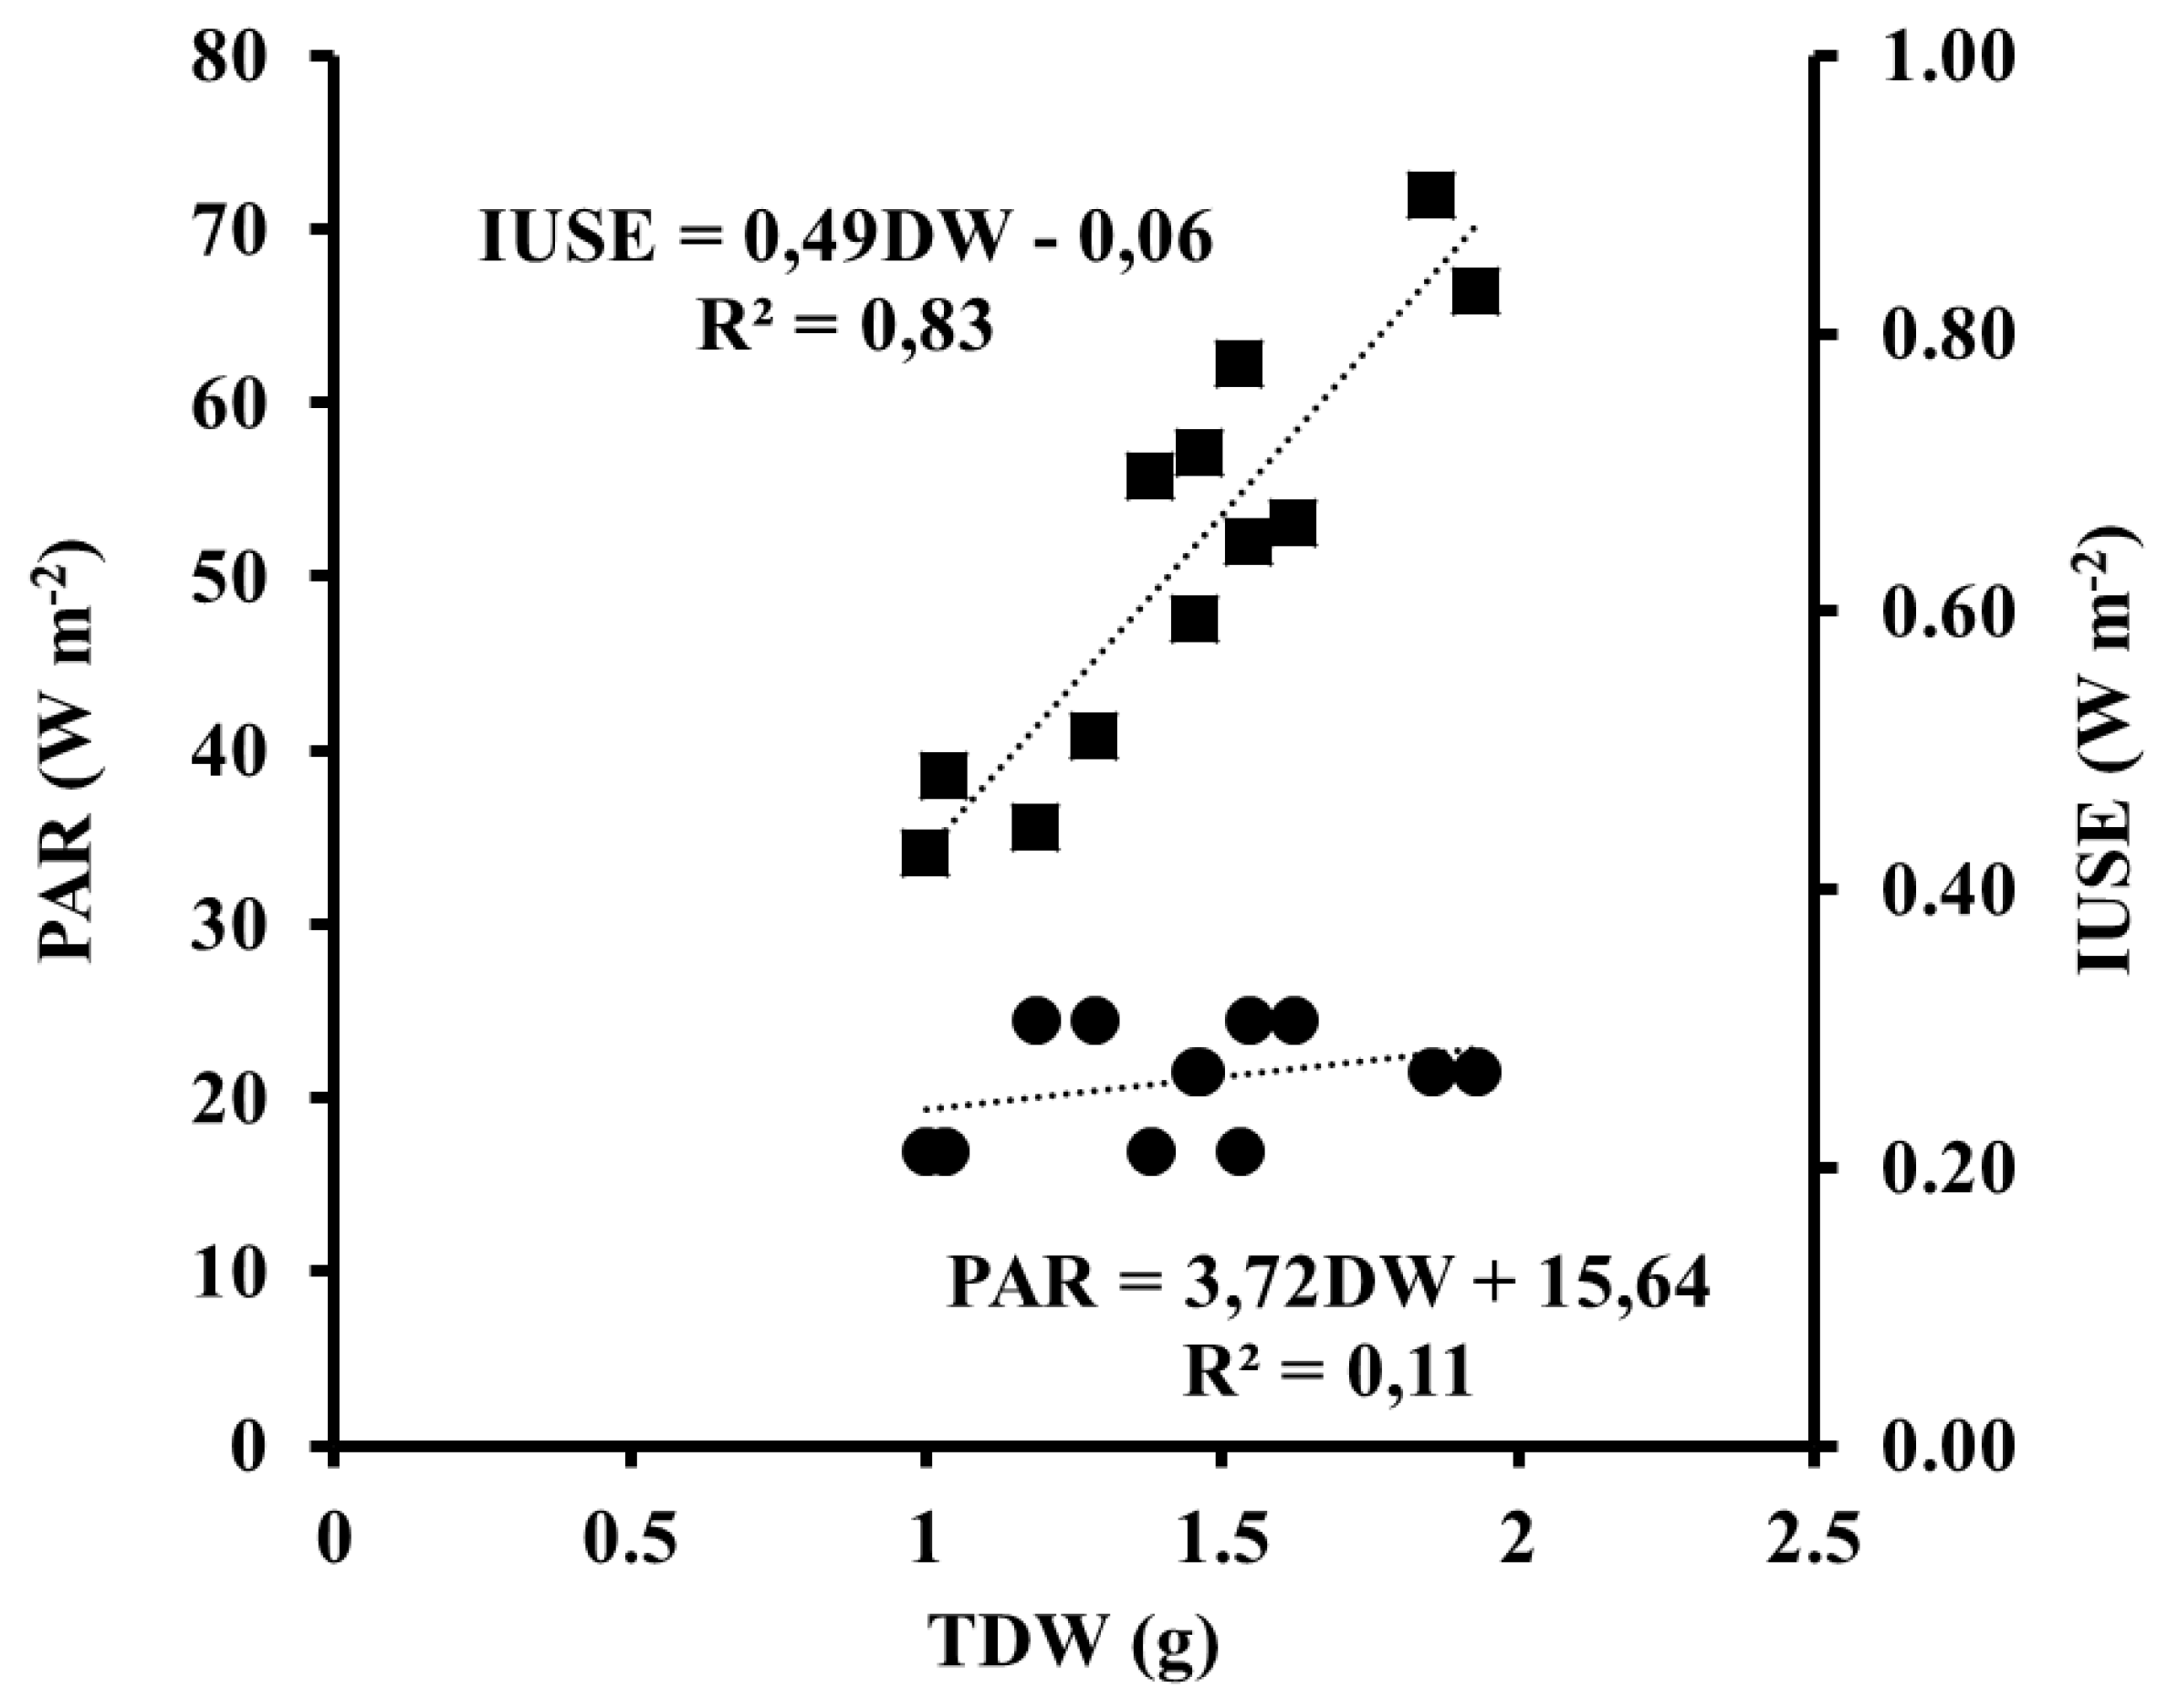
2.7. Plant´s Harvesting Lamp PAR Model

To study the energy collected by a plant which could to be transformed into biomass, we considered the concepts of theoretical irradiance energy absorbed by pigments (Ia), the theoretical use of spectral energy by each pigment of the plant (USEpigment), and the theoretical integrated use of spectral energy (IUSE) by a crop as the capacity of harvesting radiation energy by a plant.
The theoretical irradiance energy absorbed by pigments (Ia) (chlorophyll a and b and carotenoids) was calculated using the following equation:
Ia ( car ,   chl   a ,   chl   b ) = 400 700 Ka ( car ,   chl   a ,   chl   b ) Ie   d
where:
Ia (car, chl a, chl b): total irradiance energy absorbed by each pigment expressed in W·m−2;
Ka (car, chl a, chl b): percentage of energy absorbed by pigment according to each wavelength following the recommendations established by Whitmarsh and Govindjee [25]; and
Ie: irradiance emitted by each lamp per wavelength expressed in W·m−2.
Considering that all leaves have received the same irradiance, the theoretical USEpigment for each light treatment was calculated using the following equation:
USEpigment (car, chl a, chl b) = (LW*c) * Ia
where:
USEpigment (car, chl a, chl b): use of spectral energy absorbed by each pigment per plants expressed in W·m−2;
LW: leaf fresh weight per plant expressed in g plant−1; and
c: pigment concentration in leaves, expressed in mg·g−1·FW.
Considering the three photosynthetic pigments, the theoretical IUSE by crop was calculated as the summation of the USE of each pigment:
IUSEcrop = USECla + USEClb + USEcar.

2.8. Statistical Analysis

The experiment had a completely randomized block design, and the values obtained for each plant and each variable were considered as independent replicates. The data were analyzed through one-way analysis of variance (ANOVA) and least significant difference (LSD) tests (p < 0.05) in order to assess the differences between treatments. To relate the IUSE and biomass (TDW), a simple regression was done, and this regression was compared with the classical simple regression between PAR and biomass (TDW). All the statistical analyses were carried out with Statgraphic Plus for Windows (version 5.1.).

3. Results

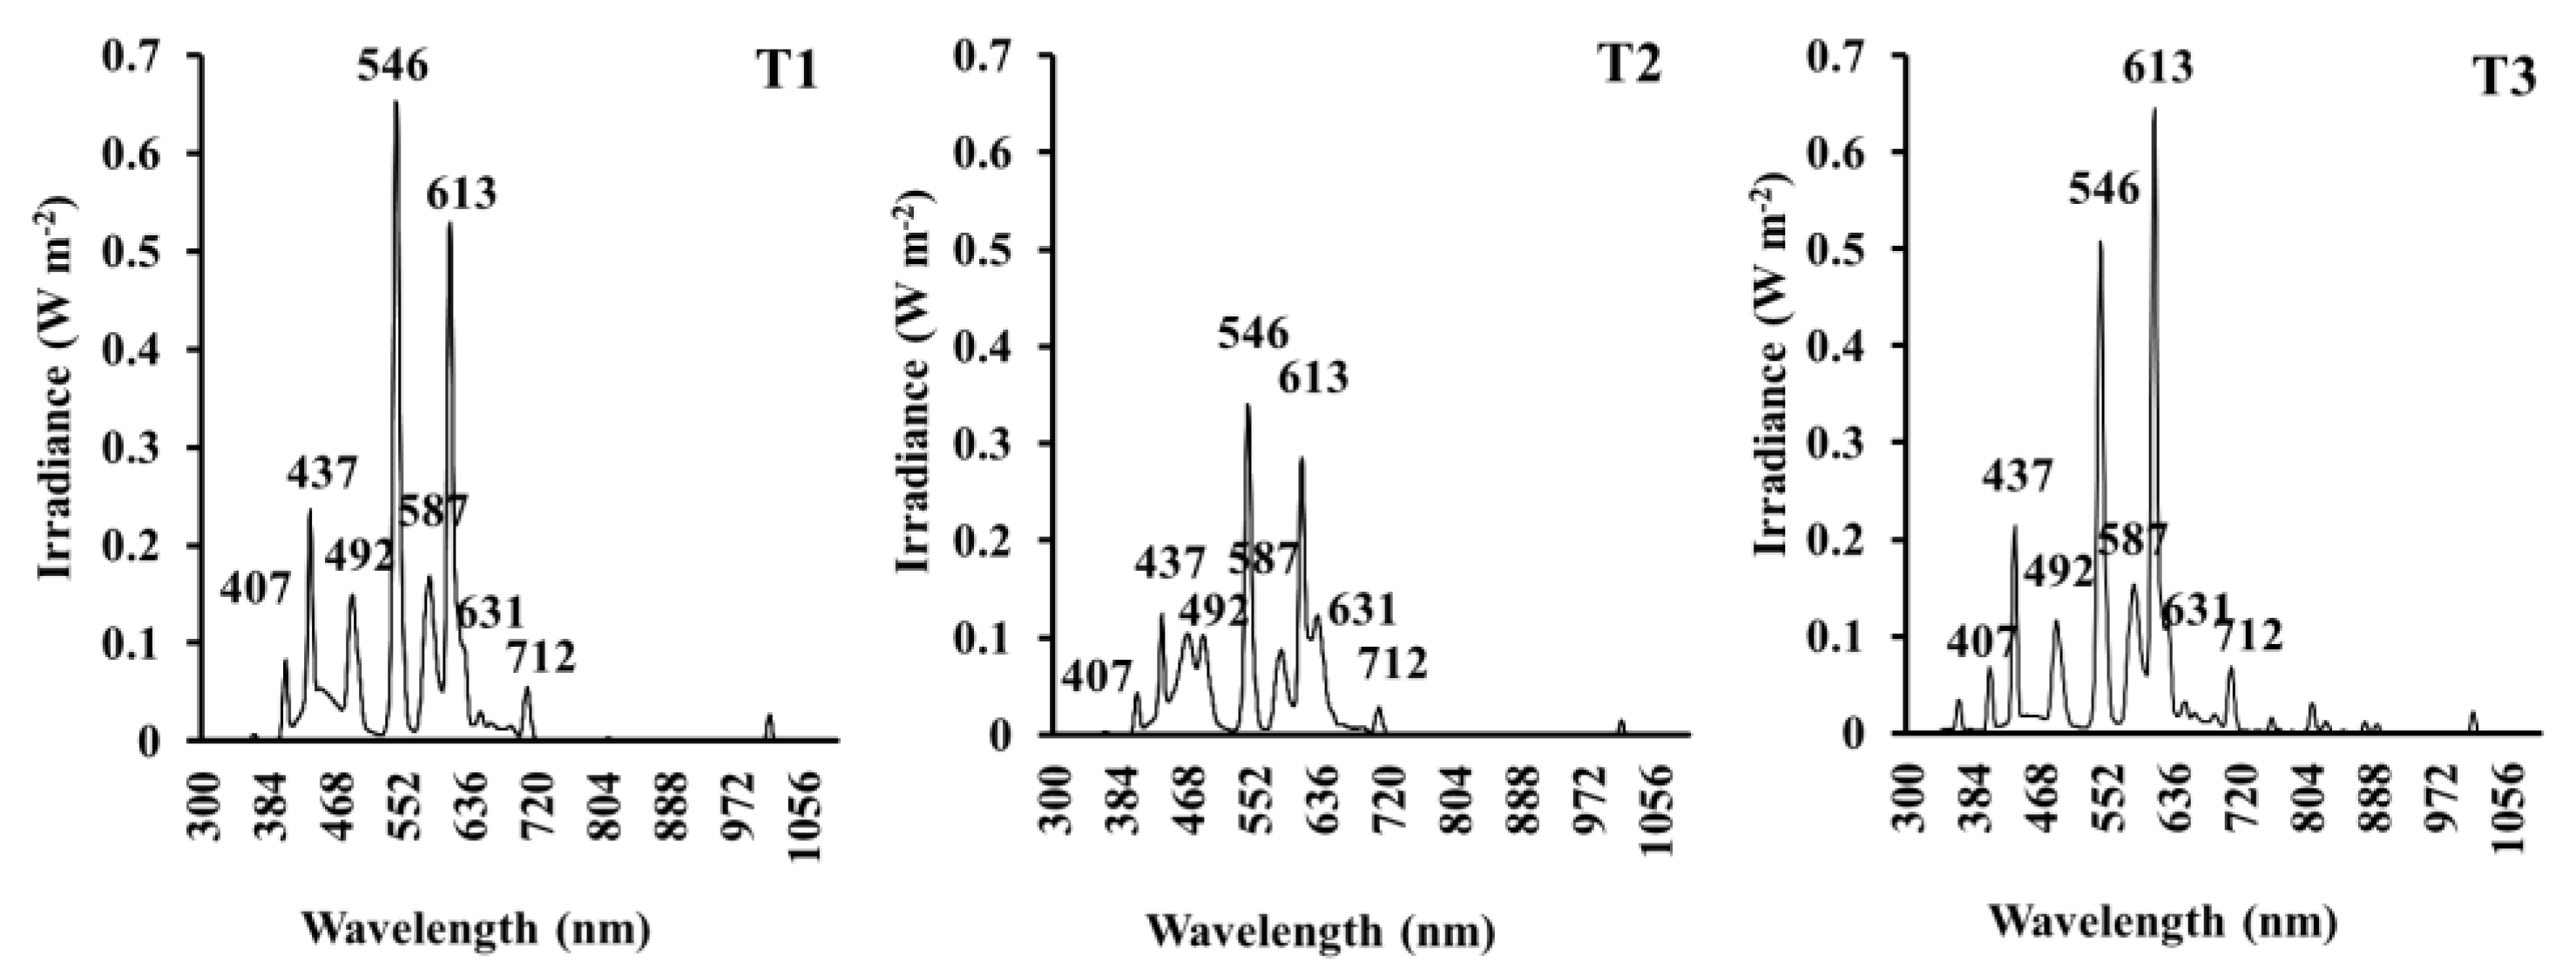
3.1. Spectral Distribution

Spectral distribution of the different light treatments showed common peaks at 407, 437, 492, 546, 587, 613, 631, and 712 nm (B, R, and far red (FR) regions). Treatment T2 showed the lowest values compared with those in treatments T1 and T3. Moreover, the highest peak in T1 occurred at 546 nm, whereas in T3, this occurred at 613 nm (Figure 1). The agronomic characterization of light treatments showed different trends according to the spectral region studied. Treatment T1 had the highest values of B, PAR, and total radiation compared with the other light treatments; however, T3 had the highest values of UV, R, FR, and NIR. Treatment T2 showed the highest values in the ratios calculated, except for the ratio of PAR:TOTAL, which showed the same value as in T1 (Table 1). All the data have been recorded in W m−2 since irradiance is defined as the power of electromagnetic radiation incident per unit area on a surface. Nevertheless, for biological processes, the quantum flux of light with a distinct wavelength has a higher relevance than the irradiance.

3.2. Growth Parameters

Root DW was greatest (1.3-times) when the plants grew under treatment T2. The shoot DW showed the highest value in plants grown under treatment T1 and leaf DW in plants grown under treatment T3. The total DW was similar in plants grown under treatments T1 and T3. Plants grown under treatment T1 presented the highest values of relative root and stem weight ratios, whereas the values of leaf weight ratio were the highest in plants grown under treatment T3. The WC of roots, stems, or leaves was unaffected by the light treatments (Table 2).

3.3. Nutrient Concentrations

The N concentration of the stems and leaves was modified by the light treatments, showing the highest values in plants grown under treatment T1. In roots, however, N remained unchanged under different light treatments. In roots, stems, and leaves, the light treatments did not affect the P concentration. The roots and leaves of plants grown under treatment T1 had the highest K concentration (2 times greater than in the other light treatments), while in stems there were no significant differences among light treatments (Table 3).

3.4. Physiological Parameters

Plants grown under treatment T1 had a significantly higher proline and IAA concentration in leaves (1.4 times and 1.7 times, respectively) compared with those under T2 and T3 treatments. However, plants grown under T3 treatment showed the highest concentration of total soluble sugars and starch (Table 4).

3.5. Photosynthetic Parameters

Chlorophyll a concentrations of D. maculata leaves in all treatments were higher than the respective chl b concentrations. Plants grown under T1 treatment had the lowest chlorophyll (a, b, and a + b) concentration. However, no significant differences were observed in carotenoid concentration, regardless of the light treatment (Table 5).

3.6. Plant’s Harvesting Lamp PAR Model

The percentage of energy absorbed by each pigment (Ka) (chlorophylls a and b and carotenoids), following the recommendations established by Whitmarsh and Govindjee [25], are presented in Figure 2. The highest peaks in Chl a were at 430 and 660 nm; in Chl b at 430, 500, and 646 nm; and in carotenoids at 460 and 500 nm. With these results obtained, and considering the Ie data recorded (irradiance emitted by each lamp per wavelength expressed in W·m−2), we calculated the theoretical irrandiance energy absorbed by pigments (Ia) (Chl a, Chl b, and carotenoids) for each light treatment (Figure 3). Then, using the formulas mentioned above, we calculated the use of spectral energy absorbed by each pigment per plant’s USEpigment (car, Chl a, and Chl b) (expressed in W·m−2) (Figure 4). Integrating the results obtained for each pigment and light treatment, we obtained the data reported in Table 6, where treatment T3 showed the highest value of USE for Chl a and a value equal to T2 for Chl b, whereas in USEcar, there were no significant differences between light treatments. The values of the IUSE by crop were the following: 5.11, 5.96, and 8.18 W·m−2 under T1, T2, and T3, respectively. Finally, TDW was related to IUSE and PAR through a linear regression (Figure 5), showing that the relationship between ISUE and TDW (R2 = 0.83) was higher than the relationship between PAR and TDW (R2 = 0.11).

4. Discussion

The light spectrum greatly influences plant development, morphology, and physiology [26]. In our experiment, growth under different types of lighting had different effects on the biomass and the biochemical parameters of D. maculata plants. The highest value of root dry weight in plants grown under TLD lamps and BR-LEDs (T2) may be ascribed to the lower value of red light of this type of lamp. Different results were observed by Randall and Lopez [27], who noted an increase of root dry weight in Celosia and Impatiens plants under increasing red light treatment. After 8 weeks of exposure to different light treatments, the highest value of stem dry weight in plants grown under TLD lamps (T1) may be ascribed to this treatment having the highest value of blue light. Similar results were reported by Terfa and co-workers [28,29], who noted an increase of stem dry weight in rose plants under blue light treatment. Concerning leaf dry weight, plants grown under high-efficiency fluorescent TL5 showed the highest value, and this could be due to the high value of red light emitted by these lamps. These results are at odds with the data obtained by Zheng and Van Labeke [30], who reported that the leaf dry weight in Ficus benjamina and Sinningia speciosa plants was significantly lower under red light.
The highest value of total plant dry weight under TLD lamps (T1) and high-efficiency fluorescent TL5 (T3) may be ascribed to the different effects induced by the radiation emitted by these lamps. In plants grown under TLD lamps (T1), the increase in total plant dry weight could be related to the highest values of PAR, whereas in plants grown under high-efficiency fluorescent TL5 (T3), it could be attributed to the highest values of red light. The increase in total plant dry weight under high levels of photosynthetically active radiation was in line with the results obtained by Currey and Lopez [31], who also noted an increase in total plant dry weight in ornamental species such as Impatiens and Petunia. With respect to the effects of red light on total plant dry weight in ornamental species, Wollaeger and Runkle [32] reported that the plant dry weight was greatest for Salvia and Petunia under these light conditions. These results could be explained by the fact that increasing red light enhanced leaf area and consequently resulted in a greater photosynthetic capacity, which led to an increase in total plant dry weight, although the values of PAR in high-efficiency TL5 fluorescents (T3) was lower compared to TLD lamps (T1). The different trends in biomass partitioning in plants grown under three different light treatments suggested preferential biomass accumulation between different sink tissues with respect to the light characterization. Moreover, in our experiment, water content in all the organs studied was not affected by the light treatments. These results suggest that there was no relationship between total radiation and water content, as can be expected, although it is well known that an increase in total radiation involves a high transpiration and, consequently, a decrease in the water content in TLD lamps (T1) and high-efficiency fluorescent TL5 (T3)) [33]. In addition, it is necessary to highlight that the highest B/R ratio in TLD lamps and BR-LEDs (T2) may induce a high stomatal aperture according to Inoue and Kinoshita [34], promoting the same rate of transpiration as in the other light treatments.
Mills and Jones [35] proposed the following as a leaf nutrient reference in D. maculata: N (25–40 mg·g−1·DW), P (2.5–8.5 mg·g−1·DW), and K (17–65 mg·g−1·DW). The leaf nutrient reference for the variety “Camille” proposed by Segura et al. [36] was the following: N (30 mg·g−1·DW), P (12 mg·g−1·DW), and K (50 mg·g−1·DW). In our experiment, the N concentration was lower than the references cited, which can be related with the specific characteristics of the variety. Phosphorus concentration was inside the range proposed by Mills and Jones [35] and lower than that of Segura et al. [36]. In the case of K concentration, this was inside the ranges proposed by both references.
There are a limited number of studies on mineral nutrient uptake by crops as affected by different light treatments. The results obtained in this experiment showed that P concentrations in the different organs of the plants under the three light treatments were similar. Similarly, Evans et al. [37] reported no differences in P concentrations in Betula cordifolia and Abies balsamea under different light conditions. Nevertheless, Kopsell and Sams [38] reported an increase in P in shoot tissue in sprouting broccoli microgreens grown under blue light exposure. The N and K concentrations in roots and leaves, respectively, were also similar. However, N concentration in stems and leaves, and K concentration in roots and leaves of the plants, displayed different patterns under different light treatments, being the highest under TLD lamps (T1). The highest N concentration in stems and leaves in plants grown under TLD lamps may be ascribed to the highest values of total radiation as reported by Sakuraba and Yanagisawa [39]. Moreover, the activity of nitrate reductase is influenced by the total radiation, as reported by Fallovo et al. [40], which involves a decrease in nitrate concentration due to its reduction, which leads to a high level of nitrogen uptake and the consequent high level in leaves. Almansa et al. [41] also reported an increase in N concentration in tomato seedlings grown under lamps with high blue spectrum values, which could be explained by the high activity of nitrate reductase in plants grown under blue light conditions, as proposed by Azuara and Aparicio [42]. The highest K concentration in roots and leaves in plants grown under TLD lamps can be also related with the high values of blue light radiated by the lamps. Similarly, Babourina et al. [43] reported that Arabidopsis seedlings grown under blue light conditions showed an increase in K concentration due to the changes in guard cell membrane transport activity.
Although the effects of light quality on proline biosynthesis are not well documented, it is well known that proline is a compound that ameliorates the damage caused by Reactive Oxygen Species (ROS) formation under different light conditions [44]. In our experiment, the highest concentration of proline in leaves was observed in plants grown under high levels of blue light. Similar results were reported by Zheng and Van Labeke [45] for Chrysanthemum plants grown under blue compared with the other light qualities. Auxin synthesis is modified by intensity and quality spectrum light [46]. In our experiment, the highest IAA concentration in plants grown under TLD lamps may be due to the high values of blue light discharged by the lamps. These results agree with the findings reported by Fukuda et al. [47], who noted an increase in IAA concentration in Petunia hybrida plants grown under blue light conditions. However, cowpea and sunflower plants showed an increase in the endogenous level of IAA under FR light treatment and reduced by a high R:FR ratio [48,49]. The results obtained by these researchers can be ascribed to the process of photoconversion of phytochrome (phyB) into the inactive (Pr) form and the low phyA levels due to the R-enriched light environment before the shift to low R/FR-ratio light since phyA and phyB are both repressors of auxin-regulated gene transcription [50].
Light quality participates in carbohydrate metabolism and consequently in the growth of plants [51]. In this experiment, total soluble sugars and starch concentrations in leaves were higher in plants grown under high-efficiency TL5 fluorescents, which can be related to the high values of red in the lamps. These results were in line with earlier investigations which showed that the increase in sucrose and starch content under R treatment is dependent on the reduction in the translocation rate of photosynthetic products out of the leaves [52,53]. Moreover, it is necessary to point out that the starch concentration was higher than the total soluble sugar concentration, which could be due to the effects of red light, as it may retard the translocation of photosynthetic products and thereby increase the accumulation of starch [11].
Changes in irradiance wavelengths can cause changes in chlorophyll biosynthesis [54]. In our experiment, the lowest chlorophyll concentrations were found in plants grown under TLD lamps. Contradictory results were reported by Randall and Lopez [55], who noted an increase in chlorophyll concentration as the amount of blue light increased for several bedding ornamental species, such as Antirrhinum majus, Pelargonium hortorum, and Salvia splendens. Similar results were obtained for roses grown under blue light treatments by Bergstrand et al. [56]. No variations in carotenoid concentrations under different light treatments were reported in this experiment. These results suggest that carotenoid concentrations did not appear to be affected by the wavelengths in the light environment, coinciding with the results reported by Zheng and Labeke [30], who noted that carotenoid concentrations in Cordyline australis and F. benjamina did not vary under different light treatments.
The pigment concentration plays a crucial role in the potential photosynthesis rate as well as plant growth [57]. The majority of harvesting light energy is carried out through chlorophylls, which are mainly absorbed in the blue–red part of the spectrum [58]. Harvesting of light energy by carotenoids is lower, since they are less efficient at excitation energy transfer than chlorophylls [59].
In our experiment we have assessed the IUSE by the spectral energy emitted by the lamp, radiation absorption by the pigments, and the photosynthetic pigment concentration in plants in order to evaluate the energy savings by the plant. The results obtained reporting a higher correlation between IUSE and DW. Surveying preceding works, there are no references to this methodology. In our approach, we have considered that the main function of chlorophyll in plants is the absorbance of light and transference through plants during photosynthesis, as well as the joint pigment capacity for harvesting radiation [60].

5. Conclusions

Our results showed that the growth of plants under TLD lamps (T1) and high-efficiency TL5 fluorescents (T3) resulted in the highest values of total plant dry weight. Concerning the morphogenetic plant responses, there were different trends in biomass partitioning and no changes in the water contents of the organs studied in plants grown under different light treatments. The exposure of plants under different light treatments also affected the nutrient concentrations in all organs. From a physiological point of view, there were different trends considering the parameters assessed, since the plants grown under T1 showed the highest concentration of IAA and proline, whereas plants grown under high-efficiency T3 had the highest concentration of total soluble sugars and starch. The chlorophyll concentration had the lowest values in plants grown under T1. The use of high-efficiency T3 for the growth of this species is advisable since there is a high accumulation of starch that could be used for the plant growth and is less stressed due to the low concentration of proline compared with plants grown under T1. Concerning the model proposed, it can be highlighted that there was a low relationship between PAR and TDW, whereas the comparison between IUSE and TDW showed a better relationship, with an R2 value of 0.83. Therefore, we recommend this methodology to discern the effects of the different spectral qualities on plant biomass.

Author Contributions

Investigation, data curation, and writing—original draft preparation: P.G.-C.; formal analysis and investigation: E.M.A.; analysis and investigation, R.M.C.; conceptualization, supervision, and project administration: M.T.L.

Funding

This research received no external funding.

Acknowledgments

The authors thank Kevin Folta for his suggestions and English style corrections. The authors also thank the funding of this work by the group AGR-242 from University of Almería (Sustainability of Horticultural and Ornamental Protected Systems).

Conflicts of Interest

The authors declare no conflict of interests.

References

  1. Lütken, H.; Clarke, J.L.; Müller, R. Genetic engineering and sustainable production of ornamentals: Current status and future directions. Plant Cell Rep. 2012, 31, 1141–1157. [Google Scholar] [CrossRef]
  2. García-Caparrós, P.; Llanderal, A.; Pestana, M.; Correia, P.J.; Lao, M.T. Tolerance mechanisms of three potted ornamental plants grown under moderate salinity. Sci. Hortic. 2016, 201, 84–91. [Google Scholar] [CrossRef]
  3. Gangadhar, B.H.; Mishra, R.K.; Pandian, G.; Park, S.W. Comparative study of color, pungency, and biochemical composition in chili pepper (Capsicum annuum) under different light-emitting diode treatments. HortScience 2012, 47, 1729–1735. [Google Scholar] [CrossRef]
  4. Folta, K.M.; Childers, K.S. Light as a growth regulator: Controlling plant biology with narrow-bandwidth solid-state lighting systems. HortScience 2008, 43, 1957–1964. [Google Scholar] [CrossRef]
  5. Stutte, G.W. Light-emitting diodes for manipulating the phytochrome apparatus. HortScience 2009, 44, 231–234. [Google Scholar] [CrossRef]
  6. Bourget, M.C. An introduction to light emitting diodes. HortScience 2008, 43, 1944–1946. [Google Scholar] [CrossRef]
  7. Morrow, R.C. LED lighting in horticulture. HortScience 2008, 43, 1947–1950. [Google Scholar] [CrossRef]
  8. Samouliene, G.; Sirtautas, R.; Brazaitytė, A.; Sakalauskaitė, J.; Sakalauskienė, S.; Duchovskis, P. The impact of red and blue light-emitting diode illumination on radish physiological indices. Open Life Sci. 2011, 6, 821–828. [Google Scholar] [CrossRef] [Green Version]
  9. Pfündel, E.; Baake, E. A quantitative description of fluorescence excitation spectra in intact bean leaves greened under intermittent light. Photosynth. Res. 1990, 26, 19–28. [Google Scholar]
  10. Whitelam, G.; Halliday, K. Light and Plant Development; Blackwell Publishing: Oxford, UK, 2007. [Google Scholar]
  11. Sæbø, A.; Krekling, T.; Appelgren, M. Light quality affects photosynthesis and leaf anatomy of birch plantlets in vitro. Plant Cell Tissue Organ. Cult. 1995, 41, 177–185. [Google Scholar] [CrossRef]
  12. Elsheikh, A.M.; Daffalla, H.M.; Khalfala, M.M. In vitro micropropagation of the ornamental plant Dieffenbachia: A review. Univers. J. Plant Sci. 2013, 1, 91–99. [Google Scholar]
  13. Heo, J.-W.; Lee, Y.-B.; Kim, D.-E.; Chang, Y.S.; Chun, C.-H. Effects of supplementary LED lighting on growth and biochemical parameters in Dieffenbachia amoena ‘Camella’ and Ficus elastica ‘Melany’. Korean J. Hortic. Sci. Technol. 2010, 1, 51–58. [Google Scholar]
  14. Baille, A.; González-Real, M.M.; López, J.C.; Cabrera, J.; Pérez-Parra, J. Characterization of the solar diffuse component under “Parral” plastic greenhouses. Acta Hortic. 2003, 614, 341–346. [Google Scholar] [CrossRef]
  15. Steiner, A. A universal method for preparing nutrient solution of a certain desired composition. Plant Soil 1961, 15, 134–154. [Google Scholar] [CrossRef]
  16. Ryser, P.; Lambers, H. Root and leaf attributes accounting for the performance of fast- and slow-growing grasses at different nutrient supply. Plant Soil 1995, 170, 251–265. [Google Scholar] [CrossRef]
  17. Ben Amor, N.; Ben Hamed, K.; Debez, A.; Grignon, C.; Abdelly, C. Physiological and antioxidant responses of the perennial halophyte Crithmum maritimum to salinity. Plant Sci. 2005, 168, 889–899. [Google Scholar] [CrossRef]
  18. Csáky, A.; Martínez-Grau, M.A. Técnicas Experimentales en Síntesis Orgánica; Síntesis: Madrid, Spain, 1998. [Google Scholar]
  19. Krom, M.D. Spectrophotometric determination of ammonia: Study of a modified Berthelot reaction using salicylate and dicholoroisocyanurate. Analyst 1980, 105, 305–316. [Google Scholar] [CrossRef]
  20. Hogue, E.; Wilcow, G.E.; Cantliffe, D.J. Effect of soil P on phosphate fraction in tomato leaves. J. Am. Soc. Hortic. Sci. 1970, 95, 174–176. [Google Scholar]
  21. Lachica, M.; Aguilar, A.; Yanez, J. Análisis foliar: Métodos utilizados en la estación experimental del Zaidín. Anal. Edafol. Agrobiol. 1973, 32, 1033–1047. [Google Scholar]
  22. Irigoyen, J.J.; Emerich, D.W.; Sánchez-Díaz, M. Water stress induced changes in concentrations of proline and total soluble sugars in nodulated alfalfa (Medicago sativa) plants. Physiol. Plant. 1992, 84, 55–60. [Google Scholar] [CrossRef]
  23. Tien, T.M.; Gaskin, M.H.; Hubbell, D.H. Plant growth substance produced by Azospirillum brasilense and their effect on the growth of pearl millet (Pennisetum americanun L.). App. Environ. Microbiol. 1979, 37, 219–226. [Google Scholar]
  24. Wellburn, A. The spectral determination of chlorophylls a and b, as well as total carotenoids, using various solvent with spectrophotometers of different resolution. J. Plant Physiol. 1994, 144, 307–313. [Google Scholar] [CrossRef]
  25. Whitmarsh, J.; Govindjee, J.A. The photosynthetic process. In Concepts in Photobiology: Photosynthesis and Photomorphogenesis; Singhal, G.S., Renger, G., Sopory, S.K., Irrgang, K.D., Eds.; Narosa Publishers: New Delhi, India; Kluwer Academic: Norwell, MA, USA, 1999; pp. 11–51. [Google Scholar]
  26. McNellis, T.W.; Deng, X.W. Light control of seedling morphogenetic pattern. Plant Cell 1995, 7, 1749–1761. [Google Scholar] [CrossRef]
  27. Randall, W.C.; Lopez, R.G. Comparison of supplemental lighting from high-pressure sodium lamps and light-emitting diodes during bedding plant seedling production. HortScience 2014, 49, 589–595. [Google Scholar] [CrossRef]
  28. Terfa, M.T.; Poudel, M.S.; Roro, A.G.; Gislerød, H.R.; Olsen, J.E.; Torre, S. Light emitting diodes with a high proportion of blue light affects external and internal quality parameters of pot roses differently than the traditional high-pressure sodium lamp. Acta Hortic. 2012, 956, 635–642. [Google Scholar] [CrossRef]
  29. Terfa, M.T.; Solhaug, K.A.; Gislerød, H.R.; Olsen, J.E.; Torre, S. A high proportion of blue light increases the photosynthesis capacity and leaf formation rate of Rosa hybrid but does not affect time to flower opening. Physiol. Plant. 2012, 148, 146–159. [Google Scholar] [CrossRef]
  30. Zheng, L.; Van Labeke, M.C. Chrysanthemum morphology, photosynthetic efficiency and antioxidant capacity are differentially modified by light quality. J. Plant Physiol. 2017, 213, 66–74. [Google Scholar] [CrossRef]
  31. Currey, C.J.; Lopez, R.G. Biomass accumulation and allocation, photosynthesis, and carbohydrate status of new Guinea impatiens, Geranium, and Petunia cuttings are affected by photosynthetic daily light integral during root development. J. Am. Soc. Hortic. Sci. 2015, 140, 542–549. [Google Scholar] [CrossRef]
  32. Wollaeger, H.M.; Runkle, E.S. Growth and acclimation of impatiens, salvia, petunia, and tomato seedlings to blue and red light. HortScience 2015, 50, 522–529. [Google Scholar] [CrossRef]
  33. Jimenez, S.; Plaza, B.M.; Contreras, J.I.; Segura, M.L.; Lao, M.T. Water consumption modelling in Dieffenbachia amoena ‘Tropic Snow’. Acta Hortic. 2007, 813, 685–690. [Google Scholar] [CrossRef]
  34. Inoue, S.I.; Kinoshita, T. Blue light regulation of stomatal opening and the plasma membrane H+-ATPase. Plant Physiol. 2017, 174, 531–538. [Google Scholar] [CrossRef] [PubMed]
  35. Mills, H.A.; Jones, J.J.B. Plant Analysis Handbook II; MicroMacro Publishing, Inc.: Athens, GA, USA, 1996; p. 422. [Google Scholar]
  36. Segura, M.L.; Rodríguez, J.M.; Jiménez, S.; López, J.; Carrasco, I. Dieffenbachia growth responses and N leaching from container-grown plants fertilized by several methods. Acta Hortic. 2004, 697, 387–391. [Google Scholar] [CrossRef]
  37. Evans, C.A.; Miller, E.K.; Friedland, A.J. Effect of nitrogen and light on nutrient concentrations and associated physiological responses in birch and fir seedlings. Plant Soil 2001, 236, 197–207. [Google Scholar] [CrossRef]
  38. Kopsell, D.A.; Sams, C.E. Increases in shoot tissue pigments, glucosinolates, and mineral elements in sprouting broccoli after exposure to short-duration blue light from light emitting diodes. J. Am. Soc. Hortic. Sci. 2013, 138, 31–37. [Google Scholar] [CrossRef]
  39. Sakuraba, Y.; Yanagisawa, S. Light signalling-induced regulation of nutrient acquisition and utilisation in plants. Semin. Cell Dev. Biol. 2018, 83, 123–132. [Google Scholar] [CrossRef]
  40. Fallovo, C.; Colla, G.; Schreiner, M.; Krumbein, A.; Schwarz, D. Effect of nitrogen form and radiation on growth and mineral concentration of two Brassica species. Sci. Hortic. 2009, 123, 170–177. [Google Scholar] [CrossRef]
  41. Almansa, E.M.; Espín, A.; Chica, R.M.; Lao, M.T. Nutritional response of seedling tomato plants under different lighting treatments. J. Plant Nutr. 2017, 40, 467–475. [Google Scholar] [CrossRef]
  42. Azuara, M.P.; Aparicio, P.J. Spectral dependence of photoregulation of inorganic nitrogen metabolism in Chlamydomonas reinhardtii. Plant Physiol. 1985, 77, 95–98. [Google Scholar] [CrossRef]
  43. Babourina, O.; Newman, I.; Shabala, S. Blue light-induced kinetics of H+ and Ca2+ fluxes in etiolated wild-type and phototropin mutant Arabidopsis seedlings. PNAS 2002, 99, 2433–2438. [Google Scholar] [CrossRef]
  44. Ben Rejeb, K.; Abdelly, C.; Savouré, A. How reactive oxygen species and proline face stress together. Plant Physiol. Biochem. 2014, 80, 278–284. [Google Scholar] [CrossRef]
  45. Zheng, L.; Van Labeke, M.C. Long-term effects of red-and blue-light emitting diodes on leaf anatomy and photosynthetic efficiency of three ornamental pot plants. Front. Plant Sci. 2017, 8, 917. [Google Scholar] [CrossRef]
  46. Almansa, E.M.; Espín, A.; Chica, R.M.; Lao, M. T Changes in endogenous auxin concentration in cultivars of tomato seedlings under artificial light. HortScience 2011, 46, 698–704. [Google Scholar] [CrossRef]
  47. Fukuda, N.; Yoshida, T.; Senaha, C.; Olsen, J.E.; Jikumaru, Y.; Kamiya, Y. Short main shoot length and inhibition of floral bud development under red light can be recovered by application of gibberellin and cytokinin. Acta Hortic. 2012, 956, 215–222. [Google Scholar] [CrossRef]
  48. Behringer, F.J.; Davies, P.J. Indole-3-acetic acid levels after phytochrome-mediated changes in the stem elongation rate of dark-and light-grown Pisum seedlings. Planta 1992, 188, 85–92. [Google Scholar] [CrossRef]
  49. Kurepin, L.V.; Emery, R.J.N.; Pharis, R.P.; Reid, D.M. Uncoupling light quality from light irradiance effects in Helianthus annuus shoots: Putative roles for plant hormones in leaf and internode growth. J. Exp. Bot. 2007, 58, 2145–2157. [Google Scholar] [CrossRef]
  50. Halliday, K.J.; Martinez-Garcia, J.F.; Josse, E.M. Integration of light and auxin signaling. Cold Spring Harb. Perspect. Biol. 2009, 1, a001586. [Google Scholar] [CrossRef] [PubMed]
  51. Kowallik, W. Blue light effect on carbohydrate and protein metabolism. In Blue Light Responses: Phenomena and Occurrence in Plants and Microorganisms; Senger, H., Ed.; CRC Press: Boca Raton, FL, USA, 1987; Volume II, pp. 7–16. [Google Scholar]
  52. Bondada, B.R.; Syvertsen, J.P. Leaf chlorophyll, net gas exchange and chloroplast ultrastructure in citrus leaves of different nitrogen status. Tree Physiol. 2003, 23, 553–559. [Google Scholar] [CrossRef] [Green Version]
  53. Li, H.; Tang, C.; Xu, Z. The effects of different light qualities on rapeseed (Brassica napus L. ) plantlet growth and morphogenesis in vitro. Sci. Hortic. 2013, 150, 117–124. [Google Scholar]
  54. Taiz, L.; Zeiger, E. Plant Physiology, 3rd ed.; Sinauer Associates: Sunderland, MA, USA, 2002; p. 690. [Google Scholar]
  55. Randall, W.C.; Lopez, R.G. Comparison of bedding plant seedlings grown under sole-source light-emitting diodes (LEDs) and greenhouse supplemental lighting from LEDs and high-pressure sodium lamps. HortScience 2015, 50, 705–713. [Google Scholar] [CrossRef]
  56. Bergstrand, K.J.; Mortensen, L.M.; Suthaparan, A.; Gislerød, H.R. Acclimatisation of greenhouse crops to differing light quality. Sci Hortic. 2016, 204, 1–7. [Google Scholar] [CrossRef]
  57. Gitelson, A.A.; Gritz, Y.; Merzlyak, M.N. Relationships between leaf chlorophyll content and spectral reflectance and algorithms for non-destructive chlorophyll assessment in higher plant leaves. J. Plant Physiol. 2003, 160, 271–282. [Google Scholar] [CrossRef] [PubMed]
  58. Paradiso, R.; Meinen, E.; Snel, J.F.; De Visser, P.; Van Ieperen, W.; Hogewoning, S.W.; Marcelis, L.F. Spectral dependence of photosynthesis and light absorptance in single leaves and canopy in rose. Sci. Hortic. 2011, 127, 548–554. [Google Scholar] [CrossRef]
  59. Young, A.J.; Pallett, K.E. Carotenoids. In Antioxidants in Higher Plants; CRC Press: Boca Raton, FL, USA, 2017; pp. 59–89. [Google Scholar]
  60. Pinheiro, C.; Chaves, M.M. Photosynthesis and drought: Can we make metabolic connections from available data? J. Exp. Bot. 2010, 62, 869–882. [Google Scholar] [CrossRef] [PubMed]
Figure 1. Spectral distribution of the different light treatments according to the methodology proposed by Baille et al. [14].
Sustainability 11 02867 g001
Figure 2. Percentage of energy absorbed (Ka) by pigments (car, Chl a, and Chl b) according to each wavelength.
Sustainability 11 02867 g002
Figure 3. Theoretical irradiance energy absorbed by pigments (Ia) (chlorophyll a and b and carotenoids) in light treatments.
Sustainability 11 02867 g003
Figure 4. Use of spectral energy by each pigment of the crop (USEcrop) (chlorophyll a and b and carotenoids) in light treatments.
Sustainability 11 02867 g004
Figure 5. Linear univariant regression model IUSE and PAR with TDW in D. maculata plants under the different light treatments.
Sustainability 11 02867 g005
Table 1. Spectral distribution of light treatments supplied in Dieffenbachia maculata plants.
Irradiance (W·m−2 and µmol·m−2·s−1)
Spectral Region (nm)T1T2T3
UV (300–400)0.18/0.490.09/0.250.41/1.22
B (400–500)6.68/25.405.74/22.114.41/16.78
R (600–700)7.57/39.325.75/30.028.67/44.99
FR (700–800)0.64/3.810.33/1.940.90/5.45
PAR (400–700)24.50/112.3816.92/77.3721.54/101.22
NIR (700–1100)0.92/6.090.46/3.061.60/10.56
TOTAL (300–1100)25.38/118.9617.35/80.6823.38/113.00
PAR:TOTAL0.97/0.940.97/0.960.92/0.90
PAR:NIR26.58/18.4536.49/25.2513.45/9.58
B:R0.88/0.651.00/0.740.51/0.37
B:FR10.45/6.6617.62/11.394.87/3.08
R:FR11.84/10.3117.65/15.469.58/8.25
UV = ultraviolet, B = blue, G = green, R = red, FR = far red, PAR = photosynthetically active radiation, NIR = near infrared.
Table 2. Influence of light treatments on root (RDW), stem (SDW), leaf (LDW), and total plant dry weight (TDW); relative root weight ratio (RWR); stem weight ratio (SWR); leaf weight ratio (LWR); and water content in roots (WCr), stems (WCs), and leaves (WCl) in D. maculata plants grown in 1.5-L containers. Treatments consisted of a fluorescent TLD 18 W (T1), fluorescent TLD 18 W + BR-LEDs RGB (T2), and high-efficiency fluorescent TL5 35 W (T3). Values with the same letters are not significantly different at p < 0.05 (ANOVA and least significant difference (LSD) test). ns: not significant. Data are the means ± standard deviation of five plants per treatment.
Growth ParametersLight Treatments
T1T2T3
RDW (g)0.90 ± 0.06 b1.14 ± 0.07 a0.86 ± 0.06 b
SDW (g)1.54 ± 0.08 a1.30 ± 0.07 b1.33 ± 0.07 b
LDW (g)2.61 ± 0.14 b2.05 ± 0.12 c3.03 ± 0.17 a
TDW (g)5.04 ± 0.25 a4.49 ± 0.20 b5.22 ± 0.23 a
RWR (-)0.18 ± 0.01 a0.25 ± 0.02 b0.16 ± 0.02 b
SWR (-)0.31 ± 0.02 a0.29 ± 0.01 b0.25 ± 0.01 c
LWR (-)0.52 ± 0.02 b0.46 ± 0.02 c0.58 ± 0.02 a
WCr (-)0.94 ± 0.01 a0.94 ± 0.01 a0.95 ± 0.01 a
WCs (-)0.92 ± 0.01 a0.92 ± 0.01 a0.93 ± 0.01 a
WCl (-)0.84 ± 0.01 a0.84 ± 0.01 a0.85 ± 0.01 a
Table 3. Mineral composition (expressed in mg·g−1·DW) in roots (R), stems (S), and leaves (L) of D. maculata plants grown in 1.5-L containers. Treatments consisted of a fluorescent TLD 18 W (T1), fluorescent TLD 18 W + BR-LEDs RGB (T2), and high-efficiency fluorescent TL5 35 W (T3). Values with the same letters are not significantly different at p < 0.05 (ANOVA and LSD test). ns: not significant. Data are the means ± standard deviation of five plants per treatment.
Light Treatments
T1T2T3
NR17.07 ± 1.66 a18.31 ± 1.78 a16.92 ± 1.58 a
S20.22 ± 1.96 a14.99 ± 1.44 b15.49 ± 1.51 b
L19.30 ± 1.81 a16.25 ± 1.66 b16.01 ± 1.57 b
PR1.83 ± 0.16 a1.72 ± 0.16 a1.68 ± 0.17 a
S2.43 ± 0.21 a2.33 ± 0.20 a2.30 ± 0.20 a
L2.78 ± 0.26 a2.60 ± 0.24 a2.56 ± 0.26 a
KR37.76 ± 3.63 a25.34 ± 2.46 b24.75 ± 2.37 b
S49.97 ± 4.82 a51.42 ± 4.97 a48.79 ± 4.72 a
L54.17 ± 5.32 a43.35 ± 4.28 b43.17 ± 4.40 b
Table 4. Influence of light treatments on proline, total soluble sugars (TSS), starch, and indole 3-acetic acid (IAA) concentrations in leaves of D. maculata plants grown in 1.5-L containers. Treatments consisted of a fluorescent TLD 18 W (T1), fluorescent TLD 18 W + BR-LEDs RGB (T2), and high-efficiency fluorescent TL5 35 W (T3). Values with the same letters are not significantly different at p < 0.05 (ANOVA and LSD test). ns: not significant. Data are the means ± standard deviation of five plants per treatment.
Physiological ParametersLight Treatments
T1T2T3
Proline (µg·g−1·FW)194.59 ± 18.53 a138.27 ± 12.79 b135.96 ± 12.53 b
TSS (mg·g1·FW)3.99 ± 0.32 c5.26 ± 0.45 b8.16 ± 0.75 a
Starch (mg·g−1·FW)6.02 ± 0.51 c7.67 ± 0.75 b10.62 ± 1.01 a
IAA (mg·g−1·FW)4.11 ± 0.33 a3.09 ± 0.25 b2.45 ± 0.23 c
Table 5. Influence of light treatments on chlorophyll (Chl a, b, and a + b) and carotenoid concentration in leaves of D. maculata plants grown in 1.5-L containers. Treatments consisted of a fluorescent TLD 18 W (T1), fluorescent TLD 18 W + BR-LEDs RGB (T2), and high-efficiency fluorescent TL5 35 W (T3). Values with the same letters are not significantly different at p < 0.05 (ANOVA and LSD test). ns: not significant. Data are the means ± standard deviation of five plants per treatment.
ParameterLight Treatments
T1T2T3
Chl a (mg·g−1·FW)0.85 ± 0.08 b1.07 ± 0.04 a1.01 ± 0.03 a
Chl b (mg·g−1·FW)0.31 ± 0.03 b0.48 ± 0.03 a0.45 ± 0.03 a
Chl (a + b) (mg·g−1·FW)1.16 ± 0.15 b1.55 ± 0.10 a1.46 ± 0.10 a
Car (mg·g−1·FW)0.14 ± 0.01 a± 0.01 a0.13 ± 0.01 a
Table 6. Use of spectral energy by each pigment (USEpigment) (chlorophyll a and b and carotenoids) (expressed in W m−2) in each light treatment. Values with the same letters are not significantly different at p < 0.05 (ANOVA and LSD test). ns: not significant. Data are the means ± standard deviation of five plants per treatment.
USEChlaUSEChlbUSECar
T13.10 ± 0.38 b1.46 ± 0.21 b0.54 ± 0.16 a
T22.75 ± 0.28 b2.49 ± 0.29 a0.72 ± 0.18 a
T35.04 ± 0.67 a2.52 ± 0.28 a0.62 ± 0.13 a

