Article

Numerical Modeling of the Shape of Agricultural Products on the Example of Cucumber Fruits

Department of Heavy Duty Machines and Research Methodology, University of Warmia and Mazury in Olsztyn, Olsztyn 10-957, Poland
*
Author to whom correspondence should be addressed.
Sustainability 2019, 11(10), 2798; https://doi.org/10.3390/su11102798
Submission received: 24 April 2019 / Revised: 11 May 2019 / Accepted: 14 May 2019 / Published: 16 May 2019
(This article belongs to the Special Issue Sustainable Production in Food and Agriculture Engineering)

Abstract

:
The aim of the study was to build numerical models of cucumbers cv. Śremski with the use of a 3D scanner and to analyze selected geometric parameters of cucumber fruits based on the developed models. The basic dimensions of cucumber fruits–length, width and thickness—were measured with an electronic caliper with an accuracy of d = 0.01 mm, and the surface area and volume of fruits were determined by 3D scanning. Cucumber fruits were scanned with an accuracy of d = 0.13 mm. Six models approximating the shape of cucumber fruits were developed with the use of six geometric figures and their combinations to calculate the surface area and volume of the analyzed agricultural products were identified. The surface area and volume of cucumber fruits calculated by 3D scanning and mathematical formulas were compared. The surface area calculated with the model combining two truncated cones and two hemispheres with different diameters, joined base-to-base, was characterized by the smallest relative error of 3%. Fruit volume should be determined with the use of mathematical formulas derived for a model composed of an ellipsoid and a spheroid. The proposed geometric models can be used in research and design.

1. Introduction

Advanced measurement techniques and software supporting complex simulations of selected technological processes are required to introduce new products and technologies on the market and to improve product quality. Models of agricultural products should account for the designed technological processes and should accurately reflect the products’ shape [1]. A 3D model that accurately describes a product’s geometric and physical parameters can be used in the design process. A traditional approach to modeling relies on the assumption that agri-food products are homogeneous and isotropic, and the modeled objects are assigned regular shapes (e.g., cylinder, sphere, cone, etc.) Computer-Aided Design (CAD) and Computational Fluid Dynamics (CFD) software can be applied to simulate complex processes that occur during the processing of agri-food products [2]. The development of a model that closely approximates the shape of the original agricultural product and can be used in computer simulations poses the key challenge in the research and design of food processing equipment. Numerical modeling based on traditional methods is a laborious and difficult task, in particular when the studied objects have irregular shape [3]. In the process of measuring fruits and seeds, many researchers rely solely on image analysis tools and measuring devices such as calipers and micrometers [4,5]. In the literature, traditional methods have been used to determine the geometric parameters of soybeans (Glycine max L. Merr.) [6], sunflower seeds (Helianthus annuus L.) [7], oilseed rape seeds (Brassica napus L.) [8,9], mustard seeds (Sinapis alba) [10] and flax seeds (Linnum usitatissimum L.) [11]. In small objects such as seeds, only basic dimensions can be measured with a caliper or a micrometer. In larger products such as fruits and vegetables, the analyzed parameters can be measured with a caliper or a micrometer at any point on the object’s surface.
In the literature, traditional and advanced measuring techniques have been deployed to accurately render the shape of the analyzed products. Erdogdu et al. [12] relied on a machine vision system designed by Luzuriaga et al. [13] to determine the geometric parameters of shrimp cross-sections and to develop mathematical models of the thermal processing of shrimp. Crocombe et al. [14] analyzed the surface of meat pieces by laser scanning to develop a numerical model and simulate meat refrigeration time. Jancsok et al. [15] used a machine vision system to build numerical models of pears cv. Konferencja. Borsa et al. [16] performed computed tomography scans and calculated the radiation dose absorbed by the examined food products. Sabliov et al. [17] proposed an image analysis method for measuring the volume and surface area of axially symmetric agricultural products. Zapotoczny [18] developed a test stand for measuring the geometric parameters of cucumber fruits with the use of digital image analysis. The cited author registered changes in the shape and size of greenhouse-grown cucumbers during storage. Scheerlinck et al. [19] relied on a machine vision system to develop a 3D model of strawberries and a thermal system for disinfecting fruit surfaces. Du and Sun [20] and Zheng et al. [21] developed an image analysis technique for measuring the surface area and volume of beef loin and beef joints. Kim et al. [22] generated 3D geometric models of food products with a complex shape with the use of computed tomography. Goni et al. [23] modeled the geometric properties of the studied objects with the involvement of magnetic resonance imaging. Siripon et al. [24] analyzed chicken half-carcasses with a 3D scanner (Atos, GOM, Germany) and used the results to simulate cooking processes. Mieszkalski [25,26] developed computer models of carrots, apples cv. Jonagored and chicken eggs. The shape of biological objects was described with Bézier curves. The resulting mathematical models were used to generate 3D figures that accurately rendered the shape and basic dimensions of the studied products. Balcerzak et al. [27] modeled the geometric parameters of corn and oat kernels in the 3ds Max environment. Images of kernel cross-sections were used to acquire geometric data, generate meshes and determine nodal coordinates. Ho Q. T. and others used multiscale modeling in food engineering. Multiscale models support evaluations of the phenomena occurring inside agricultural raw materials on a micro and macro scale. The authors relied on X-ray tomography to generate multiscale models [28]. The volume of agricultural raw materials can also be determined by water displacement. However, this method cannot be applied to materials that easily absorb water [29].
The majority of methods require complex and expensive measuring devices and software. A thorough knowledge of various imaging techniques is required to model irregularly shaped objects. Models that accurately render the shape of the analyzed products can be developed with the use of a 3D scanner. This technique is considerably simpler, but it is not yet widely used. 3D models can be used to analyze the shape of whole products or their fragments [30,31].
The dimensions and basic geographic parameters of agricultural materials have been long determined with the use of simple measuring devices, including analog and digital calipers, micrometers and dial indicators. The main limitation of conventional measuring techniques is that they investigate only characteristic points in the examined objects, and the measured values can be used to calculate selected parameters, such as surface area and volume, with mathematical formulas [29]. In contrast, indirect methods rely on the acquisition of images of the investigated object and digital image analysis. The advances made in digital technology and computing power have contributed to the widespread popularity of indirect measuring methods. Indirect measurements produce linear dimensions as well as images of the analyzed surfaces. The main advantage of indirect methods is that measurements are rapid, whereas the main limitation stems from the fact that measurements are performed along the contours of the acquired image, which are projected onto a plane [9]. A relatively new method has been proposed for registering the shape of a sample as a cloud of points. The location of every point in the modeled sample is determined with the use of 3D scanners, which register the position of the laser beam, a structured light source. The points registered by a 3D scanner support the development of a numerical model, which can be used in metrological analyses. The development of a numerical model with the described method is time-consuming, but the results can be stored in computer memory [32,33].
The presented methods for measuring the geometric properties of objects produce highly similar results, provided that the required precision thresholds are met. However, the time and conditions of measurement can vary. Approximation formulas are widely applied to calculate volume and area. The main problem is the selection of the optimal model for determining the above parameters with the required accuracy. The aim of this study was to compare selected geometric parameters of cucumber fruits acquired from 3D models and models based on basic geometric figures and direct caliper measurements.

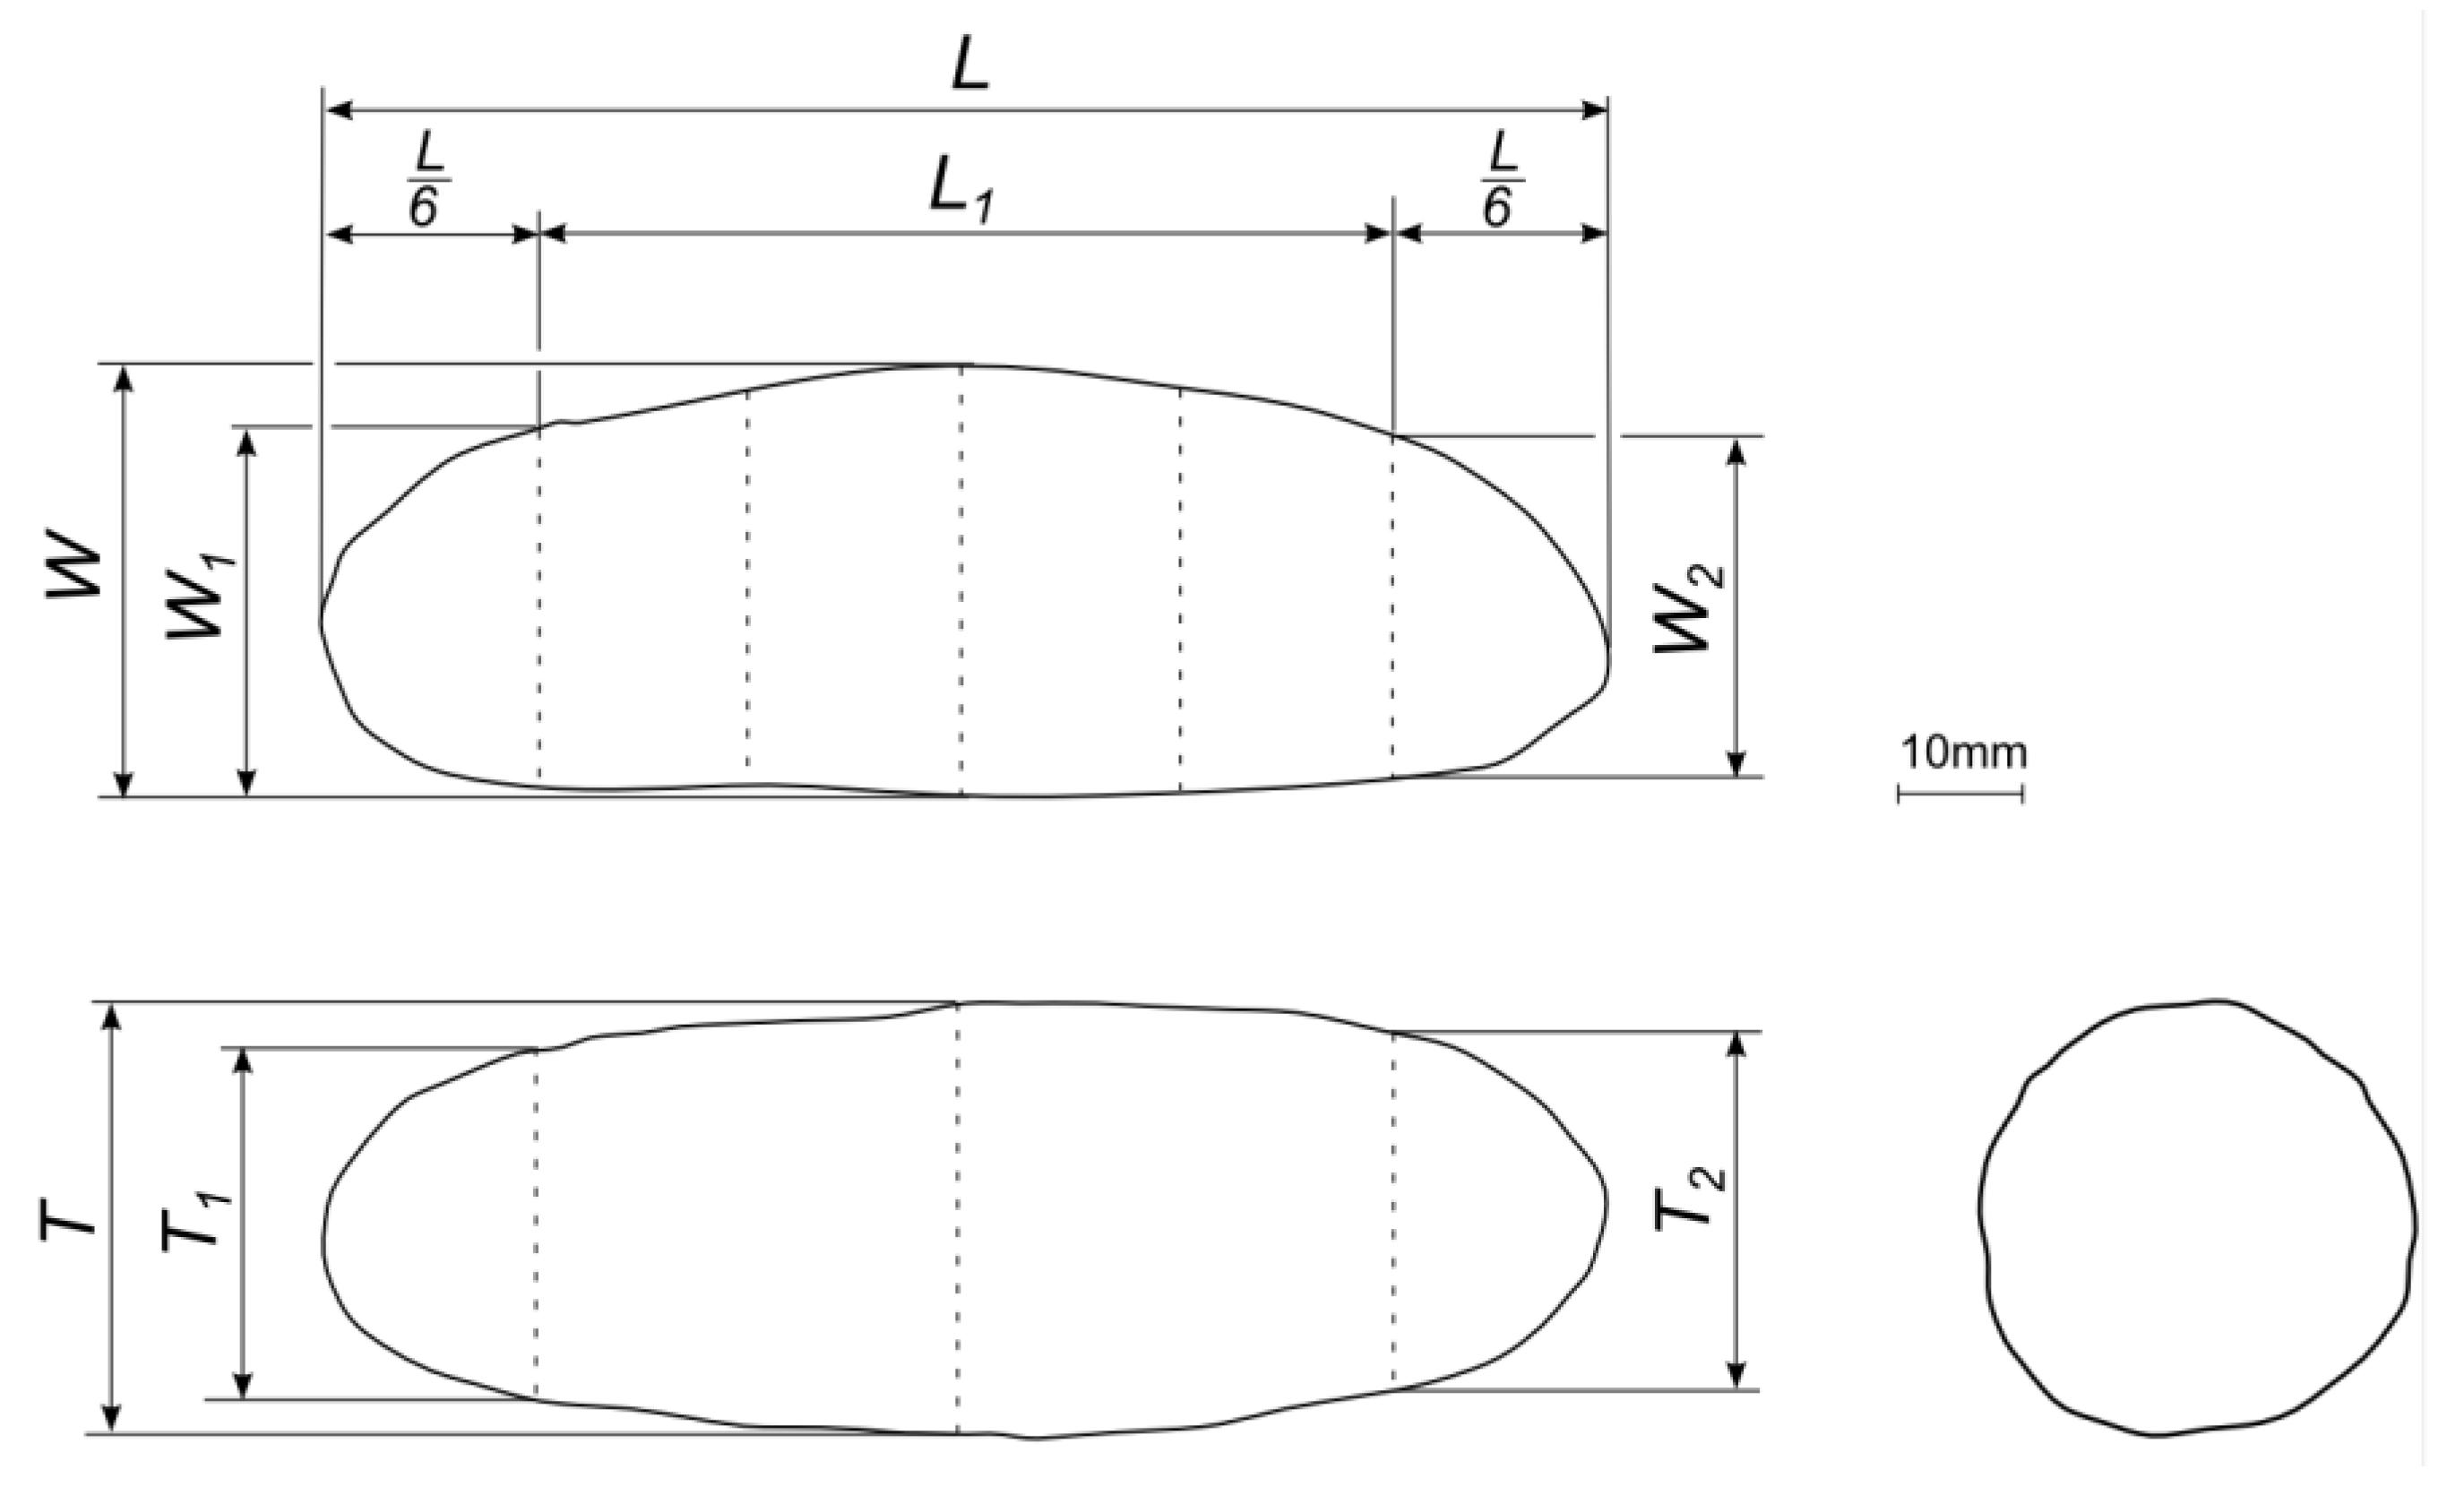
2. Materials and Methods
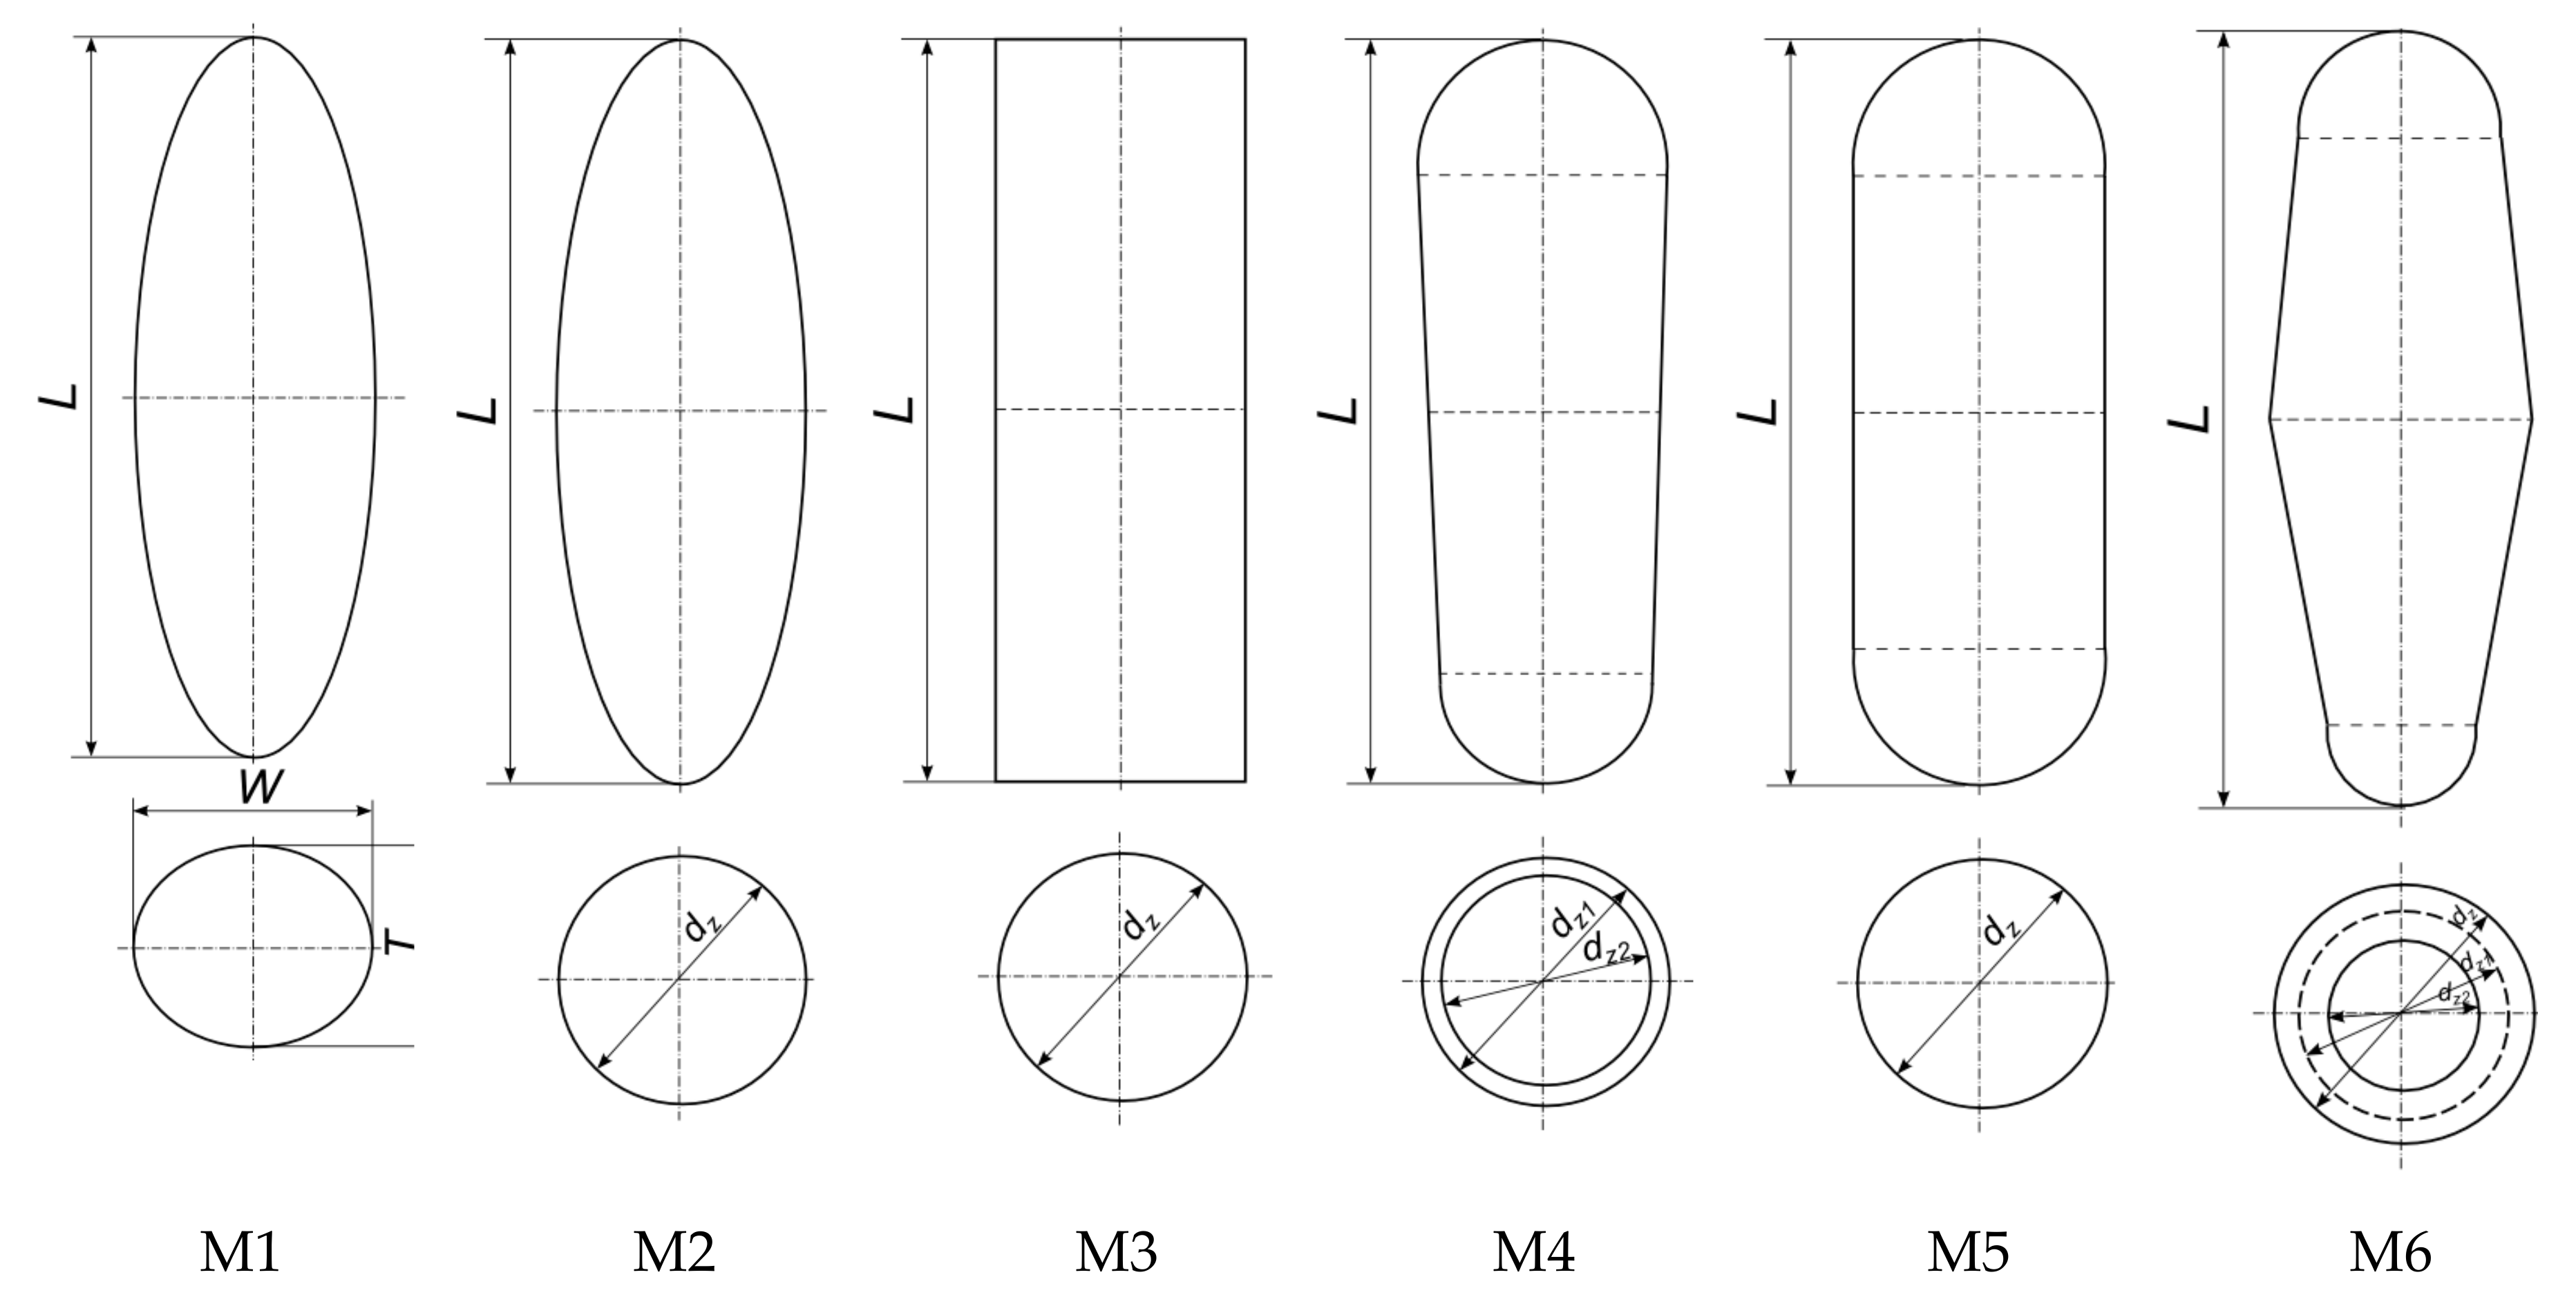
The experiment was performed on cucumber fruits cv. Śremski stored indoors at a constant temperature of 18.1 °C and 60% humidity. Cucumbers were purchased from the Pozorty Production and Experimental Station in Olsztyn. Fifty whole cucumber fruits without visible signs of damage were randomly selected for the experiment. Cucumbers were purchased on five occasions in the second half of August 2018, and 10 cucumbers were purchased each time. The length, width and thickness of cucumber fruits were measured with an electronic caliper with an accuracy of d = 0.01 mm. Each fruit was additionally measured with an electronic caliper at the points presented in Figure 1. Cucumbers were scanned with the Nextengine 3D scanner with a resolution of 15 points per mm2. Scanning precision was 0.13 mm. Cucumbers were mounted on a turntable. Individual images were combined in the ScanStudio HD PRO program [34]. The developed numerical models were used to determine the surface area and volume of cucumber fruits. The above parameters were measured in the MeshLab program [35].
The measured dimensions were used to build six geometric models whose shape resembled the shape of cucumber fruits. The surface area and volume of fruits were calculated from the developed models. Geometric models were built based on basic geometric figures, including an ellipsoid, cylinder, hemisphere, truncated cone and a combination of selected figures. The analyzed geometric models are presented in Figure 2.
Mathematical formulas were derived for every geometric model and were used to calculate the surface area and volume of cucumbers [36,37]:
  • ellipsoid model (M1):
    A M 1 = 2 π ( ( L 2 ) 2 + T 2 ( L 2 ) 2 ( W 2 ) 2 ( L 2 ) 2 F ( Θ , m ) + T 2 ( W 2 ) 2 ( L 2 ) 2 E ( Θ , m ) )
    where:
    m = ( L 2 ) 2 ( ( T 2 ) 2 ( L 2 ) 2 ) ( T 2 ) 2 ( ( W 2 ) 2 ( L 2 ) 2 ) = L 2 T 2 L 4 T 2 W 2 L 2 T 2
    Θ = arcsin ( W 2 L 2 | W | )
    and where F(Θ,m) and E(Θ,m) are incomplete elliptic integrals of the first and second kind [37].
    V M 1 = π T W L 6
  • spheroid model (M2), when: L 2 > d z 2 , then:
    A M 2 = 2 π ( d z 2 ) 2 ( 1 + L 2 d z 2 e arcsin ( e ) ) = 4 π d z 2 + π L d z e arcsin ( e ) 8
    where:
    e = 1 d z 2 L 2 16
    V M 2 = π d z 2 L 6
    cylinder model (M3):
    A M 3 = π d z L + 2 π ( d z 2 ) 2
    V M 3 = π d z 2 L 4
  • model combining a truncated cone and two hemispheres (M4)
    A M 4 = π 2 ( d z 1 2 + d z 2 2 ) + π ( d z 1 2 ) 2 + L 1 2 ( d z 1 2 + d z 2 2 )
    V M 4 = π 12 ( d z 1 3 + d z 2 3 + L 1 ( d z 1 2 + d z 1 d z 2 + d z 2 2 ) )
  • model combining a cylinder and two hemispheres (M5)
    A M 5 = π d w ( d w 2 + d w 2 + L 1 )
    V M 5 = π d w 2 ( d w 6 + L 1 4 )
  • model combining two truncated cones and two hemispheres (M6)
    A M 6 = ( π d z 1 + π d z ) d z 1 2 + L 1 2 + 2 π d z 1 2 + ( π d z 2 + π d z ) d z 2 2 + L 1 2 + 2 π d z 2 2 4
    V M 6 = 2 π d z 2 3 + π L 1 d z 2 2 + π L 1 d z d z 2 + 2 π d z 1 3 + π L 1 d z 1 2 + π L 1 d z d z 1 + 2 π L 1 d z 2 24
In models M2, M3, M4, M5 and M6, geometric mean diameter was calculated with the following formulas:
d w = W 1 + W 2 + T 1 + T 2 4
d z = W + T 2
d z 1 = W 1 + T 1 2
d z 2 = W 2 + T 2 2
every cucumber fruit was weighed on the Radwag WAA 100/C/2 electronic scale to the nearest 0.001 g. The significance of differences between the mean values of the measured parameters was determined in the Kruskal-Wallis test with multiple comparisons of mean ranks. The aim of the analysis was to identify homogeneous groups. The results were processed statistically in the Statistica 13.3 PL program at a significance level of α = 0.05.

3. Results and Discussion

Cucumber fruits (Cucumis sativus L.) cv. Śremski are botanical berries with a more or less elongated shape, varied size, smooth or spiny skin. Cucumbers are filled with seeds, and their color ranges from dark green to yellow. At harvest maturity, cucumbers are cylindrical in shape, without a neck, with a gently tapering end at the flower base and a small seed chamber. The smallest of the examined cucumbers weighed 43.05 g, and the largest123.70 g. The surface area of cucumbers determined in the 3D scanner ranged from 74.84 cm2 do 145.38 cm2, with an average of 111.25 cm2. Based on the generated 3D images, the volume of cucumbers was determined in the range of 46.65 cm3 to 127.38 cm3, with an average of 77.26 cm3 (Table 1). Exemplary 3D models of cucumber fruits are presented in Figure 3 and Figure 4.
The mean dimensions, surface area and volume of the analyzed cucumber fruits are presented in Table 1.
The significance of differences between the mean surface area and mean volume of cucumbers was determined in the Kruskal-Wallis nonparametric test. The significance of differences between the parameters acquired by 3D scanning and the parameters calculated with mathematical formulas is presented in Table 2 and Table 3. The mean surface area of cucumber fruits calculated from the 3D model did not differ significantly from the mean surface area calculated from the spheroid model (M2—formula 5) and the model combining two truncated cones and two hemispheres with different diameters (M6—formula 14).
The mean volume of cucumber fruits calculated from the 3D model did not differ significantly from the mean volume calculated from the ellipsoid model (M1—formula 4), spheroid model (M2—formula 7) and the geometric model combining two truncated cones and two hemispheres with different diameters (M6—formula 15).
The distribution of surface area values computed from the 3D model and the proposed geometric models is presented in Figure 5. The distribution of volume values computed from the same models is presented in Figure 6.
If we assume that fruit dimensions acquired from 3D scans are burdened by a small error, these parameters can be used as a reference to compare the results of caliper measurements and to describe the shape of cucumber fruits with selected geometric figures. The relative error between the values acquired from 3D scans and direct measurements was regarded as the error of the method. The data presented in Figure 7 indicate that the error in direct measurements of cucumber surface area was smallest for the model combining two truncated cones and two hemispheres with different diameters (M6) where it did not exceed 3%. The error was estimated at 5% when model M2 and formula 4 were used. The data presented in Figure 8 indicate that the error in direct measurements of cucumber volume was smallest for the ellipsoid model (M1), the spheroid model (M2), and the model combining two truncated cones and two hemispheres with different diameters (M6). The error did not exceed 6% when ellipsoids were used, and it was estimated at 6% when model M6 was used.
The results of this study were compared with the findings of other authors. Zapotoczny (2002) investigated the geometrical parameters of greenhouse-grown cucumbers under laboratory conditions with the use of image analysis methods. The cited author analyzed 2D images of 27 greenhouse-grown cucumbers and determined their average length at 163.17 mm, average width at 32.00 mm, and average projected area at 51.20 cm2. The multiscale modeling approach deployed by Ho et al. (2013) supports the description of the phenomena occurring inside agricultural raw materials. Multiscale models consist of interconnected sub-models that describe the behavior of raw material in different spatial scales. This approach supports the prediction of processes and phenomena occurring inside raw materials. However, multiscale modeling is relatively complex, and not widely used. Rahmi and Ferruh (2009) described the applicability of 3D models for processing agricultural raw materials and for food production. The presented models were generated based on 3D scans of selected materials, including chicken egg, pear fruit, strawberry fruit, banana and apple. The authors modeled the cooling process in pear fruit and compared the results with experimental findings. Cucumber fruits have never been analyzed in studies on modeling and determination of geometrical parameters of agricultural raw materials.

4. Conclusions

  • Geometric models and direct measurements of the geometric parameters of agricultural products facilitate the planning of spraying, sorting and packaging operations. These methods enable small-scale farmers to easily determine the geometric parameters (volume, surface area) of raw materials without the use of expensive and sophisticated devices such as 3D scanners. Direct measurements of the geometric parameters of agricultural raw materials are consistent with sustainable development principles and can be applied on a large scale.
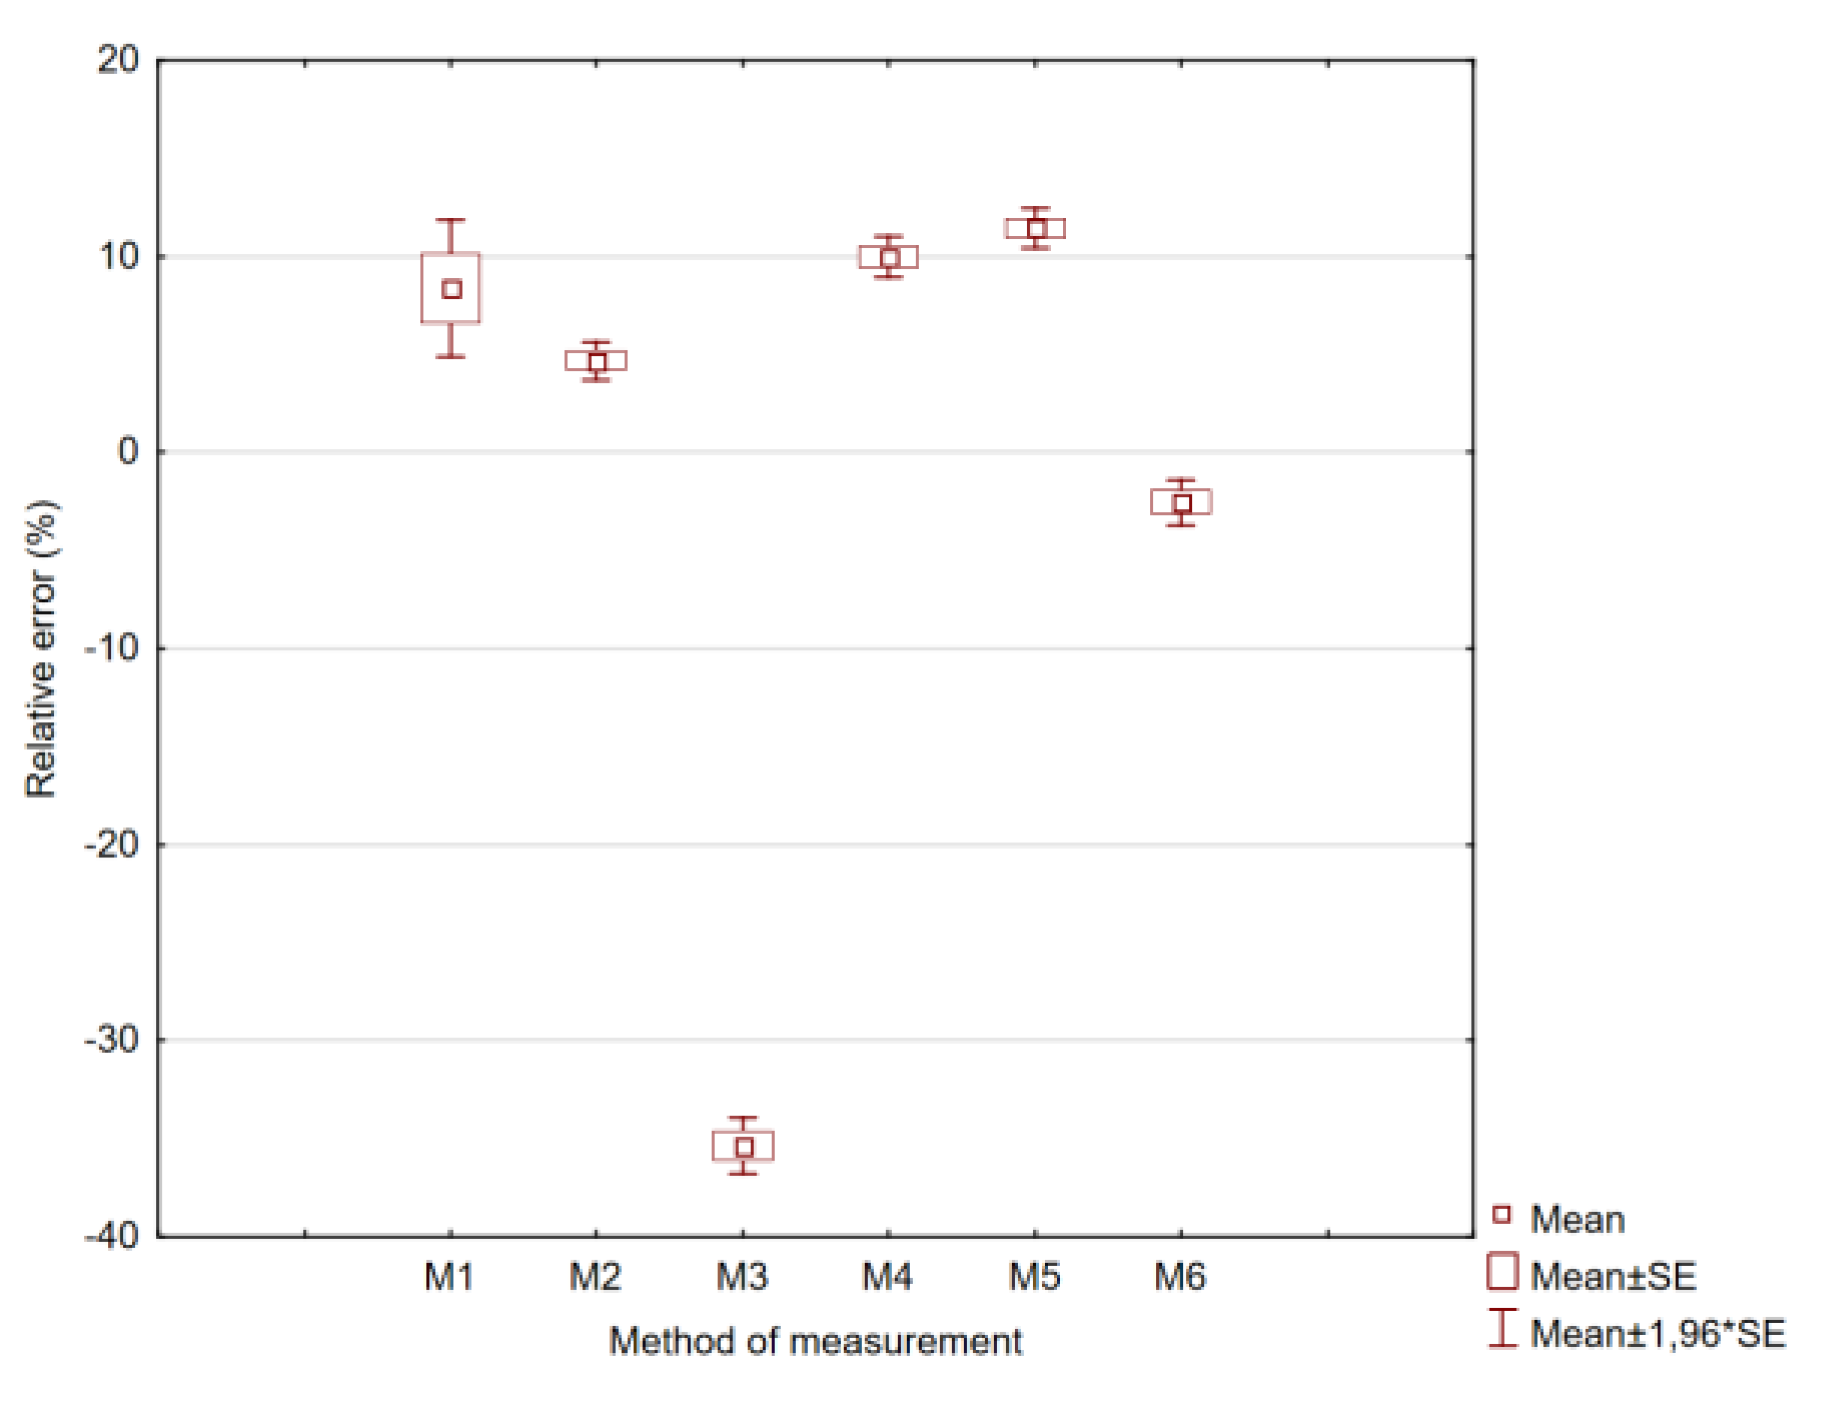
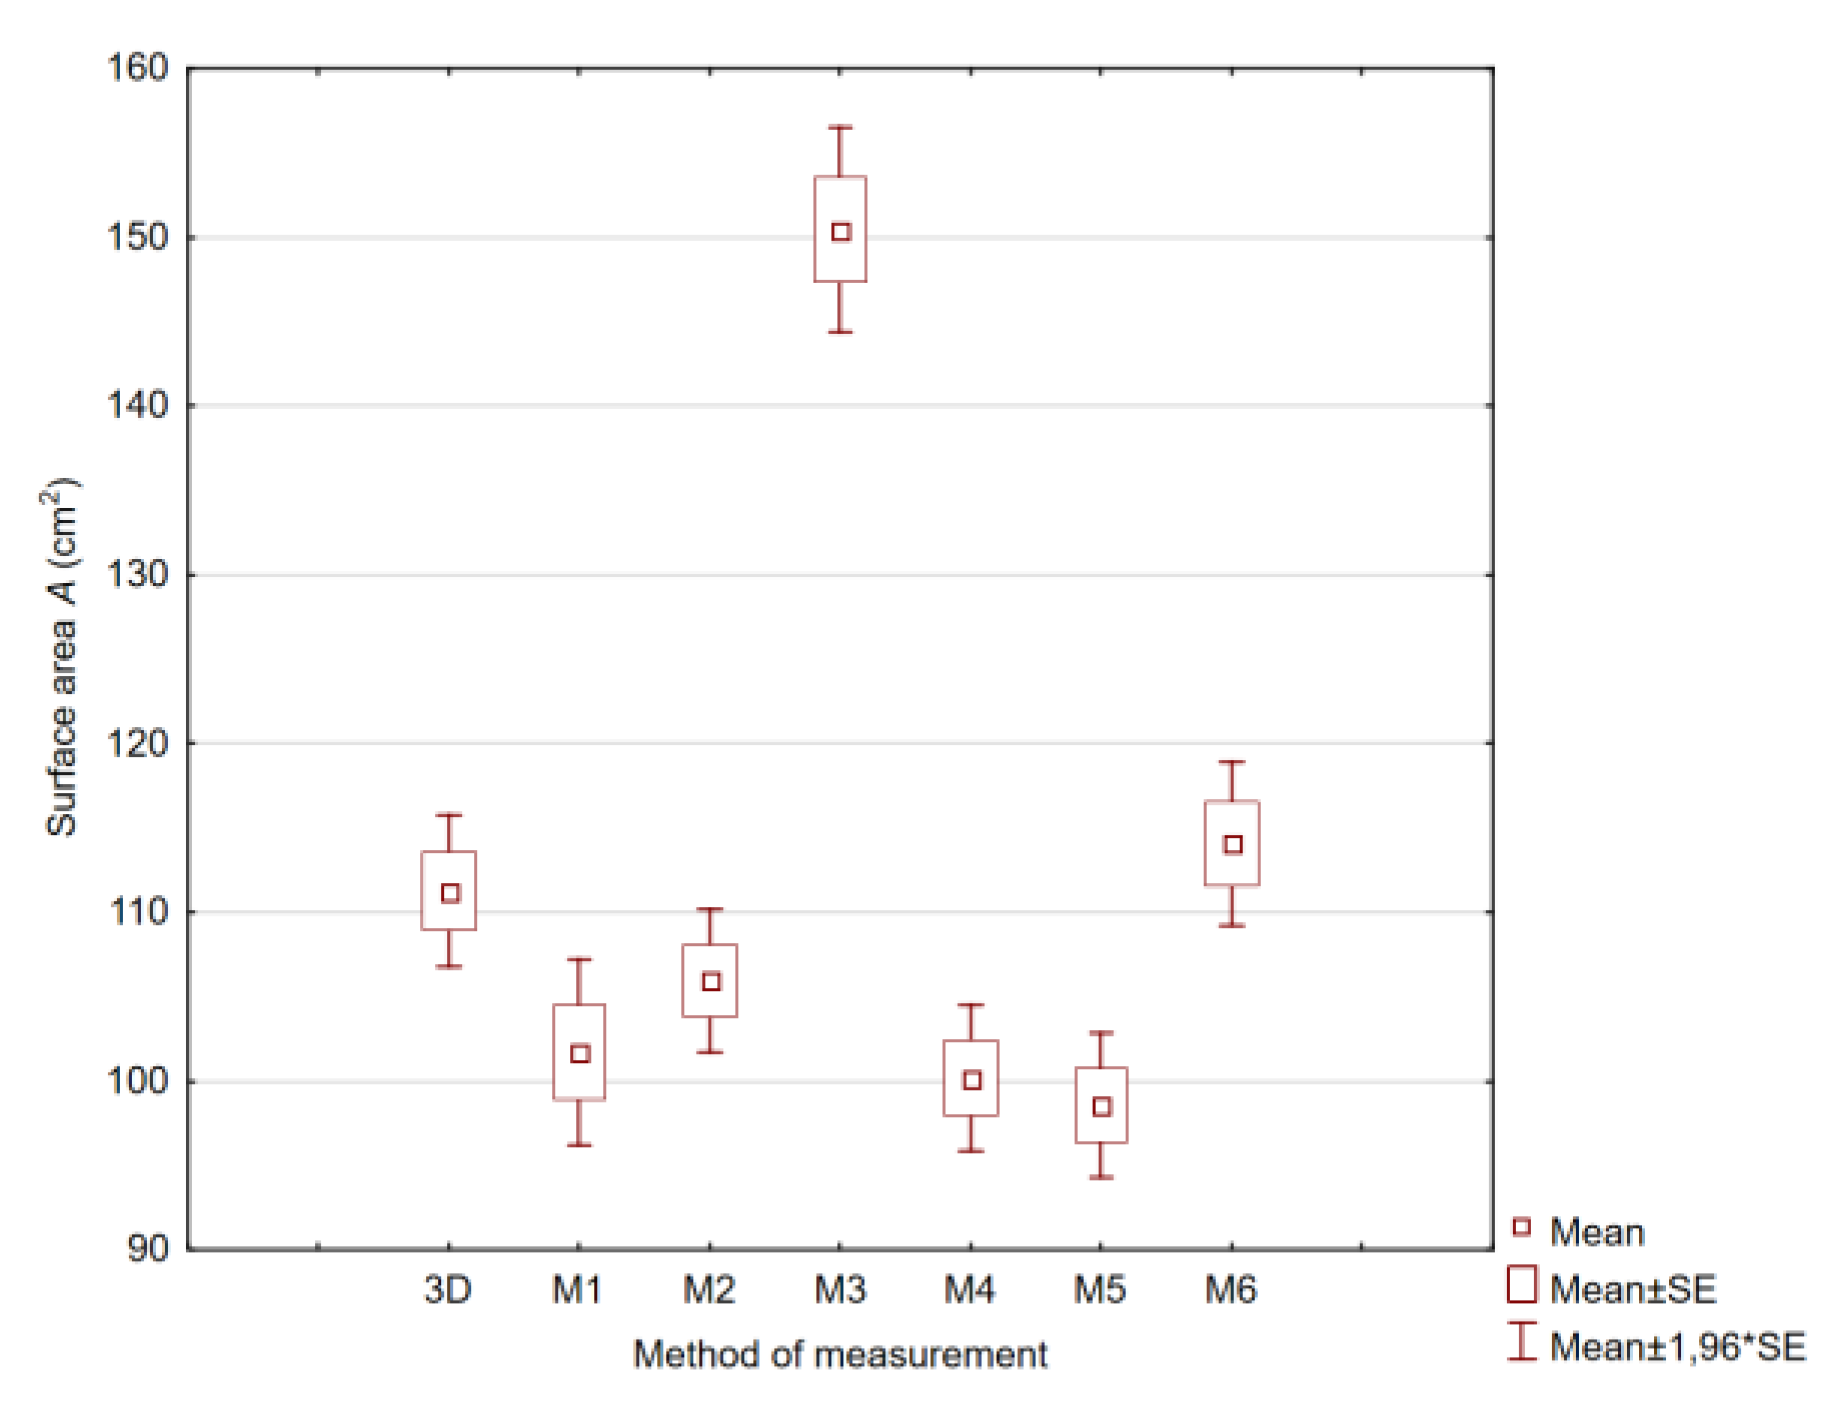
  • Models where the relative error of measurement does not exceed 5% are recommended when the surface area of cucumbers is calculated with an electronic caliper and mathematical formulas of the presented geometric models. The above condition was fulfilled by the spheroid model (M2) and the model combining two truncated cones and two hemispheres with different diameters (M6). Relative error was higher in the range of 8% to 12% when the surface area of cucumbers was determined with the ellipsoid model (M1), the model combining a truncated cone and two hemispheres (M4) and the model combining a cylinder and two hemispheres (M5). The surface area of cucumbers should not be calculated with the cylinder model (M3) where relative error reached 35%.
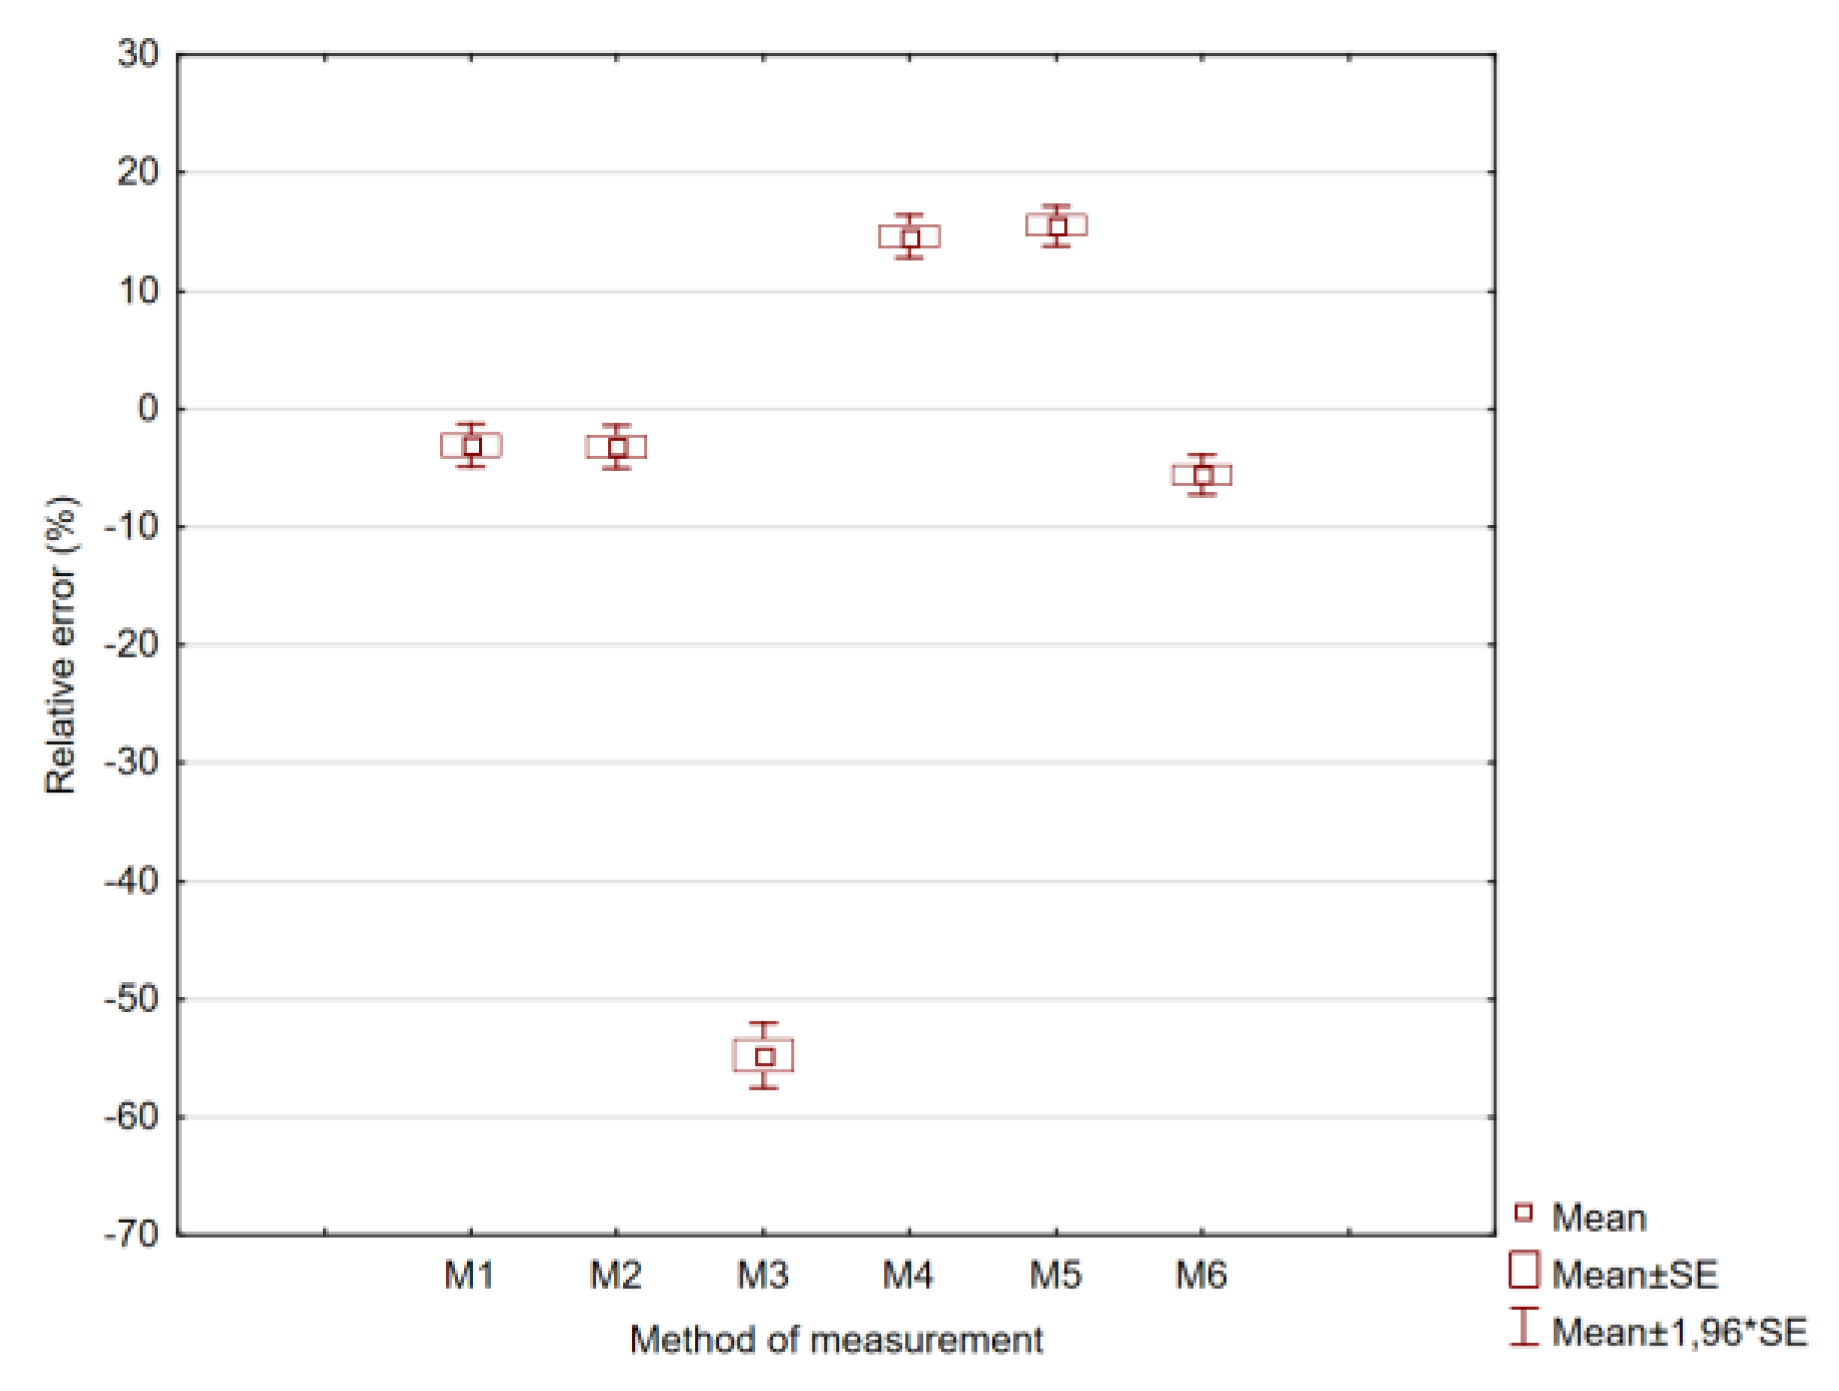
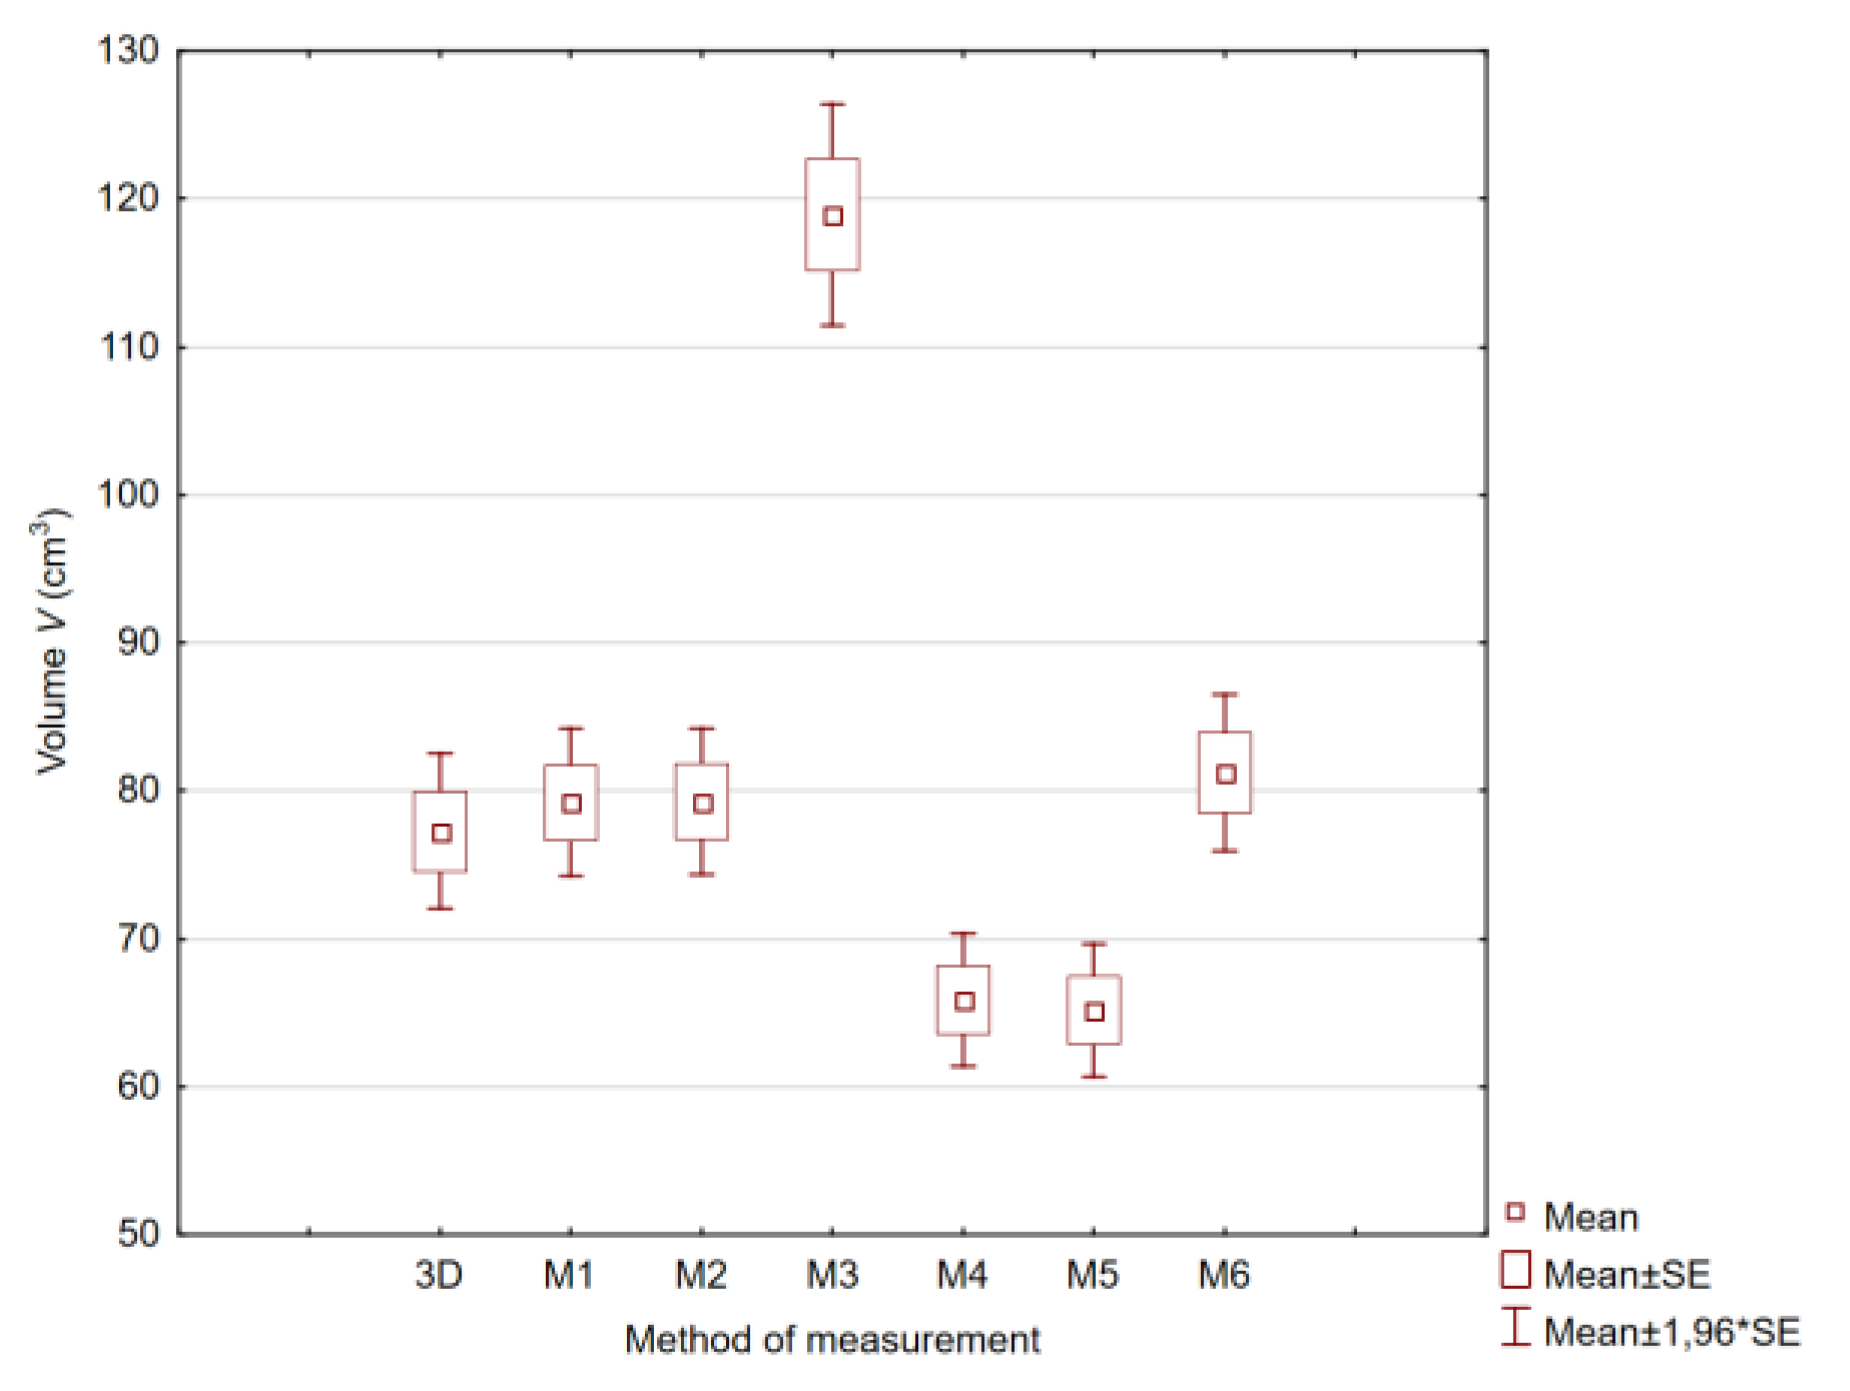
  • The volume of fruits can be calculated with the use of the ellipsoid model (M1), the spheroid model (M2) and, similarly to surface area measurements, the model combining two truncated cones and two hemispheres with different diameters (M6). The relative error of the above geometric models did not exceed 5.5%. Relative error was higher in the range of 14% to 16% when cucumber volume was determined with the model combining a truncated cone and two hemispheres (M4) and the model combining a cylinder and two hemispheres (M5). The relative error of the cylinder model (M3) was determined at 54%.
  • The significance of differences between the mean values of surface area was determined in the Kruskal-Wallis test, and no significant differences were observed in models M1, M2, M4 and M5. However, models M1, M4 and M5 cannot be used to determine the surface area of cucumber fruit due to high mean relative error at 8.37%, 9.98% and 11.44%, respectively.
  • In the literature, the mathematical formula for calculating the volume of an ellipsoid (M1) is often used to determine the volume of agricultural products with an ellipsoidal shape. Relative error is estimated at 3% when the volume of ellipsoidal fruits is calculated with the above mathematical formula.
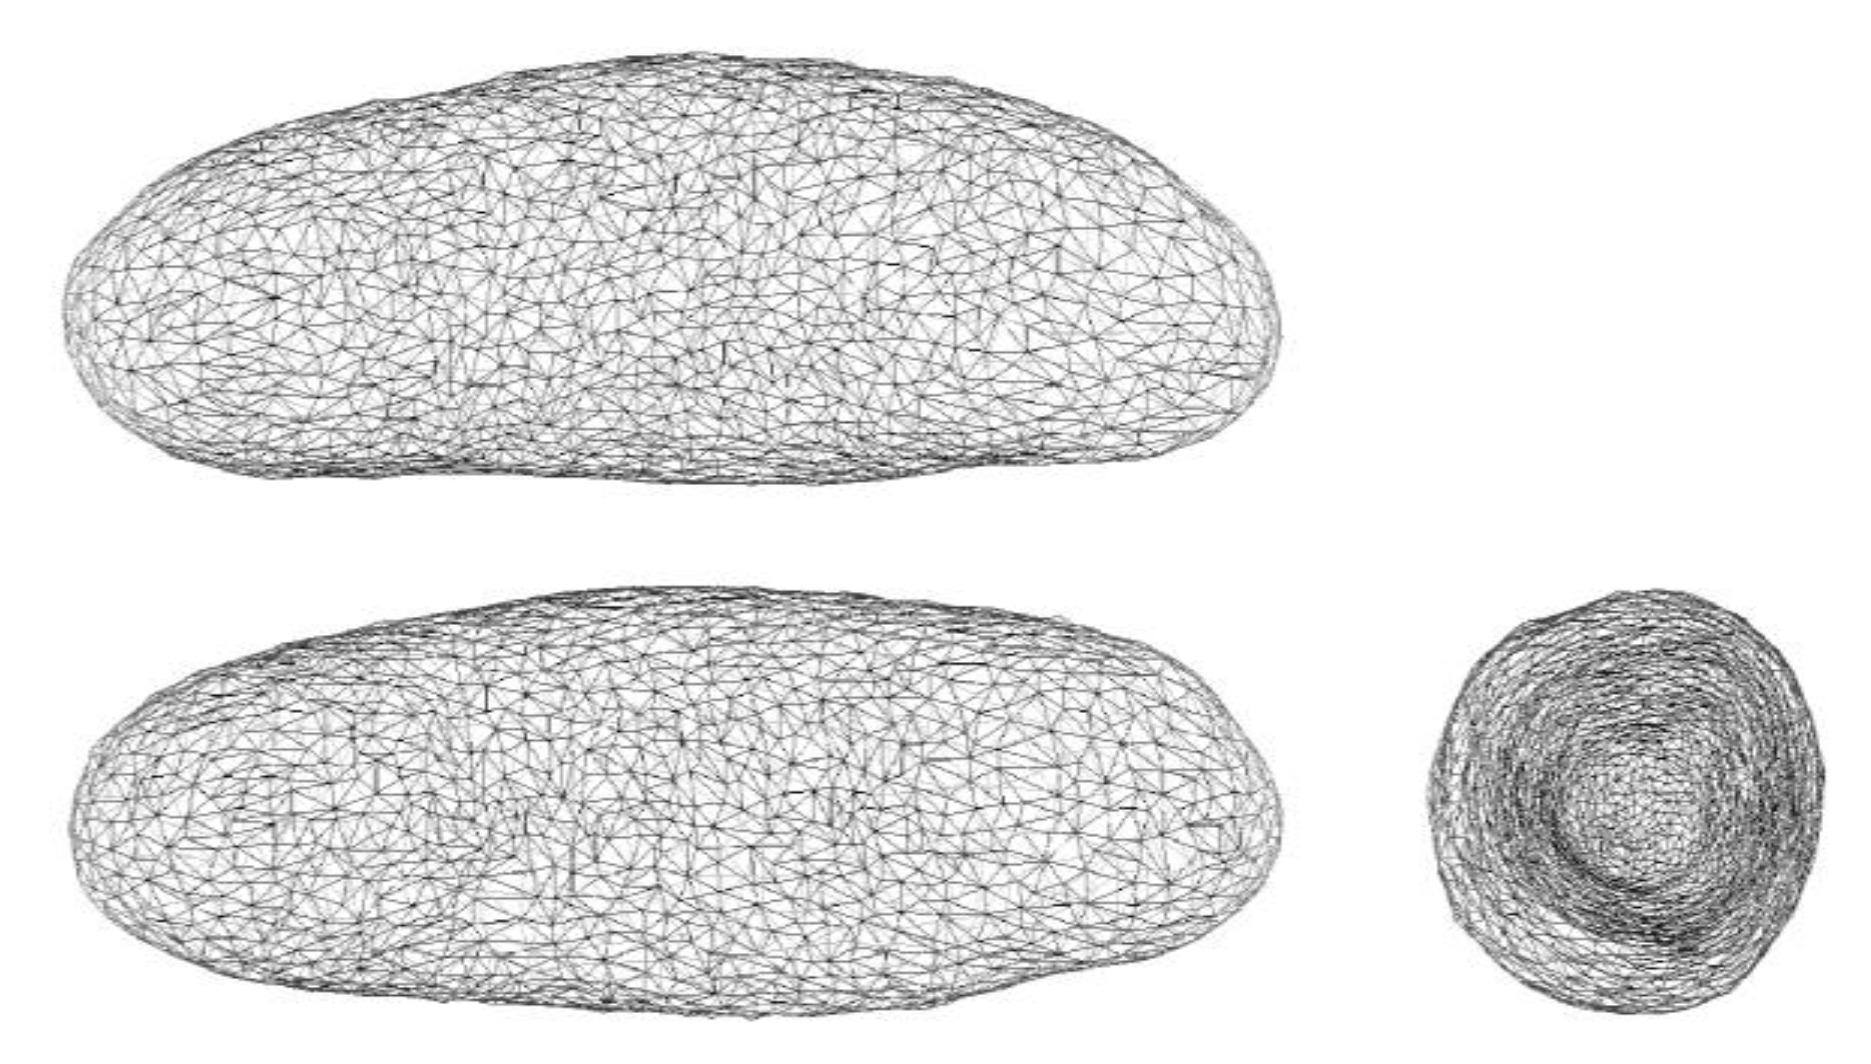
  • In the group of the evaluated methods for determining the geometric parameters of agricultural materials, 3D scanning is the most informative approach. Numerical models support the determination of a full range of geometric parameters (dimensions, area, volume) of entire objects and their fragments. The shape of the analyzed object is stored in computer memory as a cloud of points, and can be used to measure volume without the involvement of displacement methods where the sample is immersed in liquid. Numerical models can also be archived and used for future research.
  • The measurable result of the study was the development of models supporting the determination of the geometric parameters (surface area, volume) of agricultural materials based on their basic dimensions (length, width, thickness). In most cases, the proposed models support the determination of the above geometric parameters with a relative error below 5% within a short period time. Therefore, they can be used in the research and design of new cucumber processing equipment.
  • Further research should focus on the development of models of agricultural raw materials that facilitate the determination of geometric parameters for planning and performing of production processes in agriculture.

Author Contributions

A.A. developed the concept and design of the study; A.A., P.M. and Z.K. conducted the experiments; A.A., Z.K., P.M. and E.Ś. contributed to the literature study; D.C., P.M., Z.K., A.A. and A.J.L. analyzed the data and made final calculations; A.A., Z.K. and P.M. wrote the paper; A.A., P.M. and Z.K. critically revised it.

Funding

This research received no external funding.

Conflicts of Interest

The authors declare no conflict of interest.

References

  1. Datta, A.K.; Halder, A. Status of food process modeling and where do we go from here (synthesis of the outcome from brainstorming). Compr. Rev. Food Sci. Food Saf. 2008, 7, 117–120. [Google Scholar] [CrossRef]
  2. Verboven, P.; De Baerdemaeker, J.; Nicolai, B.M. Using computational fluid dynamics to optimize thermal processes. In Improving the Thermal Processing of Foods; Richardson, P., Ed.; CRC Press: Boca Raton, FL, USA, 2004; pp. 82–102. [Google Scholar]
  3. Goni, S.M.; Purlis, E.; Salvadori, V.O. Three-dimensional reconstruction of irregular foodstuffs. J. Food Eng. 2007, 82, 536–547. [Google Scholar] [CrossRef]
  4. Frączek, J.; Wróbel, M. Methodic aspects of seed shape assessment. Inżynieria Rolnicza 2006, 12, 155–163. (In Polish) [Google Scholar]
  5. Szwedziak, K.; Rut, J. Assessment of pollutants of the grain corn with the help of computer analysis of the image. Postępy Techniki Przetwórstwa Spożywczego 2008, 1, 14–15. (In Polish) [Google Scholar]
  6. Deshpande, S.D.; Bal, S.; Ojha, T.P. Physical properties of soybean. J. Agric. Eng. Res. 1993, 56, 89–98. [Google Scholar] [CrossRef]
  7. Gupta, R.K.; Das, S.K. Physical properties of Sunflower seeds. J. Agric. Eng. Res. 1997, 66, 1–8. [Google Scholar] [CrossRef]
  8. Cahsir, S.; Marakoglu, T.; Ogut, H.; Ozturk, O. Physical properties of rapeseed (Brassica napus oleifera L.). J. Food Eng. 2005, 69, 61–66. [Google Scholar]
  9. Tańska, M.; Rotkiewicz, D.; Kozirok, W.; Konopka, I. Measurement of the geometrical features and surface color of rapeseeds using digital image analysis. Food Res. Int. 2005, 38, 741–750. [Google Scholar] [CrossRef]
  10. Jadwisieńczak, K.; Kaliniewicz, Z. Analysis of the mustard seeds cleaning process. Part 1. Physical properties of seeds. Inżynieria Rolnicza 2011, 9, 57–64. (In Polish) [Google Scholar]
  11. Coskuner, Y.; Karababa, E. Some physical properties of flaxseed (Linum usitatissimum L.). J. Food Eng. 2007, 78, 1067–1073. [Google Scholar] [CrossRef]
  12. Erdogdu, F.; Balaban, M.O.; Chau, K.V. Modeling of heat conduction in elliptical cross-section: II, Adaptation to thermal processing of shrimp. J. Food Eng. 1998, 38, 241–258. [Google Scholar] [CrossRef]
  13. Luzuriaga, D.A.; Balaban, M.O.; Yeralan, S. Analysis of visual quality attributes of white shrimp by machine vision. J. Food Sci. 1997, 62, 113–118. [Google Scholar] [CrossRef]
  14. Crocombe, J.P.; Lovatt, S.J.; Clarke, R.D. Evaluation of chilling time shape factors through the use of three-dimensional surface modeling. In Proceedings of the 20th International Congress of Refrigeration 1999: IIR/IIF, Sydney, Australia, 19–24 September 1999; p. 353. [Google Scholar]
  15. Jancsok, P.T.; Clijmans, L.; Nicolai, B.M.; De Baerdemaeker, J. Investigation of the effect of shape on the acoustic response of ‘conference’ pears by finite element modeling. Postharvest Biol. Technol. 2001, 23, 1–12. [Google Scholar] [CrossRef]
  16. Borsa, J.; Chu, R.; Sun, J.; Linton, N.; Hunter, C. Use of CT scans and treatment planning software for validation of the dose component of food irradiation protocols. Radiat. Phys. Chem. 2002, 63, 271–275. [Google Scholar] [CrossRef]
  17. Sabliov, C.M.; Bolder, D.; Keener, K.M.; Farkas, B.E. Image processing method to determine surface area and volume of axi-symmetric agricultural products. Int. J. Food Prop. 2002, 5, 641–653. [Google Scholar] [CrossRef]
  18. Zapotoczny, P. Measuring geometrical parameters of cucumbers fruits using computer image analysis. Problemy Inżynierii Rolniczej 2002, 4, 57–64. (In Polish) [Google Scholar]
  19. Scheerlinck, N.; Marquenie, D.; Jancsok, P.T.; Verboven, P.; Moles, C.G.; Banga, J.R.; Nicolai, B.M. A model-based approach to develop periodic thermal treatments for surface decontamination of strawberries. Postharvest Biol. Technol. 2004, 34, 39–52. [Google Scholar] [CrossRef]
  20. Du, C.; Sun, D.W. Estimating the surface area and volume of ellipsoidal ham using computer vision. J. Food Eng. 2006, 73, 260–268. [Google Scholar] [CrossRef]
  21. Zheng, C.; Sun, D.W.; Du, C.J. Estimating shrinkage of large cooked beef joints during air-blast cooling by computer vision. J. Food Eng. 2006, 72, 56–62. [Google Scholar] [CrossRef]
  22. Kim, J.; Moreira, R.G.; Huang, Y.; Castell-Perez, M.E. 3-D dose distributions for optimum radiation treatment planning of complex foods. J. Food Eng. 2007, 79, 312–321. [Google Scholar] [CrossRef]
  23. Goni, S.M.; Purlis, E.; Salvadori, V.O. Geometry modeling of food materials from magnetic resonance imaging. J. Food Eng. 2008, 88, 561–567. [Google Scholar] [CrossRef]
  24. Siripon, K.; Tansakul, A.; Mittal, G.S. Heat transfer modeling of chicken cooking in hot water. Food Res. Int. 2007, 40, 923–930. [Google Scholar] [CrossRef]
  25. Mieszkalski, L. Computer-aiding of mathematical modeling of the carrot (Daucus carota L.) root shape. Ann. Wars. Univ. Life Sci. SGGW Agric. 2013, 61, 17–23. [Google Scholar]
  26. Mieszkalski, L. Bezier curves in modeling the shapes of biological objects. Ann. Wars. Univ. Life Sci. SGGW Agric. 2014, 64, 117–128. [Google Scholar]
  27. Balcerzak, K.; Weres, J.; Górna, K.; Idziaszek, P. Modeling of agri-food products on the basis of solid geometry with examples in AutoDesk 3ds Max and finite element mesh generation. J. Res. Appl. Agric. Eng. 2015, 60, 5–8. [Google Scholar]
  28. Ho, Q.T.; Carmeliet, J.; Datta, A.K.; Defraeye, T.; Delele, M.A.; Herremans, E.; Opara, L.; Ramon, H.; Tijskens, E.; Sman, R.; et al. Multiscale modeling in food engineering. J. Food Eng. 2013, 114, 279–291. [Google Scholar] [CrossRef]
  29. Anders, A. Determination of the Geometric Parameters of Seeds with Different Methods; Wydawnictwo Uniwersytetu Warmińsko-Mazurskiego w Olsztynie: Olsztyn, Poland, 2019; ISBN 978-83-8100-163-2. (In Polish) [Google Scholar]
  30. Rahmi, U.; Ferruh, E. Potential use of 3-dimensional scanners for food process modeling. J. Food Eng. 2009, 93, 337–343. [Google Scholar]
  31. Anders, A.; Markowski, P.; Kaliniewicz, Z. Numerical modelling of agricultural products on the example of bean and yellow lupine seeds. Int. Agrophys. 2015, 29, 397–403. [Google Scholar] [CrossRef] [Green Version]
  32. Anders, A.; Markowski, P.; Kaliniewicz, Z. Evaluation of geometric and physical properties of chosen pear cultivars based on numerical models obtained by a 3D scanner. Zeszyty Problemowe Postępów Nauk Rolniczych 2014, 577, 3–12. (In Polish) [Google Scholar]
  33. Anders, A.; Markowski, P.; Kaliniewicz, Z. The application of a 3D scanner for the evaluation of geometric properties of Cannabis sativa L. seeds. Acta Agrophys. 2014, 21, 391–402. (In Polish) [Google Scholar]
  34. NextEngine User Manual. 2010. Available online: http://www.nextengine.com (accessed on 1 July 2018).
  35. MeshLab Visual Computing Lab—ISTI—CNR. 2013. Available online: http://meshlab.sourceforge.net (accessed on 1 July 2018).
  36. Gastón, A.L.; Abalone, R.M.; Giner, S.A. Wheat drying kinetics. Diffusivities for sphere and ellipsoid by finite elements. J. Food Eng. 2002, 52, 313–322. [Google Scholar] [CrossRef]
  37. Bronsztejn, I.N.; Siemiendiajew, K.A.; Musiol, G.; Muhling, H. Nowoczesne Kompendium Matematyki; PWN: Warszawa, Poland, 2009. (In Polish) [Google Scholar]
Figure 1. Shape of a selected cucumber fruit: L—length (mm), W—width (mm), T—thickness (mm), L1—length of the middle section (mm), W1, W2—width of the terminal section (mm), T1, T2—thickness of the terminal section (mm).
Sustainability 11 02798 g001
Figure 2. Models of cucumber fruits: M1—ellipsoid, M2—spheroid, M3—cylinder, M4—truncated cone and two hemispheres, M5—cylinder and two hemispheres, M6—two truncated cones and two hemispheres.
Sustainability 11 02798 g002
Figure 3. 3D model of a cucumber fruit with a texture overlay.
Sustainability 11 02798 g003
Figure 4. 3D model of a cucumber fruit represented by a triangle mesh.
Sustainability 11 02798 g004
Figure 5. Parameters of normal distribution of cucumber surface area.
Sustainability 11 02798 g005
Figure 6. Parameters of normal distribution of cucumber volume.
Sustainability 11 02798 g006
Figure 7. Relative error of cucumber surface area determined with geometric models and the 3D model.
Sustainability 11 02798 g007
Figure 8. Relative error of cucumber volume determined with geometric models and the 3D model.
Sustainability 11 02798 g008
Table 1. Geometric parameters of cucumber fruits.
Variable1MeanRangeStandard Deviation
L (mm)113.1439.109.94
W (mm)37.2313.043.28
T (mm)35.4714.823.31
A 3D (mm2)111.2570.5416.12
V 3D (mm3)77.2680.7318.89
3D-3D scan
Table 2. The significance of differences between the mean surface area of cucumber fruits.
Surface Area A (Kruskal-Wallis Test)
H(6, N = 350) = 132.2065; p = 0.000
Probability of Multiple Comparisons
Measurement MethodNumber of Observations NRank SumMean RankMean
3D509288.50185.77111.25 bc
M1506939.50138.79101.71 a
M2507863.00157.26105.93 ab
M35015,564.00311.28150.45 d
M4506181.00123.62100.17a
M5505737.00114.7498.57 a
M6509852.00197.04114.06 c
Values marked with the same letters in columns do not differ significantly; a,b,c,d (p ≤ 0.05).
Table 3. The significance of differences between the mean volume of cucumber fruits.
Volume V (Kruskal-Wallis Test)
H(6, N = 350) = 124.2550; p = 0.000
Probability of Multiple Comparisons
Measurement MethodNumber of Observations NRank SumMean RankMean
3D508301.00166.0277.26 a
M1508910.00178.2079.21 a
M2508982.00179.6479.29 a
M35015,085.00301.70118.93 c
M4505492.00109.8465.85 b
M5505262.00105.2465.16 b
M6509393.00187.8681.27 a
Values marked with the same letters in columns do not differ significantly; a,b,c (p ≤ 0.05).

