Simulation of the Operation of a Spark Ignition Engine Fueled with Various Biofuels and Its Contribution to Technology Management

 ,
,  ,
,  ,
, 
Abstract
1. Introduction
2. Materials and Methods
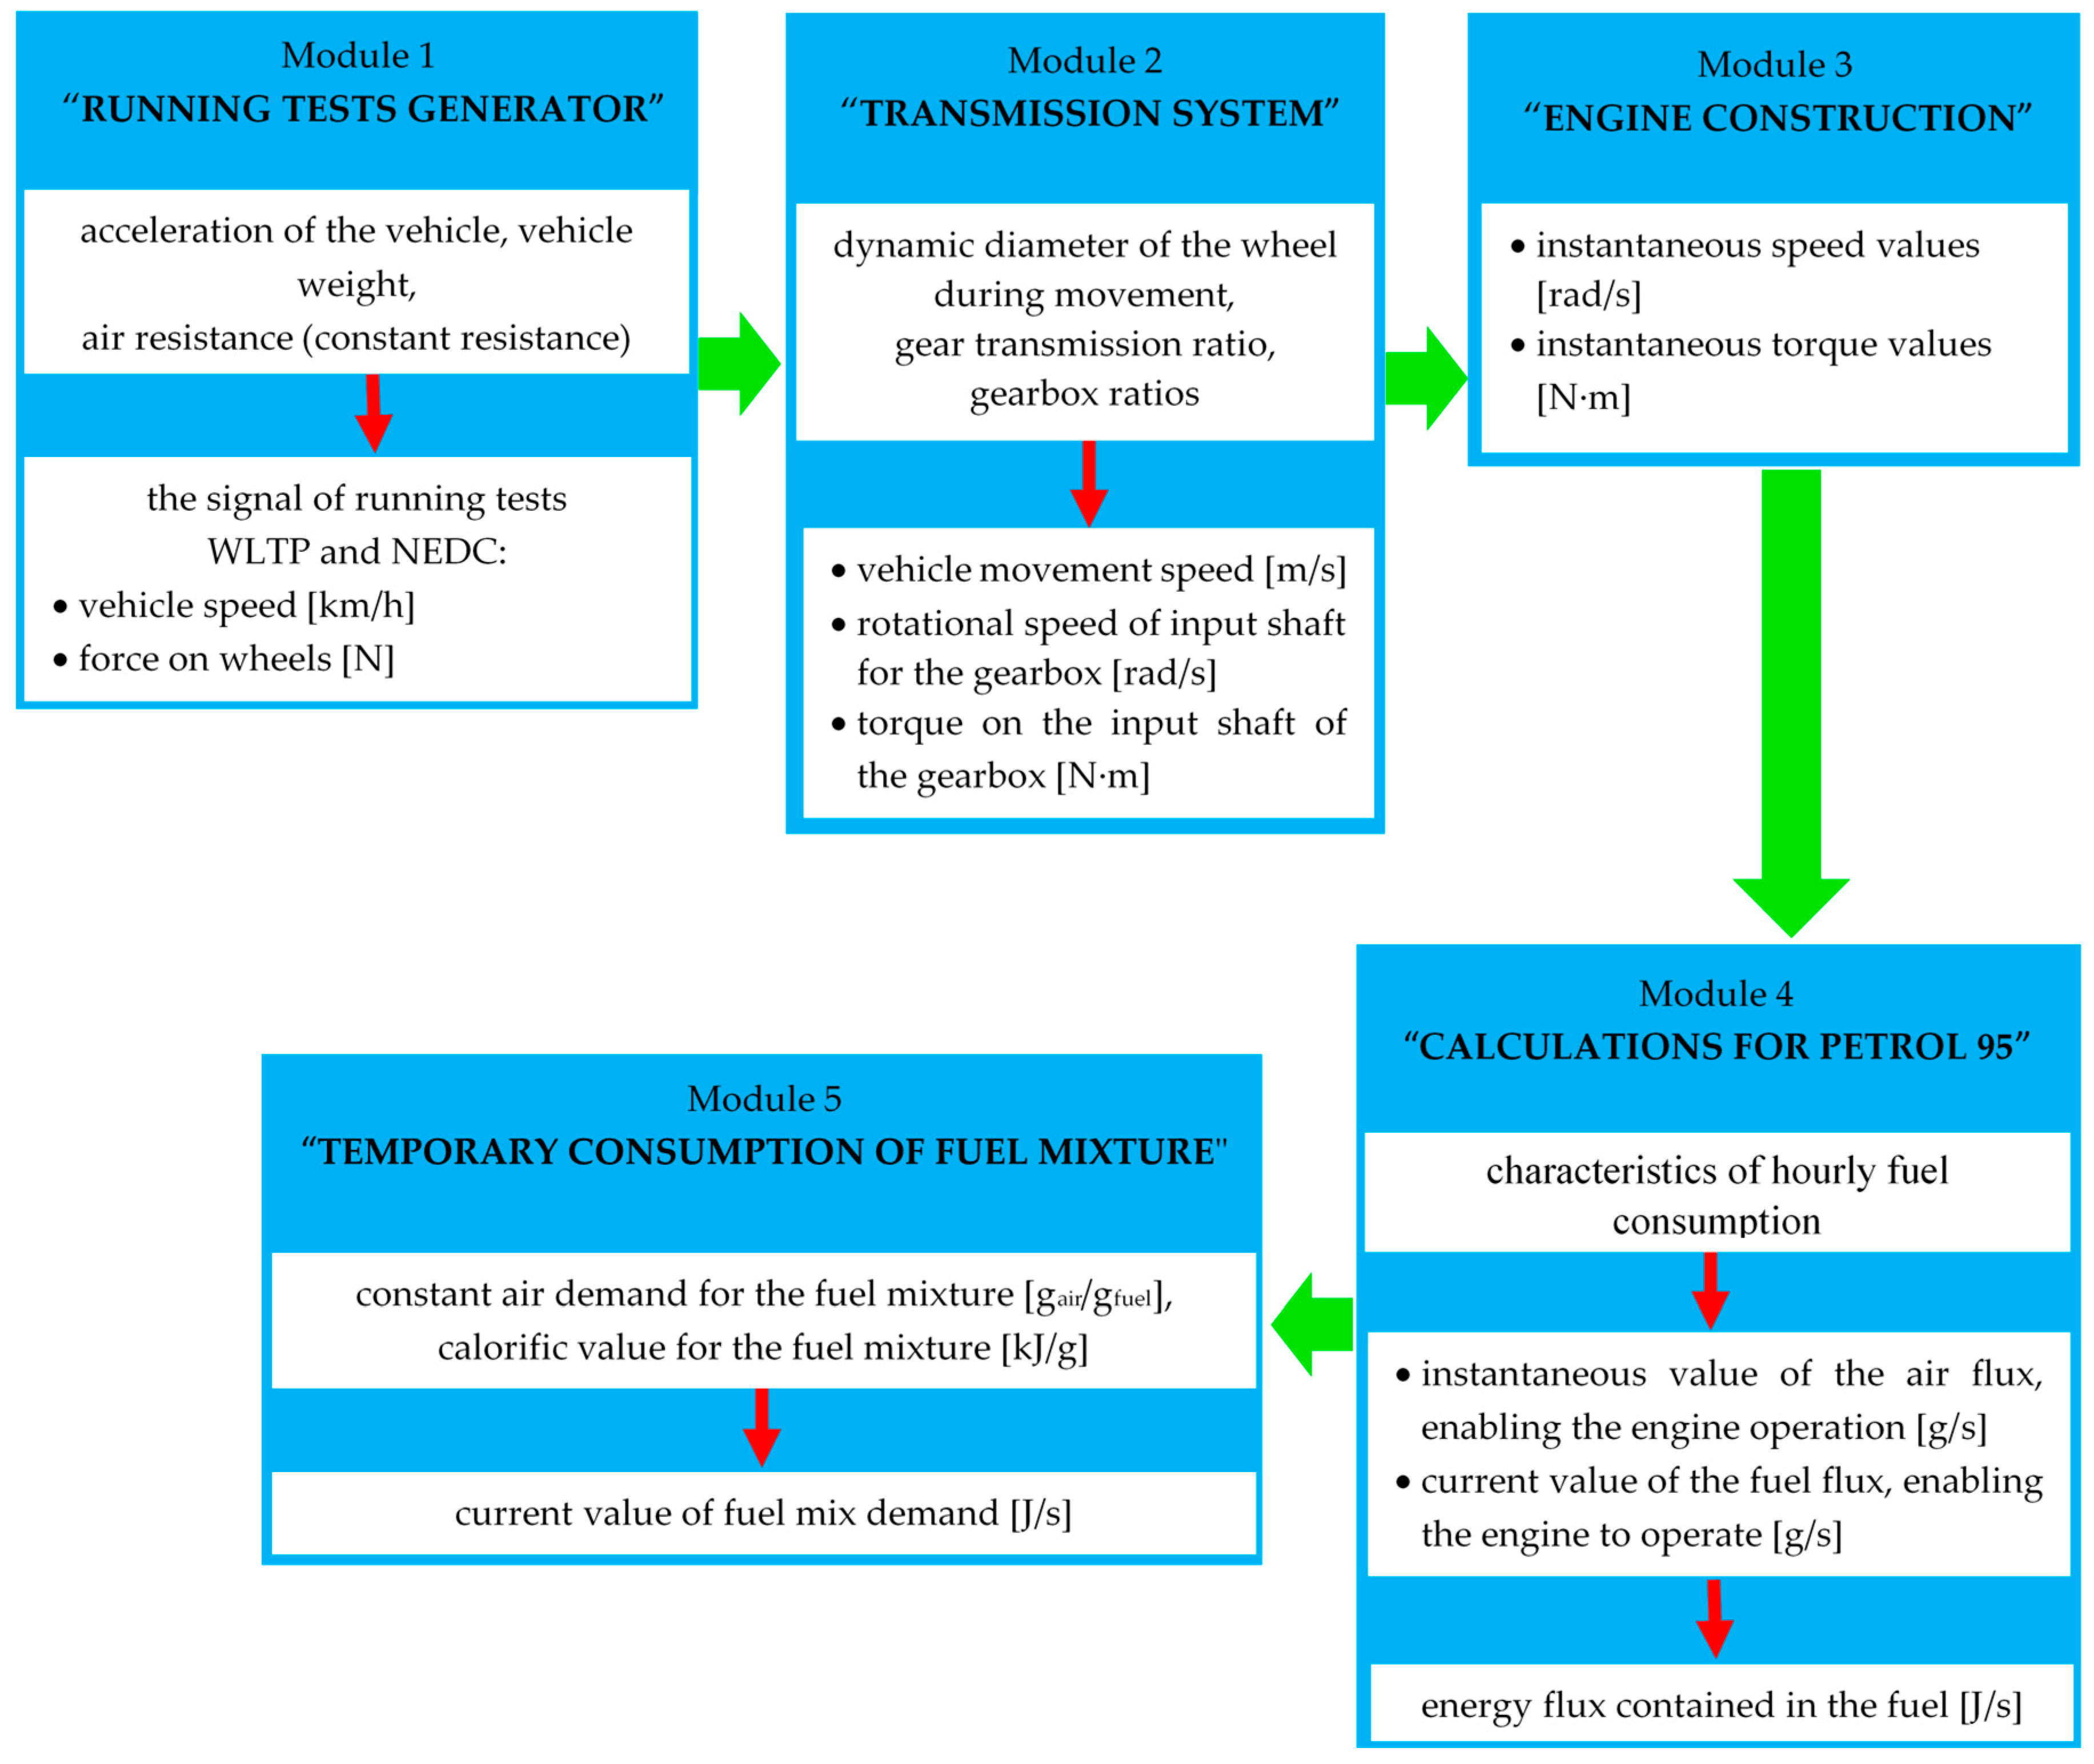
- “Test generator”—this block was responsible for generating signals with precisely determined waveforms that were needed to control the simulation at the time specified for the NEDC test. In this block, the values of vehicle speed [m/s] at the given moment and the distance traveled by the vehicle were calculated using the integral element. Calculations of vehicle accelerations were carried out using a differentiating element.Based on the parameters which were specified for running tests and which were adequate for the selected vehicle (conversion weight 740 kg), the values of the load resulting from the movement of the vehicle were calculated. In addition to the load associated with the movement resistance of the vehicle, the simulation also calculated the load resulting from the mobility of the driving test. The calculated load values were added up and transferred to subsequent modules. The block also calculated the amount of energy flowing between the vehicle braking rollers. Next, the total energy value transferred to the brake rollers as well as taken from the roller device was calculated.The values calculated during the simulation corresponded adequately to the power and energy transferred by the engine to the load and the power and energy needed to brake the vehicle on the roller stand in the brake system.
- “Drive system”—the elements used in this block took into account at the same time the design diameter of the drive wheels, the actual range of the gear ratios, and the main transmission, allowing the simulation of how the propulsion system in the real vehicle will react. As a result of the calculations, this module transmitted individual signals: speed [m/s]—the speed at which the vehicle moves, “Gear speed [rad/s]”—speed [rad/s] of input shaft for the gearbox, and “gear torque [N·m]”—torque on the input shaft of the gearbox.
- “Engine”—this module controlled the intervals, in which the torque and speed are changed. This is important because their values cannot be greater than the specified limits of the tested engine model.In this block, the value of the idle speed value of 83.7 rad/s (800 rpm) corresponding to the principles of the vehicle’s engine operation was determined according to the following formulae:The limitation of the engine torque due to the use of the unit fuel consumption characteristic for the selected engine allowed for removal of the negative values of the torque acting on the vehicle’s transmission, which corresponded to the braking process of the vehicle in the test by the engine or braking system.
- “Calculations for petrol 95”—based on the adopted characteristics of hourly fuel consumption, this block calculated the instantaneous value of air and fuel enabling engine operation.Taking into account the calorific value of ethyline 95, the energy flow [J/s] was calculated.In the next stage, the simulation module calculated the temporary values of the motor efficiency η [-].The developed simulation included the possibility of running the engine with the start/stop system. In this case, when the start stop system is not turned on, the engine runs throughout the simulation and its demand for fuel and air is calculated as shown above.However, when the start/stop mode is on, the fuel (fuels) and air (airs) streams are calculated from dependencies that enable mathematical consideration of the case of engine shutdown when the vehicle has stopped during the travel test procedure.The simulation component, based on the calculated instantaneous values, performs calculations of cumulative values for the fuel and air consumed over the whole test, using integral elements.
- “Calculations for fuels”—in this segment, the instantaneous consumption of fuel mixtures was calculated based on the calorific values determined in the simulation. The use of air was determined on the basis of the air demand measured in the simulation. Using the calculated proportions of oxygen, carbon, and hydrogen in the fuel mixture, the emission of water vapor and carbon dioxide was calculated. The next step was to determine cumulative values.A general outline of the prepared simulation has been presented in the Figure 1. The simulation concerns the operation of the vehicle in accordance with the NEDC test conditions and the use of selected fuels.
3. Results and Discussion
3.1. Test Generator
3.2. Calculations for Petrol 95 for the Case of the Disabled Start/Stop System
3.3. Calculations for Petrol 95 for the Example of the Activated Start/Stop System
3.4. Comparison of Fuel Consumption Changes
4. Conclusions
- The use of biofuel additives in the air-fuel mixture, due to the molecular structure of these biofuel additives, reduces carbon dioxide emissions and decreases air demand.
- In the test, all carbon dioxide emissions exceeded the permissible level of 130 g CO2/km, which is bad news in the context of the further tightening of standards.
- In the case of water vapor emissions, a larger share of hydrogen and oxygen in the components used causes the emission to increase.
- The demand for fuel increases with the increase of the share of biofuel additives. This is due to the lower calorific value of the components.
- The simulation tests confirmed that in the case of using the start/stop system and applying specific additives, the carbon dioxide emission decreases and the consumption of mixtures with the enabled start/stop system is lower.
Author Contributions
Funding
Conflicts of Interest
References
- Meersman, H.; De Voorde, E.V. Freight transport models: Ready to support transport policy of the future? Transp. Policy 2019, in press. [Google Scholar] [CrossRef]
- Armeanu, D.Ş.; Vintilă, G.; Gherghina, Ş.C. Does Renewable Energy Drive Sustainable Economic Growth? Multivariate Panel Data Evidence for EU-28 Countries. Energies 2017, 10, 381. [Google Scholar] [CrossRef]
- Gherghina, Ş.C.; Onofrei, M.; Vintilă, G.; Armeanu, D.Ş. Empirical Evidence from EU-28 Countries on Resilient Transport Infrastructure Systems and Sustainable Economic Growth. Sustainability 2018, 10, 2900. [Google Scholar] [CrossRef]
- Kuklinska, K.; Wolska, L.; Namiesnik, J. Air quality policy in the U.S. and the EU—A review. Atmos. Pollut. Res. 2015, 6, 129–137. [Google Scholar] [CrossRef]
- Directive (EU) 2016/2284 of the European Parliament and of the Council of 14 December 2016 on the Reduction of National Emissions of Certain Atmospheric Pollutants, Amending Directive 2003/35/EC and Repealing Directive 2001/81/EC. Available online: https://eur-lex.europa.eu (accessed on 22 March 2019).
- National Environmental Protection Program until 2020 (with a Prospect Until 2030). Available online: https://www.gov.pl/web/srodowisko (accessed on 22 March 2019).
- Air Quality in Europe—2018 Report. Available online: https://www.eea.europa.eu (accessed on 22 March 2019).
- Lehtomäki, H.; Korhonen, A.; Asikainen, A.; Karvosenoja, N.; Kupiainen, K.; Paunu, V.V.; Savolahti, M.; Sofiev, M.; Palamarchuk, Y.; Karppinen, A.; et al. Health Impacts of Ambient Air Pollution in Finland. Int. J. Environ. Res. Public Health 2018, 15, 736. [Google Scholar] [CrossRef] [PubMed]
- Pisoni, E.; Christidis, P.; Thunis, P.; Trombetti, M. Evaluating the impact of “Sustainable Urban Mobility Plans” on urban background air quality. J. Environ. Manag. 2019, 231, 249–255. [Google Scholar] [CrossRef]
- Santos, F.M.; Gómez-Losada, A.; Pires, J.C.M. Impact of the implementation of Lisbon low emission zone on air quality. J. Hazard. Mater. 2019, 365, 632–641. [Google Scholar] [CrossRef] [PubMed]
- Cleaner Air for all. Available online: http://ec.europa.eu/environment/air/cleaner_air/ (accessed on 15 May 2019).
- Jiménez, J.L.; Valido, J.; Molden, N. The drivers behind differences between official and actual vehicle efficiency and CO2 emissions. Transp. Res. Part D Transp. Environ. 2019, 67, 628–641. [Google Scholar] [CrossRef]
- Bukrejewski, P.; Skolniak, M.; Kowalski, Ł. Comparison of the environmental effect of M1 category vehicles fed with traditional and alternative fuels. Arch. Automot. Eng. 2017, 75, 5–21. [Google Scholar]
- Kuranc, C. Emission of the fume’s harmful components in the control tests upon the chosen population of vehicles. Autobusy 2011, 10, 1–9. [Google Scholar]
- Landscape Review: EU Action on Energy and Climate Change. Available online: https://www.eca.europa.eu/en/Pages/DocItem.aspx?did=41824 (accessed on 22 March 2019).
- Motowidlak, U. Role of urban transport towards achieving a low-carbon economy. Studia Ekonomiczne 2015, 249, 172–184. [Google Scholar]
- TERM 2015: Transport Indicators Tracking Progress Towards Environmental Targets in Europe. EEA Report 7/2015. Available online: https://www.ecologic.eu/13108 (accessed on 22 March 2019).
- Bielaczyc, P.; Szczotka, A.; Pajdowski, P.; Woodburn, J. The potential of current European light duty LPG-fuelled vehicles to meet Euro 6 requirement. Combust. Engines 2015, 162, 874–880. [Google Scholar]
- O’Driscoll, R.; Stettler, M.E.J.; Molden, N.; Oxley, T.; ApSimon, H.M. Real world CO2 and NOx emissions from 149 Euro 5 and 6 diesel, gasoline and hybrid passenger cars. Sci. Total Environ. 2018, 621, 282–290. [Google Scholar] [CrossRef]
- Flekiewicz, M.; Kubica, G. The use of gaseous fuels mixtures for SI engines propulsion. IOP Conf. Ser. Mater. Sci. Eng. 2016, 148, 1–11. [Google Scholar] [CrossRef]
- Iliev, S. A comparison of ethanol and methanol blending with gasoline using a 1-D engine model. Procedia Eng. 2015, 100, 1013–1022. [Google Scholar] [CrossRef]
- Costagliola, M.A.; Costabile, M.; Prati, M.V. Impact of road grade on real driving emissions from two Euro 5 diesel vehicles. Appl. Energy 2018, 231, 586–593. [Google Scholar] [CrossRef]
- Weber, C.; Sundvor, I.; Figenbaum, E. Comparison of regulated emission factors of Euro 6 LDV in Nordic temperatures and cold start conditions: Diesel- and gasoline direct-injection. Atmos. Environ. 2019, 206, 208–217. [Google Scholar] [CrossRef]
- Grigoratos, T.; Fontaras, G.; Giechaskiel, B.; Zacharof, N. Real world emissions performance of heavy-duty Euro VI diesel vehicles. Atmos. Environ. 2019, 201, 348–359. [Google Scholar] [CrossRef]
- Puškár, M.; Kopas, M. System based on thermal control of the HCCI technology developed for reduction of the vehicle NOX emissions in order to fulfil the future standard Euro 7. Sci. Total Environ. 2018, 643, 674–680. [Google Scholar] [CrossRef]
- Hooftman, N.; Oliveira, L.; Messagie, M.; Coosemans, T.; Van Mierlo, J. Environmental Analysis of Petrol, Diesel and Electric Passenger Cars in a Belgian Urban Setting. Energies 2016, 9, 84. [Google Scholar] [CrossRef]
- Lv, W.; Hu, Y.; Li, E.; Liu, H.; Pan, H.; Ji, S.; Hayat, T.; Alsaedi, A.; Ahmad, B. Evaluation of vehicle emission in Yunnan province from 2003 to 2015. J. Clean. Prod. 2019, 207, 814–825. [Google Scholar] [CrossRef]
- Mendoza-Villafuerte, P.; Suarez-Bertoa, R.; Giechaskiel, B.; Riccobono, F.; Bulgheroni, C.; Astorga, C.; Perujo, A. NOx, NH3, N2O and PN real driving emissions from a Euro VI heavy-duty vehicle. Impact of regulatory on-road test conditions on emissions. Sci. Total Environ. 2017, 609, 546–555. [Google Scholar] [CrossRef]
- Ramos, A.; Muñoz, J.; Andrés, F.; Armas, O. NOx emissions from diesel light duty vehicle tested under NEDC and real-word driving conditions. Transp. Res. Part D Transp. Environ. 2018, 63, 37–48. [Google Scholar] [CrossRef]
- Implementation of the NEDC/WLTP Correlation Procedures for Cars and Light Commercial Vehicles. Available online: https://ec.europa.eu/clima/ (accessed on 15 May 2019).
- Louis, C.; Liu, Y.; Martinet, S.; D’Anna, B.; Valiente, A.M.; Boreave, A.; R’Mili, B.; Tassel, P.; Perret, P.; André, M. Dilution effects on ultrafine particle emissions from Euro 5 and Euro 6 diesel and gasoline vehicles. Atmos. Environ. 2017, 169, 80–88. [Google Scholar] [CrossRef]
- Mamakos, A.; Martini, G.; Manfredi, U. Assessment of the legislated particle number measurement procedure for a Euro 5 and a Euro 6 compliant diesel passenger cars under regulated and unregulated conditions. J. Aerosol Sci. 2013, 55, 31–47. [Google Scholar] [CrossRef]
- Huang, Y.; Ng, E.C.Y.; Yam, Y.; Lee, C.K.C.; Surawski, N.C.; Mok, W.; Organ, B.; Zhou, J.L.; Chan, E.F.C. Impact of potential engine malfunctions on fuel consumption and gaseous emissions of a Euro VI diesel truck. Energy Convers. Manag. 2019, 184, 521–529. [Google Scholar] [CrossRef]
- Xu, G.; Jia, M.; Li, Y.; Chang, Y.; Wang, T. Potential of reactivity controlled compression ignition (RCCI) combustion coupled with variable valve timing (VVT) strategy for meeting Euro 6 emission regulations and high fuel efficiency in a heavy-duty diesel engine. Energy Convers. Manag. 2018, 171, 683–698. [Google Scholar] [CrossRef]
- ECOpoint. Diesel Emissions Online. Available online: https://www.dieselnet.com (accessed on 22 March 2019).
- Czapliński, E.; Idzior, M. The research into the influence of the technical condition of motor vehicles in operation on exhaust pollutant emissions. Combust. Engines 2015, 54, 578–581. [Google Scholar]
- Laboratories & Facilities. Available online: https://ec.europa.eu/jrc/en/research-facilities (accessed on 15 May 2019).
- Triantafyllopoulos, G.; Dimaratos, A.; Ntziachristos, L.; Bernard, Y.; Dornoff, J.; Samaras, Z. A study on the CO2 and NOx emissions performance of Euro 6 diesel vehicles under various chassis dynamometer and on-road conditions including latest regulatory provisions. Sci. Total Environ. 2019, 666, 337–346. [Google Scholar] [CrossRef]
- Liu, Q.; Liu, J.; Fu, J.; Li, Y.; Luo, B.; Zhan, Z.; Deng, B. Comparative study on combustion and thermodynamics performance of gasoline direct injection (GDI) engine under cold start and warm-up NEDC. Energy Convers. Manag. 2019, 181, 663–673. [Google Scholar] [CrossRef]
- Ma, R.; He, X.; Zheng, Y.; Zhou, B.; Lu, S.; Wu, Y. Real-world driving cycles and energy consumption informed by large-sized vehicle trajectory data. J. Clean. Prod. 2019, in press. [Google Scholar] [CrossRef]
- EU Project GasOn n.652816. Available online: https://ec.europa.eu/jrc/en/publication/eu-project-gason-n652816 (accessed on 15 May 2019).
- Pavlovic, J.; Marotta, A.; Ciuffo, B. CO2 emissions and energy demands of vehicles tested under the NEDC and the new WLTP type approval test procedures. Appl. Energy 2016, 177, 661–670. [Google Scholar] [CrossRef]
- Blanco-Rodriguez, D.; Vagnoni, G.; Holderbaum, B. EU6 C-Segment Diesel vehicles, a challenging segment to meet RDE and WLTP requirements. IFAC PapersOnLine 2016, 49, 649–656. [Google Scholar] [CrossRef]
- Mathissen, M.; Grochowicz, J.; Schmidt, C.; Vogt, R.; Farwick zum Hagen, F.H.; Grabiec, T.; Steven, H.; Grigoratos, T. A novel real-world braking cycle for studying brake wear particle emissions. Wear 2018, 414–415, 219–226. [Google Scholar] [CrossRef]
- Dzikuć, M.; Adamczyk, J.; Piwowar, A. Problems associated with the emissions limitations from road transport in the Lubuskie Province (Poland). Atmos. Environ. 2017, 160, 1–8. [Google Scholar] [CrossRef]
- Cha, J.; Lee, J.; Chon, M.S. Evaluation of real driving emissions for Euro 6 light-duty diesel vehicles equipped with LNT and SCR on domestic sales in Korea. Atmos. Environ. 2019, 196, 133–142. [Google Scholar] [CrossRef]
- Wang, Y.; Xing, Z.; Xu, H.; Du, K. Emission factors of air pollutants from CNG-gasoline bi-fuel vehicles: Part I. Black carbon. Sci. Total Environ. 2016, 572, 1161–1165. [Google Scholar] [CrossRef] [PubMed]
- Degraeuwe, B.; Weiss, M. Does the New European Driving Cycle (NEDC) really fail to capture the NOX emissions of diesel cars in Europe? Environ. Pollut. 2017, 222, 234–241. [Google Scholar] [CrossRef] [PubMed]
- Pavlovic, J.; Anagnostopoulos, K.; Clairotee, M.; Arcidiacono, V.; Fontaras, G.; Rujas, I.P.; Morales, V.V.; Ciuffo, B. Dealing with the Gap between Type-Approval and In-Use Light Duty Vehicles Fuel Consumption and CO2 Emissions: Present Situation and Future Perspective. Transp. Res. Rec. J. Transp. Res. Board 2018, 2672, 23–32. [Google Scholar] [CrossRef]
- Suarez-Bertoa, R.; Kousoulidou, M.; Clairotte, M.; Giechaskiel, B.; Nuottimäki, J.; Sarjovaara, T.; Lonza, L. Impact of HVO blends on modern diesel passenger cars emissions during real world operation. Fuel 2019, 235, 1427–1435. [Google Scholar] [CrossRef]
- Fontaras, G.; Zacharof, N.G.; Ciuffo, B. Fuel consumption and CO2 emissions from passenger cars in Europe—Laboratory versus real-world emissions. Prog. Energy Combust. Sci. 2017, 60, 97–131. [Google Scholar] [CrossRef]
- Dimaratos, A.; Tsokolis, D.; Fontaras, G.; Tsiakmakis, S.; Ciuffo, B.; Samaras, Z. Comparative Evaluation of the Effect of Various Technologies on Light-duty Vehicle CO2 Emissions over NEDC and WLTP. Transp. Res. Procedia 2016, 14, 3169–3178. [Google Scholar] [CrossRef]
- Bielaczyc, P.; Woodburn, J. Trends in Automotive emissions, fuels, lubricants, legislation and test methods—Present and future. A brief overview from the perspective of the International Organising Committee of the 4th International Emissions Symposium. Combust. Engines 2014, 3, 93–100. [Google Scholar]
- Wójcik, W.; Adikanova, S.; Malgazhdarov, Y.A.; Nabenovich, M.M.; Myrzagalieva, A.B.; Temirbekov, N.M.; Junisbekov, M.; Pawłowski, L. Probabilistic and Statistical Modelling of the Harmful Transport Impurities in the Atmosphere from Motor Vehicles. Rocznik Ochrona Środowiska 2017, 19, 795–808. [Google Scholar]
- Hooftman, N.; Messagie, M.; Van Mierlo, J.; Coosemans, T. A review of the European passenger car regulations—Real driving emissions vs local air quality. Renew. Sustain. Energy Rev. 2018, 86, 1–21. [Google Scholar] [CrossRef]
- Zhang, T.; Wang, P.; Chen, H.; Pei, P. A review of automotive proton exchange membrane fuel cell degradation under start-stop operating condition. Appl. Energy 2018, 223, 249–262. [Google Scholar] [CrossRef]
- Fonseca, N.; Casanova, J.; Valdés, M. Influence of the stop/start system on CO2 emissions of a diesel vehicle in urban traffic. Transp. Res. Part D Transp. Environ. 2011, 16, 194–200. [Google Scholar] [CrossRef]
- Ibarra, D.; Ramirez-Mendoza, R.A.; López, E.; Bustamante, R. Influence of the automotive Start/Stop system on noise emission: Experimental study. Appl. Acoust. 2015, 100, 55–62. [Google Scholar] [CrossRef]
- Ji, C.; Yu, M.; Wang, S.; Zhang, B.; Cong, X.; Feng, Y.; Lin, S. The optimization of on-board H2 generator control strategy and fuel consumption of an engine under the NEDC condition with start- stop system and H2 start. Int. J. Hydrogen Energy 2016, 41, 19256–19264. [Google Scholar] [CrossRef]
- Ozdemir, A.; Mugan, A. Stop/Start System Integration to Diesel Engine and System Modelling & Validation. IFAC Proc. Vol. 2013, 46, 95–100. [Google Scholar]
- Do Stop-Start Systems Really Save Fuel? Available online: https://www.edmunds.com (accessed on 22 March 2019).
- Tsiakmakis, S.; Fontarasa, G.; Anagnostopoulos, K.; Ciuffo, B.; Pavlovic, J.; Marotta, A. A simulation based approach for quantifying CO2 emissions of light duty vehicle fleets. A case study on WLTP introduction. Transp. Res. Procedia 2017, 25, 3898–3908. [Google Scholar] [CrossRef]
- Ciuffo, B.; Fontaras, G. Models and scientific tools for regulatory purposes: The case of CO2 emissions from light duty vehicles in Europe. Energy Policy 2017, 109, 76–81. [Google Scholar] [CrossRef]
- Guo, H.; Cao, D.; Chen, H.; Sun, Z.; Hu, Y. Model predictive path following control for autonomous cars considering a measurable disturbance: Implementation, testing, and verification. Mech. Syst. Signal Process. 2019, 118, 41–60. [Google Scholar] [CrossRef]
- Su, G.; Li, N.; Yildiz, Y.; Girard, A.; Kolmanovsky, I. A Traffic Simulation Model with Interactive Drivers and High-fidelity Car Dynamics. IFAC PapersOnLine 2019, 51, 384–389. [Google Scholar] [CrossRef]
- Martynov, S.B.; Mason, D.J.; Heikal, M.R. Numerical Simulation of Cavitation Flows Based on Their Hydrodynamic Similarity. Int. J. Engine Res. 2006, 7, 283–296. [Google Scholar] [CrossRef]
- Mai, M.; Wang, L.; Prokop, G. Advancement of the car following model of Wiedemann on lower velocity ranges for urban traffic simulation. Transp. Res. Part F Traffic Psychol. Behav. 2019, 61, 30–37. [Google Scholar] [CrossRef]
- Illgen, S.; Höck, M. Electric vehicles in car sharing networks—Challenges and simulation model analysis. Transp. Res. Part D Transp. Environ. 2018, 63, 377–387. [Google Scholar] [CrossRef]
- Markowski, A. Application of discrete event simulation algorithms for evaluation of data transmission delay in distributed measuring and control system. Przegląd Elektrotechniczny 2018, 94, 21–25. [Google Scholar]
- Campbell, T.; Owhadi, H.; Sauvageau, J.; Watkinson, D. On Testing the Simulation Theory. Int. J. Quantum Found. 2017, 3, 78–99. [Google Scholar]
- Łatuszyńska, M. Computer simulation in exprimental economics. Zeszyty Naukowe Uniwersytetu Sczecińskiego 2015, 36, 1–14. [Google Scholar] [CrossRef][Green Version]
- Firmansyah; Aziz, A.A.R.; Heikal, M.R.; Zainal A., Ezrann Z.; Ezrann Z. Zainal, A. Zainal A. Diesel/CNG Mixture Autoignition Control Using Fuel Composition and Injection Gap. Energies 2017, 10, 1639. [Google Scholar] [CrossRef]
- Convery, F.; Ferreira, S.; Ryan, L.B. Stimulating the use of biofuels in the European Union: Implications for climate change policy. Energy Policy 2006, 34, 3184–3194. [Google Scholar]
- Directive 2009/28/EC of the European Parliament and of the Council of 23 April 2009 on the Promotion of the Use of Energy from Renewable Sources and Amending and Subsequently Repealing Directives 2001/77/EC and 2003/30/EC. Available online: https://eur-lex.europa.eu (accessed on 22 March 2019).
- Jakubowski, W.; Wituszyński, K.P. Analysis of the zi engines cars exhaust-gas toxicity in the light of valid traffic regulations. Acta Mechanica et Automatica 2009, 3, 98–100. [Google Scholar]
- The New R33 BlueDiesel Fuel with a Component from Renewable Sources. Available online: https://www.greencarcongress.com (accessed on 20 March 2019).
- Tucki, K.; Bączyk, A.; Klimkiewicz, M.; Mączyńska, J.; Sikora, M. Comparison of parameters and composition of exhaust fumes of engine fuelled by rapeseed oil and its mixtures with diesel and gasoline. In Proceedings of the 2nd International Conference on the Sustainable Energy and Environmental Development (SEED’17), Kraków, Poland, 14 November 2017; Volume 214, pp. 1–9. [Google Scholar]
- Dafnomilis, I.; Hoefnagels, R.; Pratama, Y.W.; Schott, D.L.; Lodewijks, G.; Junginger, M. Review of solid and liquid biofuel demand and supply in Northwest Europe towards 2030—A comparison of national and regional projections. Renew. Sustain. Energy Rev. 2017, 78, 31–45. [Google Scholar] [CrossRef]
- Green Fuels and Human Health Toxicity of Engine Emission from 1st and 2nd Generation Biodiesel Fuels Pol-Nor/201040/72/2013. Available online: http://www.fuelhealth.eu (accessed on 16 March 2019).
- El-Faroug, M.O.; Yan, F.; Luo, M.; Turkson, R.F. Spark ignition engine combustion, performance and emission products from hydrous ethanol and its blends with gasoline. Energies 2016, 9, 984. [Google Scholar] [CrossRef]
- Azadi, P.; Malina, R.; Barrett, S.R.H.; Kraft, M. The evolution of the biofuel science. Renew. Sustain. Energy Rev. 2017, 76, 1479–1484. [Google Scholar] [CrossRef]
- Kupczyk, A.; Mączyńska, J.; Sikora, M.; Tucki, K.; Żelaziński, T. Stan i perspektywy oraz uwarunkowania prawne funkcjonowania sektorów biopaliw transportowych w Polsce. Roczniki Naukowe Ekonomii Rolnictwa i Rozwoju Obszarów Wiejskich 2017, 104, 39–55. [Google Scholar] [CrossRef]
- Jung, S.; Leng, Y.; Wang, C.Y. Role of CO2 in Methanol and Water Transport in Direct Methanol Fuel Cells. Electrochim. Acta 2014, 134, 35–48. [Google Scholar] [CrossRef]
- Flekiewicz, M.; Kubica, G.; Marzec, P. The possibilities of using DME (BioDME), as an additive to conventional gaseous fuels in SI engine. Combust. Engines 2017, 171, 150–155. [Google Scholar]
- Ghazal, O.H. A theoretical study of the SI engine performance operating with different fuels. Int. J. Mech. Mechatron. Eng. 2013, 7, 1–4. [Google Scholar]
- Zembowicz, J. Fiat Seicento, 1st ed.; Wydawnictwo Komunikacji i Łączności: Warsaw, Poland, 2010; pp. 10–220. [Google Scholar]
- Romaniszyn, K.M. Evaluation of the differences in determining fuel consumption for a real car based on universal and dynamic characteristics. Combust. Engines 2002, 2, 48–54. [Google Scholar]
- Dobras, S.; Więcław-Solny, L.; Chwoła, T.; Krótki, A.; Wilk, A.; Tatarczuk, A. Renewable methanol as a fuel and feedstock in the chemical industry. Zeszyty Naukowe Instytutu Gospodarki Surowcami Mineralnymi i Energią PAN 2017, 98, 27–37. [Google Scholar]
- Kordylewski, W. Spalanie i Paliwa, 4th ed.; Oficyna Wydawnicza Politechniki Wrocławskiej: Wroclaw, Poland, 2005; pp. 79–433. [Google Scholar]
- Bajerlein, M.; Dobrzyński, M.; Fuć, P.; Lijewski, P.; Merkisz, J.; Ziółkowski, A.; Rymaniak, Ł. Exhaust emission in NEDC test simulated at a dynamic engine test bed. Combust. Engines 2013, 52, 701–707. [Google Scholar]
- Botwińska, K.; Mruk, R.; Słoma, J.; Tucki, K.; Zaleski, M. Simulation of diesel engine emissions on the example of Fiat Panda in the NEDC test. In Proceedings of the E3S Web Conference 2017, Polanica Zdrój, Poland, 13–15 September 2017; Volume 19, pp. 1–6. [Google Scholar]
- Mazanek, A. An overview of engine and exploitation research methods taking into account the current and future quality requirements on motor fuels. Nafta Gaz 2014, 70, 534–540. [Google Scholar]
- Botwińska, K.; Mruk, R.; Tucki, K.; Wata, M. Simulation of fuel demand for wood-gas in combustion engine. In Proceedings of the E3S Web Conference 2017, Polanica Zdrój, Poland, 13–15 September 2017; Volume 19, pp. 1–6. [Google Scholar]
- Zhu, G.; Liu, J.; Fu, J.; Xu, Z.; Guo, Q.; Zhao, H. Experimental study on combustion and emission characteristics of turbocharged gasoline direct injection (GDI) engine under cold start new European driving cycle (NEDC). Fuel 2018, 215, 272–284. [Google Scholar] [CrossRef]
- Campbell, S.L.; Chancelier, J.P.; Nikoukhah, R. Modeling and Simulation in Scilab/Scicos with ScicosLab 4.4, 1st ed.; Springer: New York, NY, USA, 2006; pp. 73–155. [Google Scholar]
- Tucki, K.; Mruk, R.; Bączyk, A.; Botwińska, K.; Woźniak, K. Analysis of the Exhaust Gas Emission Level from a Diesel Engine with Using Computer Simulation. Rocznik Ochrona Środowiska 2018, 20, 1095–1112. [Google Scholar]


| Symbol | Description | Unit |
|---|---|---|
| air demand constant for the fuel mixture | [gair/gfuel] | |
| air demand constant for petrol 95 A | [gair/gfuel] | |
| air demand constant for the additive | [gair/gfuel] | |
| mass fraction of the additive in the mixture | [gbiofuel/gmixture] | |
| calorific value for the fuel mixture | [kJ/g] | |
| calorific value for petrol 95 B | [kJ/g] | |
| calorific value for the additive | [kJ/g] | |
| momentary speed of the vehicle in the test | [m/s] or [km/h] | |
| end time of simulation | [s] | |
| vehicle acceleration | [m/s2] | |
| moment value of force on wheels | [N] | |
| wheel radius | [m] | |
| power transmission ratio for torque C | [-] | |
| drivetrain ratios for rotational speed D | [-] | |
| momentary torque value on vehicle transmission | [N·m] | |
| instantaneous speed value on vehicle transmission | [rad/s] | |
| hourly fuel consumption function dependent on speed and torque | [g/h] | |
| rotational engine speed | [rad/s] | |
| engine torque | [N⋅m] | |
| fuel flux | [g/s] | |
| air flux | [g/s] | |
| energy flux supplied by the fuel | [J/s] | |
| efficiency | [-] |
| Parameter | Petrol 95 | Ethanol | Methanol | DME |
|---|---|---|---|---|
| Carbon content [%] | 86.4 | 52.1 | 37.4 | 52.1 |
| Hydrogen content [%] | 13.6 | 13.1 | 12.5 | 13.1 |
| Oxygen content [%] | 0.0 | 34.7 | 49.9 | 34.7 |
| Calorific value [MJ/kg] | 45.0 | 30.4 | 20.1 | 28.8 |
| Air demand [gair/gfuel] | 14.7 | 9.06 | 6.5 | 9.06 |
| Additive [%] | 0% | 10% | 20% | 30% | 40% | 50% | 60% | 70% | 80% | 90% | 100% |
|---|---|---|---|---|---|---|---|---|---|---|---|
| Ethanol [kg] | 1.6378 | 1.6256 | 1.6125 | 1.5985 | 1.5835 | 1.5673 | 1.5498 | 1.5308 | 1.5102 | 1.4877 | 1.4630 |
| Methanol [kg] | 1.6378 | 1.6356 | 1.6330 | 1.6302 | 1.6269 | 1.6232 | 1.6189 | 1.6137 | 1.6076 | 1.6000 | 1.5907 |
| DME [kg] | 1.6378 | 1.6360 | 1.6249 | 1.6176 | 1.6098 | 1.6012 | 1.5920 | 1.5818 | 1.5705 | 1.5581 | 1.5443 |
| Ethanol st. [kg] | 1.4490 | 1.4382 | 1.4267 | 1.4143 | 1.4010 | 1.3867 | 1.3712 | 1.3544 | 1.3362 | 1.3162 | 1.2944 |
| Methanol st. [kg] | 1.4490 | 1.4470 | 1.4448 | 1.4423 | 1.4394 | 1.4361 | 1.4323 | 1.4277 | 1.4223 | 1.4156 | 1.4073 |
| DME st. [kg] | 1.4490 | 1.4435 | 1.4376 | 1.4312 | 1.4243 | 1.4167 | 1.4085 | 1.3995 | 1.3895 | 1.3785 | 1.3663 |
© 2019 by the authors. Licensee MDPI, Basel, Switzerland. This article is an open access article distributed under the terms and conditions of the Creative Commons Attribution (CC BY) license (http://creativecommons.org/licenses/by/4.0/).
Share and Cite
Tucki, K.; Mruk, R.; Orynycz, O.; Wasiak, A.; Botwińska, K.; Gola, A. Simulation of the Operation of a Spark Ignition Engine Fueled with Various Biofuels and Its Contribution to Technology Management. Sustainability 2019, 11, 2799. https://doi.org/10.3390/su11102799
Tucki K, Mruk R, Orynycz O, Wasiak A, Botwińska K, Gola A. Simulation of the Operation of a Spark Ignition Engine Fueled with Various Biofuels and Its Contribution to Technology Management. Sustainability. 2019; 11(10):2799. https://doi.org/10.3390/su11102799
Chicago/Turabian StyleTucki, Karol, Remigiusz Mruk, Olga Orynycz, Andrzej Wasiak, Katarzyna Botwińska, and Arkadiusz Gola. 2019. "Simulation of the Operation of a Spark Ignition Engine Fueled with Various Biofuels and Its Contribution to Technology Management" Sustainability 11, no. 10: 2799. https://doi.org/10.3390/su11102799
APA StyleTucki, K., Mruk, R., Orynycz, O., Wasiak, A., Botwińska, K., & Gola, A. (2019). Simulation of the Operation of a Spark Ignition Engine Fueled with Various Biofuels and Its Contribution to Technology Management. Sustainability, 11(10), 2799. https://doi.org/10.3390/su11102799