Article

Economic Analysis of Perennial Crop Systems in Dak Lak Province, Vietnam

1
Faculty of Economics, Tay Nguyen University, 567 Le Duan Street, Buon Ma Thuot 630000, Vietnam
2
Economics and Rural Development, Gembloux Agro-Bio Tech, University Liège, 5030 Gembloux, Belgium
3
Rural and Rural Development, Gembloux Agro-Bio Tech, University of Liège, 5030 Gembloux, Belgium
*
Author to whom correspondence should be addressed.
Sustainability 2019, 11(1), 81; https://doi.org/10.3390/su11010081
Submission received: 26 November 2018 / Revised: 13 December 2018 / Accepted: 15 December 2018 / Published: 24 December 2018

Abstract

:
Dak Lak province, Central Highlands, Vietnam presents an interesting case in perennial crop systems, of which coffee and black pepper are the two premier commodities and contribute a large part to economic growth provincially and at the national level. In recent years, in addition to mono-cropping systems, intercropping systems for diversification have developed quickly. This paper focuses on (1) comparing the economic efficiency of mono-coffee systems (MCSes), mono-pepper systems (MPSes), and coffee and pepper intercropping (CPI) by analyzing startup cost, annual cost, and profits; and (2) identifying the main factors affecting farmers’ decisions to convert their crop systems. The study was carried out by investigating 90 perennial crop samples using the three perennial crop systems (MCSes, MPSes, and CPI) in 2017–2018. Additionally, in-depth interviews and focus group discussion (FGD) methods were applied to collect more information about the operations of each system. Another survey with 37 samples (new plantations) was carried out to compute the startup cost. The findings showed evidence that MCSes had the lowest startup and annual costs, whereas MPSes had the highest costs of the three perennial crop systems. MCSes used less manure or compost in the initial setup and overused chemical fertilizer in annual production. Similarly, MPSes had high pesticide-stimulant costs in the production process to sustain crop development. The study indicated that CPI not only had the highest economic efficiency, but also created the best family employment opportunities of the three systems. Additionally, the study found some social factors that strongly influenced farmers’ decisions to shift their cropping system: These included ethnicity, education, training, and crop failure, in addition to economic factors (profits).

1. Introduction

Vietnamese agriculture plays an important role in economic growth, providing 20% of national gross domestic product (GDP) [1]. After the Renovation program (known as Doi Moi), Vietnam engaged in international trade and freer investment. Cash crops (annual and perennial crops) were regarded by the government as principal drivers for crop-growing households and the rural population to reduce poverty [1]. In this mix, black pepper and coffee were considered major agricultural products in Vietnam [2]. During the periods of the 2000s and 2011–2013, the perennial crop growing area increased from 2.2 million to 3.8 million hectares (about 7% per year), and most of this expansion was for coffee and rubber exports [3]. Coffee is one of Vietnam’s 10 most important export commodities, and Vietnam ranked second in coffee production after Brazil in the 1990s and third place behind Brazil and Colombia in 2014 (about 2.7 billion USD) [4,5,6]. Unfortunately, enormous challenges and stressors, such as fluctuating commodity prices, climatic variability (drought), disease, high numbers of aging trees, and other degradations affected yields, input costs, and the gross income of farmers [7,8]. In Dak Lak province, the agricultural sector was identified as a “top area” in economic growth, with the cultivation sector reaching 73% of GDP and agricultural growth reaching 2.6–3%/year [9,10]. Remarkably, coffee was a primary export commodity for the province (i.e., its category dominated 40% of the national output of coffee and 30% of the total coffee area in Vietnam [5,6,11]), and the black pepper area was second only to Binh Phuoc province, with 16 thousand hectares in 2016. This has played an important role in the provincial economy in recent years [6]. Clearly, the development of the coffee sector and other areas is related closely to the socioeconomic growth of Dak Lak (cited by the head of the province). However, low productivity, pest infestation, and the collapse of coffee prices has caused economic losses for coffee producers and traders, discouraging people from investing in the future of coffee. Farmers have faced indebtedness, as it is difficult to repay loans borrowed in better times to expand coffee areas [12]. As a result of different approaches to reducing problems, risks, and uncertainty, farmers have switched to coffee and pepper intercropping, with a higher value in recent years [13,14]. Diversification and the replaying of coffee plantations to other crops was a natural adaptation of farmers to help secure production under vulnerable conditions [7,12,15,16,17,18,19,20,21,22]. Diversification is not only a risk management strategy (i.e., spreading risks and creating buffers), but is also a response to price changes [16,17,18,19,20,21,22,23]. For instance, farmers had converted from mono-cropping to crop diversification by an estimated 15% in 2009 [22], and continued expanding in the following years (citied by the head of DARD (Department of Agriculture and Rural Development) Dak Lak). However, farm diversification is not always easy, as there are no clear profit options, and there are financial costs for change as well as the reallocation of labor to other activities [18].
Many previous studies have examined the economic efficiency of perennial crops. For instance, there has been an economic diversification between subsistence food production and both coffee and cash food production [2], the production of corn with coffee has resulted in increased efficiency [24], and mono-coffee has been less efficient than coffee and industrial crop intercropping due to the presence of economies of scope [25]. Farmers have been interested in the diversification of their Robusta with pepper and vanilla, but do not want to reduce their potential Robusta yields [18]. Coffee was intercropped with industrial crops such as avocado, durian, and pepper to bring a profit average of 85 million VND (Vietnamese Dong (national currency of Vietnam)) /ha [26]. However, evaluating and comparing economic efficiency among mono-cropping systems and specific types of crops has not been implemented [25], or the study was carried out using a small sample (30 samples) [26].
This study was undertaken to focus on comparing the economic efficiency between three perennial crop systems: A mono-coffee system (MCS), a mono-pepper system (MPS), and coffee and pepper intercropping (CPI). Another aim was identifying factors affecting farmers’ decisions to shift cropping systems. This was necessary to inform farmers and local authorities of their choices and for local regulations to improve the sustainability of perennial crop production.

2. Materials and Methods
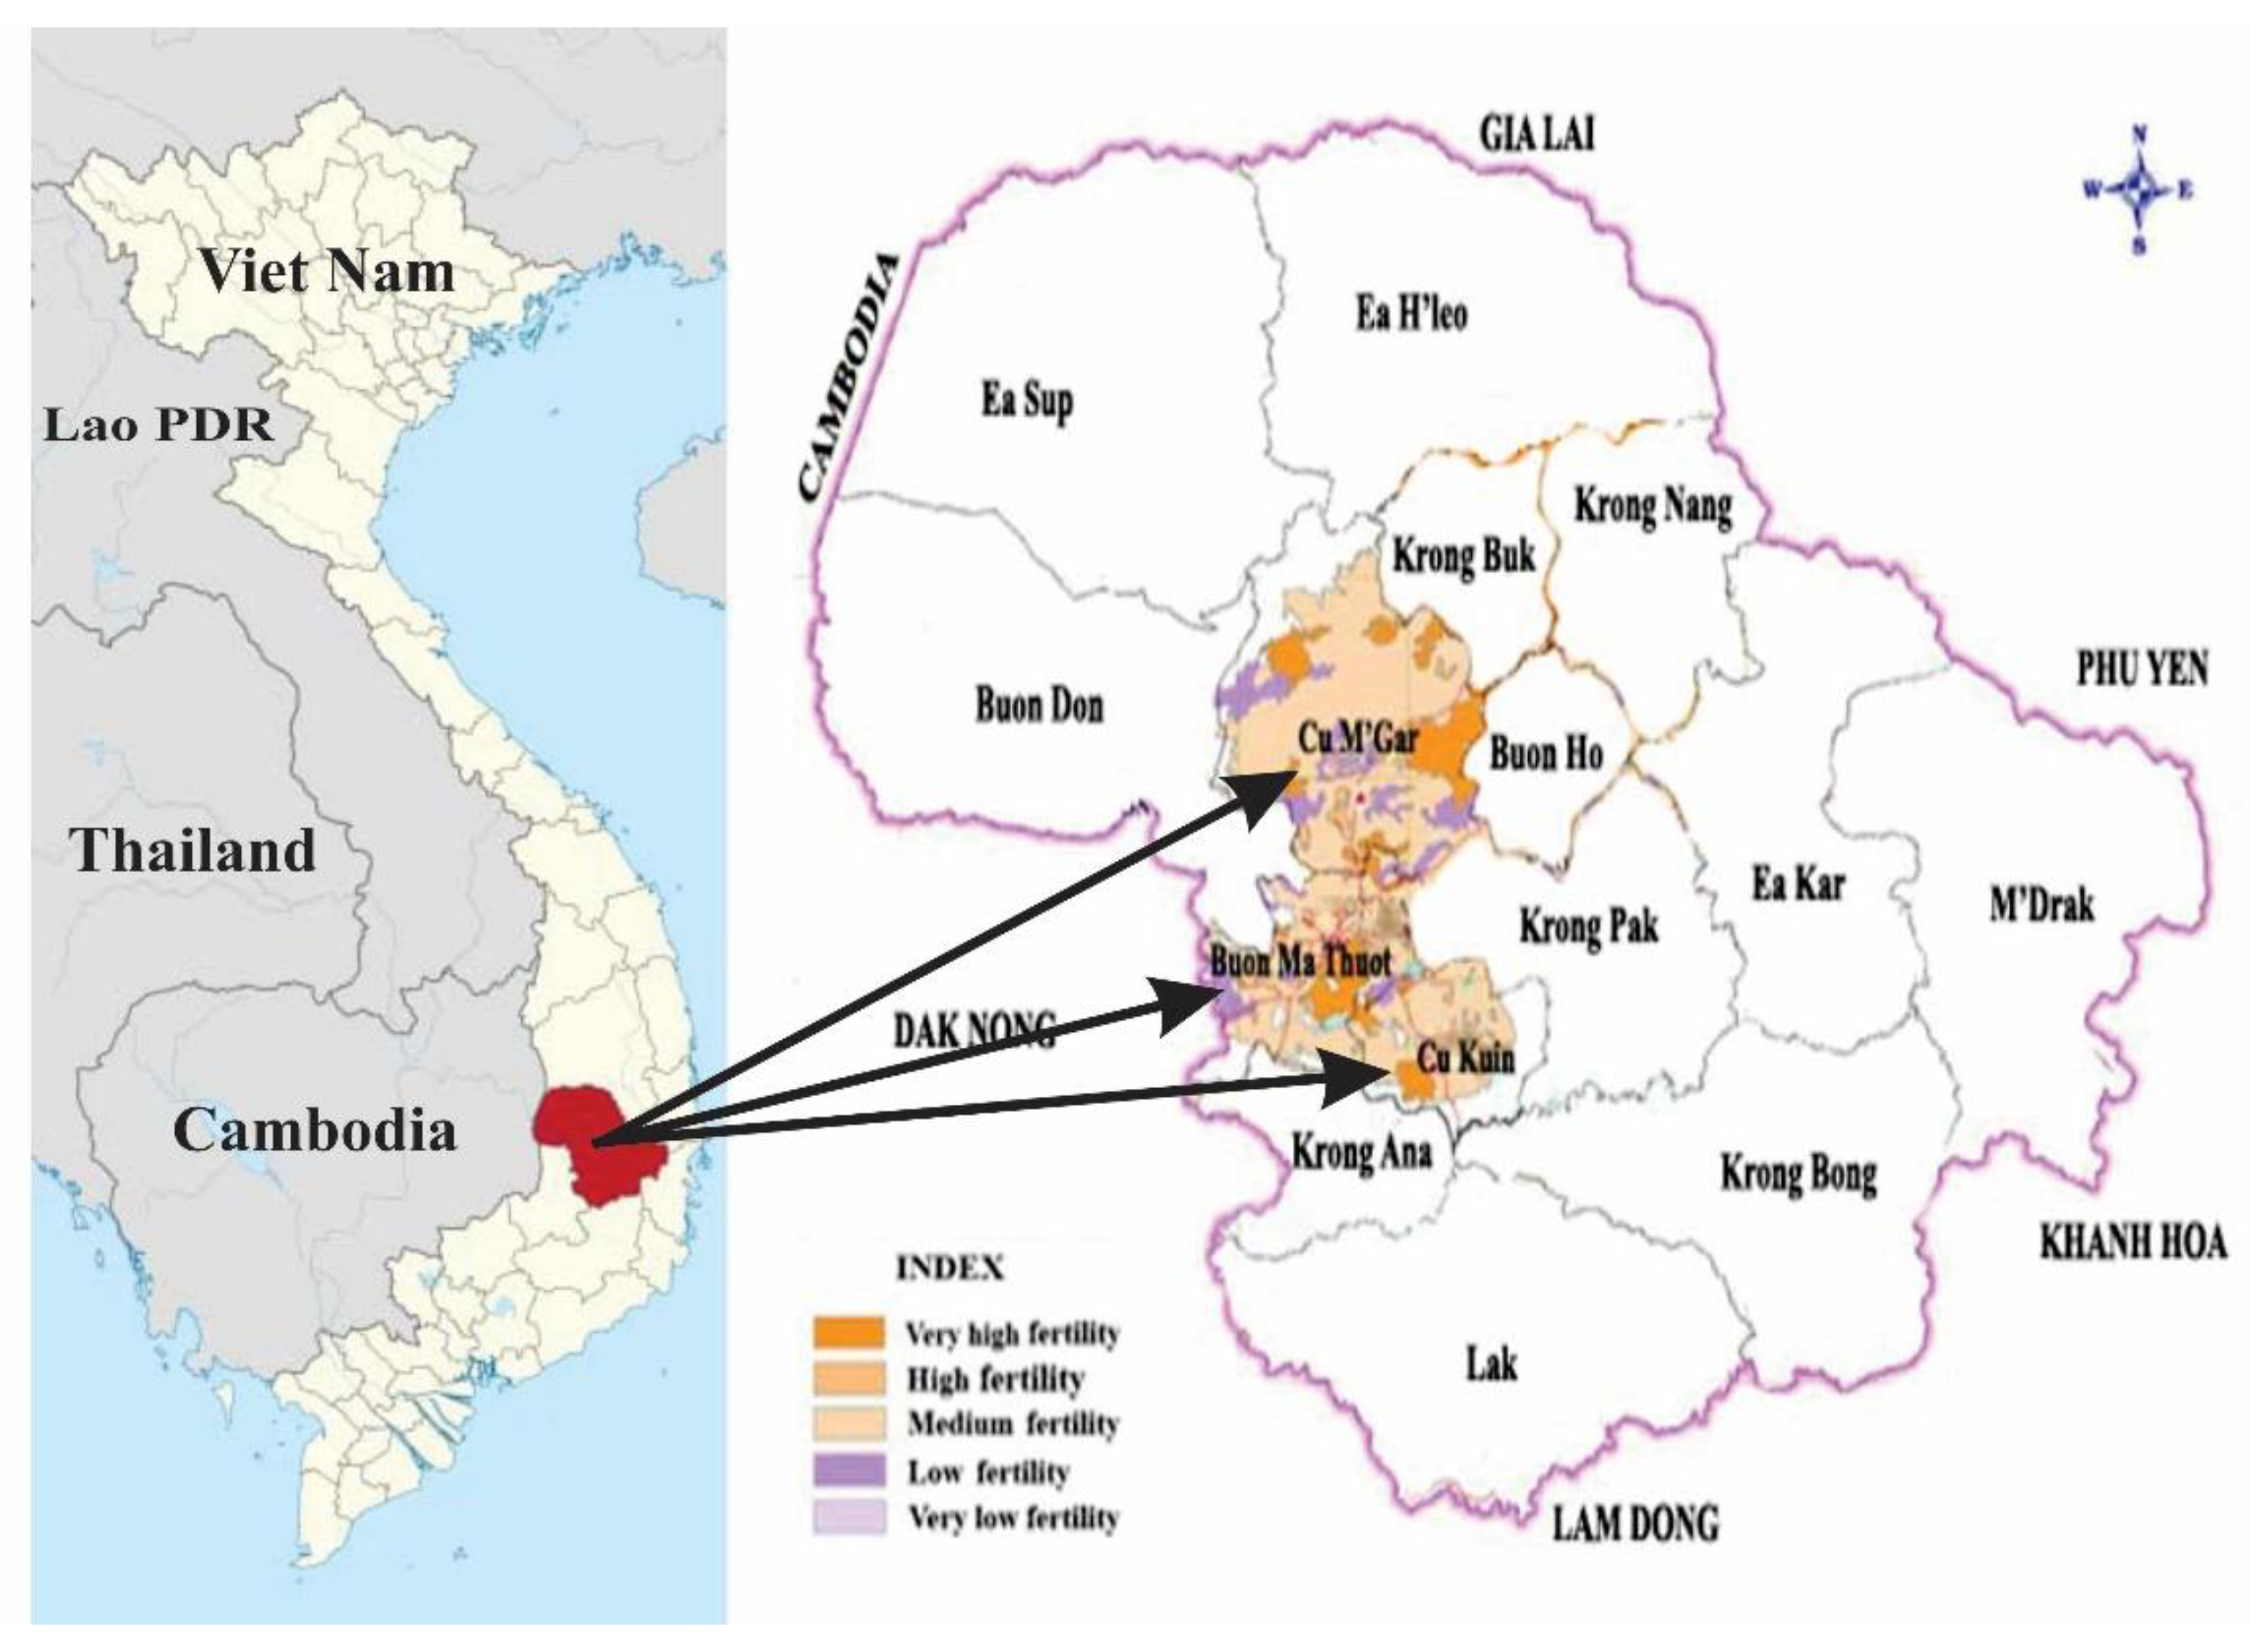
2.1. Study Site

Dak Lak province is an agricultural province suitable for coffee and black pepper production, with appropriate temperatures and soil as well as two clear seasons, rainy and dry. In many years, coffee and pepper provide great value. Between 2005 and 2016, coffee and pepper increased in both area and productivity, though export earnings had fluctuations. In 2016, the area of coffee and pepper production represented 70% and 9.6%, whereas the export value reached 86% and about 12%, respectively (Figure 1).
Dak Lak province is divided into 13 districts, one district-level town, and one city, all involved in perennial crop production. Cu M’gar and Cukiun districts are the largest coffee- and pepper-growing area regions. Buon Ma Thuot is a central city with favorable conditions (market, transportation, agri-services), and has the longest established perennial crop system. Three regions have more heterogeneous (fertility and weather) conditions and are suitable for perennial crops (see Figure 2). Cu M’gar district, Cu Kuin district, and Buon Ma Thuot city are examined in this study (see Figure 2).

2.2. Data Collection

2.2.1. Focus Group Discussions (FGDs)

Three FGDs were conducted with (7–8 participants) who had production experience. The aim was to collect and understand farm activities and difficulties in production.

2.2.2. Key Informant Interviews

Both observation trips and in-depth interviews with key people (elderly people, heads of communes, extension workers) were used to collect preliminary information on field situations and to get to know farmers: These provided complementary information.

2.2.3. Household Surveys

Households were selected by a stratified random sampling method of the three perennial systems including MCS, MPS, and CPI. The 86 producers selected provided information for each of the three systems. In fact, the households list provided 90 samples for data about perennial crop production because some households owned more than one piece. The farms were between 0.5 ha and 2 ha, which is similar to the average area of local farms [10].
Additionally, 37 farms were surveyed a second time to collect information (farm age was about 1–3 years) to evaluate the startup cost completely due to the long life spans of coffee and pepper plantations (25 years was typical in this study). The surveys were conducted from December 2017 to April 2018. The perennial crop sample distribution is presented in Table 1.

2.3. Data Analysis

In this study, farm profile, cost-return, and comparative analysis were used to examine the differences in economic efficiency, in addition to descriptive statistical analysis (means, percentages, charts, and growth rate). Many indicators such as production cost, revenue, value added, and profit indicate which cropping systems have the best economic performance for households [27]. The Kruskal–Wallis and Mann–Whitney methods were applied to the test results.
Moreover, a binary regression model of the most common approaches was used to examine farmers’ decisions between two alternatives [28]. Using socioeconomic characteristics, this model tests the probability of a farmer’s decision to change current systems to another. Accordingly [29,30], the logistic binary regression model equation was:
log e ( P ( Y = 1 ) P ( Y = 0 ) ) = B 0 + j = 1 k B j X i j ,
where Pi = probability of the event occurring, B0 = a constant term, Bj = a coefficient, and X = independent variables.
Let FDT be Loge ( P ( Y = 1 ) P ( Y = 0 ) ) , the explanation of the variables on farmers’ decisions to have perennial crops was linear:
FDT (farmer’s decision transformation) = B0 + B1Gender + B2Ethnicity + B3Education + B4Experience + B5Training + B6Relatedfamilylabor + B7Lack of water + B8Crop failure + B9Profit
where gender is a dummy (1 if male, 0 if female); ethnicity is of the head of household (HH) and is a dummy (1 if Kinh, 0 if others); education level is of the HH and is in years; experience is of the HH and is in years; training is a percentage of the HH and is a dummy (1 if yes, 0 if no); related family labor is number of people; lack of water is a percentage of the household and is a dummy (1 if yes, 0 if no); crop failure is a percentage of the household and is a dummy (1 if yes, 0 if no); and profit/cost is a percentage.

3. Results

3.1. Information on Farm Households and Perennial Crop Systems in Dak Lak Province

The Characteristics of Perennial Crop Households and Farms

Table 2 describes the characteristics of perennial crop households in this research study.
Most of the surveyed households were Kinh people and of northern ethnicities (Tay, Dao) who were migrants from New Economic Zones [31] or came due to other unregulated migration, estimated at 68%. There were 30% female HHs, except for the Ede, where 38% were female HHs. In terms of education and experience, most had finished the 8th year of school of Vietnamese education, except some illiterate Ede ethnic households. Farmers had significant experience in perennial crop production (around 10 years), which was provided by their parents, neighbors, social media, and worker extensions. Additionally, 47% of surveyed farmers stated that they participated in training courses, which are implemented by the local authorities and companies.
Regarding farm size, the total cultivated area was less than 2 ha per household, including perennial crop area (coffee, pepper, cashews) as well as annual crop area (rice, beans, corn). The surveyed area was similar to official reports of the Dak Lak People Committee, 2017 [3,9,32]. In particular, the average perennial crop area was small, about one hectare per family. This was because in the past, the total productive areas were quite large, but families have now shared the land with their children as they grew up, got married, and raised families. Another reason is that most households were migrants from outside the area after the 2000s. It is not easy to own large cultivated pieces of land because of high land prices.
Family members provided labor, with 90% working full-time as husband and wife. Some families were supported by their children. Other children went to school or became workers in nearby provinces. As a result, most households had to use hired labor, especially in the harvest season. In this study, the average family contribution to farm labor was estimated at 2.23 members.
Financially, about half of the farms observed borrowed from financial organizations both formal and informal, where a part of a loan was used for annual investment costs (buying fertilizer, pesticide, and hired labor), and the rest was used for ongoing costs, building a house, or supporting children’s education. In addition, interviewees described their irrigation source, which plays an important role in perennial crop production (i.e., irrigation helps coffee to break the flower bud and triggers homogeneous blossoming and cherry development). Growers have been faced with drought challenges (38% of households) and dying crops (41%), which has created difficulties in sustainable production [33,34]. The results showed that over 90% of interviewees were using well water rather than surface resources such as dams, streams, and lakes.
The profile of three perennial crop systems is presented in Table 3.
For MCSes, the average growing area was estimated at 1.1 hectare. The density reached 958 trees per hectare, which was a lower density than the technical standard (1.100 trees/ha) [35]. The explanation for the low density was that plantations get pet and disease infections (41%), with many trees dying. In FGDs, the farmers admitted that MCS was a relatively simple system to plant and care for, especially Robusta coffee (i.e., over 90% of survey households had Robusta) [18]. However, the yield reached only 2.1 tonnes per hectare because of the high proportion of aging tree stock (17 years in this study) and the fluctuation of weather.
MPSes were started initially from residential gardens of very small acreage in the last decades. In recent years, they have been developed strongly due to favorable prices. However, the average pepper size was the smallest scale compared to all the rest, by 0.8 ha. According to respondents in the survey, instead of renewing an old coffee plantation, they shifted to pepper cultivation to take advantage of good prices in the following two ways: First, pepper was planted in vacant spaces of old coffee plantations, and after that, farmers cut down coffee trees to cultivate MPSes. Second, old or unproductive coffee orchards were removed. After that, pepper was planted in the area. This is why pepper density was not higher, only 1344 trees/ha. Unfortunately, black pepper is a disease-sensitive crop (i.e., pepper growers confront disease), and black pepper disease affected about 2000 ha in 2017 (equal to 13.2% of all plant diseases in the whole country, including foot rot or quick wilt disease, Pollu disease, slow decline or slow wilt, and stunt disease), but the dramatic collapse of coffee and rubber prices as well as high pepper prices encouraged farmers (the Dak Lak People Committee, 2018). Most MPSes have been planted since the 2000s, which is quite recent (7.43 years), to create high yields estimated at 2.3 tonnes/ha. The surveyed data showed that MPSes were cultivated in an unregulated way (in areas not zoned for farming), with more wooden and concrete pillars than live plants. Rubber trees could be used as pillars and play areas, and ponds and rice fields were taken over to have more land to grow pepper. This was because growers expected pepper crop development to gain quantity quickly as well as propagate commercially through cutting as soon as possible, which was revealed by the farmers.
In terms of CPI, as a diversification model it has the existence of economies of diversification, economies of scale, and diversification efficiencies at the farm level [7,35,36,37,38,39]. Moreover, pepper is intercropped with other crops to generate higher yields than mono-cropping, which reduces pet and disease incidence, spreads risk, makes an effective use of labor, and mitigates market risks [25,40,41,42,43].
In Dak Lak province, CPI was formed from coffee and pepper, which were grown together in the same field, in which pepper was grown initially into a coffee garden for planting as a shade tree. Over time, this model has been widely and enthusiastically used in farmers’ plantations. According to the surveyed data, CPI planting was quite young (7.3 years of pepper, 13 years of coffee, and 1.0 ha of plot size). Besides that, the density was mentioned to be estimated at 964 coffee trees and 914 pepper trees per ha, including two intercropping methods: Group (a small sub-area of coffee and pepper was planted in the orchard) and intersection (two coffee rows or three coffee rows or five coffee rows to intercrop one pepper row, where pepper was designed at the intersection point of coffee holes). Additionally, the yield of CPI was estimated at 2.3 tonnes of coffee and 1.8 tonnes of pepper/hectare (Table 3). According to interviewees, high pepper density led to decreased yield due to the competition for space and light. Furthermore, many respondents admitted that there were some production difficulties due to specific techniques (i.e., irrigation and harvesting).

3.2. The Economic Analysis of Perennial Crop Farming Systems

Input Cost

Because coffee and pepper have a long life span, the cost needs to identify both the startup and annual costs, which play an important role in influencing the growth and productivity of perennial crop systems. The specific cost of establishment is presented in Table 4.
This startup cost was estimated at 38.5 million for MCSes, 147.5 million for MPSes, and 65.3 million VND per hectare for CPI. It included various semi-costs such as land preparation, materials, and labor. The surveyed results showed that most plantations were renewed by replacing old and unproductive coffee trees (95%). Specific startup costs were analyzed: Concerning land preparation, they focused on cutting trees, ploughing, and cleaning operations to grow new crops. Normally, farmers often hire contractors to do these activities instead of doing it themselves. Buying old coffee tree also helped farmers to pay a part for this cost. Therefore, this cost occupied 4 million: 4.9 million and 3.3 million VND per hectare (see Table 4).
Materials expenditures had the highest cost of startup costs, including pillars, digging holes, nursery costs, fertilizer, and pesticide. The study showed that MPSes had higher material costs than MCSes and CPI, by 130.5 million VND per hectare, in which the pillar cost (either concrete or wooden) was dominant in the materials costs, making up about 90 million VND per hectare.
According to farmers, pepper was planted immediately along with the pillars, and grew up better than pepper on its own. Additionally, farmers harvested pepper as soon as possible to take advantage of the high pepper price of the market, which attracted farmers to use concrete and wooden pillars to grow black pepper.
In contrast, CPI had lower pillar costs than MPSes due to using a live plant as support propagated by the farmer or purchased at a low cost. The disadvantage of CPI was the farmers’ costs of taking care of the plant (at least the first year after planting the pepper crop), estimated at 15.3 million VND (concrete and wooden pillar price was around 160,000 VND/pillar, whereas a live plant support was about 7,000 VND/pillar (the exchange is 1 USD = 23,020 VND). Therefore, based on this, a recommendation for reducing establishment costs in MPSes and CPI was using a live plant instead of a wooden or concrete pillar.
One kind of material cost was the nursery, where plants were propagated by family or purchased certificated. According to local authorities, propagated coffee plants were provided for farmers to replace old coffee trees, but there was not any policy for new pepper plants. As a result, the nursery propagated pepper for MPSes, which was the highest cost compared to CPI and MCSes, at 9.6 million VND per hectare.
The next cost was fertilizer, manure, and chemical fertilizer. MPSes and CPI needed to have applied high levels of fertilizer (23 million and 19 million VND per hectare, respectively), whereas MCSes only used 3 million VND per hectare (see Table 4). Coffee farmers used less manure or compost in the startup process, which influenced the growth quality of the crop and productivity [44]. The study found that most farmers applied more manure or compost than chemical fertilizer. Manure (created from the waste of pigs, cows, chickens, and coffee straw materials in the first week after planting), including farmer-produced (30%) and purchased (70%), was given at 10 to 20 kg/tree.
As for the labor cost at planting, labor was used for cleaning, preparing plantation, digging holes, planting nursery plants, and setting pillars, where MPSes had the highest hired labor cost, at 3.2 million VND per hectare, because MPSes need strong male workers to set the wooden and concrete pillars (see Table 4). According to farmers, setting pillars required intensive labor and needed men rather than women. In contrast, CPI had higher family labor and lower hired labor costs than MCSes and MPSes, accounting for 18.4 million and 1.3 million VND/ha. This meant that CPI took better advantage of family labor (both men and women) in taking care of planting instead of setting pillars (as in the case of MPSes), saving on hired labor costs.
The annual cost of MCSes was 43.6 million, the cost of MPSes was 86.7 million, and the cost of CPI was 86.3 million VND per hectare. These costs had higher intermediate and labor costs, which were two main components.
With respect to intermediate costs, MPSes had the highest, at 38.7 million VND per hectare, with MCSes at 18.5 million and CPI at 28.5 million VND per hectare (see Table 5). Simultaneously, fertilizer and pesticide stimulants tended to be overused in production. The surveyed data also reported that fertilizer accounted for 70%, 64%, and 73% of intermediate costs for MCSes, MPSes, and CPI, respectively. In particular, inorganic fertilizer was applied as a key input in coffee and other industrial crops in three systems. For instance, coffee farmers’ use of agro-chemical fertilizer made up 56% of total immediate costs, whereas fewer farmers said they used organic fertilizer in this model, accounting for only 14% of immediate costs. The reasons for the small number of farmers using manure was that (1) manure was more expensive than chemical fertilizer, and (2) a large number of old coffee trees needed to be replanted (after about 25 years) [31], which discouraged farmers from investing in manure. For poor farmers, the cost of tree renewal is a serious threat to their livelihoods, so using compost exceeds their investment capabilities [45]. In addition, pesticide stimulants for MPSes were costly, at 10.4 million VND per hectare (26.8% of intermediate costs (IC)), compared to others (see Table 5). This was explained by (1) pepper plantations having a high incidence of disease (i.e., foot rot, slow decline, 90%) [6,43]; (2) most plantations dealing with infectious diseases (i.e., 90% of the surveyed households had at least ten crops lost to diseases); and (3) the results of FGDs showing that pepper crops using wooden and concrete pillars had worse disease infections. Whereas households expected pepper to grow quickly to catch a good market, it led to more stimulants use. However, if pepper prices continued to drop, as coffee did some years ago, farmers in FGDs revealed they would have to reduce fertilizer and other inputs. According to Ho, 2014, the ration of output to pesticide only reached 0.13% [46]. In 2017, growing pepper areas overshot provincial master plans, accounting for 150% growth (cited from the head of DARD). This led to a glut on the market and reduced pepper prices by half to just 110.000 VND (4.8 USD) per kilogram compared to the year before.
For labor, perennial crop systems require high labor inputs [45,46]. Most labor costs were for harvest, MPSes at 39.2 million (45.5% of annual costs) and CPI at 45.8 million VND per hectare (58% of annual costs), with both being more labor-intensive than MCSes (see Table 5). This is because they required more labor, especially black pepper (i.e., 40 kg fresh pepper/day were collected as compared to 100 kg fresh coffee/day). This created many labor pressures in harvest, especially during pepper harvest season, while harvest time could not be expanded due to crop characteristics. Additionally, CPI has a coffee harvest period from September to November, and pepper is from February to April, which facilitates the use family labor. This system had the greatest number of family labor days compared to the others, making up about 213 days over the year (see Table 6).
To conclude, the available evidence showed that MCSes incurred the lowest production costs, whereas MPSes had the highest. However, MPSes used more intensive farming inputs than technical standards required locally. This will affect sustainability (i.e., health and environment risks), as well as create problems accessing export markets in the future due to high chemical residues in products [32].
There was differing economic efficiency in the three perennial crop systems illustrated in Table 6 by total output, value added, net farm income, profit, and the ratio of profit to intermediate cost.
The output of MCSes, MPSes, and CPI reached about 81 million, 254 million, and 286 million VND per hectare (where total output equaled coffee and/or pepper yield multiplied by coffee and/or pepper price) (Table 6). Net farm income was about 37 million for MCSes, 167 million for MPSes, and 200 for CPI, whereas profit figures were 19 million, 135 million, and 165 million VND per hectare, respectively (Table 6).
Of the three systems, indicators for MCSes, including revenue, net farm income, profit, the ratio of profit/IC, and the ratio of profit/family labor days, were lower than the others. This is explained by coffee price losses in recent years, now about one-third of pepper prices. Furthermore, aging tree stock led to declining productivity (Table 3 and Table 6). The inefficiency level of mono-cropping, synchronization, and segregation was around 18% [25].
In contrast, CPI had the best performance for the above indicators among the three systems due to the presence of economies of scope for coffee and pepper. For instance, the ratio of profit/IC and the ratio of profit/family labor days of CPI were the highest, 7 and 0.9, respectively.

3.3. Affected Farmers’ Decisions on Perennial Crop Practice

The research used binary regression to explain the relationship between the socioeconomic characteristics of perennial crop farmers and those using other crop farming. It examined the probability of a farmer’s decision to shift crop system from current farming to the others based on socioeconomic factors (see Table 7).
The formula of logistic regression was as follows:
FDT (farmer’s decision transforming) = 2.230 + 3.672*Ethnic of HH − 0.482*Education + 2.783*Training + 4.278*Crop failure − 1.273*Profit.
We note that FDT is proportional to the probability of a farmer’s decision in transforming production. Thus, the socioeconomic factors associated significantly with this probability including ethnicity of HH (3.672), training (2.783), and crop failure (4.278), which had a positive relationship with a farmer’s decision. This means that the Kinh ethnicity preferred to convert their cropping system (i.e., 60% of surveyed Kinh households planned to convert current farming to mixed cropping systems, including coffee-pepper-fruit). Higher education levels, higher percentages of training, and higher percentages of crop failures (because of plant diseases) improved the probability of transforming cropping. On the other hand, there was a negative relationship between profit/cost and a farmer’s decision (−1.273), and low profits from farm activity increased the probability of transforming to other systems.

4. Discussion

The study found that the startup operations of the three systems required spending high financial investments, and also man-days. However, MCSes had the lowest cost compared to MPSes and CPI. At the same time, MCSes replanting has been supported by local governments through nurseries. This has been considered with limited finances. However, spending less on manure or compost in the establishment of a coffee plantation influenced the growth and quality of crops and productivity. MPSes had the highest capital requirement in comparison to the others, with especially the use of concrete and wooden pillars needing more man-days (and requiring men rather than women). It was likely to reduce women’s employment opportunities. Additionally, using wooden pillars in MPSes was considered damaging to the environment, as they destroy the forest. This created many challenges for the farmers and local authorities. For future development, wooden and concrete pillars should instead be replaced by live plant supports in MPSes to become sustainable. CPI uses live plants as supports, which not only saves on pillar costs compared to MPSes, but is also highly labor intensive, creating more employment opportunities, including opportunities for women’s employment throughout production in various operations such as pruning and taking care of plants.
In the production process, MCSes had smaller annual costs than the others because of less hired labor and less pesticide stimulant use. The overuse of chemical fertilizers can have negative environmental impacts [46]. MPSes apparently applied more pesticide and stimulants than required for local technical standards and also more than the others used. This not only increased annual costs but also negatively affected sustainable development (i.e., health and environmental risks), as well as adversely affecting access to export markets due to high levels of chemical residues in products [30]. Both MPSes and CPI had higher costs of production than MCSes, which created difficulties for low-income farmers and the poor in choosing which system was suitable for them. In particular, CPI had the highest labor costs in production compared to the others. As a result, small farms’ labor availability needed to be considered in choosing the appropriate perennial crop system.

5. Conclusions

Perennial crops grow well in favorable regions such as the Central Highlands in general and Dak Lak province in particular, with diversified systems including mono-systems and intercropping systems. In this study, the authors analyzed the economic efficiency of three perennial crop systems, MCSes, MPSes, and CPI, evaluating establishment cost, production cost, and return indicators.
The study found that the startup operations of the three systems required not only a high financial investment, but also many man-days, and MCSes had the lowest cost compared to MPSes and CPI.
In the production process, MCSes had smaller annual costs than the others because of less hired labor and lower pesticide stimulant use. However, there was overuse of chemical fertilizer. Similarly, MPSes suffered from higher pesticide and stimulant use than technical standards required locally and than the other crops did.
Economic analysis found that CPI was economically the most viable of the three systems. Additionally, CPI created higher profit per family labor unit than other systems. In addition to economic factors, social factors also affected the decision process in choosing suitable farming systems. These social factors included education, training, and farm status.
However, due to limitations of time and expertise, the study sample size was not extended, which would have generated more accurate results. Additionally, the study did not analyze the economic efficiency of each mono-cropping system deeply to compare the economic efficiency for each perennial crop system over two years. In the next study, a larger data set needs to be examined. Additionally, a social analysis of the three systems will be carried out in future studies.

Author Contributions

Revising and editing, P.T.T.; supervision, L.D.N.; methodology, T.M.H.H.; methodology, P.B.; supervision, P.L.

Funding

This research was funded by MOET, Vietnamese government.

Conflicts of Interest

The authors declare no conflicts of interest.

References

  1. EOT. Agriculture in Vietnam; EOT: Amsterdam, The Netherlands, 2017. [Google Scholar]
  2. Coelli, T.; Fleming, E. Diversification economies and specialisation efficiencies in a mixed food and coffee smallholder farming system in Papua New Guinea. Agric. Econ. 2004, 31, 229–239. [Google Scholar] [CrossRef]
  3. ICARD. The Impact of the Global Coffee Trade on Dak Lak Province, Viet Nam: Analysis and Policy Recommendations; ICARD: Hanoi, Vietnam, 2002. [Google Scholar]
  4. International Coffee Organization. ICO Annual Review 2012/13; International Coffee Organization: London, UK, 2013. [Google Scholar]
  5. Scherr, S.J.; Mankad, K.; Jaffee, S.; Negra, C. Coffee in Dak Lak, Vietnam. In STEPS TOWARD GREEN Greening Export Agriculture in East and Southeast Asia POLICY RESPONSES TO THE ENVIRONMENTAL FOOTPRINT OF COMMODITY AGRICULTURE IN EAST AND SOUTHEAST ASIA; Greening Export Agriculture in East and Southeast Asia; Columbia: Hongkong, China, 2015. [Google Scholar]
  6. Ward, M.; Smith, G.; Tran, Q. This Report Contains Assessments of Commodity and Trade Issues Made by Usda Staff and Not Necessarily Statements of Official U.S. Government Policy; USDA Foreign Agricultural Service: Washington, DC, USA, 2016; p. 11.
  7. Lindskog, E.; Dow, K.; Axberg, G.N.; Miller, F.; Hancock, A. When Rapid Changes in Environmental, Social and Economic Conditions Converge: Challenges to Sustainable Livelihoods in Dak Lak, Vietnam; Stockholm Environment Institute (SEI): Stockholm, Sweden, 2005. [Google Scholar]
  8. Amarasinghe, U.A.; Hoanh, C.T.; D’haeze, D.; Hung, T.Q. Towards sustainable production in Vietnam: More coffee with less water. Agric. Syst. 2015, 136, 96–105. [Google Scholar] [CrossRef]
  9. So, D. Dak Lak Statistical Yearbook; Agriculture, Forestry and Fishing: Pretoria, South Africa, 2005–2017.
  10. Dard, D.L. Agricultural Restructuring towards Raising Added Values and Sustainable Development to 2020 and Orientation to 2030; People Committee Dak Lak: Dak Lak, Vietnam, 2020.
  11. Nash, J.; Lewin, B.; Smit, H. Vietnam: Agricultural Price Risk Management; Pepper, Rubber, Coffee; Phase I Reports; ESI-VU: Amsterdam, The Netherlands, 2002. [Google Scholar]
  12. Ha, D.T.; Shively, G. Coffee boom, coffee bust and smallholder response in Vietnam’s central highlands. Rev. Dev. Econ. 2008, 12, 312–326. [Google Scholar] [CrossRef]
  13. Van den Ban, A. Supporting farmers, decision making by agricultural extension. J. Extens. Syst. 1998, 14, 55–67. [Google Scholar]
  14. Robert, M.; Thomas, A.; Bergez, J.-E. Processes of adaptation in farm decision-making models. A review. Agron. Sustain. Dev. 2016, 36, 64. [Google Scholar] [CrossRef]
  15. Barrett, C.B.; Reardon, T.; Webb, P. Nonfarm income diversification and household livelihood strategies in rural Africa: Concepts, dynamics, and policy implications. Food Policy 2001, 26, 315–331. [Google Scholar] [CrossRef]
  16. Darnhofer, I.; Bellon, S.; Dedieu, B.; Milestad, R. Adaptiveness to enhance the sustainability of farming systems. A review. Agron. Sustain. Dev. 2010, 30, 545–555. [Google Scholar] [CrossRef] [Green Version]
  17. Lebailly, P.; Peemans, J.-P.; Dinh, T.V. Développement rural et petite paysannerie en Asie du Sud-Est: Leçons d’expériences au Vietnam et au Cambodge; L’Harmattan: Paris, France, 2015; p. 9. [Google Scholar]
  18. Marsh, A. Diversification by Smallholder Farmers: Viet Nam Robusta Coffee; Food and Agriculture Organizationof the United Nations: Rome, Italy, 2007. [Google Scholar]
  19. Ellis, F.; Kutengule, M.; Nyasulu, A. Livelihoods and rural poverty reduction in Malawi. World Dev. 2003, 31, 1495–1510. [Google Scholar] [CrossRef]
  20. Birch-Thomsen, T.; Frederiksen, P.; Sano, H.-O. A livelihood perspective on natural resource management and environmental change in semiarid Tanzania. Econ. Geogr. 2001, 77, 41–66. [Google Scholar] [CrossRef] [PubMed]
  21. Ruf, F.; Burger, K. Planting and Replanting Tree Crops. Smallholders’ Investment Decision; Centre de coopération internationale en recherche agronomique pour le développement (CIRAD): Paris, France, 2001. [Google Scholar]
  22. Thang, T.C.; Burton, M.P.; Brennan, D.C. Optimal replanting and cutting rule for coffee farmers in Vietnam. In Proceedings of the Australian Agricultural and Resource Economics Society (AARES) Annual Conference, Cairns, Australia, 8–11 February 1988; pp. 11–13. [Google Scholar]
  23. Padrón, B.R.; Burger, K. Diversification and labor market effects of the Mexican coffee crisis. World Dev. 2015, 68, 19–29. [Google Scholar] [CrossRef]
  24. Vedenov, D.; Houston, J.; Cardenas, G. Production efficiency and diversification in Mexican coffee-producing districts. J. Agric. Appl. Econ. 2007, 39, 749–763. [Google Scholar] [CrossRef]
  25. Ho, T.Q.; Hoang, V.-N.; Wilson, C.; Nguyen, T.-T. Which farming systems are efficient for Vietnamese coffee farmers? Econ. Anal. Policy 2017, 56, 114–125. [Google Scholar] [CrossRef]
  26. van Phuong, N.; van Hoa, N.; Phong, D.D.D. The Economic Efficiency of Intercropping Systems on Coffee Plantations. Available online: http://wasi.org.vn/en/3741-2/ (accessed on 23 December 2018).
  27. Goraj, L.; Olewnik, E. FADN and Polish FADN; Institute of Agricultural and Food Economics-National Research Institute (IAFE-NRI) Agricultural Accountancy Department: Polska, Poland, 2014; p. 69. [Google Scholar]
  28. Field, A. Discovering Statistics Using IBM SPSS Statistics; Sage: Newcastle Upon Tyne, UK, 2013. [Google Scholar]
  29. Gujarati, D.N. Basic Econometrics; Tata McGraw-Hill Education: New York, NY, USA, 2009. [Google Scholar]
  30. Trong, H.; Ngoc, C.N.M. Analysis of Study Data with SPSS; University of Economics: HCM City, Vietnam, 2008. [Google Scholar]
  31. Ahmad, A. An Institutional Analysis of Changes in Land Use pattern and water scarcity in Dak Lak province, Vietnam; INSTITUTIONS, LIVELIHOODS and the ENVIRONMENT, 2000; pp. 33–66. [Google Scholar]
  32. Chi, T.T.Q.; D’haeze, D. Assessment of Water, Fertilizer and Pesticide Use for Coffee Production in Dak Lak Province; MInistry of Agriculture and Rural Development: Ha Noi, Vietnam, 2005.
  33. Bank, W. RISK AND FINANCE IN THE COFFEE SECTOR A Compendium of Case Studies Related to Improving Risk Management and Access to Finance in the Coff ee Sector. Internatonal Coffee Organization: Washington, DC, USA, 2015; p. 132. [Google Scholar]
  34. Le, N.P. The Coping Strategies of Coffee Farmers in Response to Water Scarcity: A Case Study of Ethnic Groups in the Central Highlands of Vietnam. In Proceedings of the International Conference on the Mekong, Salween and Red Rivers: Sharing Knowledge and Perspectives Across Borders, Bangkok, Thailand, 12 November 2016. [Google Scholar]
  35. Thong, P.H.; Khoi, T.V.; Khoa, N.V.; Bau, L.N.; Hong, T.; van Thuong, N.; Ha, P.V. Tài liệu đào tạo nông dân: Kỹ thuật sản xuất cà phê bền vững; Agriculture HCM city: HCM City, Vietnam, 2015. [Google Scholar]
  36. Rahman, S. Whether crop diversification is a desired strategy for agricultural growth in Bangladesh? Food Policy 2009, 34, 340–349. [Google Scholar] [CrossRef] [Green Version]
  37. Huang, C.; Liu, Q.; Heerink, N.; Stomph, T.; Li, B.; Liu, R.; Zhang, H.; Wang, C.; Li, X.; Zhang, C. Economic performance and sustainability of a novel intercropping system on the North China Plain. PLoS ONE 2015, 10, e0135518. [Google Scholar] [CrossRef] [PubMed]
  38. Long, C. The Relative Sustainability of Coffee and Mixed Farming Systems in Dak Lak Province, Vietnam. MSc Thesis, Asian Institute of Technology, Thani, Thailand, 2007. [Google Scholar]
  39. Van Asten, P.; Wairegi, L.; Mukasa, D.; Uringi, N. Agronomic and economic benefits of coffee–banana intercropping in Uganda’s smallholder farming systems. Agric. Syst. 2011, 104, 326–334. [Google Scholar] [CrossRef]
  40. Midmore, D.; Yang, S.; Kleinhenz, V.; Green, S.; Tsay, J. Intercropping chilli peppers with maize. In Proceedings of the Conference on Chilli Pepper Production in the Tropics, Kuala Lumpur, Malaysia, 13–14 October 1992; pp. 37–51. [Google Scholar]
  41. Andow, D.A. Vegetational diversity and arthropod population response. Annu. Rev. Entomol. 1991, 36, 561–586. [Google Scholar] [CrossRef]
  42. Hussein, M.; Samad, N.A. Intercropping chilli with maize or brinjal to suppress populations of Aphis gossypii Glov., and transmission of chilli viruses. Int. J. Pest Manag. 1993, 39, 216–222. [Google Scholar] [CrossRef]
  43. Mitiku, A.; Chala, A.; Beyene, Y. Effect of intercropping on aphid vectors and yield of pepper (Capsicum annum L.) in southern part of Ethiopia. Int. J. Technol. Enhanc. Emerg. Eng. Res. 2014, 2, 24–34. [Google Scholar]
  44. Amlinger, F.; Nortcliff, S.; Weinfurtner, K.; Dreher, P. Applying compost—Benefits and needs. Proceedings of Seminar Proceedings, Brussels, Belgium, 22–23 November 2001; pp. 22–23. [Google Scholar]
  45. Hurri, S.; Ngoc, Q.N. Rural Finance of Coffee Samllholders in Vietnam-Case Study in Dak Nong Province; IFAD: Hanoi, Vietnam, 2015. [Google Scholar]
  46. Ho, T.Q.; Yanagida, J.F.; Illukpitiya, P. Factors affecting technical efficiency of small-holder coffee farming in the Krong Ana Watershed, Vietnam. Asian J. Agric. Extens. Econ. Sociol. 2014. [Google Scholar] [CrossRef]
Figure 1. The production and export status of coffee and pepper during 2005–2016 in Dak Lak province. Source: Dak Lak Yearbook, 2005–2017 [9].
Sustainability 11 00081 g001
Figure 2. Map of Dak Lak province and study areas.
Sustainability 11 00081 g002
Table 1. The distribution of surveyed samples by research site. MCS: Mono-coffee system, MPS: Mono-pepper system, CPI: Coffee and pepper intercropping.
RegionCommuneMCSMPSCPITotal Samples
1. First investigation
BMTEa Kao129930
Cu MgarCu Suê1281535
Cu KuinEa Ktur811625
Total samples32283090
2. Second investigation
BMTEa Kao54413
Cu MgarCu Suê46313
Cu KuinEa Ktur34411
Total samples12141137
Table 2. The characteristics of perennial crop households. HH: Head of household.
ItemsNMinMaxMeanSD
Gender (male response)86--0.700.46
Kinh ethnic86--0.680.47
Age (years)86257249.429.84
Education (years)860138.073.61
Experience (years)8633010.346.16
Training (% household (HHs))86--0.470.50
Farm size/household (ha/HHs)860.55.51.841.03
Average perennial crop area/HHs860.521.000.45
Family labor work at farm (people)86182.230.96
Loan credit (% household)86--0.490.50
Groundwater (% household)86- 0.910.28
Lack of water (% household)86--0.380.48
Crop losses (% household)86--0.410.49
Source: Authors’ own calculations.
Table 3. The statistical description of perennial crops by type of crop system.
ItemsMCS (n = 30)MPS (n = 28)CPI (n = 32)
MeanSDMeanSDMeanSD
1. Average plot area (ha)1.10.50.80.41.00.4
2. Density (tree/ha)
Coffee95899--964179
Pepper--1344293914271
3. Average age of system (years)
Coffee177.1--136.3
Pepper--7.4347.33.2
4. Yield (tone/ha)
Coffee2.10.5--2.30.7
Pepper--2.30.81.80.7
Source: Authors’ own calculations.
Table 4. The startup cost of perennial crop systems. Unit: Thousands of VND/ha.
ItemsMCSMPSCPISig.
Mean (n = 12)SDMean (n = 14)SDMean (n = 11)SD
Total38.522147.510265.331.50.00 *
Preparation of land42.84.97.53.35.70.3
Materials costs19.511.3130.59842.328.80.00 *
Pillars--87.878.515.3300.03 a
Holes2.82.36.58.32.530.4
Nursery128.39.420.53.630.01 *
Fertilizer33.9232419110.00 *
Pesticide0.40.60.10.40.20.40.02 *
Others1.20.83.54.21.41.30.3
Labor151012.34.219.770.00 *
Hired labor33.33.24.21.32.80.05 **
Family labor12794.718.450.00 *
Source: Authors’ own calculation. Note: *Significance level at 99%, ** Significance level at 95%. a Asymp. sig. of Mann–Whitney Test: 0.03. Asymp. sig. of Kruskal–Wallis Test: 0.00.
Table 5. The cost structure of perennial crop production. Unit: Thousands of VND/ha.
ItemsFarming SystemSig.
MCS (n = 32)MPS (n = 28)CPI (n = 30)
MeanSDMeanSDMeanSD
Annual cost43.611.186.739.386.323.30.00 *
Intermediate cost (IC)18.56.838.725.428.512.20.00 *
Fertilizer
Manure
Agro-chemical use
13
2.6
10.3
5.8
5.3
4.1
24.6
11
13.5
18
13.2
6.6
20.9
6.1
14.8
9.5
7
6
0.01 *
Pesticide, stimulants2.42.210.410.64.24.10.00 *
Fuel irrigation1.40.61.30.71.60.90.22
Others10.81.81.110.60.01 *
Transporting0.50.30.40.30.40.30.78
Packaging0.20.10.30.30.30.20.00 *
Labor cost21.54.739.213.745.813.60.00 *
Hired labor cost3.33.27.65.111.77.9
Family labor cost184.631.6123414
Loan interest11.932.642.94.30.82
Depreciation21.80.96.12.45.540.00
Source: Authors’ own calculations. 1Interest rate: 10%. 2 The life expectancy of perennial crops was 25 years [31]. Most amortization equipment (equipment was owned by the farmers) was considered to be linearly fixed at 25 years. *
Table 6. The economic efficiency of perennial crops production (in millions of dong/ha/year).
ItemsFarming SystemSig.
MCS (n = 32)MPS (n = 28)CPI (n = 30)
MeanSDMeanSDMeanSD
Total Output (millions VND)80.819253.589285.482.70.00 *
Selling price (millions VND/ton)
Coffee37 - 37
Pepper- 110 110
IC (millions VND)18.56.838.725.428.512.20.00 *
Value added (millions VND)62.415.7214.771.5256.881.90.00 *
Net farm income (millions VND)3713.3166.759200770.00 *
Profit (millions VND)191213551.3165760.00 *
Profit/IC1.10.753.774.30.00 *
Family labor days (days)1132819775213880.00
Profit/family labor days0.20.10.70.20.90.50.00 *
Source: Authors’ own calculations. Asymp. sig. of Kruskal–Wallis test: 0.00. The actual value of the crop excludes any crop loss due to drought or pests. In this study, off-farm income was not taken into account so that the total average farm income was only the value of perennial crops.
Table 7. The influence of socioeconomic factors on a farmer’s decision to switch to perennial crop production.
VariablesBS.E.WaldSig.Exp(B)
Constant2.2302.8730.6020.4389.297
Ethnicity (1 = Kinh, 0 = Ede and others)3.6721.2318.8940.00339.339
Education−0.4820.1737.7520.0050.618
Training (yes = 1, 0 = no)2.7830.9957.8300.00516.174
Crop failure (yes = 1, 0 = no)4.2781.07915.7110.00072.092
Profit/cost−1.2730.4607.6520.0060.280
Source: Authors’ own calculations. * Significant at 99% level; -2 log likelihood = 60.254; omnibus test of model coefficients (χ2, df, sig) = 64.5, 16, 0.000; Cox and Snell (R2) = 0.512; Nagelkerke R2 = 0.682; percentage of correct predictions = 86.7%.

