Article

Assessing the Impacts of Higher Education Institutions on Sustainable Development—An Analysis of Tools and Indicators

1
Institute for Managing Sustainability, WU Vienna University of Economics and Business, Welthandelsplatz 1, A-1020 Vienna, Austria
2
Department of Industrial Development, IT and Land Management, University of Gävle, Kungsbäcksvägen 47, SWE-80176 Gävle, Sweden
*
Author to whom correspondence should be addressed.
Sustainability 2019, 11(1), 59; https://doi.org/10.3390/su11010059
Submission received: 31 October 2018 / Revised: 5 December 2018 / Accepted: 15 December 2018 / Published: 22 December 2018

Abstract

:
Many higher education institutions (HEIs) have started to incorporate sustainable development (SD) into their system. A variety of sustainability assessment tools (SATs) have been developed to support HEIs to systematically measure, audit, benchmark, and communicate SD efforts. In recent years, stakeholders have increasingly asked HEIs to demonstrate their impacts on SD. These impacts are the direct and indirect effects an HEI has outside of its organizational boundaries on society, the natural environment, and the economy. This study analyzes to what extent SATs are capable of measuring the impacts that HEIs have on SD. A mixed-method approach, using descriptive statistics and an inductive content analysis, was used to examine 1134 indicators for sustainability assessment derived from 19 SATs explicitly designed for application by HEIs. The findings reveal that SATs largely neglect the impacts HEIs have outside their organizational boundaries. SATs primarily use proxy indicators based on internally available data to assess impacts and thus tend to focus on themes concerning the natural environment and the contribution to the local economy. Updating existing SATs and developing new ones may enable HEIs to fully realize their potential to contribute to SD.

1. Introduction

Higher education institutions (HEIs) are increasingly acknowledged as a key driver for the development of sustainable societies [1]. Leveraging a unique set of skills, they act as transformative agents by shaping the mindsets and values of future leaders in academia, business, and politics [2,3]. The role of HEIs in achieving sustainable development (SD) was highlighted for the first time in the 1972 Stockholm Declaration on the Human Environment [4]. Since then, HEIs and their stakeholders have increasingly engaged in a number of global initiatives and expressed their commitment to SD in a variety of national and international declarations and charters [5]. Recent examples include the United Nations Higher Education Sustainability Initiative (UN HESI) and the UN Higher Education and Research for Sustainable Development (HESD) platform. Both initiatives foster the implementation of the Sustainable Development Goals (SDGs), as part of a globally agreed policy agenda for SD, in higher education [6,7].
In this context, HEIs have started to systematically assess and report their progress on their SD commitments [8,9]. An increasing number of sustainability assessment tools (SATs) have been developed to help HEIs in this endeavor [10,11]. SATs, in the broadest sense, can be understood as instruments that provide HEIs with a systematic set of procedures and methods to measure, audit, benchmark, and communicate their SD efforts [12,13], including economic, environmental, social, and inter-linking issues in the entire HEI system.
The design of these SATs, as well as the experiences of HEIs using them, and their limitations, have been documented in the literature (e.g., References [10,14]). Previous studies show that the most widely adopted SATs have focused mainly on policies and activities inside the organization, such as energy efficiency measures or measures to enhance sustainability literacy of students in educational programs (e.g., References [15,16]). Less emphasis has been placed on the impacts that HEIs actually have on society, the natural environment, and the economy outside the organization, e.g., contribution to climate change mitigation or alumni sustainability lifestyles [17,18].
The assessment of impacts on SD is a complex endeavor because impacts materialize along complex pathways, particularly in the area of research and education [19]. HEIs are often separated in time and space from such impacts and affected stakeholder groups, and thus they rely on sound instruments that support their assessment approaches. In addition, there is no universally agreed definition of “impact” in literature and practice. However, available studies agree on a number of characteristics central to the term. Impacts on SD are generally understood to comprise direct and indirect effects that an HEI has outside of its organizational boundaries on society, the natural environment, and the economy [20]. They arise from the variety of activities inside the HEIs’ core elements, notably education, research, campus operations, outreach, and campus experiences [17,21].
The last decade has seen increased attention to the impacts of SD among stakeholders, including public and private funders, policy-makers, accreditation agencies, students, and faculty [22]. While an initial conceptual work on framing the multiple impacts of an HEI on SD has been proposed (see Reference [17]), the capability of SATs to provide systematic information on these impacts to meet accountability expectations of stakeholders more fully is less explored.
This study analyzes the indicators for sustainability assessment of 19 SATs. More specifically, it elucidates to what extent these indicators measure SD performance (inside the organization) and impacts on SD (outside the organization). The indicators that measure impacts on SD are further analyzed to identify the specific SD impact areas and themes addressed. Finally, the extent to which these indicators are able to capture the complex pathways from HEIs activities to specific SD impacts, i.e., whether they are capable of capturing both direct and indirect impacts, is examined.
The remainder of this article is structured as follows: Section 2 provides an overview of sustainability assessment and SATs in higher education and introduces the concept of impacts on SD; Section 3 describes the sample, the coding strategy, and the steps of the analysis; Section 4 presents the results and Section 5 discusses them; and Section 6 concludes the study.

2. Literature Review

Sustainability assessment and reporting practices in HEIs have gained increasing importance [23]. Consequently, a body of work dealing with sustainability assessment and reporting has developed within the wider literature on sustainability in higher education over the past decade [24]. Sustainability assessment and reporting’s main objectives are: (1) Assessing organizations’ such as HEIs’ sustainability; (2) communicate it to its stakeholders; (3) benchmark against other organizations; (4) analyze how the organization affects and is affected by stakeholders; (5) assess and improve sustainability performance over time; and (6) plan the future direction of change towards SD in HEIs [25,26,27,28]. Despite the increasing amount of literature, in practice, sustainability assessment and reporting is still in a developmental stage [24,29].
Limitations of sustainability assessment and reporting in HEIs are the lack of a common understanding of SD, insufficient assessment and reporting guidelines, and the additional resources and time that are required to gather and process data [9,28,30]. In addition, senior management in HEIs demonstrates low responsibility for SD and as a result senior managers do not sufficiently support sustainability assessment and reporting practices [31].

2.1. Sustainability Assessment Tools in Higher Education

A number of SATs have been developed to facilitate sustainability assessment and reporting in practice [10,11]. SATs are instruments that offer HEIs a systematic set of procedures and methods to measure, audit, benchmark, and communicate their SD efforts [12,13]. SATs also provide a basis for organizational planning and strategy development [32] through operationalization and integration of SD into all core elements [13,14].
SATs can use different assessment approaches. Dalal-Clayton and Bass [25] distinguish three main approaches to sustainability assessment: Accounts, narrative, and indicators-based assessments. Accounts assessments draw on raw data, which is converted into a common unit (e.g., monetary, area, or energy). This high level of aggregation makes overall performance easily comparable. Narrative assessments, in contrast, use texts, graphics, and tabular data. They are highly flexible and provide the opportunity to explore detailed and unstructured data of all kinds with the objective of developing a rich picture of SD impacts, including trade-offs and systemic interrelationships. Both kinds of assessments have drawbacks; however, accounts assessments only cover select aspects of sustainability, and the high flexibility of narrative assessments entails limitations in transparency and consistency. Consequently, the usefulness of these approaches for monitoring, decision support, and strategy development is limited [25,33]. Indicator-based assessment is considered the most useful approach to achieve measurable, transparent, and comparable results and thus serves as the foundation of most SATs [34].
Indicators measure a specific aspect of SD (e.g., student sick days) that can be ascribed to a wider attribute or characteristic of a system (e.g., student health) [35]. Indicators are formulated in quantitative, quasi-quantitative, and qualitative terms [36]. Quantitative indicators measure, for example, physical units; quasi-quantitative indicators are based on ratings (e.g., yes/no scores); and qualitative or descriptive indicators include text or also graphics [25]. Indicators can also be divided into direct and indirect (proxy) indicators based on how they measure the phenomena [36].
Available SATs range from simple compliance-oriented tools focusing on operations via contextual explorative approaches to comprehensive approaches that allow interorganizational certification and benchmarking [15]. Previous studies analyzed SATs in higher education based on their sets of indicators and supporting documents and case study applications (see Table 1). Overall, these studies concur that SATs are still at an infant stage. The indicators that are used in these assessments focus mainly on governance issues and campus operations and to a large extent tend to neglect activities in research, education, and outreach (e.g., Reference [16]). In addition, the reviewed SATs have a strong focus on the environmental sustainability dimension neglecting social and economic issues (e.g., References [10,33]).

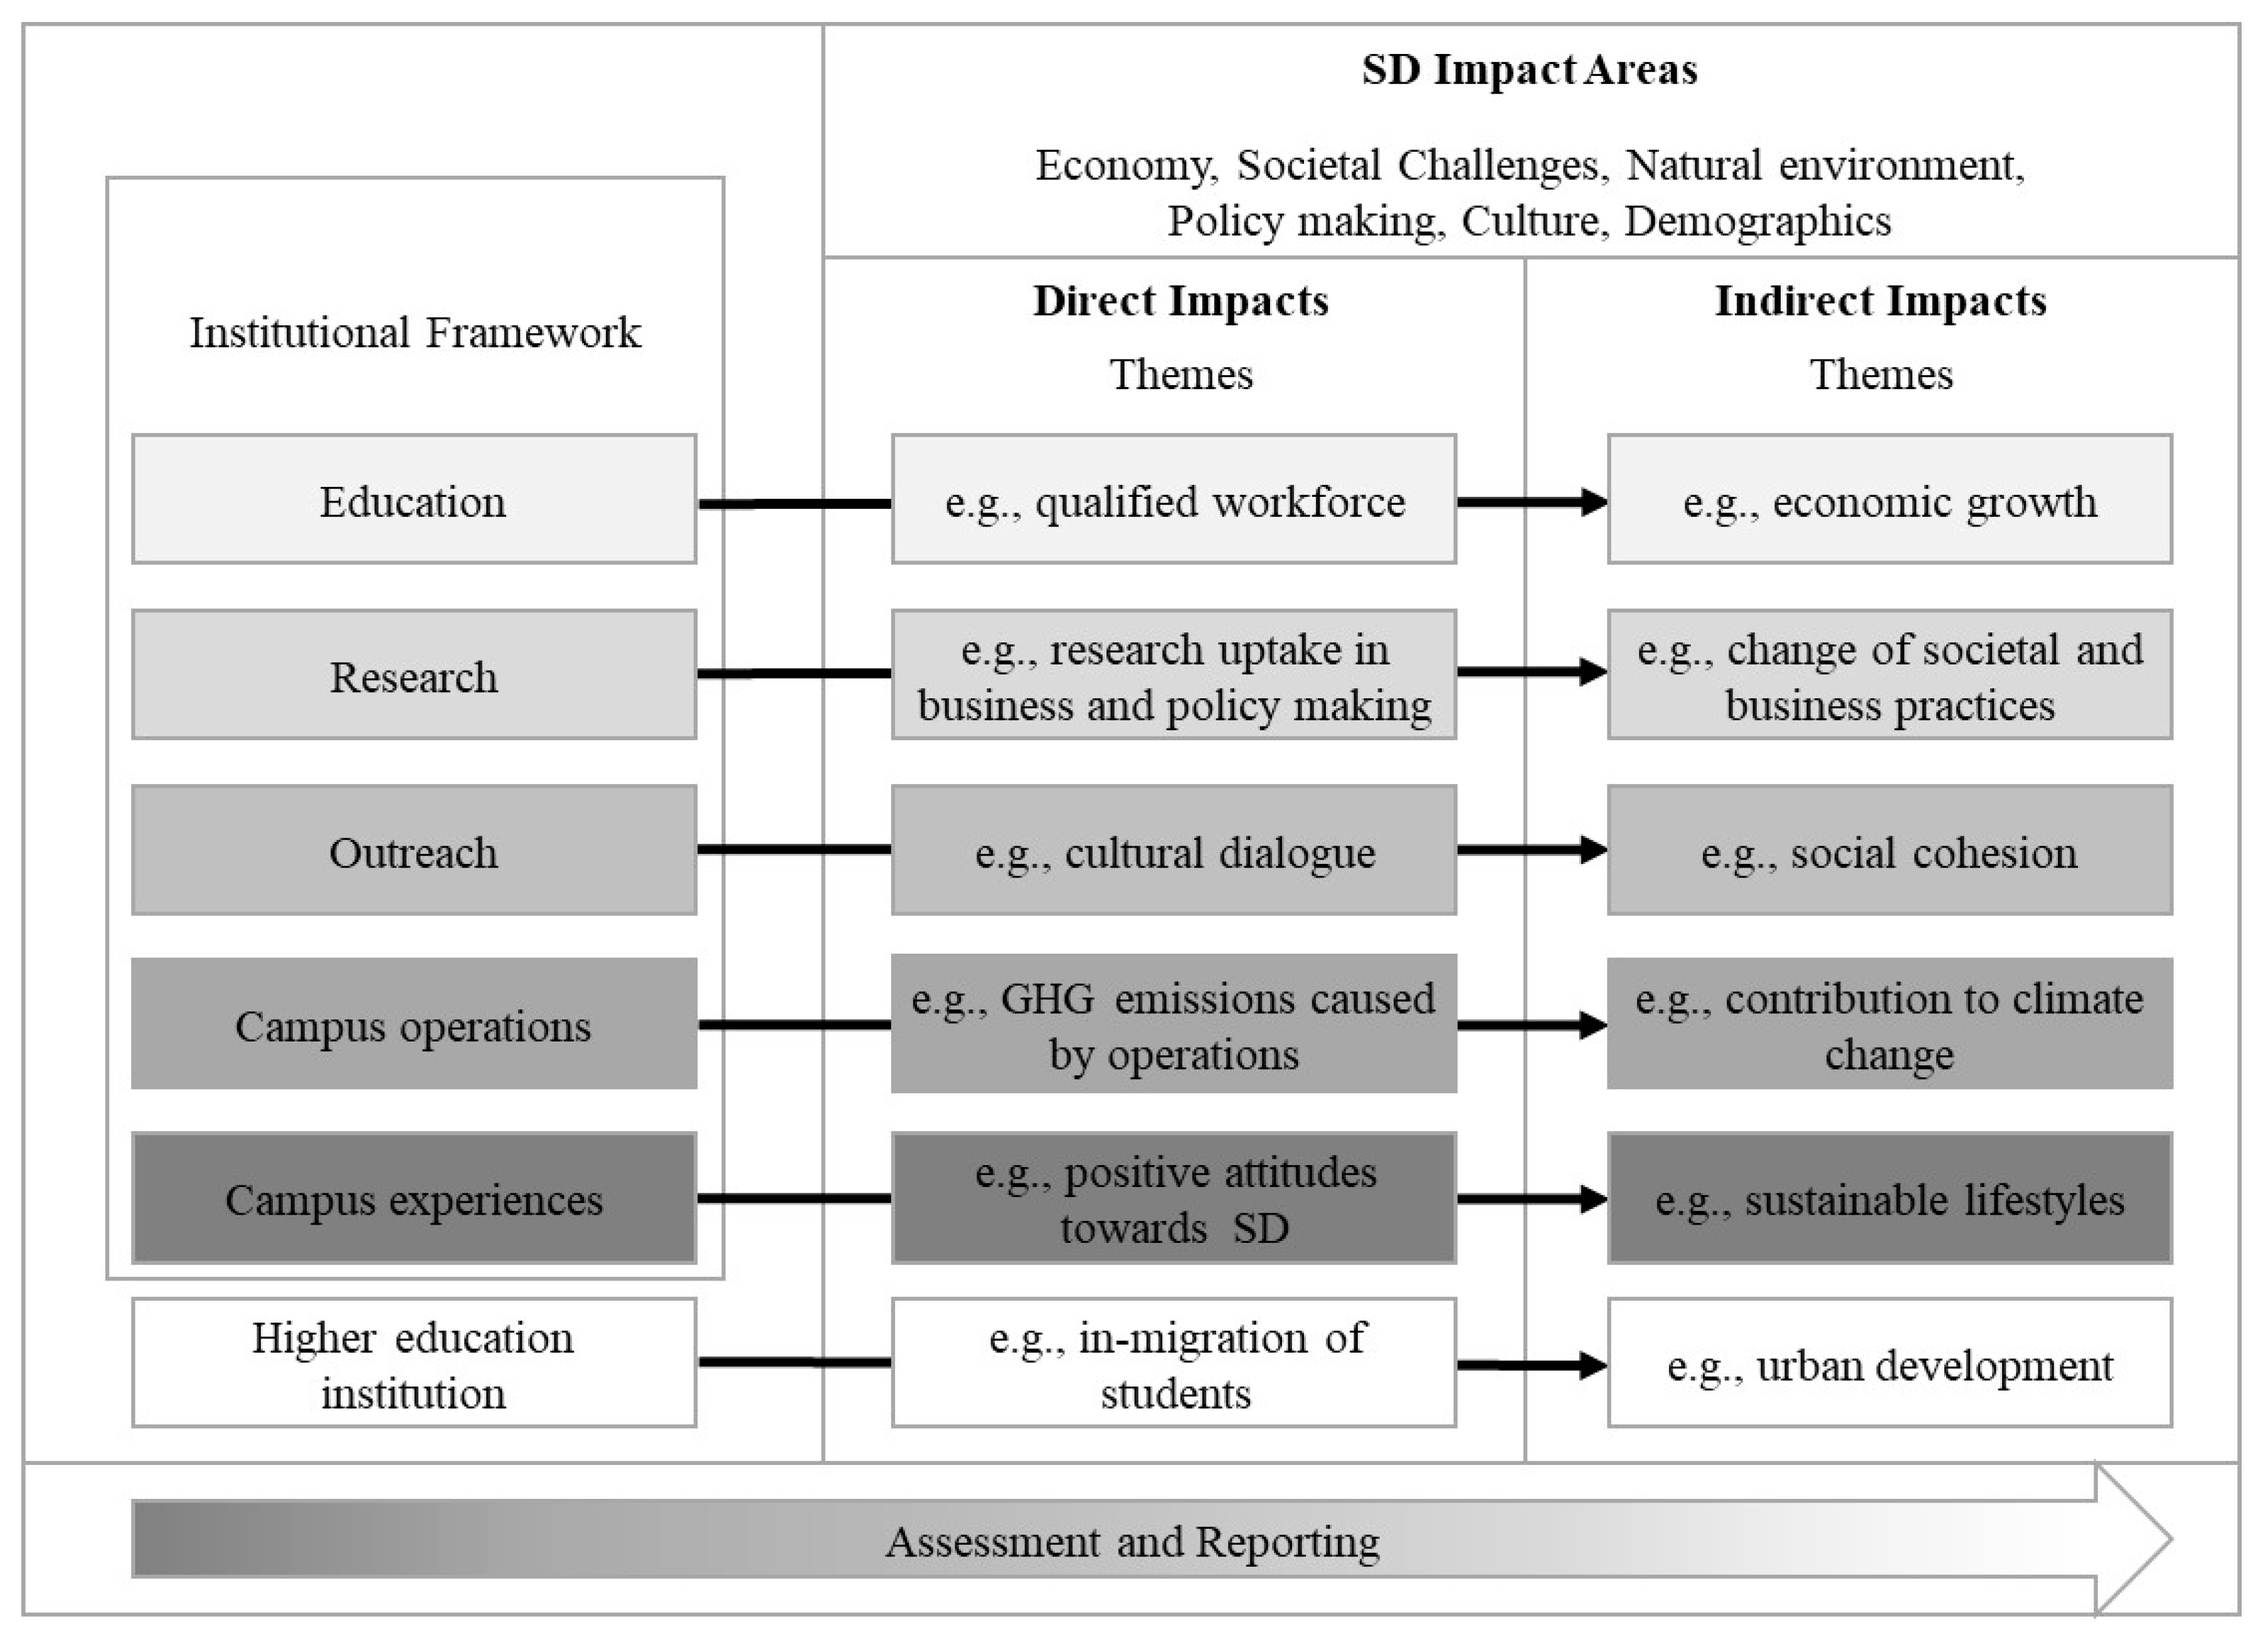
2.2. Impacts of Higher Education Institutions on Sustainable Development

The studies examining SATs, as illustrated in Table 1, have focused on HEIs’ policies and activities for SD occurring inside the organization (e.g., measures to enhance energy efficiency or sustainability literacy of students in educational programs [15,16]). However, external stakeholders such as public and private funders, policy-makers, and accreditation agencies have increasingly asked HEIs to more adequately assess and report about their impacts on SD as well—in other words, external stakeholders are increasingly interested to know what HEIs achieve through these activities and policies for wider society and the natural environment [22]. For example, the European Research Framework Program H2020 examines impacts as one of its three evaluation criteria [38], the Research Excellence Framework (REF) in the UK allocates public funding based on the presentation of research impacts by HEIs [39], and the Business School Impact System (BSIS) by the Management Development Network (EFMD) includes impacts into its accreditation evaluations [40]. This has led to an increasing need of HEIs to assess and report about their impacts. In this context, this paper seeks to examine to what extent existing SATs are capable of accounting for impacts that HEIs have on SD (e.g., climate change mitigation, social inclusiveness, and strengthening of the local economy).
Impacts refer to the effects that any organization, such as an HEI, has outside of its organizational or academic boundaries—on its stakeholders, the natural environment, the economy, and society in general [17,41]. Impacts are caused by the HEI as an organization and by its different organizational and individual level activities that take place in the core elements education, research, outreach, campus operations, and campus experiences [21,42]. Impacts may materialize in a variety of different SD impact areas, including the economy, societal challenges, the natural environment, policy making, culture, and demographics. Impacts can be directly (short-term effects, e.g., student sustainability literacy) or indirectly (long-term effects, e.g., sustainable lifestyles of graduates) attributed to the HEI or the activities that take place in its core elements (see Figure 1, [17]).
HEIs have to follow a whole institution approach that takes the impacts of all core elements into account to successfully manage their impacts (strengthening positive and reducing negative ones) [43]. This highlights the importance of broad-scale policies (institutional framework) to facilitate impact orientation in all core elements and the need of SATs to systematically assess and manage impacts [17].
Impact assessment is a challenging process because impacts may materialize along complex pathways [19]. On the one hand, HEIs generate impacts on SD through organizational activities within the core elements of the HEI (e.g., online learning contributes to climate change mitigation and the reduction of greenhouse gas [GHG] emissions, see Reference [44]) or through their sheer existence as an organization in a specific locality (e.g., an HEI attracts national and international students, which causes in-migration, demographic change, and cultural dialogue, see References [45,46]). On the other hand, impacts are caused by individual activities or behaviors (e.g., students with entrepreneurial attitudes may contribute to business creation and thus strengthen local economies). While HEIs may assess and analyze impacts on the organizational level via, for example, internal proxy data, impact assessment at the individual level is much more challenging because it requires additional data collection (e.g., alumni or student surveys).

3. Sample and Method

This research analyzes SATs in higher education by a applying a mixed-method approach based on quantitative and qualitative elements (as used by [47]). The research aims to provide new insights regarding the ability of currently existing SATs to assess impacts of HEIs on SD.

3.1. Sampling Strategy and Description

SATs to be included in the sample were identified based on a review of existing studies of SATs in higher education (e.g., References [14,33]), as well as online research that aimed to identify recently developed tools. The purposive sampling strategy resulted in a final sample composed of SATs that: (a) Follow an indicator-based approach and (b) are applied in practice. The selection aimed to generate a maximum variety of tools to foster a rich comparative assessment (see Reference [48]). A brief description of the included SATs’ purpose and content is provided below (in alphabetical order):
  • The Auditing Instrument for Sustainability in Higher Education (AISHE) was developed in 2001 in the Netherlands by the Dutch Foundation for Sustainable Higher Education and aims at measuring sustainable education [49]. The latest version “AISHE 2.0” has 30 indicators across the five modules Identity, Education, Research, Operations, and Societal Outreach, and it offers a five-stage description for each criterion for benchmarking;
  • The Adaptable Model for Assessing Sustainability in Higher Education (AMAS) was developed by Gomez et al. [50] in 2015 at the Pontificia Universidad Católica de Chile. The tool has 25 indicators that are subordinated to a goal, a criterion, and a subcriterion. It aims at enabling HEIs to assess sustainability along different implementation stages;
  • The Business School Impact System (BSIS) is designed to determine the extent of a school’s impact upon its regional environment. It was launched in France in 2014 by EFMD Global Network and has 126 indicators across seven categories. Business schools can apply to enter the BSIS process and are then reviewed by an expert team [51];
  • The CSA framework resulted from the Campus Sustainability Assessment Review Project in 2002 at the Western Michigan University (US). The CSA framework includes 43 best practice indicators across 15 dimensions compiled from an analysis of various CSA reports [52]. A benchmarking possibility is provided in the form of a “potential end goal”;
  • The Campus Sustainability Assessment Framework (CSAF) has 169 indicators across 10 categories and offers opportunities to benchmark HEIs against predefined scores. It was developed by Lindsay Cole in 2003 to assist Canadian campuses with their sustainability objectives [53,54];
  • Waheed, Khan, and Veitch [55] developed a quantitative sustainability assessment tool using a driving force-pressure-state-exposure-effect-action (DPSEEA) framework to achieve a causality-based impact assessment. The Canadian model is called DPSEEA-Sustainability index Model (D-SiM). The D-SiM includes 56 indicators across five categories;
  • The German Commission for UNESCO (Deutsche UNESCO Kommission [DUK]) developed a sustainability self-assessment concept for HEIs in 2011 containing 10 fields of action/indicators. Each of the fields of action offers five stages of implementation to which HEIs can assign themselves [56];
  • The Graphical Assessment of Sustainability in Universities (GASU) has 174 indicators that build on a modification of the Global Reporting Initiative (GRI) Sustainability Guidelines. It was developed in 2006 by Rodrigo Lozano at Cardiff University (UK) and last updated in 2011. GASU aims to enable analysis and comparison of universities’ sustainability efforts [9];
  • The Graz Model of Integrative Development (GMID) evaluates the transformative potentials of sustainability processes within Regional Centers of Expertise (RCE) on Education for Sustainable Development (ESD), and thus focuses on the interrelations between an HEI and regional stakeholders. It includes 15 indicators across the basic principles of Leadership, Social Networks, Participation, Education and Learning, and Research Integration, and it was developed by Clemens Mader in Graz (Austria) [57];
  • People and Planet’s University League (P&P) ranks UK universities by environmental and ethical performance using 51 indicators across 13 categories. The university sustainability ranking was first conducted in 2007 and has been updated each year [58];
  • The Penn State Indicators Report (PENN) evaluated the sustainability performance at Pennsylvania State University (US) in 2000. It covers 33 indicators across 10 categories. These indicators were subsequently used by other HEIs for sustainability assessment [59];
  • The Association of University Leaders for a Sustainable Future (ULSF) [60] created the Sustainability Assessment Questionnaire (SAQ) for colleges and universities. It was developed in the US and is designed to assess how sustainable a university’s teaching, research, operations, and outreach are with 41 indicators;
  • The National Wildlife Federation’s [61] State of the Campus Environment (SCE) is a national (US) report card on Environmental Performance and Sustainability in Higher Education. It covers 69 indicators across 12 categories;
  • Good Company’s Sustainable Pathways Toolkit (SPT) developed in 2002 in the US evaluates the social and environmental impacts of HEIs using 29 indicators (20 core indicators and nine supplementary indicators). Along with each indicator goes a benchmark suggesting a desirable performance for the respective area of application [62];
  • The Sustainability Tracking, Assessment and Rating System (STARS) version 2.1 was developed by the Association for the Advancement of Sustainability in Higher Education (AASHE) [63] in North America. It includes 68 indicators with benchmarks that determine possible scoring across the categories Academics, Engagement, Operations, Planning and Administration, and Innovation and Leadership. HEIs that submit a self-assessment using STARS may achieve a gold, silver, or bronze rating;
  • The Sustainability Tool for Auditing for University Curricula in Higher-Education (STAUNCH®), developed by Rodrigo Lozano in 2009 in the UK, enables HEIs to assess their curricula’s contribution to sustainable development by using 36 indicators that are subdivided into environmental, economic, social, and cross-cutting themes [64];
  • Lukman, Krajnc, and Glavic [65] created the Three-dimensional University Ranking (TUR) in 2010 at the University of Maribor (SI). The model offers 15 indicators to evaluate HEIs along their research, educational and environmental performance in a way that enables inter-organizational comparison;
  • The UI GreenMetric World University Ranking (UIGM) is an initiative of Universitas Indonesia (ID), launched in 2010. It ranks universities’ performance in the categories of Setting and Infrastructure, Energy and Climate Change, Waste, Water, Transportation, and Education using 69 indicators [66]; and,
  • In 2009, the United Nations Environment Programme (UNEP) designed the Unit-based Sustainability Assessment Tool (USAT) to determine to what degree HEIs have integrated sustainability concerns. USAT employs 75 indicators across the dimensions teaching, operations and management, student involvement, and policy and written statements [67].
Some of the included SATs have not been examined before (i.e., BSIS, D-SiM, STAUNCH®, TUR). While nine of the SATs included in the sample were developed by HEIs, external stakeholders such as public and private funding agencies, accreditation agencies, international organizations, and charitable organizations are also found among the developers of SATs.

3.2. Coding Strategy

In total, 1134 indicators were extracted from the sampled SATs. Based on Yarime and Tanaka [16] and Fischer et al. [15], the coding strategy consisted of a deductive and an inductive part.
The deductive part of the analysis aimed to classify the indicators to link them to a particular concept [68]. Each SAT indicator was reviewed and coded based on categories derived from the SD impact framework of HEIs (see Figure 1): Core element, assessment target, SD impact area, and impact type. The framework serves as a valid construct for this analysis (see Reference [69]). In addition, the indicators were coded regarding their type (quantitative, quasi-quantitative, and qualitative) and their level of analysis (individual or organizational). The coding for all variables in these categories was binary (1 = it applies; 0 = it does not apply).
First, each indicator was exclusively assigned to one of the five core elements in which activities of SD take place—namely education, research, outreach, campus operations, and campus experiences. Indicators concerning administrative structure and broad-scale policies were assigned to the institutional framework, while indicators addressing assessment and reporting processes were categorized into the “assessment and reporting” category. In addition, indicators addressing the HEI on an institutional level were related to the category “higher education institution”. The category “not applicable” includes indicators that do not fit in any of the other categories. Examples for the indicators in these categories are illustrated in Table 2.
Second, each indicator was reviewed and exclusively categorized regarding its assessment target as a performance, proxy, or impact indicator. Performance indicators are concerned with policies and activities inside the organization (e.g., number of courses with SD content). Proxies are indicators that are able to measure impacts indirectly based on internal data (e.g., GHG emissions for contribution to climate change mitigation) (see Reference [36]), while impact indicators directly measure the impacts on SD outside organizational boundaries.
Third, each proxy and impact indicator was classified into one SD impact area. Indicators that could not be classified were coded as NA. These impact areas include, for example, indicators that address the following topics:
  • Economy: Local food purchasing, alumni in the job market;
  • Societal challenges: Research ethics, student fees;
  • Natural environment: Noise pollution, resource consumption, GHG emissions;
  • Policy making: Contribution to public policy development;
  • Culture: Cultural dialog, cultural diversity; and
  • Demographics: Composition and change of local population, including student and alumni population.
Fourth, the proxy and impact indicators were distinguished regarding the types of impact they measure. Direct impact indicators focus on immediate or short-term effects (e.g., alumni entering the regional job market), while indirect ones focus on intermediate or long-term effects (e.g., changes in environmental conditions).
Finally, the subsample of proxy and impact indicators was classified by type into quantitative (e.g., GHG emissions by weight), quasi-quantitative (e.g., self-rating of outreach efforts), and qualitative (e.g., open questions about contribution to policy making) (see Reference [36]) and also regarding their level of analysis. Indicators on the individual level of analysis address impacts that can be attributed to individual activities or behavior (e.g., alcohol consumption and related impacts on student health), while indicators on the organizational level assess impacts caused by organizational activities (e.g., water consumption and impacts on groundwater) or the HEI itself (e.g., in-migration of students and social problems).
To ensure intercoder reliability, all steps of the coding were executed by two coders (see Reference [70]). The Kappa value of the intercoder reliability was high with 0.91 (see Reference [71]). Differences among the coders were resolved by discussion until consensus was reached.
For the inductive part of the analysis, the authors independently reviewed the descriptions of proxy and impact indicators in each category of the SD impact areas. This process aimed to identify themes for the proxy and impact indicators (based on References [68,72]).

3.3. Analysis of the Coding Matrix

The descriptive statistical analyses were carried out with SPSS [73]. First, the relative frequencies of the indicator distribution among the categories’ core elements and assessment target were calculated to comparatively examine the SATs. Second, the sub-sample of proxy and impact indicators was further analyzed by cross-tabulations regarding the categories SD impact area, impact type, and indicator type. Cross-tabulation is a joint frequency distribution that summarizes the categorical data of one group to demonstrate how many cases are present in another [74]. This allows for an analysis of relationships between the different categories in order to identify patterns and trends. All cross-tabulations were tested with the Chi-square test of independence to test the hypothesis that the categorical variables in columns and rows are related. All chi-square values were high and p-values were highly significant (Chi-square values > 32.213 and p-values < 0.001), indicating a highly significant statistical relationship between the variables in the cross-tabulations [75]. The identification of themes of the inductive analysis was supported by the MAXQDA 12 qualitative analysis software [76]. The descriptive part of the analysis is presented in Section 4.1 and the inductive part in Section 4.2.

3.4. Limitations

The research design has limitations inherent to the interpretative nature of qualitative research in terms of reliability and generalizability. To strengthen the validity of the interpretative analysis, the trustworthiness of data and results was assessed in terms of credibility, transferability, and confirmability [77,78]. First, credibility refers to the extent to which the results appear to be acceptable representations of the data. The deductive coding strategy and the inductive generation of themes have yielded consistent results. All deductive coding criteria found representations in the data, thus suggesting that the coding strategy resulted in credible results.
Second, transferability designates the degree to which findings from one study context will apply to other contexts. Transferability was ensured by the purposive sampling approach, aiming to generate a maximum variety of tools to foster a rich comparative assessment [48]. The sample includes not only recently developed tools such as BSIS, but also mature and established tools, such as STAUNCH®. As it is likely that the design of SATs and the understanding of the SD concept vary depending upon specific sociocultural and political contexts, the sample explicitly included SATs from a variety of geographical origins, such as the German self-assessment tool DUK or the Indonesian university ranking UIGM. The findings should thus be applicable to a wide variety of contexts.
Third, enhancing confirmability engenders the active search for potential biases in interpretation of the data. The findings appear consistent with previous studies of SATs in higher education (e.g., References [15,16]). In addition, two coders independently coded the data. Testing for intercoder reliability further strengthened the confirmability of results.
Finally, the nature of the data, i.e., indicators derived from SATs, imposes limitations in terms of the conclusions that can be drawn. While the examination of indicators enables a rich comparative assessment of SATs, it does not allow inferences as to the systemic interrelationships between indicators, and thus also not about the potential of the SATs to drive SD in the HEI context at this level. While sound sustainability assessment is a prerequisite and necessary condition for the improvement of HEIs’ impacts on SD, it is not sufficient to judge the extent to which actual improvements materialize. This requires additional analyses that are beyond the scope of this study.

4. Results

The 19 SATs under examination comprised 1134 indicators representing all the tools’ capability to assess impacts on SD. The analysis consists of a descriptive part and an inductive examination of major themes.

4.1. Descriptive Analysis

The overall distribution of indicators across the core elements shows a strong focus on the core elements of campus operations (34.48%), and institutional framework (20.90%). The dominance of campus operations can be due to 10 out of the 19 SATs having their largest share of indicators in this core element. Indicators relating to education (16.04%) are also relatively high. All other core elements are covered only by a limited number of indicators and are relatively weakly represented when compared against campus operations, the institutional framework, and education (see Table 3). More than half of the analyzed SATs do not have any indicators on the core elements campus experiences and assessment and reporting, and two SATs do not cover the campus operations and institutional framework elements. The core element of education is addressed by all analyzed SATs. Some of the SATs are specialized, e.g., CSA and PENN have about 70% of their indicators in campus operations and STAUNCH® focuses only on education. It should be noted that the element HEI refers to activities on the institutional level or impacts that are caused by the HEI as institution. This category is only addressed by a few indicators (5.03%).
The majority of indicators in the examined SATs assess an HEI’s internal activities rather than impacts on SD. Table 4 illustrates the strong focus on performance indicators (69.84%). Some SATs solely assess SD performance, namely DUK, GMID, SAQ, STAUNCH®, TUR, and USAT. Only BSIS and PENN show a distinct focus on addressing impacts outside the organizational boundaries with 81.75% and 60.61% of criteria being either proxy or impact indicators, respectively. Twelve of the reviewed tools make use of proxy indicators (20.55% of the overall sample). Eight SATs offer impact indicators, which comprise only 4.14% of the total indicator sample.
Table 5 shows the characteristics of the indicators that focus on assessing HEIs’ impacts on SD. There is a strong focus on proxy indicators that measure impacts in an indirect way, which comprise 83.21% of the indicators that address impacts.
For proxy and impact indicators, the core element most represented is campus operations; 48.21% of the proxy and impact indicators focus on this core element, of which most are proxy indicators. Many of these proxy indicators emphasize assessing GHG emissions and waste generation. Of the indicators, 16.08% address impacts that are caused by the HEI as an organization. The core element assessment and reporting was not addressed because this core element reflects the assessment processes in an HEI rather than the actual impacts.
The proxy and impact indicators address mainly the SD impact areas economy, societal challenges, and natural environment, while policy making, culture, and demographics are seldom considered. Natural environment is the SD impact area with the highest coverage, with 49.30% of proxy and impact indicators assessing impacts in that category. The SD impact areas economy and societal challenges follow with 23.57% and 13.21% of the indicators, respectively. The bulk of the economy proxy indicators stem from the tool BSIS. It is true for any SD impact area that proxy indicators comprise the larger share.
Direct impacts are addressed by almost all proxy and impact indicators (97.14%) and only eight aim at capturing indirect impacts. The indicators assessing indirect impacts are almost exclusively impact indicators.
Considering the indicator type, quantitative indicators are the most prevalent (62.50%), followed by quasi-quantitative indicators (19.29%) and qualitative indicators (18.21%). The latter are especially utilized in the subsample of impact indicators.
The level of analysis indicates whether impacts are caused by organizational activities and the HEI as an organization or via individual activities or behavior. Of the subsample of proxy and impact indicators, 86.79% focus on the organizational level of analysis. The share of indicators addressing the individual level is higher among the subsample of impact indicators compared with proxy indicators, where the focus is almost exclusively on the organizational level.

4.2. Inductive Content Analysis

In the inductive content analysis of the subsamples of proxy and impact indicators, major themes within specific SD impact areas were identified (see Table 6). Regarding the SD impact area natural environment, the most addressed themes within the proxy indicators are “Consumption of energy, water and materials”, “Emission of GHGs”, and “Generation of waste”. The impact indicators in this SD impact area address similar themes with the exception of “Effects on conditions (e.g., biodiversity, groundwater)”, which presents the largest group of indicators. The indicators in the SD impact area natural environment are almost exclusively tied to campus operations and assess their subject generally in a quantitative way.
The themes most covered by proxy indicators within the SD impact area economy are “Local expenditures”, “Research concerning the local economy”, and “Local job creation”. The impact indicators emphasize “Alumni in the job market” and “Start-ups in the region”. Typically, these themes are assessed by quantitative indicators.
The proxy indicators and impact indicators classified into societal challenges are mainly focused on the same themes. They address “Stakeholder engagement and community development”, and “Health and safety issues”. The indicators in the theme “Stakeholder engagement and community development” are exclusively linked to outreach.
Proxy as well as impact indicators concerning the SD impact areas policy making, culture, and demographics are very rare. Addressed themes in these areas are: “Contribution to public policy development”, “International student exchange”, and “In-migration of students”.

5. Discussion

The research confirms previous studies on SATs (e.g., Reference [15]) in that the vast majority of the analyzed SATs have a strong focus on assessing SD performance in the core element campus operations. Only a small percentage of indicators assess impacts on SD occurring outside the immediate organization. This finding cannot be explained by looking at the timeline of first release of the sampled SATs. Even before impact became a topical issue of discussion, PENN was released in 2000 as one of two examples in the sample with a strong focus on assessing impacts on SD—the other example being the BSIS tool (first issued in 2014). At the same time, relatively new and widely applied SATs such as STARS (first released in 2010 and last updated in 2017) still tend to focus heavily on internal SD performance. Rather, indicators that aim to assess impacts directly are rare across all tools, irrespective of when they were issued.
The literature provides potential explanations for the heavy skew towards performance indicators in the sample. For instance, Reference [16] argued that the assessment of SD impacts involves a high level of complexity, which SATs are not equipped to handle. Closely related to the challenge of capturing a high level of complexity is the question of data availability. The findings suggest that it is important to balance the quality of assessment with the effort and data needed, especially for comprehensive tools that are meant for wide and regular application, such as STARS. The literature on sustainability assessment in adjacent fields also suggests that if SATs are to be widely adopted by HEIs, then they need to enable assessments based on internal data readily available to HEIs [79]. SATs that require additional efforts in data collection (e.g., via alumni surveys) may pose considerable difficulties for their adoption. This is reinforced by the strong focus on proxy indicators in the overall sample and the fact that only a minor share of proxy and impact indicators assesses impacts on an individual level of analysis.
The present research highlights the concrete SD impact areas and themes currently covered by SATs. The sample contains a relatively higher proportion of proxy and impact indicators in SD impact areas, with clearly understood causal pathways from activity to impact, as well as those that can be measured in physical or quantifiable units based on data readily available to HEIs. This is confirmed by the data in the sample. Even for SATs with an overwhelming focus on internal SD performance, there are proxy indicators for impact in the area of campus operations, especially as regards environmental impacts (e.g., consumption of energy, water and materials, GHG emissions, and waste generation). The main focus is on the SD impact areas natural environment, economy, and societal challenges, while policy making, culture, and demographics are rarely considered. In particular, environmental impacts tend to lend themselves to assessment because causal links, e.g., from GHG emissions to climate change, are well understood and easier to assess than many social issues (e.g., impacts of an HEI on local culture) (see Reference [10]).
This means that the SD impact areas addressed by SATs do not necessarily cover the most important impacts of any given HEI. Rather, they focus on indicators that can be measured based on internally available data. In this context, it is notable that only one of the SATs in the sample, namely GASU, requires a materiality assessment or prioritization of SD impact areas. Such exercises are common in corporate SATs or in sustainability assessments (as stated by Reference [80]), which can make it difficult for HEIs to focus their assessment efforts in those SD impact areas where they can make the most substantive contributions to SD.
Some tools acknowledge that impacts may vary between different types of HEIs, e.g., the BSIS tool with its explicit focus on business schools as distinct from universities (see Reference [51]). Other important distinctions might relate to the locality and local socioeconomic importance of HEIs (e.g., in urban or rural contexts) or simply to the size of any given HEI (e.g., in terms of student body and staff). For instance, Hubbard [45] shows that in rural areas, in-migration of students and the resulting cultural and demographic impacts can be a major local concern. Such differences cannot currently be captured by most SATs.
The strong focus on quantitative indicators supports the proposition that impacts, especially indirect ones, are neglected because quantitative assessment is frequently not feasible along complex and poorly understood causal pathways from activity to impact. For example, Hubbard [45] and Yao and Bai [46] provide accounts of how HEIs affect and are affected by student in-migration and internationalization. A capacity for assessing the impacts of internationalization through SATs would be useful for the large number of HEIs that are currently promoting internationalization as part of their strategies [81]. Online learning (e.g., Reference [44]) is another area of high strategic relevance for many HEIs, the direct and indirect impacts of which are currently still poorly understood.

6. Conclusions

The research aims to analyze the ability of SATs to assess impacts of HEIs on SD. In so doing, the study expands upon previous examinations of SATs in higher education, which have largely focused on what HEIs do in support of SD rather than on what they achieve for society, the economy, and the natural environment beyond their organizational boundaries. The research examined 1134 indicators for sustainability assessment derived from 19 SATs explicitly designed for application by HEIs.
While HEIs have increasingly been incorporating SD, their efforts have tended to be compartmentalized and focused on internal operations. It is becoming increasingly imperative that HEIs take a more holistic perspective addressing their system elements and their impacts, in this way, strengthen their contribution to SD. The update of existing indicator-based SATs and the development of new approaches of impact assessment can support HEIs in this endeavor.
Available SATs, to a large extent, are designed to assess specific activities inside the HEI’s core elements, and provide external stakeholders only information about the internal engagement with SD. Only a small share of indicators of the examined SATs’ aim to assess HEIs’ impacts on SD and to a large extent indirectly via internal proxy data. SATs contribute indirectly to SD by raising awareness for SD; however, they tend to neglect the impacts HEIs have outside their organizational boundaries, and therefore, do not fully realize their potential to contribute to SD.
Further research should be carried out, for example on narrative assessments potential to assess impacts of research, where there is increasing consensus that counting citations and bibliometric analysis do not provide an accurate picture of research impacts on SD.

Author Contributions

Conceptualization, F.F.; Methodology, F.F.; Data Curation, F.F. and B.S.; Validation, F.F. and B.S.; Software, F.F. and B.S.; Writing—Original Draft Preparation, F.F. and N.S.; Writing—Review & Editing, R.L. and N.S.

Funding

This research received no external funding.

Conflicts of Interest

The authors declare no conflict of interest.

References

  1. Stephens, J.; Hernandez, M.; Roman, M.; Graham, A.; Scholz, R. Higher Education as a Change Agent for Sustainability in Different Cultures and Contexts. Int. J. Sustain. High. Educ. 2008, 9, 317–338. [Google Scholar] [CrossRef]
  2. Cortese, A.D. The Critical Role of Higher Education in Creating a Sustainable Future. Plan. High. Educ. 2003, 31, 15–22. [Google Scholar]
  3. Lozano, R. Incorporation and Institutionalization of Sd into Universities: Breaking through Barriers to Change. J. Clean. Prod. 2006, 14, 787–796. [Google Scholar] [CrossRef]
  4. UN (United Nations). Declaration of the United Nations Conference on the Human Environment. Available online: http://www.un-documents.net/unchedec.htm (accessed on 27 August 2018).
  5. Lozano, R.; Lukman, R.; Lozano, F.J.; Huisingh, D.; Lambrechts, W. Declarations for Sustainability in Higher Education: Becoming Better Leaders, through Addressing the University System. J. Clean. Prod. 2013, 48, 10–19. [Google Scholar] [CrossRef]
  6. UN (United Nations). Higher Education and Research for Sustainable Development (Hesd). Available online: https://sustainabledevelopment.un.org/partnership/?p=11748 (accessed on 27 August 2018).
  7. UN (United Nations). Higher Education Sustainability Initiative (Hesi). Available online: https://sustainabledevelopment.un.org/sdinaction/hesi (accessed on 27 August 2018).
  8. Gamage, P.; Sciulli, N. Sustainability Reporting by Australian Universities. Aust. J. Public Adm. 2016, 76, 187–203. [Google Scholar] [CrossRef]
  9. Lozano, R. A Tool for a Graphical Assessment of Sustainability in Universities (Gasu). J. Clean. Prod. 2006, 14, 963–972. [Google Scholar] [CrossRef]
  10. Bullock, G.; Wilder, N. The Comprehensiveness of Competing Higher Education Sustainability Assessments. Int. J. Sustain. High. Educ. 2016, 17, 282–304. [Google Scholar] [CrossRef]
  11. Saadatian, O.; Dola, K.B.; Salleh, E.I.; Tahir, O.M. Identifying Strength and Weakness of Sustainable Higher Educational Assessment Approaches. Int. J. Bus. Soc. Sci. 2011, 2, 137–146. [Google Scholar]
  12. Gilbert, D.U.; Rasche, A.; Waddock, S. Accountability in a Global Economy: The Emergence of International Accountability Standards. Bus. Ethics 2011, 21, 23–44. [Google Scholar] [CrossRef]
  13. Shriberg, M. Institutional Assessment Tools for Sustainability in Higher Education. Int. J. Sustain. High. Educ. 2002, 3, 254–270. [Google Scholar] [CrossRef]
  14. Berzosa, A.; Bernaldo, M.O.; Fernández-Sanchez, G. Sustainability Assessment Tools for Higher Education: An Empirical Comparative Analysis. J. Clean. Prod. 2017, 161, 812–820. [Google Scholar] [CrossRef]
  15. Fischer, D.; Jenssen, S.; Tappeser, V. Getting an Empirical Hold of Thesustainable University: A Comparative Analysis of Evaluation Frameworks across 12 Contemporary Sustainability Assessment Tools. Assess. Eval. High. Educ. 2015, 40, 785–800. [Google Scholar] [CrossRef]
  16. Yarime, M.; Tanaka, Y. The Issues and Methodologies in Sustainability Assessment Tools for Higher Education Institutions—A Review of Recent Trends and Future Challenges. J. Educ. Sustain. Dev. 2012, 6, 63–77. [Google Scholar] [CrossRef]
  17. Findler, F.; Schönherr, N.; Lozano, R.; Reider, D.; Martinuzzi, A. Conceptualizing Sustainable Development Impacts in Higher Education—A Systematic Literature Review. Int. J. Sustain. High. Educ. in press.
  18. Vaughter, P.; Wright, T.; McKenzie, M.; Lidstone, L. Greening the Ivory Tower: A Review of Educational Research on Sustainability in Post-Secondary Education. Sustainability 2013, 5, 2252–2271. [Google Scholar] [CrossRef] [Green Version]
  19. Koehn, P.H.; Uitto, J.I. Evaluating Sustainability Education: Lessons from International Development Experience. High. Educ. 2014, 67, 621–635. [Google Scholar] [CrossRef]
  20. Lebeau, Y.; Cochrane, A. Rethinking the ‘Third Mission’: Uk Universities and Regional Engagement in Challenging Times. Eur. J. High. Educ. 2015, 5, 250–263. [Google Scholar] [CrossRef]
  21. Gupta, H.; Singhal, N. Framework for Embedding Sustainability in Business Schools: A Review. Vis. J. Bus. Perspect. 2017, 21, 195–203. [Google Scholar] [CrossRef]
  22. Bonaccorsi, A.; Daraio, C.; Geuna, A. Universities in the New Knowledge Landscape: Tensions, Challenges, Change-an Introduction. Minerva 2010, 48, 1–4. [Google Scholar] [CrossRef]
  23. Caeiro, S.; Jabbour, C.; Leal Filho, W. Sustainability Assessment Tools in Higher Education Institutions Mapping Trends and Good Practices around the World; Springer: Cham, Gemany, 2013; p. 432. [Google Scholar]
  24. Ceulemans, K.; Molderez, I.; Van Liedekerke, L. Sustainability Reporting in Higher Education: A Comprehensive Review of the Recent Literature and Paths for Further Research. J. Clean. Prod. 2015, 106, 127–143. [Google Scholar] [CrossRef]
  25. Dalal-Clayton, B.; Bass, S. Sustainable Development Strategies: A Resource Book; Earthscan Publications Ltd.: London, UK, 2002. [Google Scholar]
  26. Daub, C.H. Assessing the Quality of Sustainability Reporting: An Alternative Methodological Approach. J. Clean. Prod. 2007, 15, 75–85. [Google Scholar] [CrossRef]
  27. Prado-Lorenzo, J.M.; Gallego-Alvarez, I.; Garcia-Sanchez, I.M. Stakeholder Engagement and Corporate Social Responsibility Reporting: The Ownership Structure Effect. Corp. Soc. Responsib. Environ. Manag. 2009, 16, 94–107. [Google Scholar] [CrossRef]
  28. Ceulemans, K.; Lozano, R.; Alonso-Almeida, M.M. Sustainability Reporting in Higher Education: Interconnecting the Reporting Process and Organisational Change Management for Sustainability. Sustainability 2015, 7, 8881–8903. [Google Scholar] [CrossRef] [Green Version]
  29. Huber, S.; Bassen, A. Towards a Sustainability Reporting Guideline in Higher Education. Int. J. Sustain. High. Educ. 2018, 19, 218–232. [Google Scholar] [CrossRef]
  30. Lozano, R.; Llobet, J.; Tideswell, G. The Process of Assessing and Reporting Sustainability at Universities: Preparing the Report of the University of Leeds. Sostenibilidad, Tecnologia y Humanismo 2013, 6, 85–112. [Google Scholar]
  31. Adams, C.A. Sustainability Reporting and Performance Management in Universities—Challenges and Benefits. Sustain. Account. Manag. Policy J. 2013, 4, 384–392. [Google Scholar] [CrossRef]
  32. Lambrechts, W. The Contribution of Sustainability Assessment to Policy Development in Higher Education. Assess. Eval. High. Educ. 2015, 40, 801–816. [Google Scholar] [CrossRef]
  33. Alghamdi, N.; den Heijer, A.; de Jonge, H. Assessment Tools’ Indicators for Sustainability in Universities: An Analytical Overview. Int. J. Sustain. High. Educ. 2017, 18, 84–115. [Google Scholar] [CrossRef]
  34. Ramos, T.B. Development of Regional Sustainability Indicators and the Role of Academia in This Process: The Portuguese Practice. J. Clean. Prod. 2009, 17, 1101–1115. [Google Scholar] [CrossRef]
  35. Gallopín, G. Indicators and Their Use: Information for Decision Making. In Sustainability Indicators. Report on the Project on Indicators of Sustainable Development; Moldan, B., Billharz, S., Eds.; John Wiley and Sons: Chichester, UK, 1997. [Google Scholar]
  36. Jorgensen, A.; Le Bocq, A.; Nazarkina, L.; Hauschild, M. Methodologies for Social Life Cycle Assessment. Int. J. Life Cycle Assess. 2008, 13, 96–103. [Google Scholar] [CrossRef]
  37. Sayed, A.; Asmuss, M. Benchmarking Tools for Assessing and Tracking Sustainability in Higher Educational Institutions. Int. J. Sustain. High. Educ. 2013, 14, 449–465. [Google Scholar] [CrossRef]
  38. European Commission. Horizon 2020 Work Program 2014-2015 General Annexes H. Evaluation. Available online: http://ec.europa.eu/research/participants/data/ref/h2020/wp/2014_2015/annexes/h2020-wp1415-annex-h-esacrit_en.pdf (accessed on 20 July 2018).
  39. REF (Research Excellence Framework). What Is the Ref? Available online: http://www.ref.ac.uk/about/whatref/ (accessed on 23 July 2018).
  40. EFMD. Efmd Launch Business School Impact System (Bsis). Available online: https://www.efmd.org/efmd-deans-across-frontiers/view/467-efmd-launch-business-school-impact-survey (accessed on 20 July 2018).
  41. Maas, K.; Liket, K. Social Impact Measurement: Classification of Methods. In Environmental Management Accounting and Supply Chain Management; Burritt, R.L., Schaltegger, S., Bennett, M., Pohjola, T., Csutora, M., Eds.; Springer: Berlin, Gemany, 2011; pp. 171–202. [Google Scholar]
  42. Findler, F.; Schönherr, N.; Martinuzzi, A. Higher Education Institutions as Transformative Agents for a Sustainable Society. In Chancen Und Grenzen Der Nachhaltigkeitstransformation; Luks, F., Ed.; Springer Gabler: Wiesbaden, Gemany, 2019. [Google Scholar]
  43. Buckler, C.; Creech, H. Shaping the Future We Want; United Nations Educational, Scientific and Cultural Organization: Paris, France, 2014. [Google Scholar]
  44. Versteijlen, M.; Perez Salgado, F.; Janssen Groesbeek, M.; Counotte, A. Pros and Cons of Online Education as a Measure to Reduce Carbon Emissions in Higher Education in the Netherlands. Curr. Opin. Environ. Sustain. 2017, 28, 80–89. [Google Scholar] [CrossRef]
  45. Hubbard, P. Regulating the Social Impacts of Studentification: A Loughborough Case Study. Environ. Plan. A 2008, 40, 323–341. [Google Scholar] [CrossRef]
  46. Yao, L.J.; Bai, Y. The Sustainability of Economic and Cultural Impacts of International Students to Regional Australia. Humanomics 2008, 24, 250–262. [Google Scholar] [CrossRef]
  47. Malina, M.A.; Nørreklit, H.S.O.; Selto, F.H. Lessons Learned: Advantages and Disadvantages of Mixed Method Research. Qual. Res. Account. Manag. 2011, 8, 59–71. [Google Scholar] [CrossRef]
  48. Teddlie, C.; Tashakkori, A. Foundations of Mixed Methods Research Integrating Quantitative and Qualitative Approaches in the Social and Behavioral Sciences, 3rd ed.; SAGE Publications: Los Angeles, CA, USA, 2010; p. 387. [Google Scholar]
  49. Roorda, N.; Rammel, C.; Waara, S.; Fra Paleo, U. Aishe 2.0 Manual: Assessment Instrument for Sustainability in Higher Education. Available online: http://www.eauc.org.uk/theplatform/aishe (accessed on 9 August 2018).
  50. Gómez, F.; Sáez-Navarrete, C.; Lioi, S.; Marzuca, V. Adaptable Model for Assessing Sustainability in Higher Education. J. Clean. Prod. 2015, 107, 475–485. [Google Scholar] [CrossRef]
  51. EFMD Global Network. Bsis Asessment Criteria Guide. Available online: http://www.efmdglobal.org/bsis (accessed on 15 September 2018).
  52. Nixon, A. Improving the Campus Sustainability Assessment Process. Bachelor Thesis, Western Michigan University, Kalamazoo, MI, USA, 2002. [Google Scholar]
  53. Cole, L. Assessing Sustainability on Canadian University Campuses: Development of a Campus Sustainability Assessment Framework. Available online: http://neumann.hec.ca/humaniterre/campus_durable/campus_memoire.pdf (accessed on 13 September 2018).
  54. Legacy, C. Campus Sustainability: Sustainability Assessment Framework at the University of Waterloo. Available online: http://environment.uwaterloo.ca/research/watgreen/projects/library/w04sustframework.pdf (accessed on 3 September 2018).
  55. Waheed, B.; Khan, F.I.; Veitch, B. Developing a Quantitative Tool for Sustainability Assessment of Heis. Int. J. Sustain. High. Educ. 2011, 12, 355–368. [Google Scholar] [CrossRef]
  56. Deutsche UNESCO-Kommission e.V. Hochschulen Für Eine Nachhaltige Entwicklung: Nachhaltigkeit in Forschung, Lehre Und Betrieb. Available online: https://www.hrk.de/uploads/media/Hochschulen_fuer_eine_nachhaltige_Entwicklung_Feb2012.pdf (accessed on 12 September 2018).
  57. Mader, C. Sustainability Process Assessment on Transformative Potentials: The Graz Model for Integrative Development. J. Clean. Prod. 2013, 49, 54–63. [Google Scholar] [CrossRef]
  58. People & Planet. People & Planet University League. How Sustainable Is Your University? Available online: https://peopleandplanet.org/university-league (accessed on 22 October 2018).
  59. Penn State Green Destiny Council. Penn State Indicators Report. Steps toward a Sustainable University. Available online: http://www.willamette.edu/~nboyce/assessment/PennState.pdf (accessed on 15 October 2018).
  60. ULSF (University Leaders for a Sustainable Future). Sustainability Assessment Questionnaire (Saq) for Colleges and Universities. Available online: http://ulsf.org/wp-content/uploads/2015/06/SAQforHigherEd09.pdf (accessed on 12 July 2018).
  61. National Wildlife Federation. State of the Campus Environment. Available online: https://www.nwf.org/en/EcoLeaders/Campus-Ecology-Resource-Center/Reports/State-of-the-Campus-Environment (accessed on 14 September 2018).
  62. Good Company. Sustainability Assessment of the University of Oregon Based on Good Company’s Sustainable Pathways Toolkit. Available online: https://cpfm.uoregon.edu/sites/cpfm2.uoregon.edu/files/sust_assessment_-_sust_pathways_toolkit_0.pdf (accessed on 12 September 2018).
  63. AASHE (The Association for the Advancement of Sustainability in Higher Education). Stars Technical Manual. Version 2.1. Available online: https://stars.aashe.org/pages/about/technical-manual.html (accessed on 30 August 2018).
  64. Lozano, R. Developing a Tool to Audit Curricula Contributions to Sustainable Development. In Sustainability at Universities—Opportunities, Challenges and Trends; Peattie, K., Ed.; Peter Lang Publishing Group: Frankfurt am Main, Germany, 2009; pp. 179–194. [Google Scholar]
  65. Lukman, R.; Krajnc, D.; Glavic, P. University Ranking Using Research, Educational and Environmental Indicators. J. Clean. Prod. 2010, 18, 619–628. [Google Scholar] [CrossRef]
  66. Greenmetric UI. Ui Greenmetric. Criteria & Indicators. Available online: http://greenmetric.ui.ac.id/criterian-indicator/ (accessed on 22 August 2018).
  67. Togo, M.; Lotz-Sisitka, H. Unit Based Sustainability Assessment Tool. A Resource Book to Complement the Unep Mainstreaming Environment and Sustainability in African Universities Partnership; Share-Net: Howick, ZA, South Africa, 2009. [Google Scholar]
  68. De Wet, J.; Erasmus, Z. Towards Rigour in Qualitative Analysis. Qual. Res. J. 2005, 5, 27–40. [Google Scholar] [CrossRef]
  69. Patton, M.Q. Qualitative Research & Evaluation Methods Integrating Theory and Practice, 4th ed.; Sage Publications: New York, NY, USA, 2015; p. 806. [Google Scholar]
  70. Seuring, S.; Müller, M. From a Literature Review to a Conceptual Framework for Sustainable Supply Chain Management. J. Clean. Prod. 2008, 16, 1699–1710. [Google Scholar] [CrossRef]
  71. Tinsley, H.E.A.; Weiss, D.J. Interrater Reliability and Agreement. In Handbook of Applied Multivariate Statistics and Mathematical Modeling; Tinsley, H.E.A., Brown, S.D., Eds.; Academic Press: San Diego, CA, USA, 2000; pp. 95–124. [Google Scholar]
  72. Sinkovics, N. Pattern Matching in Qualitative Analysis. In The Sage Handbook of Qualitative Business and Management Research Methods; Cassell, C., Cunliffe, A., Grandy, G., Eds.; Sage Publications, Inc.: Thousand Oaks, CA, USA, 2018; pp. 468–485. [Google Scholar]
  73. IBM. Ibm Spss Statistics. Available online: https://www.ibm.com/products/spss-statistics (accessed on 17 October 2018).
  74. Singh, K. Quantitative Social Research Methods, 1st ed.; SAGE Publications: New Delhi, India, 2007; p. 431. [Google Scholar]
  75. Field, A. Discovering Statistics Using Ibm Spss Statistics and Sex and Drugs and Rock’n’roll, 4th ed.; SAGE: Los Angeles, CA, USA, 2013; p. 915. [Google Scholar]
  76. VERBI. Maxdqa—The Art of Data Analysis. Available online: http://www.maxqda.com/ (accessed on 7 October 2018).
  77. Flint, D.J.; Woodruff, R.B.; Fisher Gardial, S. Exploring the Phenomenon of Customers’ Desired Value Change in a Business-to-Business Context. J. Mark. 2002, 66, 102–117. [Google Scholar] [CrossRef]
  78. Wallendorf, M.; Belk, R.W. Assessing Trustworthiness in Naturalistic Consumer Research. Interpret. Consum. Res. 1989, 69–84. [Google Scholar]
  79. Gaviglio, A.; Bertocchi, M.; Demartini, E. A Tool for the Sustainability Assessment of Farms: Selection, Adaptation and Use of Indicators for an Italian Case Study. Resources 2017, 6, 60. [Google Scholar] [CrossRef]
  80. Schönherr, N.; Findler, F.; Martinuzzi, A. Exploring the Interface of Csr and the Sustainable Development Goals. Trans. Corp. 2017, 24, 33–47. [Google Scholar] [CrossRef]
  81. Bedenlier, S.; Kondakci, Y.; Zawacki-Richter, O. Two Decades of Research into the Internationalization of Higher Education: Major Themes in the Journal of Studies in International Education (1997–2016). J. Stud. Int. Educ. 2017, 22, 108–135. [Google Scholar] [CrossRef]
Figure 1. The SD impact framework of HEIs [17].
Sustainability 11 00059 g001
Table 1. Previous studies of sustainability assessment tools in higher education.
Author(s)Tools AnalyzedMethodologyMain Findings
Shriberg (2002) [13]n = 11
AISHE, Campus Ecology, Environmental EMS Self-Assessment, Environmental Workbook and Report, Greening Campuses, Grey Pinstripes with Green Ties, Higher Education 21’s Sustainability Indicators, Indicators Snapshot Guide, Performance Survey, SAQ, State of the Campus Environment
A content analysis with a focus on strengths and weaknesses of tools was conducted.The tools vary greatly in their purpose, function, scope, and state of development.
Yarime & Tanaka (2012) [16]n = 16
AISHE, Campus Ecology, Campus Sustainability Selected Indicators Snapshot, College Sustainability Report Card, CSAF, CSAF core, CSARP, EMS Self-Assessment, Environmental Workbook and Report, GASU, Good Company’s Sustainable Pathways Toolkit, HEPS, Penn State Indicator Report, SAQ, STARS, State of the Campus Environment
A mixed-method approach with a quantitative and a qualitative part was applied: (1) comparative analysis of criteria and (2) content analysis of individual indicators.The main focus of the tools is on campus operations and governance issues. Education, research, and outreach are not well addressed.
Sayed et al. (2013) [37]n = 4
SAQ, CSAF, CSRC, STARS
Each tool was rated based on 27 questions related to five areas of campus life of a specific university.STARS was identified to be the most effective SAT. SAQ and CSAF have limitations in assessing SD in campus operations.
Fischer et al. (2015) [15]n = 12
AISHE, Alternative Universal Appraisal, Conference of Rectors of Spanish Universities, CSAF, German Commission for UNESCO, Graz Model of Integrative Development, Green Plan, Innovación y Educación Ambiental en Iberoamérica, People & Planet, Red de Ciencia, Tecnología, SAQ, STARS, UI GreenMetric
A mixed-method approach with a quantitative and a qualitative part was applied: (1) comparative analysis of criteria and (2) introductory passages in supporting documents.Indicators and criteria are biased towards the field of operations.
Bullock & Wilder (2016) [10]n = 9
ACUPCC, College Sustainability Report Card, Grey Pinstripes with Green Ties, Pacific Sustainability Index (PSI), Princeton Review’s Green Ratings, Sierra Club’s Cool Schools, STARS, The Guardian’s Green League, UI GreenMetric
Sustainability assessment frameworks and SATs based on the GRI-HE framework were evaluated.The evaluated sustainability assessments and SATs are not comprehensive and lack coverage of the economic and social dimension of sustainability.
Alghamdi et al. (2017) [33]n = 12
Adaptable Model for Assessing Sustainability in Higher Education, AISHE, Alternative University Appraisal, GASU, Green Plan, SAQ, STARS, Sustainable Campus Assessment System, Sustainable University Model, UI GreenMetric, Unit-based Sustainability Assessment Tool, University Environmental Management System
A desk study approach with quantitative and qualitative elements was applied including a review of research articles, academic books, network platforms, graduate theses, and websites.The tools share similar characteristics in terms of their criteria and indicators, which can be grouped into: management, academia, environment, engagement, and innovation. Environmental indicators have the highest share among the tools.
Berzosa et al. (2017) [14]n = 4
AISHE, SAQ, Sustain Tool, USAT
A descriptive analysis of SATs based on single case studies was performed.The SATs positively influence creating specific plans in education, research, outreach, and campus operations. They have a strong focus on the environmental dimension and delivered similar outcomes.
Table 2. Examples of indicators classified into (core) elements.
(Core) ElementExamples
Institutional frameworkOn broad-scale policies and the administrative structure of the HEIs, including, e.g., governance body structure, vision and mission statements, policies for staff and faculty hiring, budget issues, student associations, and development programs for staff and faculty
EducationTeaching, curriculum, and all other activities aiming for the education of students
ResearchResearch-related activities of the HEIs, e.g., allocation of research funds, transdisciplinary research programs
OutreachHEI’s collaboration efforts with external stakeholders on regional, national, and international level
Campus operationsHEI’s environmental management, procurement policies and practices, infrastructure, and workspace-related issues such as safety regulations
Campus experiencesOn-campus experiences for students and staff (e.g., student crime) and individual behaviors not related to studying or working (e.g., alcohol consumption)
Assessment and reportingHEI’s assessment and reporting processes that are geared towards the engagement with external stakeholders (e.g., external assurance, reporting cycles, stakeholder identification processes)
Higher education institutionActivities or impacts on the institutional level that cannot be influenced by measures in one of the core elements, e.g., demographic effects on the region through student in-migration
Table 3. (Core) Elements (in %).
Assessment ToolInstitutional FrameworkEducationResearchOutreachCampus OperationsCampus ExperiencesAssessment & ReportingHEINA
AISHE23.3320.0020.0020.006.670.0010.000.000.00100.00
AMAS44.004.004.008.0024.000.0012.004.000.00100.00
BSIS7.1426.1919.0518.250.790.000.0023.025.56100.00
CSA4.656.986.982.3372.086.980.000.000.00100.00
CSAF31.955.333.541.7848.525.920.001.181.78100.00
D-SiM8.9310.715.361.7946.430.000.0014.2912.49100.00
DUK20.0030.0020.000.0020.000.0010.000.000.00100.00
GASU28.1610.926.901.7221.841.7211.494.6112.64100.00
GMID20.0020.0020.0040.000.000.000.000.000.00100.00
P&P33.3311.760.000.0050.991.961.960.000.00100.00
PENN6.063.039.090.0069.7012.120.000.000.00100.00
SAQ21.9412.209.764.8829.269.760.0012.200.00100.00
SCE23.1918.842.900.0055.070.000.000.000.00100.00
SPT24.146.890.000.0068.970.000.000.000.00100.00
STARS26.4816.184.418.8233.820.002.942.944.41100.00
STAUNCH®0.00100.000.000.000.000.000.000.000.00100.00
TUR20.0040.0033.330.006.670.000.000.000.00100.00
UIGM0.004.357.250.0063.771.454.351.4517.38100.00
USAT30.6721.339.348.0021.334.000.001.334.00100.00
Overall average20.9016.047.855.2034.482.562.915.035.03100.00
Table 4. Assessment Target (in %).
Assessment ToolPerformance IndicatorProxy IndicatorImpact IndicatorNA
AISHE83.330.0016.670.00100.00
AMAS84.0016.000.000.00100.00
BSIS18.2570.6411.110.00100.00
CSA67.4425.586.980.00100.00
CSAF81.6616.571.180.59100.00
D-SiM28.5617.8614.2939.29100.00
DUK100.000.000.000.00100.00
GASU59.7719.544.0216.67100.00
GMID100.000.000.000.00100.00
P&P82.3517.650.000.00100.00
PENN39.3951.529.090.00100.00
SAQ100.000.000.000.00100.00
SCE86.9613.040.000.00100.00
SPT65.5217.2417.240.00100.00
STARS88.247.350.004.41100.00
STAUNCH®100.000.000.000.00100.00
TUR100.000.000.000.00100.00
UIGM72.4717.390.0010.14100.00
USAT100.000.000.000.00100.00
Overall average69.8420.554.145.47100.00
Table 5. Cross-tabulations of proxy and impact indicators (absolute and relative frequencies).
Proxy IndicatorImpact IndicatorTotalX2 1
(Core) ElementsCampus Operations121 (43.21%)14 (5.00%)135 (48.21%)52.20 ***
Higher Education Institution33 (11.79%)12 (4.29%)45 (16.08%)
Outreach22 (7.85%)6 (2.15%)28 (10.00%)
Research22 (7.85%)1 (0.36%)23 (8.21%)
Education10 (3.57%)7 (2.50%)17 (6.07%)
Institutional Framework13 (4.65%)2 (0.71%)15 (5.36%)
Campus Experiences4 (1.43%)3 (1.07%)7 (2.50%)
Assessment & Reporting0 (0.00%)0 (0.00%)0 (0.00%)
NA8 (2.86%)2 (0.71%)10 (3.57%)
Total233 (83.21%)47 (16.79%)280 (100.00%)
SD Impact AreasNatural Environment123 (43.94%)15 (5.36%)138 (49.30%)45.87 ***
Economy53 (18.93%)13 (4.64%)66 (23.57%)
Societal Challenges24 (8.57%)13 (4.64%)37 (13.21%)
Culture2 (0.71%) 2 (0.71%)4 (1.42%)
Policy making2 (0.71%)1 (0.36%)3 (1.07%)
Demographics2 (0.71%)0 (0.00%)2 (0.71%)
NA27 (9.64%)3 (1.08%)30 (10.72%)
Total233 (83.21%)47 (16.79%)280 (100.00%)
Impact TypeDirect232 (82.85%)40 (14.29%)272 (97.14%)117.93 ***
Indirect1 (0.36%)7 (2.50%)8 (2.86%)
Total233 (83.21%)47 (16.79%)280 (100.00%)
Indicator TypeQuantitative162 (57.86%)13 (4.64%)175 (62.50%)107.49 ***
Quasi-Quantitative39 (13.93%)15 (5.36%)54 (19.29%)
Qualitative32 (11.42%)19 (6.79%)51 (18.21%)
Total233 (83.21%)47 (16.79%)280 (100.00%)
Level of analysisOrganizational211 (75.36%)32 (11.43%)243 (86.79%)68.89 ***
Individual22 (7.85%)15 (5.36%)37 (13.21%)
Total233 (83.21%)47 (16.79%)280 (100.00%)
1 Note: The p-values indicate the statistical relationship between assessment target (proxy and impact indicator) and the other categories. *** p < 0.001.
Table 6. Major themes of proxy and impact indicators.
SD Impact AreaProxy IndicatorImpact Indicator
Natural Environment
  • Consumption of energy, water and materials
  • Emission of GHGs
  • Generation of waste
  • Effects on conditions (e.g., biodiversity, groundwater)
  • Generation of waste
Economy
  • Local expenditures
  • Research concerning the local economy
  • Local job creation
  • Alumni in the job market
  • Start-ups in the region
Societal Challenges
  • Stakeholder engagement and community development
  • Health and safety issues
  • Stakeholder engagement and community development
  • Health and safety issues
Policy making
  • Contribution to public policy development
  • Contribution to public policy development
Culture
  • International student exchange
-
Demographics
  • In-migration of students
-

