Article

Changes in Soil Properties and Productivity under Different Tillage Practices and Wheat Genotypes: A Short-Term Study in Iran

by
Shokoofeh Sarikhani Khorami
1,2,
Seyed Abdolreza Kazemeini
2,
Sadegh Afzalinia
3 and
Mahesh Kumar Gathala
4,5,*
1
Department of Seed and Plant Improvement Research, Fars Agricultural and Natural Resources Research and Education Center, Agricultural Research, Education and Extension Organization (AREEO), Shiraz 7341653111, Iran
2
Department of Crop Production and Plant Breeding, School of Agriculture, Shiraz University, Shiraz 7144165186, Iran
3
Department of Agricultural Engineering Research, Fars Agricultural and Natural Resources Research and Education Center, Agricultural Research, Education and Extension Organization, Shiraz 7341653111, Iran
4
International Maize and Wheat Improvement Center, Dhaka 1213, Bangladesh
5
International Maize and Wheat Improvement Center, Tehran 3135933151, Iran
*
Author to whom correspondence should be addressed.
Sustainability 2018, 10(9), 3273; https://doi.org/10.3390/su10093273
Submission received: 25 August 2018 / Revised: 6 September 2018 / Accepted: 7 September 2018 / Published: 13 September 2018

Abstract

:
Natural resources are the most limiting factors for sustainable agriculture in Iran. Traditional practices are intensive tillage that leads to a negative impact on crop productivity and soil properties. Conservation agriculture including tillage reductions, better agronomy, and improved varieties, showed encouraging results. The goal of this study was to test combined effect of tillage practices and wheat (Triticum aestivum L.) genotypes on soil properties as well as crop and water productivity. The experiment was conducted at Zarghan, Fars, Iran during 2014–2016. Experimental treatments were three-tillage practices—conventional tillage (CT), reduced tillage (RT), and no tillage (NT)—and four wheat genotypes were randomized in the main and subplots, respectively using split-plot randomized complete block design with three replications. Results showed NT had higher soil bulk density at surface soil, thereby lower cumulative water infiltration. The lowest soil organic carbon and total nitrogen were obtained under CT that led to the highest C:N ratio. Reduced tillage produced higher wheat yield and maize (Zea mays L.) biomass. Maximum irrigation water was applied under CT, which leads lower water productivity. The findings are based on short-term results, but it is important to evaluate medium- and long-term effects on soil properties, crop yields and water use in future.

1. Introduction

Water and soil resources are the most constraining factors for sustainable agriculture in the arid and semiarid climatic conditions. Application of conservation tillage practices may conserve water and soil when weather and field conditions are critical in intensive cropping systems [1,2]. Therefore, conservation tillage practices have created counterbalance interest worldwide from agricultural research, and mostly farmers [3]. Areas under conservation agricultural-based tillage practices have been recently increased in Iran [4,5]. Therefore, investigation about impacts of these new practices on soil properties, water and crop productivity is necessary.
Soil management has an important effect on the soil properties, water dynamics and its efficiencies on crops [6]. The effect of tillage and crop residue mulch on soil bulk density is mainly confined to the top 20 cm of soil [7,8,9]. Evidences of some short- to medium-term studies on wheat- based systems, showed that conservation tillage practices (no and reduced tillage) either with partial crop residue or removed, increased soil bulk density on surface soil compared with conventional tillage practices [10,11,12,13,14,15]. Li et al. [16] investigated the influence of no tillage and conventional tillage on soil bulk density in a 15-year field experiment. In the first six years, the surface soil’s bulk density was significantly lower under conventional tillage. In next five years, soil bulk density of both treatments were similar, and in the last two years, bulk density became slightly lower under no-till.
Tillage practices may also influence the distribution pattern of soil organic carbon (SOC). It was observed higher SOC concentration in the surface layers in no tillage than conventional tillage practice, but a higher concentration of SOC in the deeper soil layers of reduce tilled plots where crop stubbles are incorporated through tillage [8,9,17,18]. Conservation tillage practices are an operative management practices to increase SOC [19,20,21,22]. Conversely, other studies have reported that no tillage without crop residue resulted in lesser or no change in SOC [23,24].
The presence of available soil nitrogen for plant uptake depends on the rate of carbon mineralization. In initial years, no tillage practice is generally associated with lower soil available nitrogen because of higher immobilization by the crop residues mulched on the soil surface [25]. In contrast, noticeable increases in total nitrogen have been quantified under both no tillage and permanent raised beds practices with crop residue retention compared with conventional tillage practice [26,27,28]. Conservation tillage practices having more soil water retention capacity than the conventional tillage practices due to mulching crop residue on the soil surface by improving the least limit water range [12,29,30,31]. The results of 35 experiments in Argentina presented that in drier soils, no tillage practice had a mean of 13–14% more water root zone than tilled soils [32]. The more water retention under no tillage practice could increase water use efficiency as compared with the conventional tillage practice [33]. However, it [23] showed that the lowest soil moisture content was found under no tillage with residue removal and the highest was achieved under no tillage with residue retention while conventional tillage had intermediate soil moisture values. In a long-term experiment in China and India, the infiltration rate under no tillage with residue retention was higher than conventional tillage and no tillage when crop residue either burnt or removed [13,23,27,29,34].
There is a need for conservation tillage practices that include improved varieties as an important component [2]. It was reported that grain yield, and its components of wheat cultivars were significantly affected by interaction between wheat genotypes and tillage practices [35,36]. Recently, 26 bread and durum wheat genotypes tested under conventional and permanent beds over six years, results showed that number of grains influenced by tillage. It was further confirmed that the combined effect of both genotype and tillage was significant for yield in bread wheat [37]. Contrary, other researchers working on both spring and winter wheat found that varieties with appropriate performance in no tillage practice also properly performed in tilled practice [38,39,40,41,42,43]. A study in India, comparing 12 wheat genotypes under conventional and no tillage practices, PBW 443 and HD 2627 cultivars did not perform well under the no-tillage practice, whereas HUW 468, HUW 234, and PBW 343 cultivars had identical performance under both tillage practices [44]. It was concluded that cultivars adapted to no-tillage production practices should be bred and developed under no tillage [45,46]. These contradictions led us to investigate whether available improved wheat varieties and advanced lines should be performed and responded similarly for each tillage practice in Iran. Therefore, the objective of this study was to evaluate combined effects of different tillage practices and wheat genotypes on grain yield, yield components, water use, and on soil properties.

2. Materials and Methods

2.1. Site Description

The experiment was conducted at the Zarghan Field Station, Agriculture and Natural Resources Research and Education Center of Fars Province, (29°47′ N, 52°43′ E, 1604 m a.s.l.), in southern Iran. The soil in this region is classified as a fine, carbonatic, termic, Typic, Haploxerepts with calcareous and gypsiferous alluvium parent materials containing inherent major clorite and illite clay minerals. The silty clay loam topsoil (0–30 cm soil depth) with 39.4% silt, 38.6% clay and 22% sand, with selected background properties. The experimental soil in initial year was slightly alkaline in nature having 7.9 soil pH, 2.94 EC dSm−1 and the 0.96%, 16.4 ppm, 384 ppm were soil organic carbon, available P and K at 0–30 cm of soil depth, respectively. The ground water table of the study area was ranging from 100 to 130 m depending on the elevation and it is depleting at alarming rate annually. The deeper aquifers water quality is poor with saline in nature having pH 7.5–8.5.

2.2. Experimental Procedure

This study was conducted in an ongoing experiment setup in 2011 with the same tillage practices (CT, RT and NT) and following the same wheat and maize genotypes. The two years during 2014–2016 of short-term study findings are presented in this article.
The winter and summer crops in the experiment were spring wheat planted in November and harvested in late June for both years, and forage maize cv. Fajr (KSC260) hybrid which was planted in early July and harvested in mid-October as shown in Figure 1.
The experiment was designed for a split plot randomized complete block design which has been carried out in 2014–2016. Experimental treatments included three tillage practices (conventional, reduced, and no-tillage) as described in Table 1, which assigned to main plots and four spring wheat genotypes of Chamran, Sirvan, Picaflor#1, and M-89-10 in subplots.
The main plot (tillage) and subplots (wheat genotypes) were randomized and replicated thrice. Individual tillage plot was 25 m length and 27 m in width (675 m2 plot size), whereas each wheat genotype plot was 150 m2 (25 × 6-m).
In order to manage crop residue in conservation tillage plots, excess wheat straw was removed by raking out of plots to reach approximately 30% soil surface coverage, which was about 3.0 t ha−1. To reach the same amount of soil coverage in forage maize, 25-cm of standing maize stubbles (3 ± 0.2 t ha−1) were kept after harvest. Each subplot consisting of eight maize rows planted on 75-cm row spacing and plant spacing of 12-cm. Wheat was seeded by using 180-kg seed ha−1 at 20-cm row to row spacing in all plots.
The nitrogen, phosphorus, and potassium nutrients were applied on the basis of a soil test-based recommendation. In both wheat and maize crops, all plots received 150 kg N (as diammonium phosphate and urea) +10.27 kg P (as diammonium phosphate) and no potassium as soil test values showed 384 ppm high available potassium, respectively. In wheat, full dose of P and 1/3rd dose of N were applied at seeding by using seed and fertilizer drill and remaining N was side-dressed in two equal splits at the tillering and flowering growth stages. Similarly, maize plots received full dose of P and 1/3rd dose of N at seeding and remaining N was side dressed in two equal splits at V10–12 and silking growth stages, respectively.
Pests (sunn pests and aphides) and weeds were controlled in the wheat growing season by appropriate, available pesticides and herbicides including Deltamethrin 300 cc ha−1 (a.i. 25 g L−1); Fenitrothion, 1.2 L ha−1 (a.i. 1000 g L−1); Pinoxaden, 1.5 L ha−1 (a.i. 50 g L−1), and 2.4-D, 2 L ha−1 (a.i. 480 g L−1). There were not observed any disease on wheat and maize. In the maize growing season, effective herbicides were applied including 2.4-D, 2 L ha−1 (a.i. 480 g L−1), and Nicosulforon, 2 L ha−1 (a.i. 750 g Kg−1). Gated pipe was used for surface flood irrigation for wheat and maize. In the second year, the winter wheat genotypes were planted exactly similar to the first year and on the same plots.

2.3. Soil Sampling

A composite soil sample from four locations in a zigzag pattern (targeting one sample from each sub-plot) were collected from each main plot at 0–30 cm soil depth after wheat harvest at June, 2016 to determine the total organic carbon [47], total nitrogen [48], C/N ratio [49]. Soil bulk density [50] was determined by taking soil samples at 0–10 and 11–20-cm soil depths by using a standard core sampler (4-cm-long and 8-cm in diameter) and oven-dried at 105 °C for 48 h. The following equation was used to calculate the soil bulk density:
B D = W d V
where:
  • BD = soil bulk density (g cm−3),
  • Wd = sample oven dry weight (g), and
  • V = sample total volume (cm3).
The cumulative water infiltration (CWI) was measured into soil using a double-ring infiltrometer (ASTM D3385–09) [51]. The double-ring infiltrometer test (DRIT) procedure involved inserting two rings (an outer ring with a 70-cm diameter, and a 50-cm inner ring) into the 5-cm depth of the soil. The outer ring was used to prevent or minimize horizontal water movement during the test. Water was added in both rings and a water stream flow was maintained for a constant head. The volume of water added over time (overall 150 min) was measured to calculate the CWI of the soil.
Irrigation was applied during critical wheat growth stages (initiation of tillering, maximum tillering, flowering, late milking, soft dough, hard dough). The first two irrigations were supplied by rainfall. The volume of water needed for irrigation was determined based on water height (4-cm) in each main plot and it was measured by water flow meter.

2.4. Crop Sampling

After wheat physiological maturity, two 1-m2 quadrates samples of each plot were cut at soil surface to determine harvest index (HI), and biomass. A 1-m2 quadrate was placed in each plot for counting number of spikes (bearing culms). Randomly 10-selected plants were used for the number of grains per spike by threshing individually of 10 randomly selected spikes per plot. The 1000-grain weight (TGW) was measured by taking a random sample of whole grains using grain counter, re-dried at 70 °C for 48 h. The grain yield was measured by harvesting whole plot for treatments (25 × 6 m) including two quadrates [52]. Maize biomass was measured at the early dough stage by weighing all fresh above ground (total plant consisting ears) from six middle rows of each plot. Randomly 10-selected plants were used for determining plant height (from the soil surface to the first branch of tassel), leaf number per plant, stem diameter (between first and second node), and ear (dehusked ear) weight [53].
Water productivity was computed using the following equation [1]:
W P i = Y W i
where:
  • WPi = irrigation water productivity (kg m−3),
  • Y = crop yield (kg ha−1), and
  • Wi = water applied [irrigation (m3 ha−1)].
I W P = Y W
  • IWP = input water productivity (kg m−3),
  • Y = crop yield (kg ha −1), and
  • W = water applied [irrigation + rainfall (m3 ha−1)].

2.5. Data Analysis

Collected data were analyzed using SAS statistics software (SAS Institute 8.0.2, 2003) [54]. The data for each year were further analyzed if the interaction between year and treatments was significant. Means comparison were performed using Tukey’s honest significant difference (HSD) (p < 0.05). Since the interactions between year and treatments (tillage and genotype) were not significant, two years of data were pooled in all parameters except for the spike per m2 and grain yield, which were reported based on each year.

3. Results and Discussion

3.1. Soil Properties
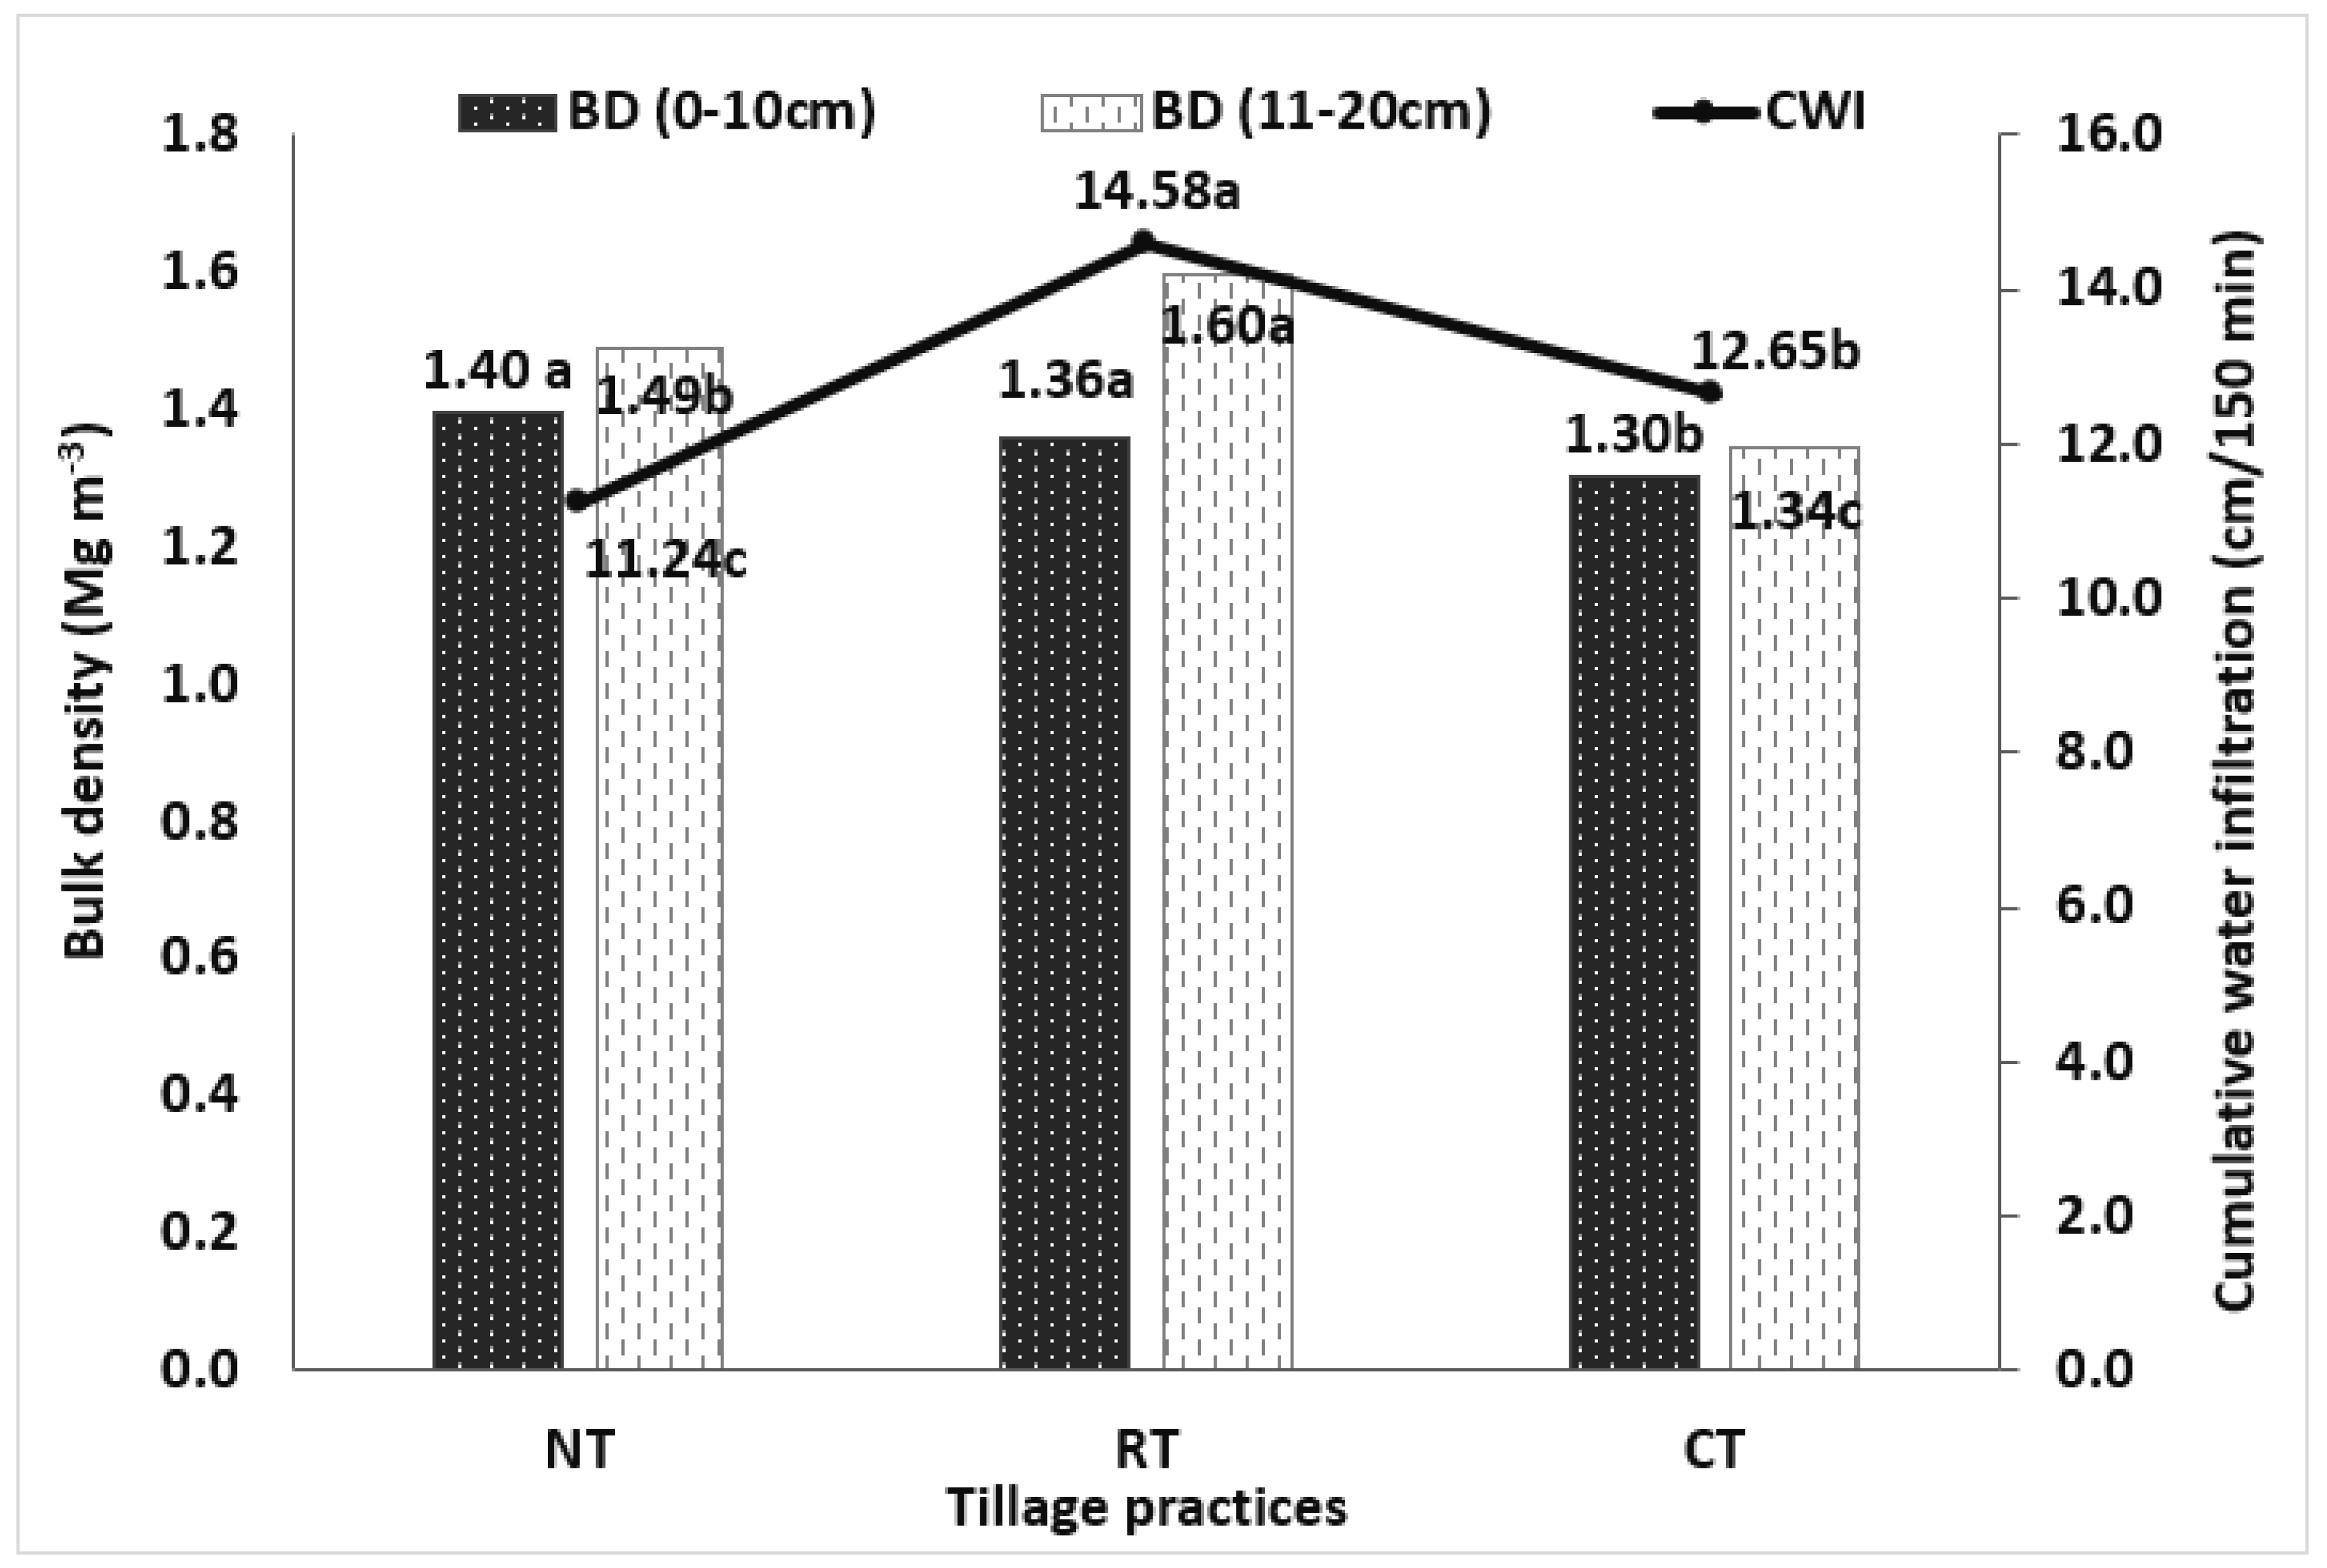
3.1.1. Bulk Density

Bulk density at both soil depths was significantly affected by tillage practices (p = 0.0016 and <0.0001 at 0–10-cm and 11–20-cm soil depth respectively).
In general, soil bulk density was increased with an increase in soil depth (Figure 2). The lowest soil bulk density was associated with CT practice at both soil depths. Higher soil bulk density at surface soil depth (0–10-cm) was observed 1.40 Mg m−3 and 1.36 Mg m−3 under NT and RT practices, respectively. The subsurface (11–20-cm) soil bulk density followed the trend of RT > NT > CT and later had 19% lower bulk density than former (Figure 2). Lower bulk density in both soil depths (0–10 and 11–20 cm) was observed under CT practice because of deep and heavy soil disturbance by using moldboard plough (up to 25-cm soil depth) followed disking. Similar results also reported by these researchers [14,55]. The higher surface soil bulk density under NT practice related to minimum soil disturbance by eliminating prior tillage, which leads surface soil compactness and it could also be associated with low crop residue retention which leads rain drop beating effects on top soil [11,12,15]. Our results varied with the findings of other studies who showed lesser soil bulk density in the top layers under NT practice than that of CT practice, particularly in fine-textured soils, which was attributed due to development of an organic-rich mulch and possibly enhanced faunal activity. Whereas, there was no significant difference in soil bulk density between CT and NT practices in the deeper layers [12,56,57]. The presence of crop residues on soil surface prevents aggregate breakdown by direct raindrop impact as well as by rapid wetting and drying of soils. It was [58] also reported lower soil bulk density under NT practice relative to tilled plots but, it varies on length of the study, residue retention and soil type. Greater difference in soil bulk density between two depths under RT practice compared to CT practice was related to shallow tillage and soil disturbance up to 10 cm, which was attributed to subsurface soil compaction at plough pan. It could be due to direct physical compaction of heavy machineries traffic and repetitive cultivation at same depths [13,29]. These results are also in line of our findings where 0–10 cm soil surface had lower soil bulk density (1.36 Mg m−3) than 11–20 cm (1.60 Mg m−3) under RT practice (Figure 2).

3.1.2. Cumulative Water Infiltration

Cumulative water infiltration (CWI) was significantly affected by tillage practice in order of RT > CT > NT with the p = 0.001. Greater CWI was observed under RT (14.58 cm/150 min) and least in ZT (11.24 cm/150 min) practices, respectively (Figure 2). Higher CWI under RT and CT practices was probably due to greater porosity created by tillage within the plowed layer and lower soil bulk density (as discussed in preceding sections) [59,60,61]. Higher CWI under RT practice could also be attributed to incorporation of crop residue in top 0–15 cm soil depth, which leads better soil porosity and aggregation formation [13,62]. Unlike the present study, other studies reported higher CWI under NT practice with residue retention as compared to CT practice. Leaving crop residue on soil surface under NT practice might have facilitated formation of continuous soil pores from the soil surface to depth [12,63], increased SOC, and reduced the runoff velocity, thereby water had more time to infiltrate [23,27,29,64]. In our current study, the CWI was measured for short time (only for 150 min), but it could be resulted differently when, it was observed for longer duration over 24 h, then the percolation rate might be reduced due to plough hard pan under CT and RT practices.

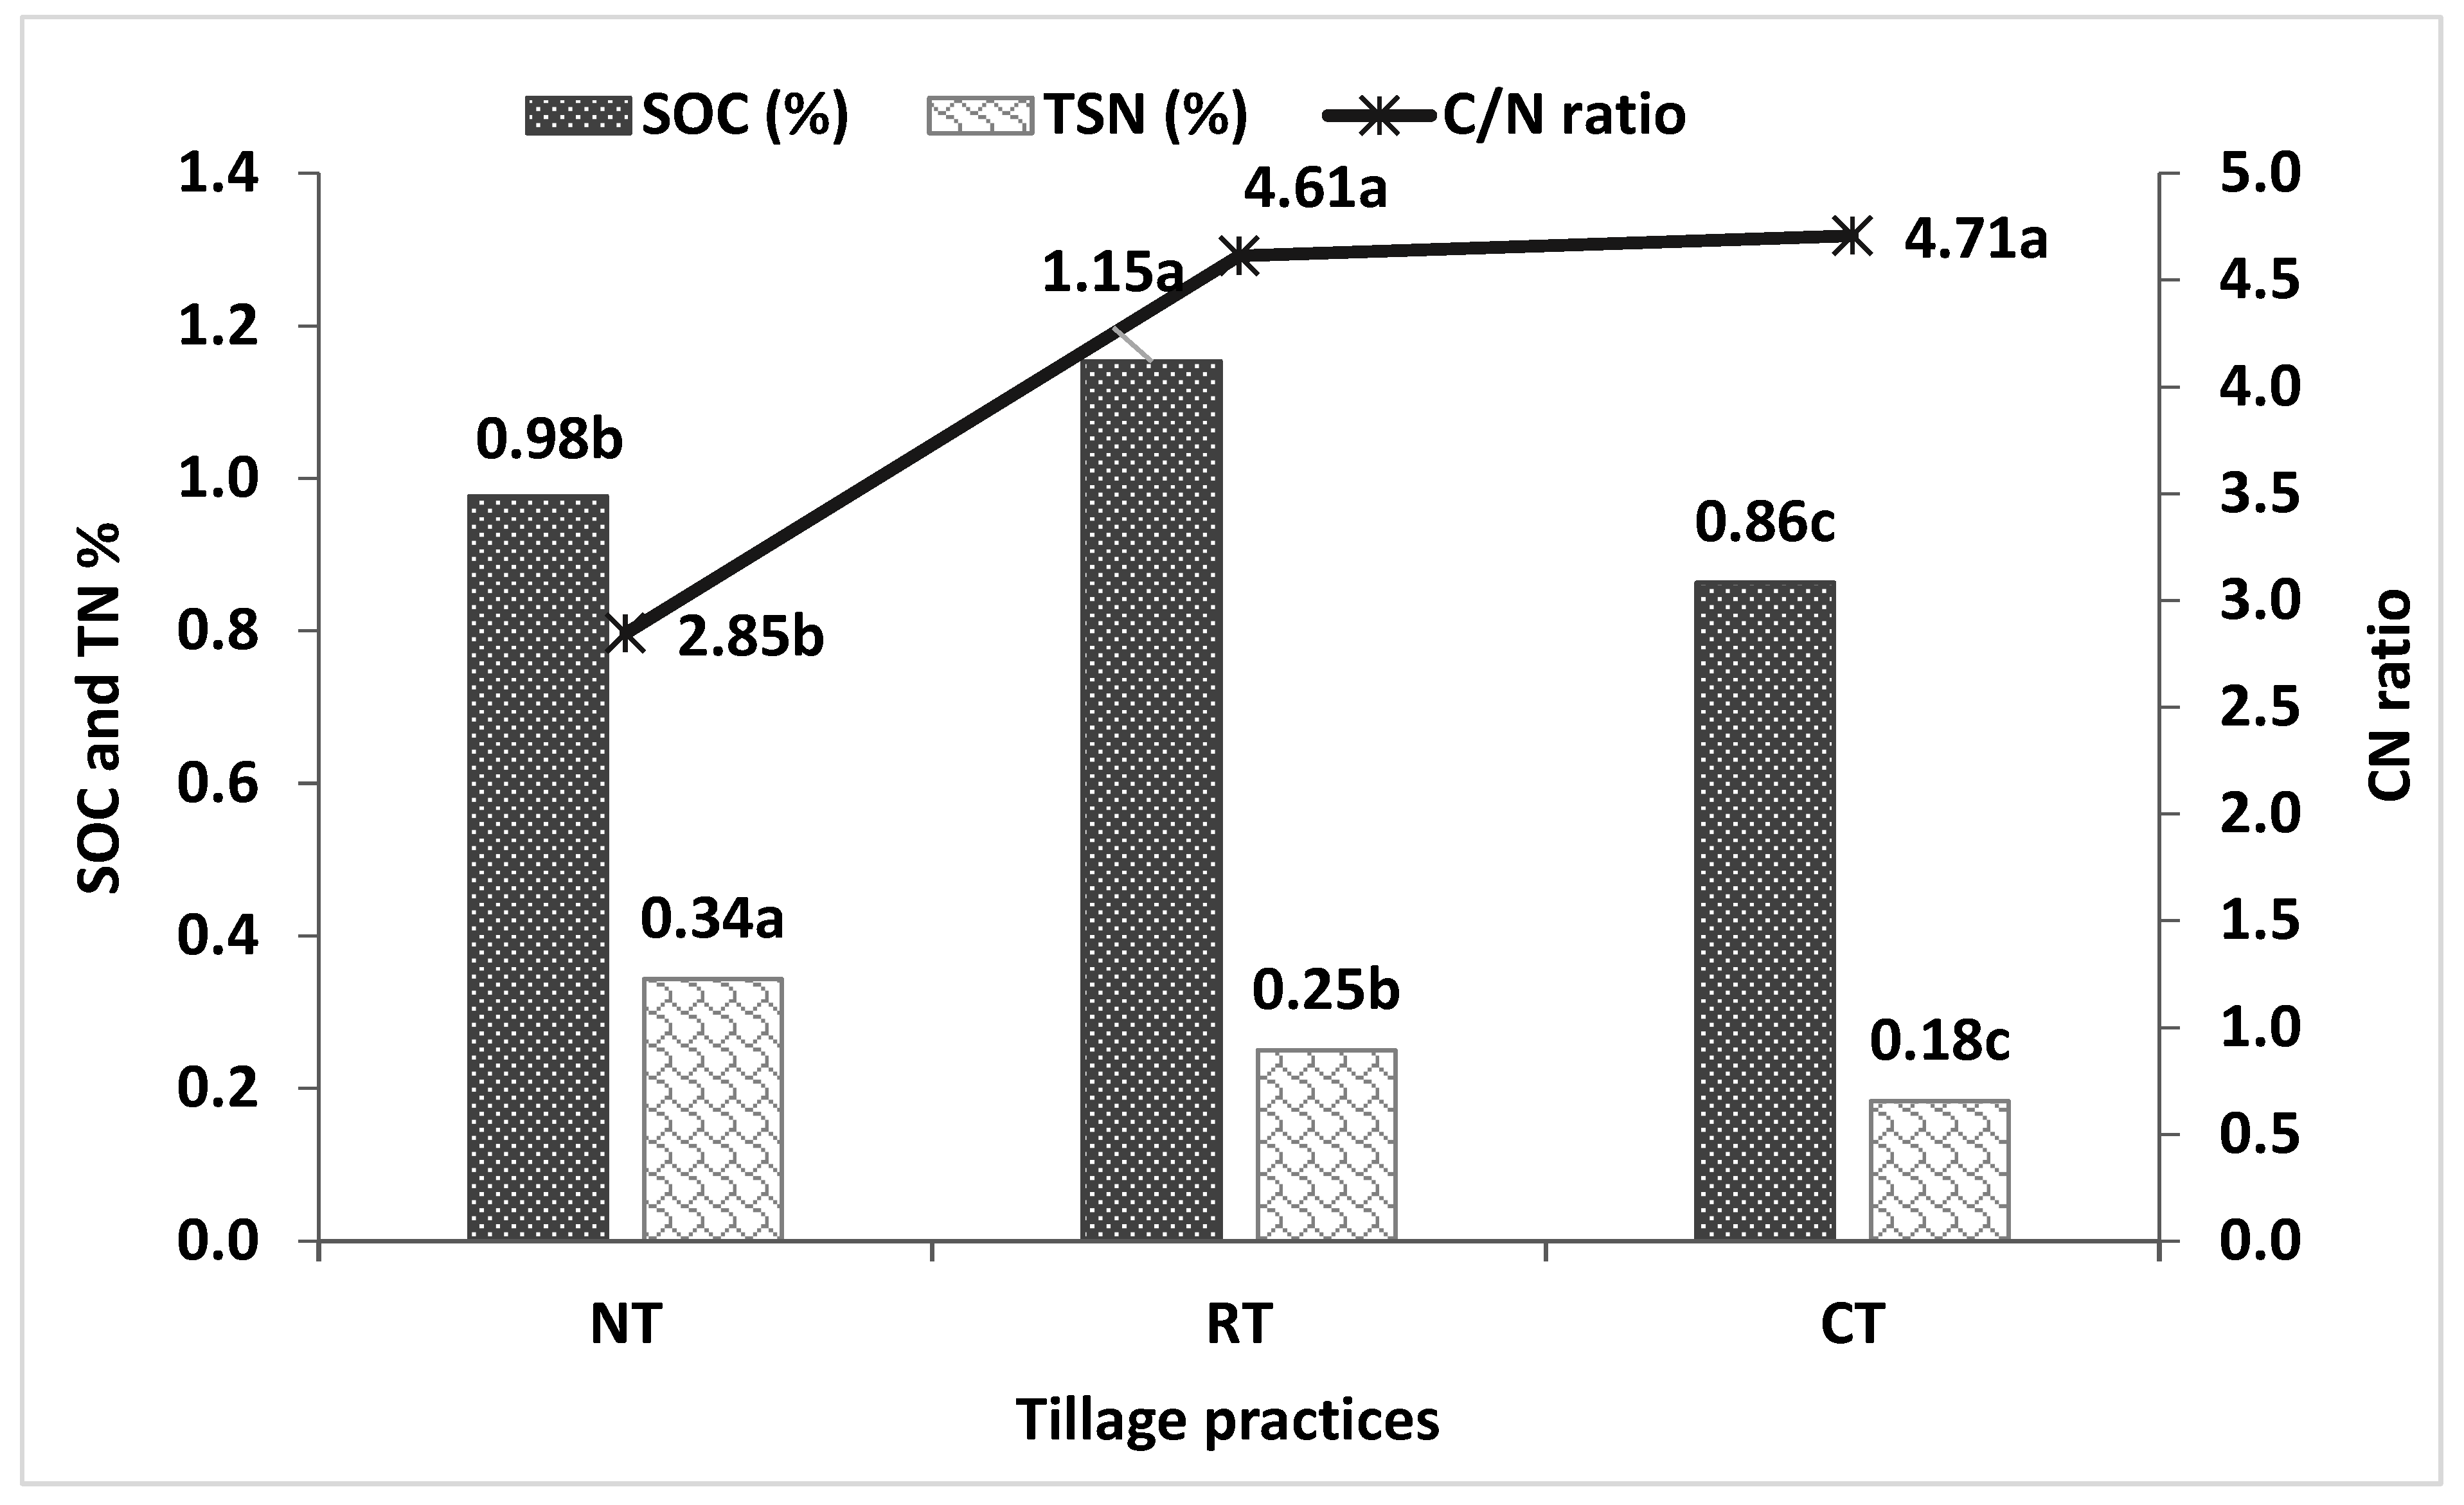
3.1.3. Soil Organic Carbon, Total Nitrogen and C:N Ratio

Soil organic carbon (SOC) was significantly varied amongst tillage practices (Figure 3).
The highest SOC was obtained under RT followed by NT, which were 34% and 13% greater than CT (p ≤ 0.0001). It was also observed that RT had significantly higher SOC than NT (Figure 3). The lowest SOC in CT was attributed to intensive and deep tillage (moldboard plough followed by disking and tilling) in absence of crop residue which led to soil structure deterioration, possibly higher carbon mineralization rate and soil organic matter decomposition had facilitated carbon loss [13,22,65,66]. No tillage practice reduced breakdown of macro-aggregates where carbon impounded which buildup higher SOC [13,29]. The higher SOC in NT than CT were found in this study which is aligned with elsewhere other researchers’ findings [67,68].
Total nitrogen (TN) was significantly influenced among tillage practices (p ≤ 0.0001) in order of NT > RT > CT with respective values of 0.34, 0.25, and 0.18% (Figure 3). Higher TN under conservation tillage (NT and RT) practices with residue retention as compared to conventional tillage (CT) practice might be due to N immobilization in crop residue and microbial biomass [19,69,70,71]. Jat et al. [13] reported higher nitrogen concentration by 29 and 36% under RT and NT than CT. He also found higher nitrogen concentration at 15–30 cm soil depth under RT where crop residue was incorporated.
The C:N ratio is related to the deviations in soil carbon and nitrogen presence. The C:N ratio varied from 2.84 to 4.71 between tillage practices with p ≤ 0.0001 value. Soil C:N ratio was the lowest under NT practice (2.85) than RT (4.61) and CT (4.71) practices with no significant difference between the latter ones (Figure 3). The lowest C:N ratio under NT practice was mostly related to the more TN concentration [72], which was similar with findings of Dikgwatlhe et al. [70] and Alijani et al. [19]. Slow crop residue decomposition due to less expose with soil particles under NT practice might have built up higher SOC and TN in the top layer [13,67,69,70]. A significantly higher particulate carbon fraction and nitrogen under NT practice was associated more with fine fractions (20–30% higher than CT practice). The intra-aggregate particular organic matter carbon (POM-C) and nitrogen are physically better protected than other POM-C fractions in soil [67,73,74,75]. The recent studies result also suggested that minimum physical disturbance under NT practice developed improve soil aggregates and greater accumulation of both coarse and fine iPOM-C and N fractions. Furthermore, the higher amounts of macro aggregates together with increased iPOM-C indicate to improve the soil carbon and nitrogen stocks under NT practice [73,76].

3.2. Wheat Grain Yield and Yield Components

There was no significant interaction between year and treatments (tillage practices and wheat genotypes) except for effective tillers and grain yield, therefore the data reported based on each year (Table 2).
Effective tillers per m2 was affected by tillage practices and genotypes in both years. Averaged over tillage practices, the number of effective tillers m2 was higher in 2014–2015 than 2015–2016. No till practice produced the minimum (352) and maximum (351) number of effective tillers m−2 in 2014–2015 and 2015–2016, respectively (Table 2). The second year (2015–2016) better crop establishment under NT practice resulted higher number of effective tillers than those of CT and RT practices performed in 2014–2015. Conversely, the maximum and minimum number of effective tillers were observed under CT practice during 2014–2015 and 2015–2016 respectively and it was intermediate under RT practice in both years. Chamran and M-89-10 genotypes were produced the maximum and minimum numbers of effective tillers m−2, respectively, in both years. The findings of other many studies [77,78,79], who showed wheat effective tillers m−2 was significantly lower under CT practice compared to NT practice, confirmed the results of the second year of this study.
The grain yield was significantly affected by tillage practices in both years (Table 2). Wheat grain yield was higher under RT practice (3.43 t ha−1), with no significant difference with CT practice (3.23 tha−1) in both years (p = 0.0002 and 0.0061). Grain yield was consistently lower under NT practice than RT practice by 1.2 t ha−1 and 0.52 t ha−1 which was 50 and 23% in 2014–2015 and 2015–2016, respectively (Table 2). The poor grain yield under NT practice could be related to lower irrigation water application by 36% and 23% than those of CT and RT practices. Lower irrigation water application might be not supplied enough water to plant at critical wheat growth stages like grain filling and physiological maturity, while peak terminal heats and high evapotranspiration pressure, resulted in lower 1000-grain weight (Table 3). It was also probably due to higher soil bulk density and lower water infiltration (Figure 2), which could be associated with lower soil moisture in root zones under NT with no residue [63]. In addition to above, there are still need further refinement and improvement for NT planters in Iran which may help for better crop establishment. In contrast, these researchers [29,68,80,81] reported increase in wheat grain yield under NT practice than CT practice. The NT practice effects on wheat grain yield may improve with time in longer-term continuous NT practice [25]. The positive wheat grain yield response to RT practice, which was observed in this study, was also in line with other studies [19,77,78,82] that found that wheat grain yield was significantly greater under RT practice than CT practice.
Thousand grain weight (TGW) was affected by tillage practices (Table 3). The CT practice significantly improved TGW (37.33 g) over both RT and NT (35.03 g) practices (p = 0.0137). Lower TGW under NT and RT practices could be due to water stress at grain filling stage as both treatments received lower irrigation water than that of CT practice. The TGW and grains per spike varied in wheat genotypes (p ≤ 0.0001). Chamran cultivar produced minimum TGW (31.58 g) and maximum grains per spike (39), respectively compared to the other three genotypes (Table 3). The TGW of Chamran tended to decrease when the number of effective tillers m−2 and grain per spike increased (Table 2) and (Table 3). Apparently, wheat genotypes adjust yield components (effective tillers m−2 and grains per spike) when one component (TGW) is reduced [78]. The interaction between tillage practices and wheat genotypes was non-significant for yield components and irrigation parameters (Table 2) and (Table 3). These results indicated that response of all genotypes to different tillage practices were similar. This could be explained by the fact that studied wheat genotypes were selected under the conventional tillage and none of them was developed specifically for NT practice [39,41,42,43].

3.3. Water Used and Water Productivity

The irrigation water application varied in years (p ≤ 0.0001) and among tillage practices (Table 3). The total irrigation water application was higher in 2014–2015 (2230 m3 ha−1) than 2015–2016 (1916 m3 ha−1), and it was due to higher precipitation received in latter year (218 mm) than former (176 mm). Irrigation water used under CT practice (2358 m3 ha−1) was the highest followed by RT practice (2130 m3 ha−1) and the lowest under NT practice (1731 m3 ha−1). Water used under NT practice was 36% and 23% lower than CT and RT practices, respectively. It was also observed that RT practice had 11% lower irrigation water application than CT practice (Table 3). Similar trend was also noticed in total water used as rainfall amount was the same in all tillage practices. As irrigation water was applied on the basis of 4-cm water standing height in each plot. The higher water application under CT and RT practices could be attributed to higher initial water percolation, which could be due to deep tillage and slow forward water movement by more soil porosities during the irrigation. In the other hand, NT practice used lower irrigation water and it could be associated to surface compactness which facilitated rapid water movement and lower percolation during the irrigation. These results are in general agreement with other studies in this field [12,68,81,83].
Water productivity is the ratio of economic (grain) yield per unit of irrigation and/or precipitation. Therefore, irrigation water saving alone will not result in improved water productivity, if yield is compromised [84]. Wheat genotypes were not different in case of irrigation and input water productivity (Table 3), and the slight differences between genotypes might be due to the variations in grain yield (Table 2). Irrigation water productivity was affected by tillage practices (p = 0.0287). It was higher (1.63 kg m−3) under RT practice and lower (1.38 kg m−3) under CT practice with having intermediate values under NT (1.50 kg m−3) practice (Table 3). Input water productivity was significantly different between years and tillage practices. Input water productivity was higher in 2014–2015 (0.78 kg m−3) than 2015–2016 (0.73 kg m−3). Our finding showed that input water productivity was 7% higher in 2014–2015 compared to 2015–2016 (Table 3) and it was the resultant of both increase in grain yield (Table 2) and less precipitation (Table 3). Greater input water productivity was obtained under RT (0.84 kg m−3) practice. The RT input water productivity was 24% and 12% higher than NT and CT practices, respectively (Table 3). Higher (irrigation and input) water productivity under RT practice (Table 3) was mainly as a result of the higher grain yield (Table 2). These researchers [33,68,85] conversely found significantly higher irrigation and input water productivity under NT than CT practices.

3.4. Forage Maize

Tillage practices had significant effect on plant height and biomass (Table 4).
No- and reduced-tillage practices produced the shortest (174.5-cm) and tallest (187.2-cm) maize plant, respectively, with no significant difference between later and CT (185.8 cm) practice. Under NT, plant height was about 7% lower than other tillage practices (Table 4). Forage maize biomass response to RT practice was significantly higher than CT and NT practices. The average biomass of forage maize under RT practice was 8 and 20% greater than CT and NT practices, respectively (Table 4). Biomass variation between tillage practices was associated with lower plant height, lesser number of leaves per plant and lower ear weight under NT practice than those of under RT and CT practices. The biomass increases under RT and CT practices was presumably related to better crop establishment and higher irrigation water applied (data not shown). Lower biomass production under NT practice might be also attributed to higher soil bulk density and lower water infiltration (Figure 2) and [86,87]. No tillage practice decreased biomass by 20 and 11% compared to RT and CT practices, respectively. These findings are similar to these researchers [10,14,88] but different from this [68], who showed maize yield under NT practice increased by 30% compared to CT practice, while [22,89,90] observed no consistent differences in maize yield between conventional and conservation tillage practices.

4. Conclusions

The data presented in this study demonstrated significant effects of tillage on soil properties, crop yield, and water productivity. Conventional tillage practice had lower soil bulk density and higher cumulative water infiltration. Conservation tillage (RT and NT) practices showed higher SOC and TN and lower C:N ratio. Wheat grain yield and forage maize biomass were in order of RT > CT > NT. The irrigation water used under NT practice was found to be minimum. It needs further researches on irrigation scheduling and may help to improve the yield of both wheat and maize under no-till practice. Tillage × genotype interaction was non-significant for most parameters, it suggested to researchers, all selected four wheat genotypes/varieties are equally suitable for both conventional and no-till condition. Further research is strongly recommended to evaluate more diversified wheat genotypes to select those adapted to conservation tillage practices under different environment and management. Therefore, there is an urgent need to conduct more research on irrigation water scheduling and further improvement on machinery and their long-term effects on soil health and crop productivity.

Author Contributions

S.S.K. conducted the field experiments, collected and analyzed the crops data, and wrote the manuscript. S.A.K designed the research and financially supported the experiment. S.A. collected the soil data and analyzed them. M.K.G. helped to frame the manuscript, analyzed results, and wrote and edited the manuscript.

Funding

This research received no external funding.

Acknowledgments

The authors would like to express their deep gratitude to Agricultural Research, Education and Extension Organization (AREEO) for providing the facilities for this research work. The authors would also thanks to Department of Crop Production and Plant Breeding, School of Agriculture, Shiraz University for all support including finance, academics.

Conflicts of Interest

The authors declare no conflicts of interest.

References

  1. Dehghanian, S.E.; Afzalinia, S. Effect of conservation tillage and irrigation methods on the crop yield and water use efficiency in wheat-corn rotation. In Proceedings of the International Conference of Agricultural Engineering, Valencia, Spain, 8–12 July 2012; pp. 153–156. [Google Scholar]
  2. Sayre, K.; Govaerts, B. Use of conservation agriculture to improve farming systems in developing countries. In Rainfed Farming Systems; Tow, P., Cooper, I., Partridge, I., Birch, C., Eds.; Springer Netherlands: New York, NY, USA, 2011; pp. 861–873. ISBN 978-1-4020-9132-2. [Google Scholar]
  3. Erenstein, O.; Sayre, K.; Wall, P.; Dixon, J.; Hellin, J. Adapting no-tillage agriculture to the conditions of smallholder maize and wheat farmers in the tropics and sub tropics. In No-Till Farming Systems; Goddard, T., Zoebisch, M., Gan, Y., Ellis, W., Watson, A., Sombatpanit, S., Eds.; World Association of Soil and Water Conservation: Bangkok, Thailand, 2008; Volume 3, pp. 253–278. ISBN 978-974-8391-60-1. [Google Scholar]
  4. Kassam, A.; Friedrich, T.; Derpsch, R. Global spread of Conservation Agriculture. Int. J. Environ. Stud. 2018. [Google Scholar] [CrossRef]
  5. Asadi, M.E. Conservation agriculture practices in Golestan province, Iran 2017: Turning research into impact. Agric. Mech. 2017, 3, 28–32. [Google Scholar]
  6. Hatfield, J.L.; Sauer, T.J.; Prueger, J.H. Managing soils to achieve greater water use efficiency. A review. Agron. J. 2001, 93, 271–280. [Google Scholar] [CrossRef]
  7. D’Haene, K.; Vermang, J.; Cornelis, W.M.; Leroy, B.L.M.; Schiettecatte, W.; De Neve, S.; Gabriels, D.; Hofman, G. Reduced tillage effects on physical properties of silt loam soils growing root crops. Soil Tillage Res. 2008, 99, 279–290. [Google Scholar] [CrossRef]
  8. Gal, A.; Vyn, T.J.; Micheli, E.; Kladivko, E.J.; McFee, W.W. Soil carbon and nitrogen accumulation with long-term no-till versus moldboard plowing overestimated with tilled-zone sampling depths. Soil Tillage Res. 2007, 96, 42–51. [Google Scholar] [CrossRef]
  9. Thomas, G.A.; Dalal, R.C.; Standley, J. No-till effects on organic matter, pH, cation exchange capacity and nutrient distribution in a Luvisol in the semi-arid subtropics. Soil Tillage Res. 2007, 94, 295–304. [Google Scholar] [CrossRef]
  10. Afzalinia, S.; Zabihi, J. Soil compaction variation during corn growing season under conservation tillage. Soil Tillage Res. 2014, 137, 1–6. [Google Scholar] [CrossRef]
  11. Fabrizzi, K.P.; Garcia, F.O.; Costa, J.L.; Picone, L.I. Soil water dynamics, physical properties and corn and wheat responses to minimum and no-tillage systems in the southern Pampas of Argentina. Soil Tillage Res. 2005, 81, 57–69. [Google Scholar] [CrossRef]
  12. Gathala, M.K.; Ladha, J.K.; Saharawat, Y.S.; Kumar, V.; Kumar, V.; Sharma, P.K. Effect of tillage and crop establishment methods on physical properties of a medium-textured soil under a seven-year rice–wheat rotation. Soil Sci. Soc. Am. J. 2011, 75, 1851–1862. [Google Scholar] [CrossRef]
  13. Jat, H.S.; Datta, A.; Sharma, P.C.; Kumar, V.; Yadav, A.K.; Choudhary, M.; Choudhary, V.; Gathala, M.K.; Sharma, D.K.; Jat, M.L.; et al. Assessing soil properties and nutrient availability under conservation agriculture practices in a reclaimed sodic soil in cereal-based systems of North-West India. Arch. Agron. Soil Sci. 2017, 64, 531–545. [Google Scholar] [CrossRef]
  14. Salem, H.M.; Valero, C.; Munoz, M.A.; Rodriguez, M.G.; Silva, L.L. Short-term effects of four tillage practices on soil physical properties, soil water potential, and maize yield. Geoderma 2015, 237–238, 60–70. [Google Scholar] [CrossRef]
  15. Taser, O.; Metinoglu, F. Physical and mechanical properties of a clay soil as affected by tillage systems for wheat growth. Acta Agric. Scand. Sect. B Soil Plant Sci. 2005, 55, 186–191. [Google Scholar] [CrossRef]
  16. Li, H.W.; Gao, H.W.; Wu, H.D.; Li, W.Y.; Wang, X.Y.; Jin, H. Effects of 15 years of conservation tillage on soil structure and productivity of wheat cultivation in northern China. Aust. Soil Tillage Res. 2007, 45, 344–350. [Google Scholar] [CrossRef]
  17. Dolan, M.S.; Clapp, C.E.; Allmaras, R.R.; Baker, J.M.; Molina, J.A.E. Soil organic carbon and nitrogen in a Minnesota soil as related to tillage, residue and nitrogen management. Soil Tillage Res. 2006, 89, 221–231. [Google Scholar] [CrossRef]
  18. Jantalia, C.P.; Resck, D.V.S.; Alves, B.J.R.; Zotarelli, L.; Urquiaga, S.; Boddey, R.M. Tillage effect on C stocks of a clayey Oxisol under a soybean-based crop rotation in the Brazilian Cerrado region. Soil Tillage Res. 2007, 95, 97–109. [Google Scholar] [CrossRef]
  19. Alijani, K.; Bahrani, M.J.; Kazemeini, S.A. Short-term responses of soil and wheat yield to tillage, corn residue management, and nitrogen fertilization. Soil Tillage Res. 2012, 124, 78–82. [Google Scholar] [CrossRef]
  20. Spargo, J.T.; Alley, M.M.; Follett, R.F.; Wallace, J.V. Soil carbon sequestration with continuous no-till management of grain cropping systems in the Virginia coastal plain. Soil Tillage Res. 2008, 100, 133–140. [Google Scholar] [CrossRef]
  21. Obour, A.K.; Mikha, M.M.; Holman, J.D.; Stahlman, P.W. Changes in soil surface chemistry after fifty years of tillage and nitrogen Fertilization. Geoderma 2017, 308, 46–53. [Google Scholar] [CrossRef]
  22. Wang, Q.; Lu, C.; Li, H.; He, J.; Sarker, K.K.; Rasaily, R.G.; Liang, Z.; Qiao, X.; Li, H.; Mchugh, A.D. The effects of no-tillage with subsoiling on soil properties and maize yield: 12-Year experiment on alkaline soils of Northeast China. Soil Tillage Res. 2014, 137, 43–49. [Google Scholar] [CrossRef]
  23. Govaerts, B.; Verhulst, N.; Sayre, K.D.; Dixon, J.; Dendooven, L. Conservation agriculture and soil carbon sequestration; Between myth and farmer reality. Crit. Rev. Plant Sci. 2009, 28, 97–122. [Google Scholar] [CrossRef]
  24. Sainju, U.M.; Senwo, Z.N.; Nyakatawa, E.Z.; Tazisong, I.A.; Reddy, K.C. Soil carbon and nitrogen sequestration as affected by long-term tillage, cropping systems, and nitrogen fertilizer sources. Agric. Ecosyst. Environ. 2008, 127, 234–240. [Google Scholar] [CrossRef]
  25. Wang, Q.; Bai, Y.; Gao, H.; He, J.; Chen, H.; Chesney, R.C.; Kuhn, N.J.; Li, H. Soil chemical properties and microbial biomass after 16 years of no-tillage farming on the Loess Plateau, China. Geoderma 2008, 144, 502–508. [Google Scholar] [CrossRef]
  26. Astier, M.; Maass, J.M.; Etchevers-Barra, J.D.; Pena, J.J.; Gonzalez, F.D. Short term green manure and tillage management effects on maize yield and soil quality in an Andisol. Soil Tillage Res. 2006, 88, 153–159. [Google Scholar] [CrossRef]
  27. Govaerts, B.; Sayre, K.D.; Lichter, K.; Dendooven, L.; Deckers, J. Influence of permanent raised bed planting and residue management on physical and chemical soil quality in rain fed maize/wheat systems. Plant Soil 2007, 291, 39–54. [Google Scholar] [CrossRef]
  28. Lichter, K.; Govaerts, B.; Six, J.; Sayre, K.D.; Deckers, J.; Dendooven, L. Aggregation and C and N contents of soil organic matter fractions in a permanent raised bed planting system in the Highlands of Central Mexico. Plant Soil 2008, 305, 237–252. [Google Scholar] [CrossRef]
  29. Gathala, M.K.; Jat, M.L.; Saharawat, Y.S.; Sharma, S.K.; Yadvinder, S.; Ladha, J.K. Physical and Chemical Properties of a Sandy Loam Soil Under Irrigated Rice-Wheat Sequence in the Indo-Gangetic Plains of South Asia. J. Ecosyst. Ecogr. 2017, S7, 1–12. [Google Scholar] [CrossRef]
  30. Greb, B.W. Effect of surface applied wheat straw on soil water losses by solar distillation. Soil Sci. Soc. Am. J. 1966, 30, 786–788. [Google Scholar] [CrossRef]
  31. Unger, P. Tillage effects on dryland wheat and sorghum production in the southern Great Plains. Agron. J. 1994, 86, 310–314. [Google Scholar] [CrossRef]
  32. Alvarez, R.; Steinbach, H.S. A review of the effects of tillage systems on some soil physical properties, water content, nitrate availability and crops yield in the Argentine Pampas. Soil Tillage Res. 2009, 104, 1–15. [Google Scholar] [CrossRef]
  33. He, J.; Li, H.; Wang, X.; McHugh, A.D.; Li, W.; Gao, H.; Kuhn, N.J. The adoption of annual subsoiling as conservation tillage in dryland maize and wheat cultivation in northern China. Soil Tillage Res. 2007, 94, 493–502. [Google Scholar] [CrossRef]
  34. Zhang, S.L.; Simelton, E.; Lovdahl, L.; Grip, H.; Chen, D.L. Simulated long-term effects of different soil management regimes on the water balance in the Loess Plateau, China. Field Crop Res. 2007, 100, 311–319. [Google Scholar] [CrossRef]
  35. Allan, R. Impact of wheat breeding and genetics on the Pacific Northwest STEEP program. In Proceedings of the National Conference on Wheat Utilization Research, Beltsville, MD, USA, 26–28 October 1982. [Google Scholar]
  36. Hall, E.F.; Cholick, F.A. Cultivar × tillage interaction of hard red spring wheat cultivars. Agron. J. 1989, 81, 789–792. [Google Scholar] [CrossRef]
  37. Honsdorf, N.; Mulvaney, M.J.; Singh, R.P.; Ammar, K.; Burgueno, J.; Govaerts, B.; Verhulst, N. Genotype by tillage interaction and performance progress for bread and durum wheat genotypes on irrigated raised beds. Field Crops Res. 2018, 216, 42–52. [Google Scholar] [CrossRef]
  38. Carr, P.M.; Horsley, R.D.; Poland, W.W. Tillage and seeding rate effects on wheat cultivars: I. Grain production. Crop Sci. 2003, 43, 202–209. [Google Scholar] [CrossRef]
  39. Carr, P.M.; Horsley, R.D.; Poland, W.W. Tillage and seeding rate effects on wheat cultivars: II. Yield components. Crop Sci. 2003, 43, 210–218. [Google Scholar] [CrossRef]
  40. Herbek, J.; Murdock, L.; Grove, J.; Grabau, L.; Van Sanford, D.; Martin, J.; James, J.; Call, D. Comparing No-Till and Tilled Wheat in Kentucky; ID-177; University of Kentucky Collage of Agriculture: Lexington, KY, USA, 2009; pp. 1–10. [Google Scholar]
  41. Kumudini, S.; Grabau, S.L.; Van Sanford, D.; Omielan, J. Analysis of yield formation processes under no-till and conventional tillage for soft red winter wheat in the south-central region. Agron. J. 2008, 100, 1026–1032. [Google Scholar] [CrossRef]
  42. Weisz, R.; Bowman, D.T. Influence of tillage system on soft red winter wheat cultivar selection. J. Prod. Agric. 1999, 12, 415–418. [Google Scholar] [CrossRef]
  43. Zamir, M.S.I.; Ahmad, A.U.H.; Javeed, H.M.R. Comparative performance of various wheat (Triticum aestivum L.) cultivars to different tillage practices under tropical conditions. Afr. J. Agric. Res. 2010, 5, 1799–1803. [Google Scholar] [CrossRef]
  44. Shoran, J.; Chatrath, R.; Kharub, A.S. Wheat cultivars in relation to resource conservation technologies. In Conservation Agriculture, Status and Prospects; Abrol, I.P., Gupta, R.K., Malik, R.K., Eds.; Centre for Advancement of Sustainable Agriculture: New Delhi, India, 2005; pp. 125–128. [Google Scholar]
  45. Chevalier, P.M.; Ciha, A.J. Influence of tillage on phenology and carbohydrate metabolism of spring wheat. Agron. J. 1986, 78, 296–300. [Google Scholar] [CrossRef]
  46. Cox, D.J. Breeding for hard red winter wheat cultivars adapted to conventional-till and no-till systems in northern latitudes. Euphytica 1991, 58, 57–63. [Google Scholar] [CrossRef]
  47. Nelson, D.W.; Sommers, L.E. Total Carbon, Organic Carbon, and Organic Matter. In Methods of Soil Analysis. Part 3. Chemical Methods; Sparks, D.L., Page, A.L., Helmke, P.A., Leoppert, R.H., Soltanpour, P.N., Tabatabai, M.A., Eds.; SSSA Book Series No. 5; SSSA and ASA: Madison, WI, USA, 1996; pp. 961–1010. [Google Scholar]
  48. Bremner, J.M.; Mulvaney, C.S. Nitrogen-total. In Methods of Soil Analysis, Part 2, 2nd ed.; Page, A.L., Miller, R.H., Keeney, D.R., Eds.; American Society of Agronomy—Soil Science Society of America: Madison, WI, USA, 1982; Volume 9, pp. 539–579. ISBN 0-89118-072-9. [Google Scholar]
  49. Blanco-Canqui, H.; Lal, R. No-tillage and soil-profile carbon sequestration: An on-farm assessment. Soil Sci. Soc. Am. J. 2008, 72, 693–701. [Google Scholar] [CrossRef]
  50. Blake, G.R.; Hartge, K.H. Bulk density. In Methods of Soil Analysis, Part 1 Physical and Mineralogical Methods, 2nd ed.; Klute, A., Ed.; American Society of Agronomy—Soil Science Society of America: Madison, WI, USA, 1986; Volume 9, pp. 363–382. [Google Scholar]
  51. American Society for Testing and Materials (ASTM). D3385–09. Standard Test Method for Infiltration Rate of Soils in Field Using Double Ring Infiltrometer; ASTM: West Conshohocken, PA, USA, 2009. [Google Scholar]
  52. Pask, A. Determining key developmental stages. In Physiological Breeding II: A Field Guide to Wheat Phenotyping; Pask, A., Petragella, J., Mullan, D., Reynolds, M., Eds.; International Maize and Wheat Improvement Center (CIMMYT): Texcoco, Mexico, 2012; pp. 72–79. ISBN 978-970-648-182-5. [Google Scholar]
  53. Estakhr, A.; Heidari, B.; Ahmadi, Z. Evaluation of kernel yield and agronomic traits of European maize hybrids in the temperate region of Iran. Arch. Agron. Soil Sci. 2015, 61, 475–490. [Google Scholar] [CrossRef]
  54. SAS Institute. SAS User’s Guide, Version 9.1; SAS Institute: Cary, NC, USA, 2003.
  55. Afzalinia, S.; Karami, A.; Alavimanesh, S.M. Comparing conservation and conventional tillage methods in corn–wheat rotation. In Proceedings of the International Conference of Agricultural Engineering, Valencia, Spain, 8–12 July 2012; p. 1257. [Google Scholar]
  56. Kumar, S.; Kadono, A.; Lal, R.; Dick, W. Long-term no-till impacts on organic carbon and properties of two contrasting soils and corn yields in Ohio. Soil Sci. Soc. Am. J. 2012, 76, 1798–1809. [Google Scholar] [CrossRef]
  57. Yang, X.M.; Wander, M.M. Tillage effects on soil organic carbon distribution and storage in a silt loam soil in Illinois. Soil Tillage Res. 1999, 52, 1–9. [Google Scholar] [CrossRef]
  58. Ussiri, D.A.N.; Lal, R. Long term tillage effects on soil carbon storage and carbon dioxide emissions in continuous corn cropping systems from an Alfisol in Ohio. Soil Tillage Res. 2009, 104, 39–47. [Google Scholar] [CrossRef]
  59. Blanco-Canqui, H.; Wienhold, B.J.; Jin, V.L.; Schmer, M.R. Long-term tillage impact on soil hydraulic properties. Soil Tillage Res. 2017, 170, 38–42. [Google Scholar] [CrossRef]
  60. Lipiec, J.; Kus, J.; Slowinska-Jurkiewicz, A.; Nosalewicz, A. Soil porosity and water infiltration as influenced by tillage methods. Soil Tillage Res. 2006, 89, 210–220. [Google Scholar] [CrossRef]
  61. Wienhold, B.J.; Tanaka, D.L. Haying, tillage, and nitrogen fertilization influences on infiltration rate at a conservation reserve program site. Soil Sci. Soc. Am. J. 2000, 64, 379–381. [Google Scholar] [CrossRef]
  62. Kumar, V.; Jat, H.S.; Sharma, P.C.; Singh, B.; Gathala, M.K.; Malik, R.K.; Kamboj, B.R.; Yadav, A.K.; Ladha, J.K.; Raman, A.; et al. Can productivity and profitability be enhanced in intensively managed cereal systems while reducing the environmental footprint of production? Assessing sustainable intensification options in the breadbasket of India. Agric. Ecosyst. Environ. 2018, 252, 132–147. [Google Scholar] [CrossRef] [PubMed]
  63. Verhulst, N.; Govaerts, B.; Verachtert, E.; Castellanos-Navarrete, A.; Mezzalama, M.; Wall, P.; Deckers, J.; Sayre, K.D. Conservation agriculture, improving soil quality for sustainable production systems. In Advances in Soil Science: Food Security and Soil Quality; Lal, R., Stewart, B.A., Eds.; CRC Press: Boca Raton, FL, USA, 2010; pp. 137–208. ISBN 9781439800577. [Google Scholar]
  64. Franzluebbers, A.J. Water infiltration and soil structure related to organic matter and its stratification with depth. Soil Tillage Res. 2002, 66, 197–205. [Google Scholar] [CrossRef]
  65. Lopez-Fando, C.; Pardo, M.T. Changes in soil chemical characteristics with different tillage practices in a semi-arid environment. Soil Tillage Res. 2009, 104, 278–284. [Google Scholar] [CrossRef]
  66. Malecka, I.; Blecharczyk, A.; Sawinska, Z.; Dobrzeniecki, T. The effect of various long-term tillage systems on soil properties and spring barley yield. Turk. J. Agric. For. 2012, 36, 217–226. [Google Scholar] [CrossRef]
  67. Kumari, M.; Chakraborty, D.; Gathala, M.K.; Pathak, H.; Dwivedi, B.S. Soil aggregation and associated organic carbon fractions as affected by tillage in a rice-wheat rotation in North India. Soil Sci. Soc. Am. J. 2011, 75, 562–567. [Google Scholar] [CrossRef]
  68. Jat, M.L.; Gathala, M.K.; Saharawat, Y.S.; Tetarwale, J.P.; Gupta, R.; Singh, Y. Double no-till and permanent raised beds in maize–wheat rotation ofnorth-western Indo-Gangetic plains of India: Effects on crop yields, water productivity, profitability and soil physical properties. Field Crops Res. 2013, 149, 291–299. [Google Scholar] [CrossRef]
  69. Du, Z.; Ren, T.; Hu, C. Tillage and residue removal effects on soil carbon and nitrogen storage in the north China plain. Soil Water Manag. Conserv. 2010, 74, 196–202. [Google Scholar] [CrossRef]
  70. Dikgwatlhe, S.B.; Chen, Z.D.; Lal, R.; Zhang, H.L.; Chen, F. Changes in soil organic carbon and nitrogen as affected by tillage and residue management under wheat maize cropping system in the North China Plain. Soil Tillage Res. 2014, 144, 110–118. [Google Scholar] [CrossRef]
  71. Zuber, S.M.; Behnke, G.; Nafziger, E.D.; Villamil, M.B. Crop rotation and tillage effects on soil physical and chemical properties in Illinois. Agron. J. 2015, 107, 1–8. [Google Scholar] [CrossRef]
  72. Van Den Bossche, A.; De Bolle, S.; De Neve, S.; Hofman, G. Effect of tillage intensity on N mineralization of different crop residues in a temperate climate. Soil Tillage Res. 2009, 103, 316–324. [Google Scholar] [CrossRef]
  73. Balesdent, J.; Chenu, C.; Balabane, M. Relationship of soil organic matter dynamics to physical protection and tillage. Soil Tillage Res. 2000, 53, 215–230. [Google Scholar] [CrossRef] [Green Version]
  74. Grandy, A.S.; Robertson, G.P. Aggregation and organic matter protection following cultivation of an undisturbed soil profile. Soil Sci. Soc. Am. J. 2006, 70, 1398–1406. [Google Scholar] [CrossRef]
  75. John, B.; Yamashita, T.; Ludwig, B.; Flessa, H. Storage of organic carbon in aggregate and density fractions of silty soils under diff erent types of land use. Geoderma 2005, 128, 63–79. [Google Scholar] [CrossRef]
  76. Choudhary, M.; Datta, A.; Jat, H.S.; Yadav, A.K.; Gathala, M.K.; Sapkota, T.B.; Das, A.K.; Sharma, P.C.; Jat, M.L.; Singh, R.; et al. Changes in soil biology under conservation agriculture based sustainable intensification of cereal systems in Indo-Gangetic Plains. Geoderma 2018, 313, 193–204. [Google Scholar] [CrossRef]
  77. Ghaghazardi, H.R.; Jahansouz, M.R.; Ahmadi, A.; Gorji, M. Effects of tillage management on productivity of wheat and chickpea under cold, rainfed conditions in western Iran. Soil Tillage Res. 2016, 162, 26–33. [Google Scholar] [CrossRef]
  78. Hemmat, A.; Eskandari, I. Tillage system effects upon productivity of a dryland winter wheat–chickpea rotation in the northwest region of Iran. Soil Tillage Res. 2004, 78, 69–81. [Google Scholar] [CrossRef]
  79. Saharawat, Y.S.; Singh, B.; Malik, R.K.; Ladha, J.K.; Gathala, M.; Jat, M.L.; Kumar, V. Evaluation of alternative tillage and crop establishment methods in a rice–wheat rotation in North Western IGP. Field Crops Res. 2010, 116, 260–267. [Google Scholar] [CrossRef]
  80. Hassan, F.U.; Ahmad, M.; Ahmad, N.; Abbasi, K.M. Effects of subsoil compaction on yield and yield attributes of wheat in the sub-humid region of Pakistan. Soil Tillage Res. 2007, 96, 361–366. [Google Scholar] [CrossRef]
  81. Jat, M.L.; Gathala, M.K.; Ladha, J.K.; Saharawat, Y.S.; Jat, A.S.; Kumar, V.; Sharma, S.K.; Kumar, V.; Gupta, R. Evaluation of precision land leveling and double zero-till systems in the rice–wheat rotation: Water use, productivity, profitability and soil physical properties. Soil Tillage Res. 2009, 105, 112–121. [Google Scholar] [CrossRef]
  82. Obour, A.K.; Stahlman, P.W.; Thompson, C.A. Wheat and grain sorghum yields as influenced by long-term tillage and nitrogen fertilizer application. Int. J. Soil Plant Sci. 2015, 7, 19–28. [Google Scholar] [CrossRef]
  83. Bhushan, L.; Ladha, J.K.; Gupta, R.K.; Singh, S.; Tirol-Padre, A.; Saharawat, Y.S.; Gathala, M.; Pathak, H. Saving of water and labor in a rice–wheat system with no-tillage and direct seeding technologies. Agron. J. 2007, 99, 1288–1296. [Google Scholar] [CrossRef]
  84. Barker, R.; Dawe, D.; Tuong, T.P.; Bhuiyan, S.I.; Guerra, L.C. The outlook for water resources in the year 2020: challenges for research on water management in rice production. Int. Rice Comm. Newsl. 2000, 49, 7–21. [Google Scholar]
  85. Noellemeyer, E.; Fernandez, R.; Quiroga, A. Crop and tillage effects on water productivity of dryland agriculture in Argentina. Agriculture 2013, 3, 1–11. [Google Scholar] [CrossRef]
  86. Mu, X.; Zhao, Y.; Liu, K.; Ji, B.; Guo, H.; Xue, Z.; Li, C. Responses of soil properties, root growth and crop yield to tillage and crop residue management in a wheat–maize cropping system on the North China Plain. Eur. J. Agron. 2016, 78, 32–43. [Google Scholar] [CrossRef]
  87. Nidal, H.; Abu, H. Compaction and subsoiling effects on corn growth and soil bulk density. Soil Sci. Soc. Am. J. 2003, 4, 1213–1219. [Google Scholar] [CrossRef]
  88. Carter, M.R.; Sanderson, J.B.; Ivany, J.A.; White, R.P. Influence of rotation and tillage on forage maize productivity, weed species, and soil quality of a fine sandy loam in the cool–humid climate of Atlantic Canada. Soil Tillage Res. 2002, 67, 85–98. [Google Scholar] [CrossRef]
  89. Gathala, M.K.; Timsina, J.; Islam, M.S.; Rahman, M.M.; Hossain, M.I.; Harun-Ar-Rashid, M.; Ghosh, A.K.; Krupnik, T.J.; Tiwari, T.P.; McDonald, A. Conservation agriculture based tillage and crop establishment optionscan maintain farmers’ yields and increase profits in South Asia’srice–maize systems: Evidence from Bangladesh. Field Crops Res. 2015, 172, 85–98. [Google Scholar] [CrossRef]
  90. Krupnik, T.J.; Yasmin, S.; Pandit, D.; Asaduzzaman, M.; Khan, S.I.; Majumdar, K.; McDonald, A.; Buresh, R.; Gathala, M.K. Yield performance and agronomic N efficiency of a maize-rice rotation under strip and conventional tillage in contrasting environments in Bangladesh. In Proceedings of the World Congress on Conservation Agriculture, Winnipeg, MB, Canada, 22–25 June 2014; pp. 12–14. [Google Scholar]
Figure 1. Daily mean air temperature during the 2014–2016 growing seasons. (DOY = day of year).
Sustainability 10 03273 g001
Figure 2. The soil bulk density and cumulative water infiltration influenced by different tillage practices in semiarid ecologies of Iran. (NT = no tillage, RT = reduced tillage, CT = conventional tillage, BD = bulk density, CWI = cumulative water infiltration).
Sustainability 10 03273 g002
Figure 3. The soil organic carbon, total soil nitrogen and C:N ratio influenced by different tillage practices in semiarid ecologies of Iran. (NT = no tillage, RT = reduced tillage, CT = conventional tillage, SOC = soil organic carbon, TN = total soil nitrogen).
Sustainability 10 03273 g003
Table 1. The description of different tillage practices in the experiment.
TillageDescription
Conventional practice (CT)Land cultivation was performed using mouldboard plough at 20–25 cm deep ploughing and simultaneously 5–10-cm maize stocks residues (1.0 ± 0.2 t ha−1) were incorporated followed by two perpendicular harrow disking and land leveller to make seed bed uniform before planting. Wheat was sown by using the seed drill having press wheel attachment (Bazegar Hamedan seed drill).
The land was prepared as above for maize in absence of wheat residue followed the forage maize was sown using row crop planter.
Reduced practice (RT)Land was cultivated with a composite tiller (a tiller having chiselling furrow opener followed disking and leveller cum compressor), composite tillage which functions for three operations simultaneously. The crop residues were incorporated partially (3.0 ± 0.2 t ha−1) into a soil depth of 10–15 cm during land cultivation.
The forage maize and wheat seeds were sown as conventional tillage practice.
No-tillage practice (NT)After harvest of maize, wheat was sown in 20-cm standing maize stocks (3.0 ± 0.2 t ha−1) by using no-till crop planter (Sazeh Kesht) without any prior tillage having maize stock retention on the soil surface either anchored or mulch.
Similarly, maize was planted under into wheat crop residue approximate 1.5 ± 0.1 t ha−1 using the maize pneumatic double disc-planter (Bertini) under no-till plots after harvest of wheat.
Table 2. Effects of tillage practices and wheat genotypes on effective tillers and grain yield during two years study 2014–2015 and 2015–2016 in the semiarid region of Iran.
TreatmentEffective Tillers (number m−2)Grain Yield (t ha−1)
2014–20152015–20162014–20152015–2016
Tillage (T)
Conventional389.17a 293.17b3.48a2.97ab
Reduced375.42ab315.58b3.60a3.26a
No tillage352.83b351.17a2.40b2.64b
Genotypes (G)
Chamran406.56a382.33a2.923.05
Sirvan369.22a295.44b3.072.90
M-89-10324.89b297.55b3.182.73
Picaflor#1389.22a304.55b3.483.13
ANOVA
Replication (R)0.0298NS *NS0.0140
T0.0416<0.00010.00020.0061
G0.0002<0.0001NSNS
T × GNSNSNSNS
Values within columns followed by the same letters are not significantly different according to Tukey test (0.05) level. * NS = Not significant.
Table 3. Pooled (2-yrs) effect of tillage practices and wheat genotypes on agronomic trait, water use and water productivity in semiarid region of Iran.
Treatments1000-g Weight (g)Grains Per SpikeHarvest IndexIrrigation Water (m3 ha−1)Total Water Used (m3 ha−1) §Irrigation Water Productivity (kg m−3)Input Water Productivity (kg m−3)
Year(Y)
2014–201535.7736.5532.222230.36a4013.961.43b0.78a
2015–201635.8237.1032.621916.06b4077.601.58a0.73b
Tillage (T)
Conventional37.33a 37.4333.442358.05a4330.67a1.38b0.75ab
Reduced35.15b36.3832.902130.32b4102.83b1.63a0.84a
No tillage34.92b36.7030.911731.25c3703.83c1.50ab0.68b
Genotypes (G)
Chamran31.58b39.11a32.252073.214045.781.480.74
Sirvan38.1a36.52ab32.782073.214045.781.470.74
M-89-1036.65a34.47b32.872073.214045.781.440.73
Picaflor#136.87a37.25a31.752073.214045.781.630.82
ANOVA
Replication (R)NS *NS0.04340.00050.00050.00400.0166
YNS NSNS<0.0001NS0.01360.0498
T0.0137NSNS<0.0001<0.00010.02870.0009
G<0.00010.0005NSNSNSNSNS
Y × TNSNSNSNSNSNSNS
Y × GNSNSNSNSNSNSNS
T × GNSNSNSNSNSNSNS
Values within columns followed by the same letters are not significantly different according to Tukey test (0.05) level. * NS = Not significant. § Total rainfall was 176.5 and 218 mm in 2014–2015 and 2015–2016, respectively.
Table 4. Effects of tillage practices on maize agronomic traits and biomass for 2015 growing season.
TreatmentLeaf Number Per PlantStem Diameter (mm)Plant Height (cm)Ear Weight (t ha−1)Biomass (t ha−1)
Tillage (T)
Conventional15.481.67185.8a †13.8642.3ab
Reduced15.771.73187.2a13.4945.67a
No tillage14.531.77174.5b12.1438.0b
ANOVA
TNS *NS0.0041NS0.0201
Values within columns followed by the same letters are not significantly different according to Tukey test (0.05) level. * NS = Not significant.

