Article

Relevance Analysis on the Variety Characteristics of PM2.5 Concentrations in Beijing, China

1
Department of Engineering Physics, Tsinghua University, Beijing 100084, China
2
Beijing Key Laboratory of City Integrated Emergency Response Science, Tsinghua University, Beijing 100084, China
*
Author to whom correspondence should be addressed.
Sustainability 2018, 10(9), 3228; https://doi.org/10.3390/su10093228
Submission received: 9 August 2018 / Revised: 7 September 2018 / Accepted: 7 September 2018 / Published: 10 September 2018

Abstract

:
Air pollution has become one of the most serious environmental problems in the world. Considering Beijing and six surrounding cities as main research areas, this study takes the daily average pollutant concentrations and meteorological factors from 2 December 2013 to 30 June 2017 into account and studies the spatial and temporal distribution characteristics and the relevant relationship of particulate matter smaller than 2.5 μm (PM2.5) concentrations in Beijing. Based on correlation analysis and geo-statistics techniques, the inter-annual, seasonal, and diurnal variation trends and temporal spatial distribution characteristics of PM2.5 concentration in Beijing are studied. The study results demonstrate that the pollutant concentrations in Beijing exhibit obvious seasonal and cyclical fluctuation patterns. Air pollution is more serious in winter and spring and slightly better in summer and autumn, with the spatial distribution of pollutants fluctuating dramatically in different seasons. The pollution in southern Beijing areas is more serious and the air quality in northern areas is better in general. The diurnal variation of air quality shows a typical seasonal difference and the daily variation of PM2.5 concentrations present a “W” type of mode with twin peaks. Besides emission and accumulation of local pollutants, air quality is easily affected by the transport effect from the southwest. The PM2.5 and PM10 concentrations measured from the city of Langfang are taken as the most important factors of surrounding pollution factors to PM2.5 in Beijing. The concentrations of PM10 and carbon monoxide (CO) concentrations in Beijing are the most significant local influencing factors to PM2.5 in Beijing. Extreme wind speeds and maximal wind speeds are considered to be the most significant meteorological factors affecting the transport of pollutants across the region. When the wind direction is weak southwest wind, the probability of air pollution is greater and when the wind direction is north, the air quality is generally better.

1. Introduction

Ambient fine particulate matter smaller than 2.5 μm (PM2.5) is a major environmental problem and is harmful to human health [1,2]. Numerous studies have documented that short-term and long-term exposure to PM2.5 can increase the risks of allergies, respiratory system diseases, and cardiovascular diseases [3,4,5,6]. Meanwhile, the haze caused by PM2.5 reduces visibility [7,8] and affects transportation, causing huge economic losses [9]. Chinese cities suffer heavily from ambient air pollution [10], particularly the capital Beijing [11]. A Global Burden of Disease (GBD) study ranks ambient particulate matter pollution (PM2.5) as the 5th leading risk factor for early death and disability in China [12]. Thus, it is necessary to carry out research on PM2.5 in China. Current research mainly focuses on the physical and chemical properties of pollutants [13,14,15], although some studies focus on social [16] and natural factors [17]. Previous studies have shown that meteorological factors, including those of wind speed, wind direction, precipitation, relative humidity, and atmospheric pressure, have a very significant impact on air quality. For example, Guo et al. found that adverse weather conditions, including those of low wind speed and high relative humidity would promote the concentration of pollutants in the study area and lead to the rapid deterioration of air quality in the short term [18]. Li et al. [19] identified ideal meteorological regions, according to the quantified spatial relationships between PM and meteorological elements. Lv et al. [20] found that wind speed and wind direction have more complex effects on air pollution. The prevailing wind direction or wind speed is beneficial to the dilution and diffusion of pollutants in the region and then reduce the concentrations of pollutants. The effect of non-prevailing wind (not long-lasting) or of low wind speed is just the opposite. The specific effect of wind direction is related to the distribution of surrounding pollution sources. In addition, it has also been found that the periodic changes in the haze weather in Beijing are closely related to the specific geographical location of Beijing and the growth of high pressure cyclones in the upper reaches of Siberia [21]. In addition, the impact of the cross-regional transportation of particulates on local air quality has been gradually emphasized in recent research [22,23,24,25,26]. Wang et al. [27] used an integrated Fifth-Generation NCAR/Penn State Mesoscale Model-Community Multiscale Air Quality (MM5-CMAQ) modeling system to analyze the backward trajectory of pollutants in Beijing and found that the southwest is the most influential transport channel. Ma et al. [28] demonstrated that regional transport from southern Beijing is a leading influencing factor that spurs initial PM2.5 increases.
PM2.5 concentration is affected by local pollutants, surrounding pollutants factors, and meteorological factors and it has temporal and spatial variability. However, in most studies on the temporal and spatial distribution characteristics and the relevant relationship of PM2.5 concentrations, only local pollutants and meteorological factors were considered [17,19]. Few studies have considered comprehensive factors. In this study, we consider Beijing and six surrounding cities as main research areas, taking the daily average pollutant concentrations and meteorological elements from 2 December 2013 to 13 October 2017 into account and study the spatial and temporal distribution characteristics and the relevant relationship of PM2.5 concentrations in Beijing. Investigating the temporal and spatial distribution characteristics and the relevant relationship of PM2.5 is important for understanding the mechanisms underlying PM2.5 pollution and for preventing haze. Therefore, this study has great practical value, it can elucidate the factors contributing to this air pollution and provide scientific reference for joint control measures in future.
Based on correlation analysis and geo-statistics techniques, this paper studies the inter-annual, seasonal, diurnal variation trends, and temporal spatial distribution characteristics of PM2.5 concentration in Beijing. The relevant relationships between PM2.5 and major local pollutants, surrounding pollutants, and meteorological factors are also analyzed.

2. Study Area and the Data
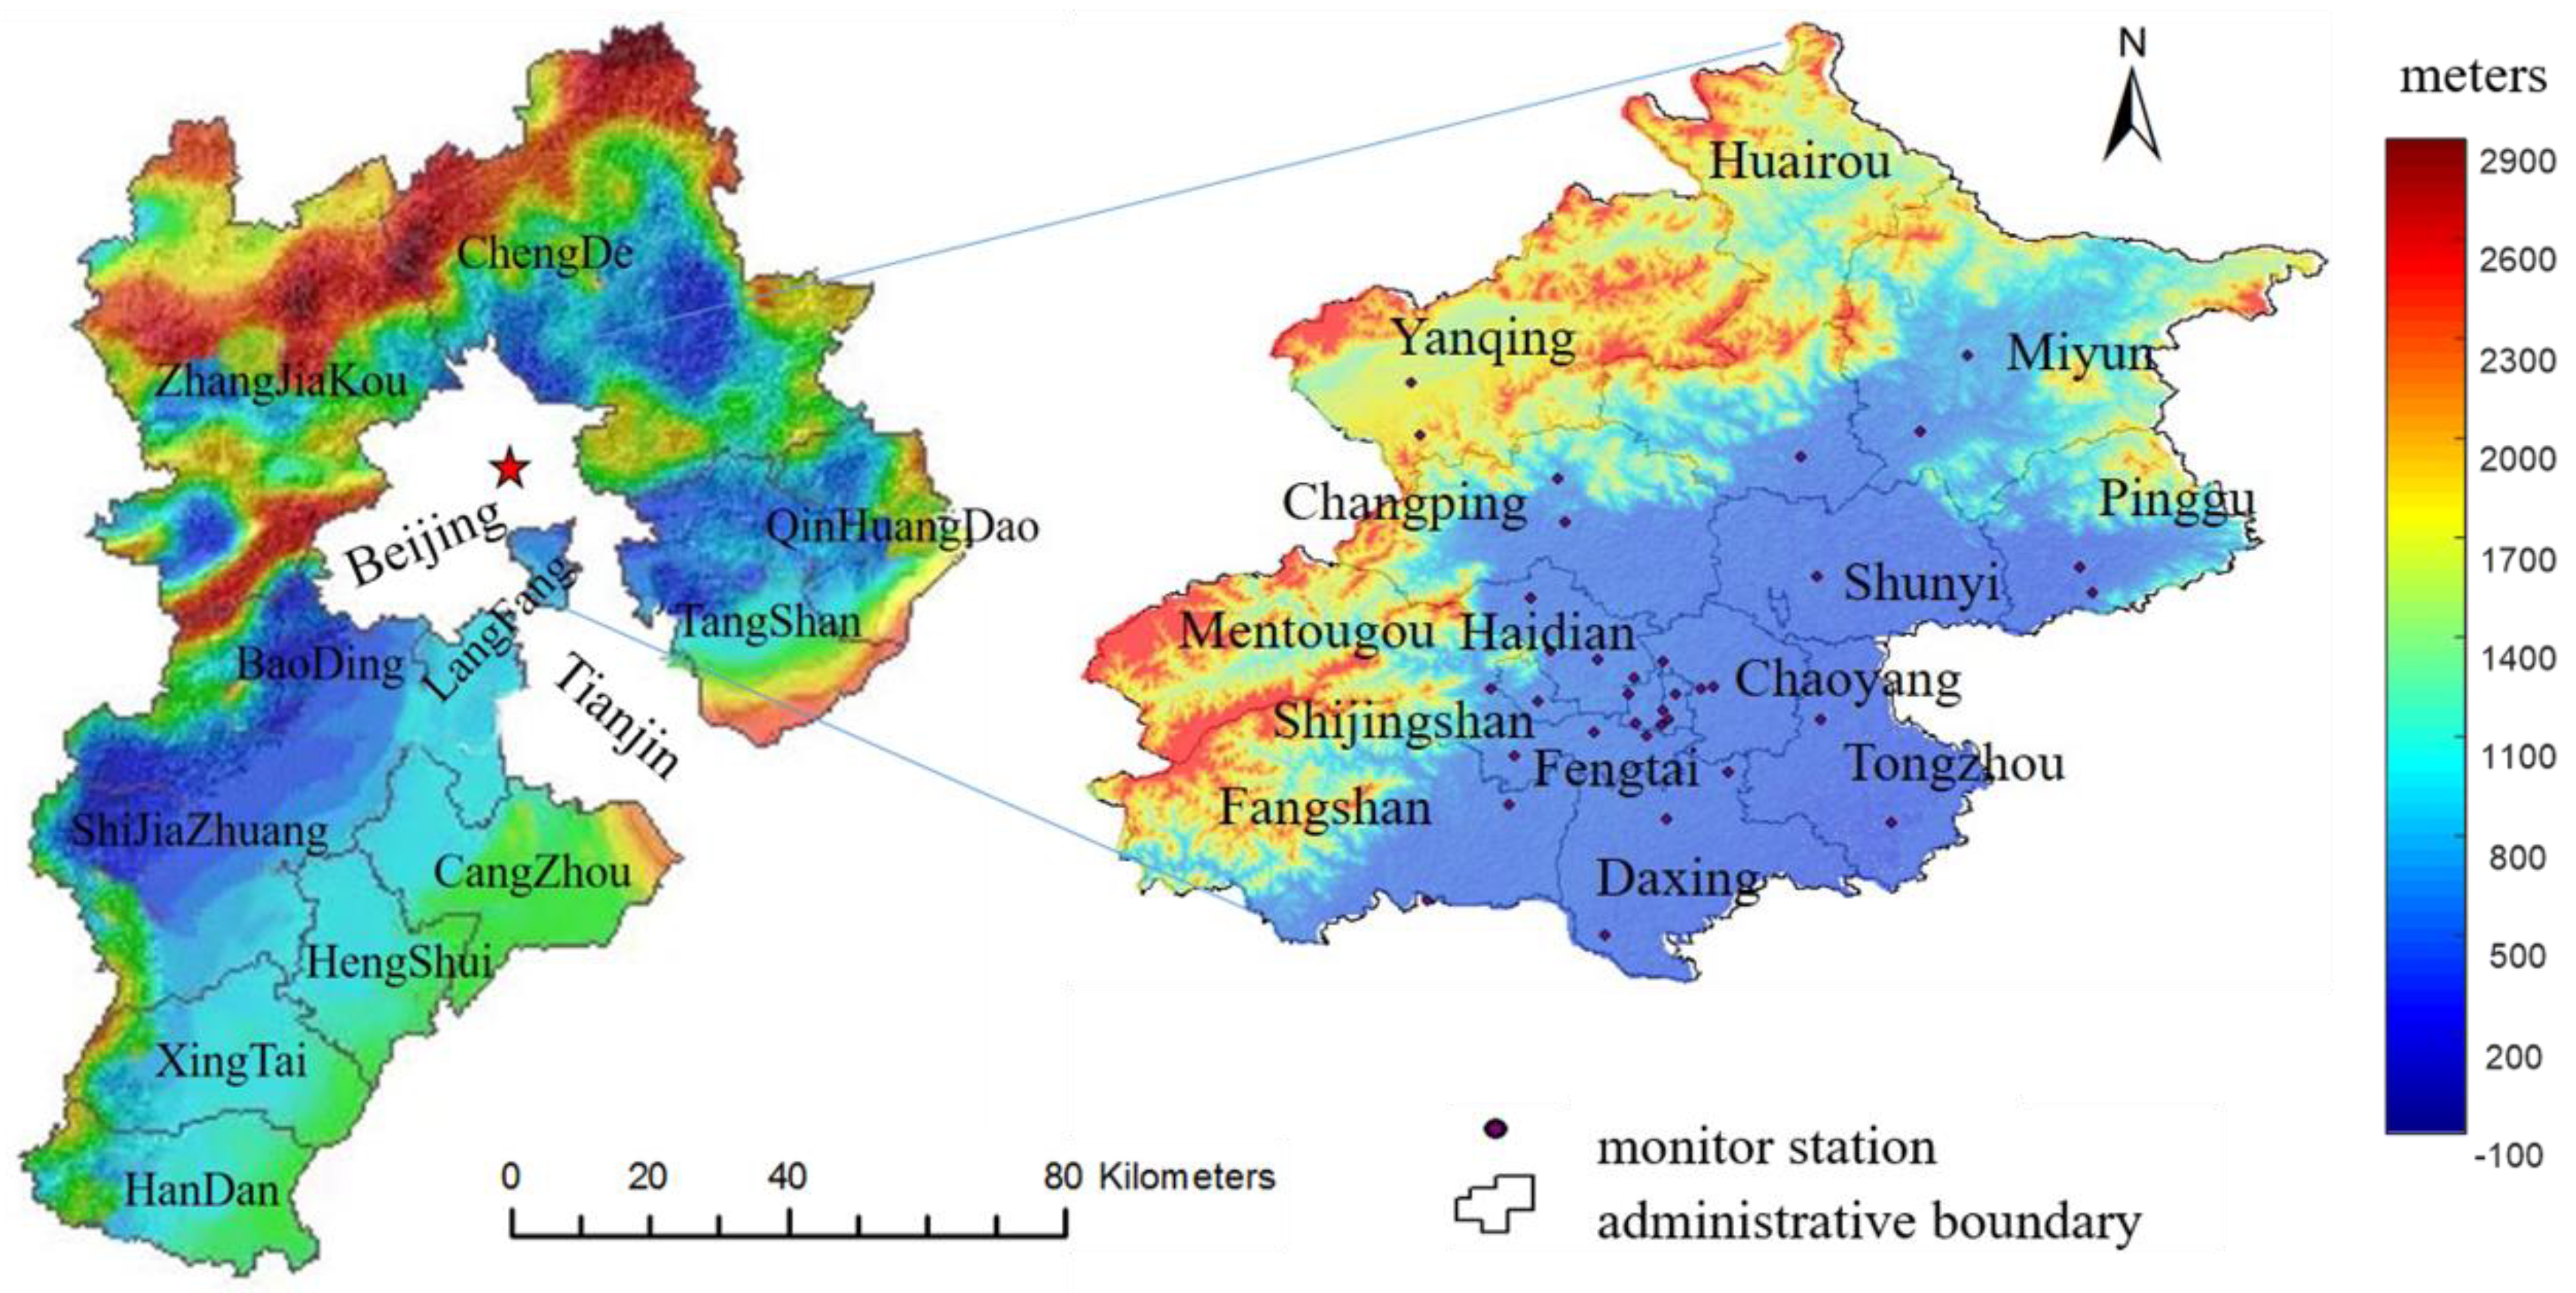
2.1. Study Area

Beijing, ranging from 39.4° N to 41.6° N and 115.7° E to 117.4° E and located in the north of the North China Plain, is surrounded by Hebei Province, along with Tianjin. The terrain is generally characterized by high altitude in the west and low altitude in the east. The western mountains belong to the Taihang Mountains and the northern mountains belong to the Yanshan Mountains. The central and southeastern parts between the two mountains are plain areas, with large mountainous areas and a total elevation between 20–2300 m. It has 16 districts, 6 of which are located in the downtown area and the remaining 10 are located in the suburbs, covering an area of 16,410.54 square kilometers. The seasonal distribution of precipitation is fairly inhomogeneous. 80% of the annual precipitation occurs in the three months of summer (June, July and August). The sunshine duration is the longest in spring, followed by autumn. In summer, the sunshine duration is slightly shorter due to the plentiful precipitation and the sunshine duration is the shortest in winter. Taking into account the effects of transport, this study focuses on Beijing and its surrounding cities, including Baoding, Chengde, Langfang, Tianjin, Zhangjiakou, and Tangshan. The study area is illustrated in Figure 1.

2.2. Data Collection

Historical site records of major pollutant concentrations and meteorological data from 2 December 2013 to 30 June 2017 were collected from open sources, spanning a total of 1307 days. Ground-measured hourly pollutant concentrations, including those of PM10, PM2.5, carbon monoxide (CO), nitrogen dioxide (NO2), sulfur dioxide (SO2), ozone (O3) and the Air Quality Index (AQI), were collected from the Beijing Municipal Environment Monitoring Center (BJMEMC, http://zx.bjmemc.com.cn/) and then calculated as daily mean values. The locations of the 35 monitoring stations around the city are shown as dots in Figure 1. Original meteorological data on air temperature (TEM), daily sunshine duration (SSD), wind direction (WD), and wind speed (WIN), etc. were acquired from the website of the National Meteorological Information Center (NMIC, http://data.cma.cn/). Pollutant concentrations measured in surrounding cities were obtained from the Ministry of Environmental Protection of China data center (MEP, http://www.mep.gov.cn/). The raw parameters selected from open sources are listed in Table 1.
For meteorological data, NMIC provides the Air Pollution Index (API) interface for data acquisition. After authentication, it can be downloaded directly and the original data can be obtained through analysis. There are no historical archived pollutant concentration data and the BJMEMC official website only provides real-time online display. This paper applies a crawler based on the Scrapy framework to scrawl pollutant concentration records.
The data flow in Scrapy is controlled by the central engine. The engine opens a website for a crawler, requests the URL address for the site and then schedules it in the scheduler. The engine sends the URL to the downloader by the download middleware and the download middleware then disguises itself as a normal client in response to the anti-scrawling strategy and generates feedback from the parsing page and returns to the engine. Once received by the engine, the parsed page is sent to the crawler by the crawler middleware, then the content resolved by the crawler is sent back to the engine. The collected data are saved to a database through the pipeline and item middleware and then returned to the scheduler. After that, the procedures above are repeated until all requests are processed. The engine closes the website and gets all the data.

3. Methodology

The main data analysis methods adopted in this study include statistical analysis, spatial analysis, and visualization technology. The statistical analysis technique principally included variance analysis, correlation analysis, regression analysis, factor analysis, and so on, analyzing the complicated relationship between PM2.5 concentrations, meteorological factors, and surrounding factors. Spatial analysis, including Spatial Center Statistics (SCS) and Exploratory Spatial Data Analysis (ESDA) were adopted to reveal the temporal and spatial characteristics of pollutant diffusion. The Spatial Center Statistics focused on depicting spatial distribution, which was mainly realized by calculating the basic parameters of the distribution, while the Exploratory Spatial Data Analysis emphasized the description of data, the identification of data statistical characteristics, and the preliminary judgment of the structure of the data through relevant assumptions, aimed at revealing spatial data characteristics, identifying outliers or regions, exploring spatial association patterns, recognizing accumulate or hotspot areas, implementing spatial zoning, and discovering spatial heterogeneity through geographical visualization. The data visualization methods used in this paper mainly included scatter plot, wind rose chart, and violin diagram, so as to intuitively illustrate the atmospheric phenomena varying with time and space behind data and help to find out the potential development pattern.

4. Results and Discussion

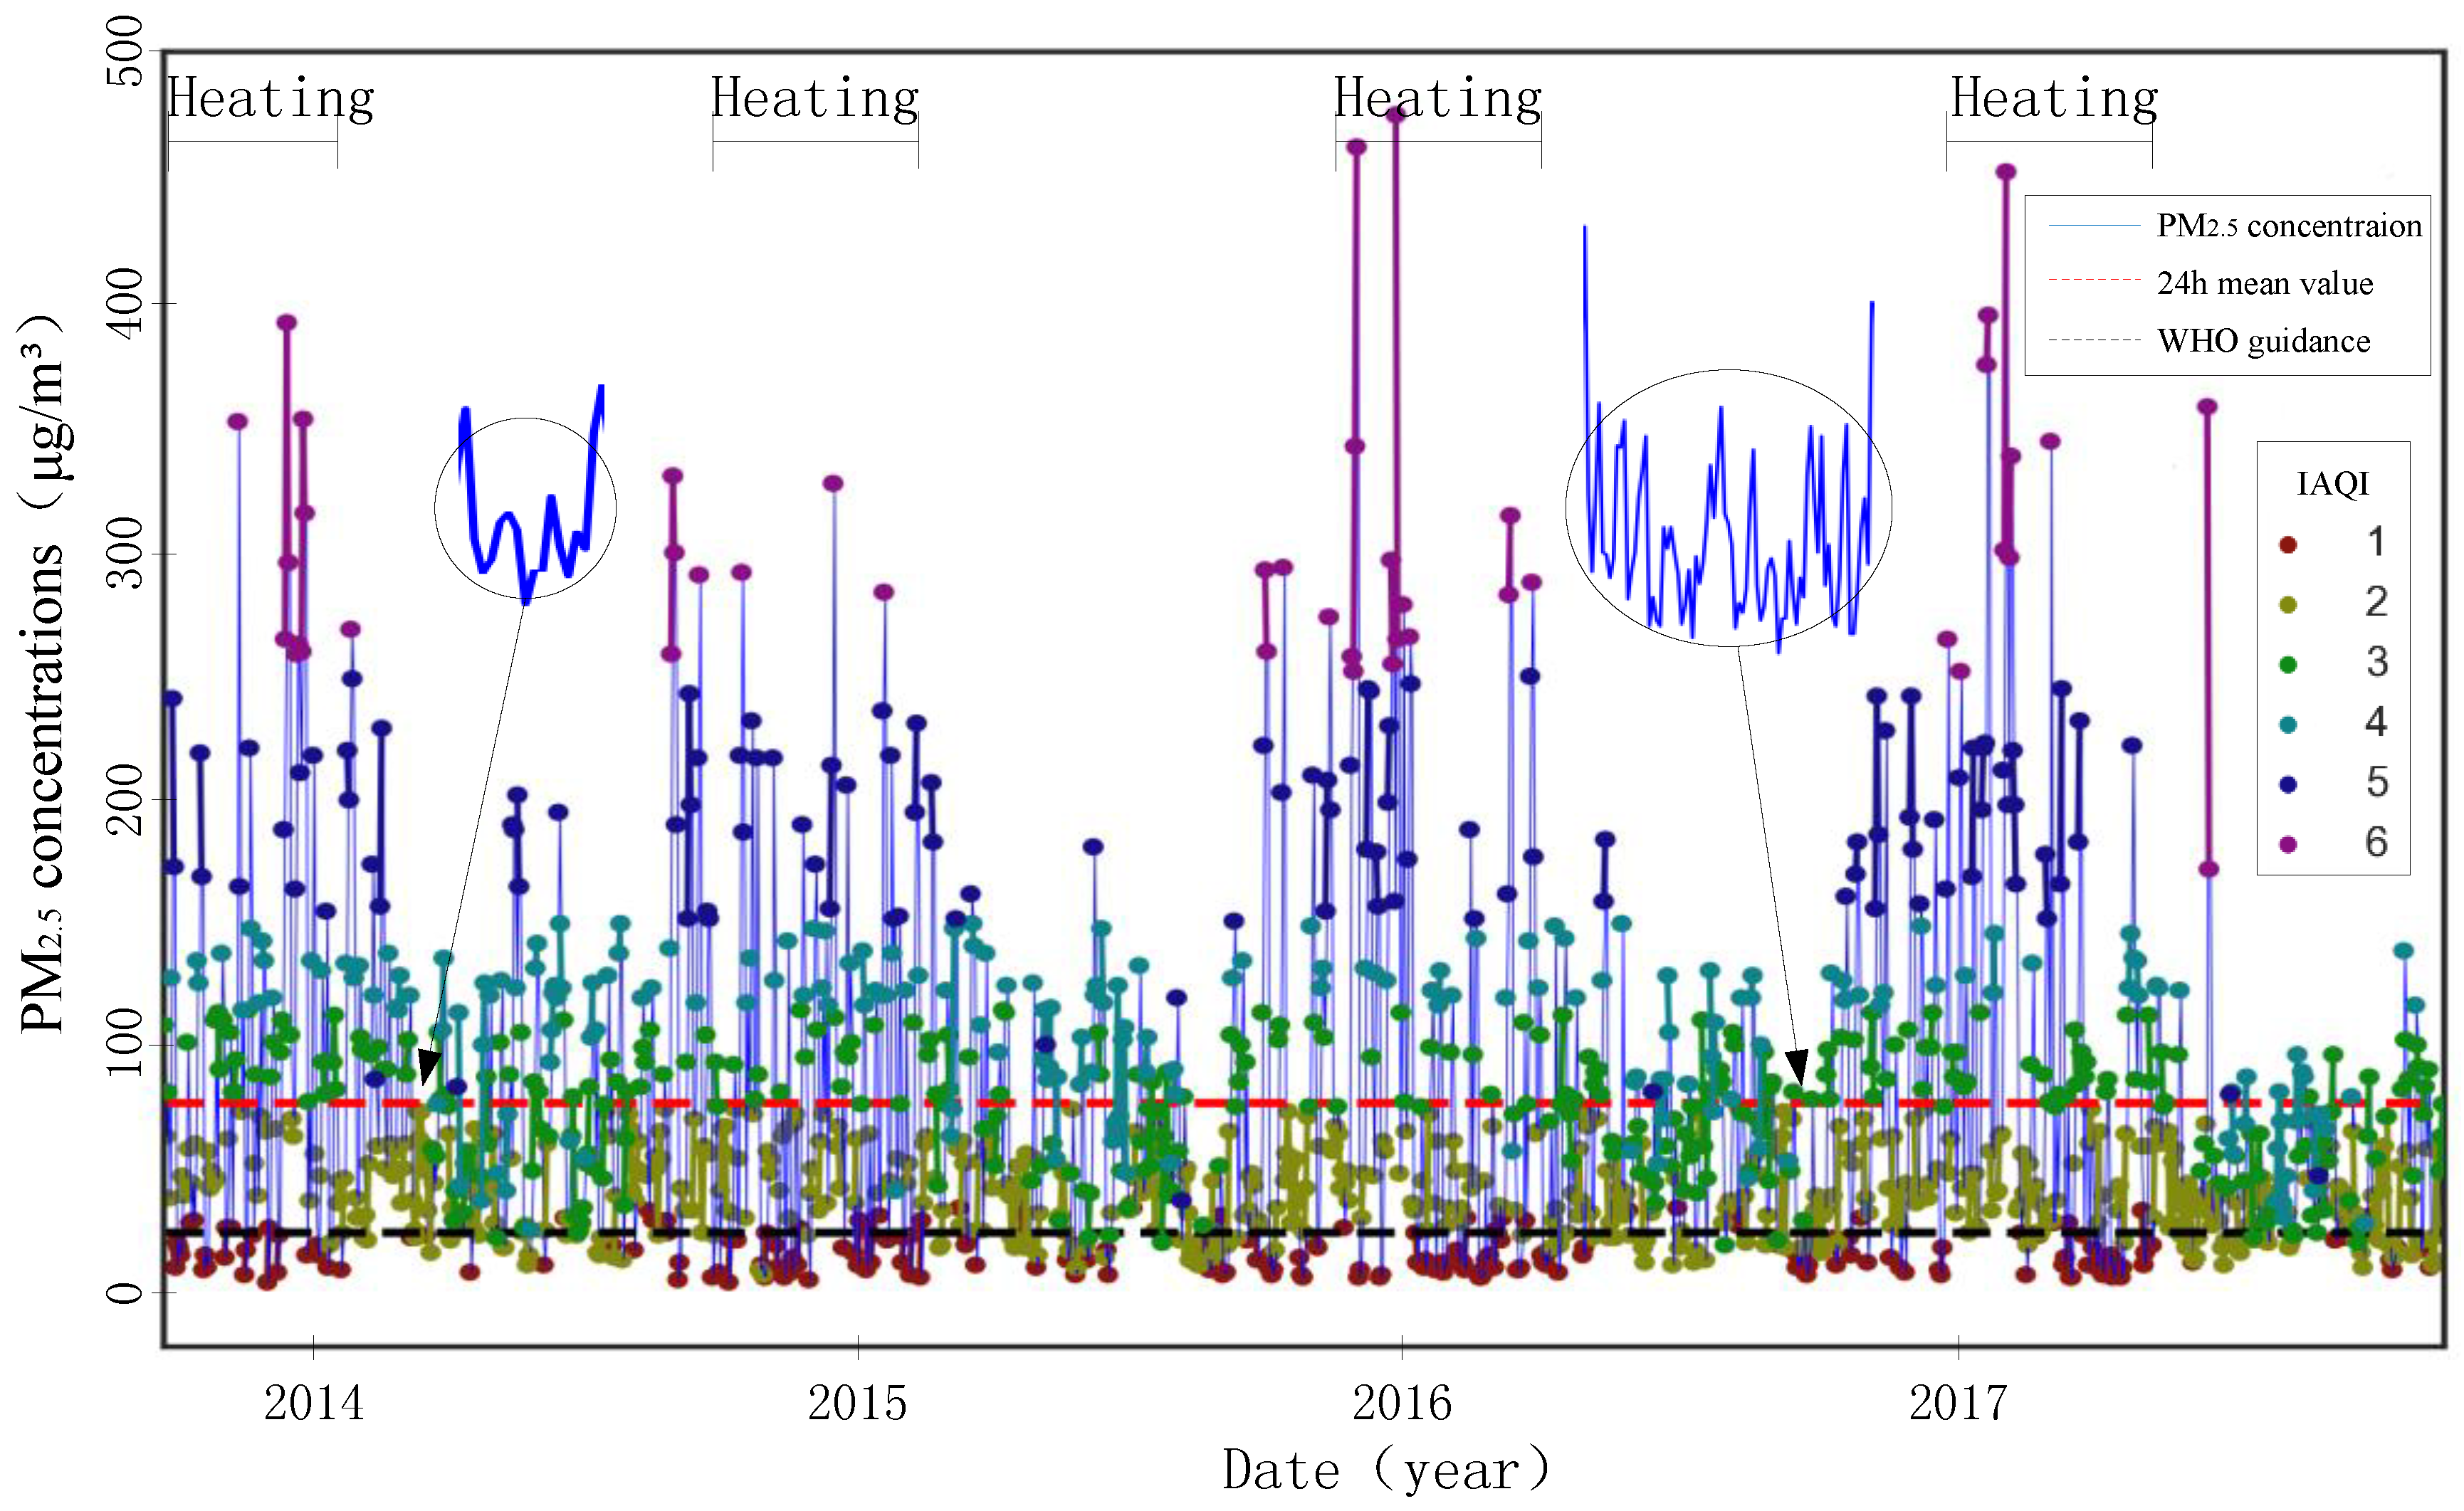
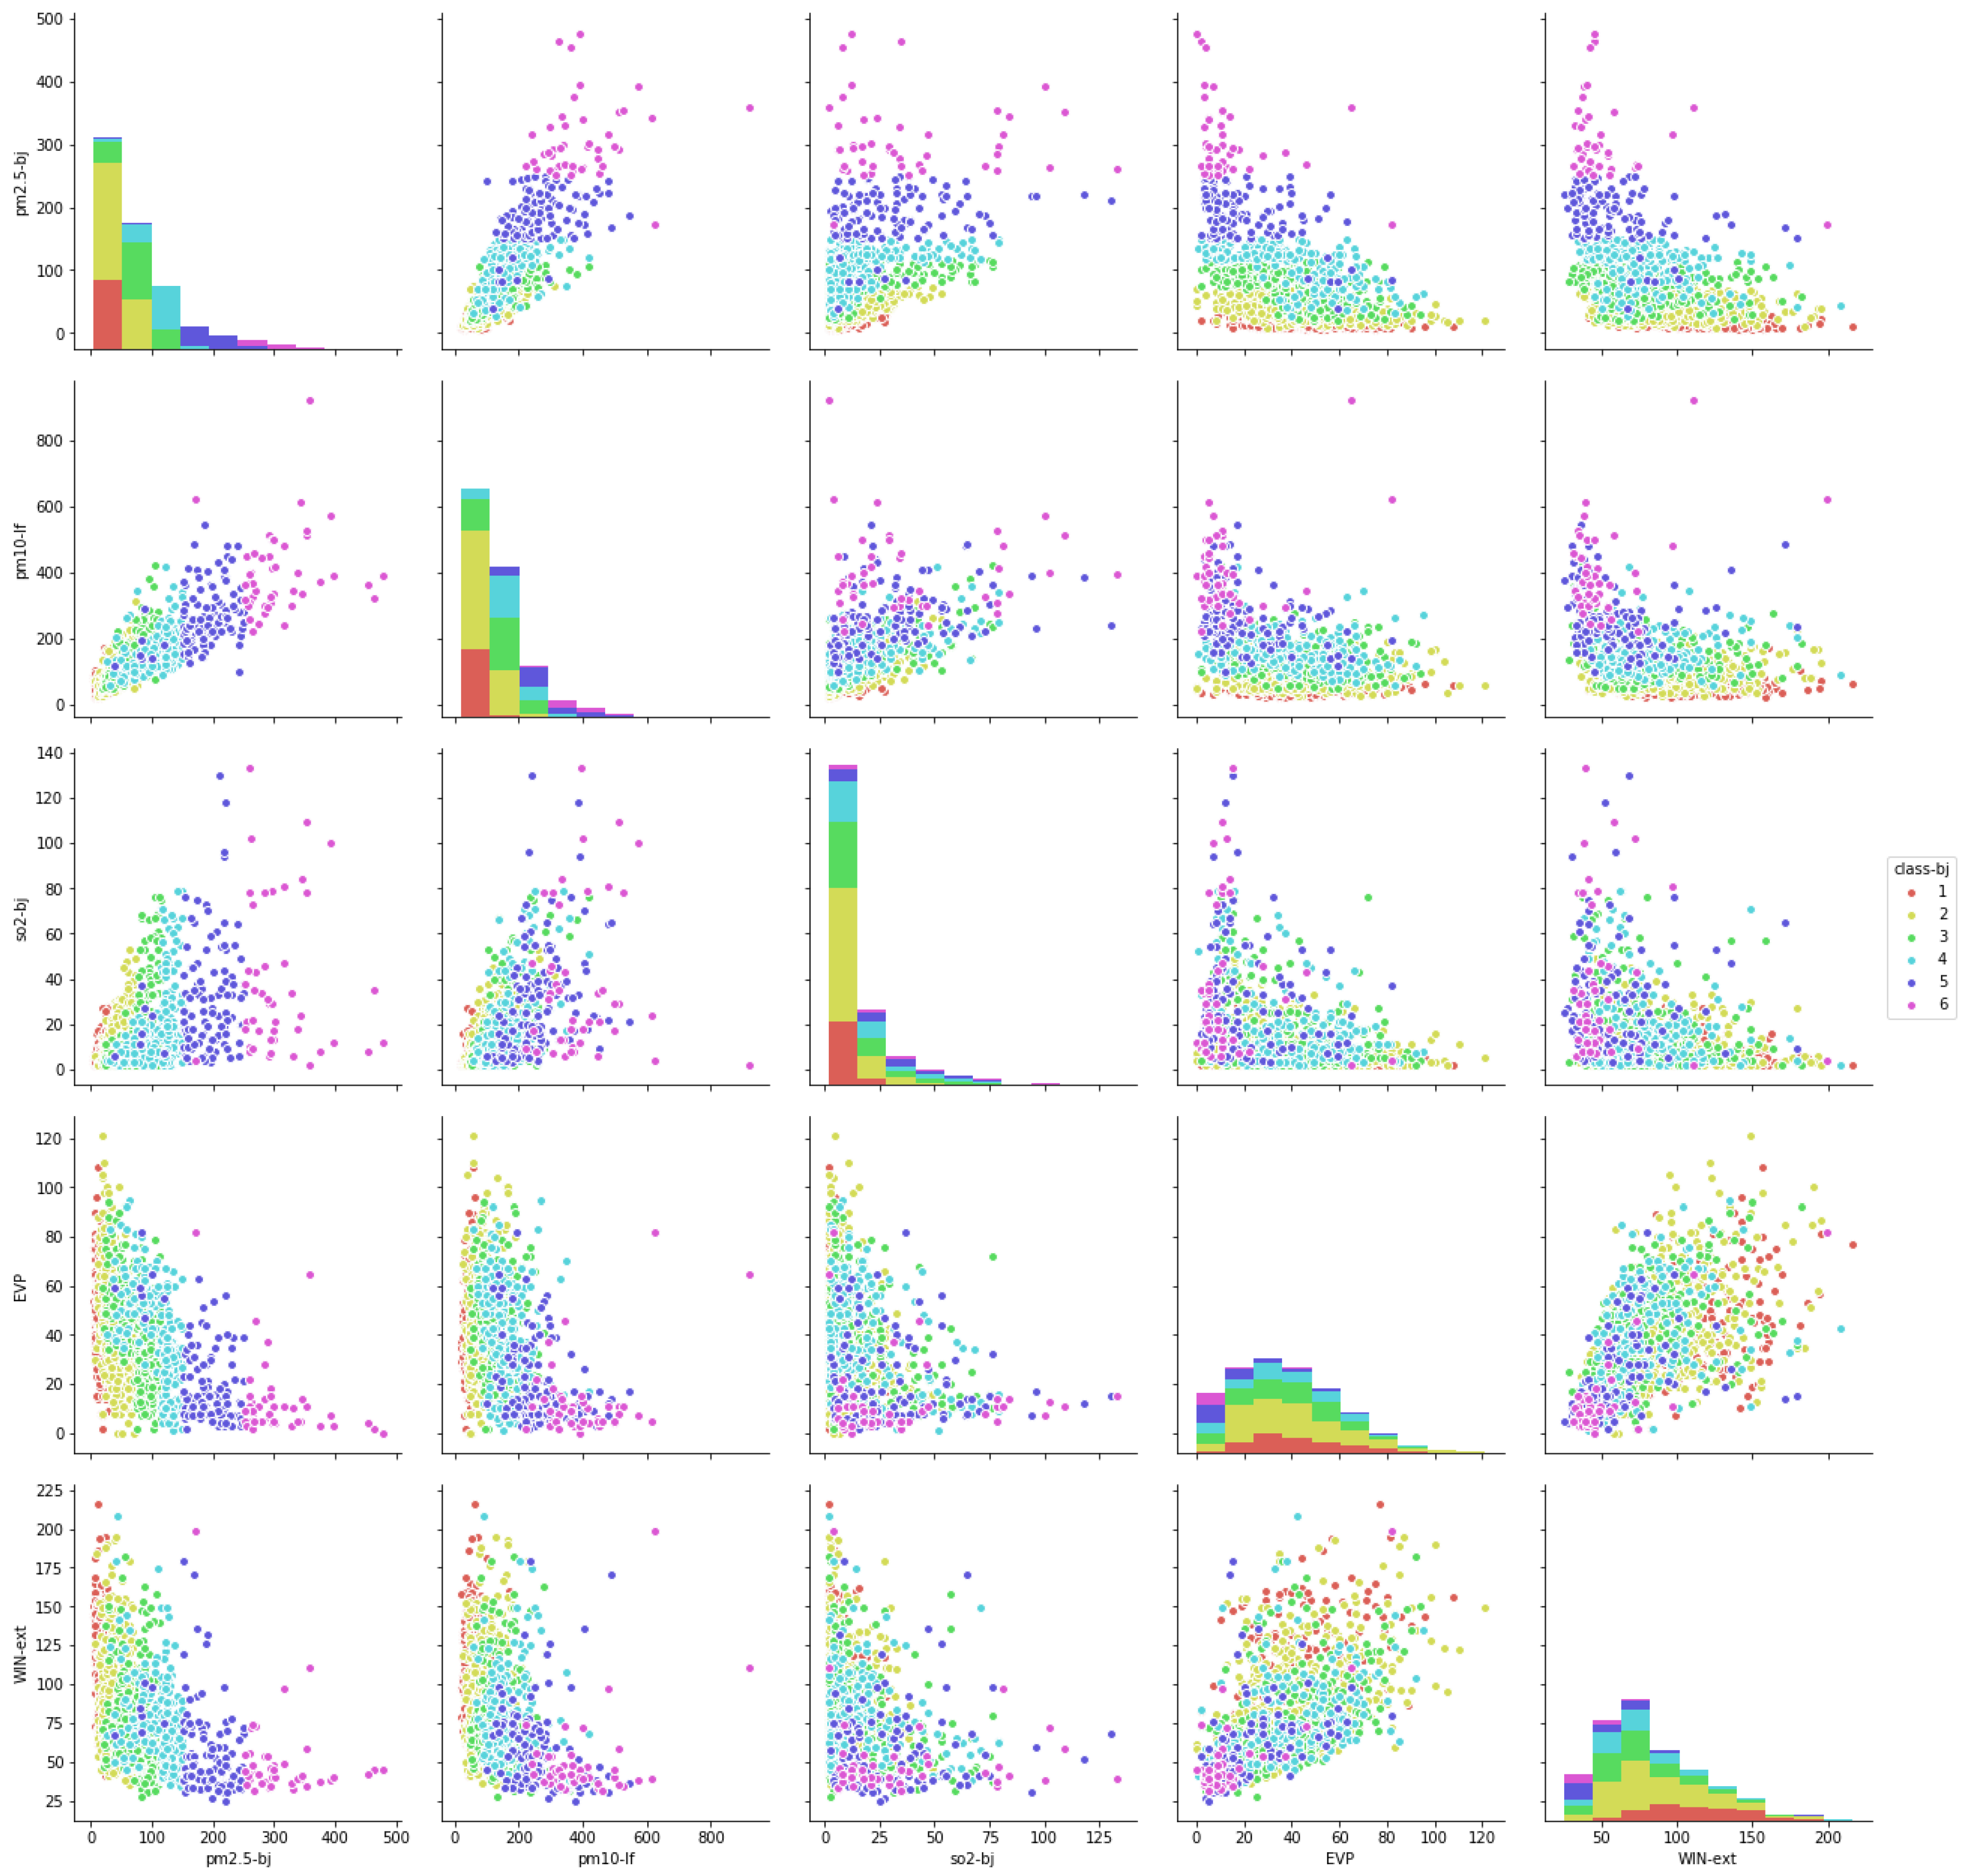
4.1. General Statistical Characteristics of PM2.5 Concentrations and Exploratory Data Analysis

Statistical descriptions of the main indicators measured for the observation period are presented in Table 2. It can be seen from the table that the air quality situation in Beijing is certainly not optimistic, considering how the average 24-h value of PM2.5 concentrations reached 77.40 μg/m3. This is three times more than the WHO guidance value (25 μg/m3) and the 24-h average of the PM10 concentrations reached 104.90 μg/m3, which is two times more than that of the WHO guidance value (50 μg/m3). The 24-h maximum concentrations of PM2.5 and PM10 reached 477 μg/m3 and 820 μg/m3, respectively. In addition, the variance of PM2.5 and PM10 concentrations were also closed to the mean levels respectively, indicating the volatility of the major pollutant concentrations and the instability of the regional air quality. The annual mean value of other gaseous pollutants has not exceeded the national standard at present but the peak value was higher in different degrees than the national level-2 standard in the same period. It reveals that all of the pollutant concentrations in the heavily polluted days have reached reasonably high levels and the long-term exposure to such an environment is very harmful to the human body and corresponding protection measures should be taken as precautions.
Figure 2 shows the fluctuation of the PM2.5 concentrations in Beijing during the study period. The solid line represents the variety of PM2.5 concentrations, the points are the daily mean values of PM2.5 concentration in six different colors according to the Individual Air Quality Index (IAQI) level respectively. The 24-h mean value of PM2.5 concentrations in the study period and the corresponding WHO guidance value are marked by a dotted line. It can be seen that about 40% of Beijing’s air quality exceeded the national standard in one year and the air quality exceeded the WHO recommended standard about 80% of the time.
It can be drawn from Figure 2 that the air pollution caused by fine particles exhibits remarkable volatility and irregularity, at the same time, it shows a certain seasonal and periodic fluctuation in the overall variation tendency. The peak values of pollutant concentrations generally concentrate on heating periods, indicating that the energy structure of central heating has had an obvious influence on the ambient air quality in Beijing. According to the management methods for central heating in Beijing, the statutory heating period in Beijing is generally from 15 November to 15 March of the next year and fluctuates slightly in accordance to the current situation. The annual variation of PM2.5 concentrations were relatively stable, with the annual mean values of year 2014 to 2017 were 84.83 μg/m3, 80.25 μg/m3, 73.01 μg/m3, and 57.83 μg/m3 respectively. The annual mean values spread over a decreasing tendency, which indicates that the current treatment measures for air pollution have achieved initial success. In terms of the periodical tendency, the short cycle of the pollutant concentration fluctuations was about one week (the left magnified curve in Figure 2) to one month (the right magnified curve in Figure 2), the long period is one year, and the peak of the pollutant concentrations occurred alternately throughout the year.

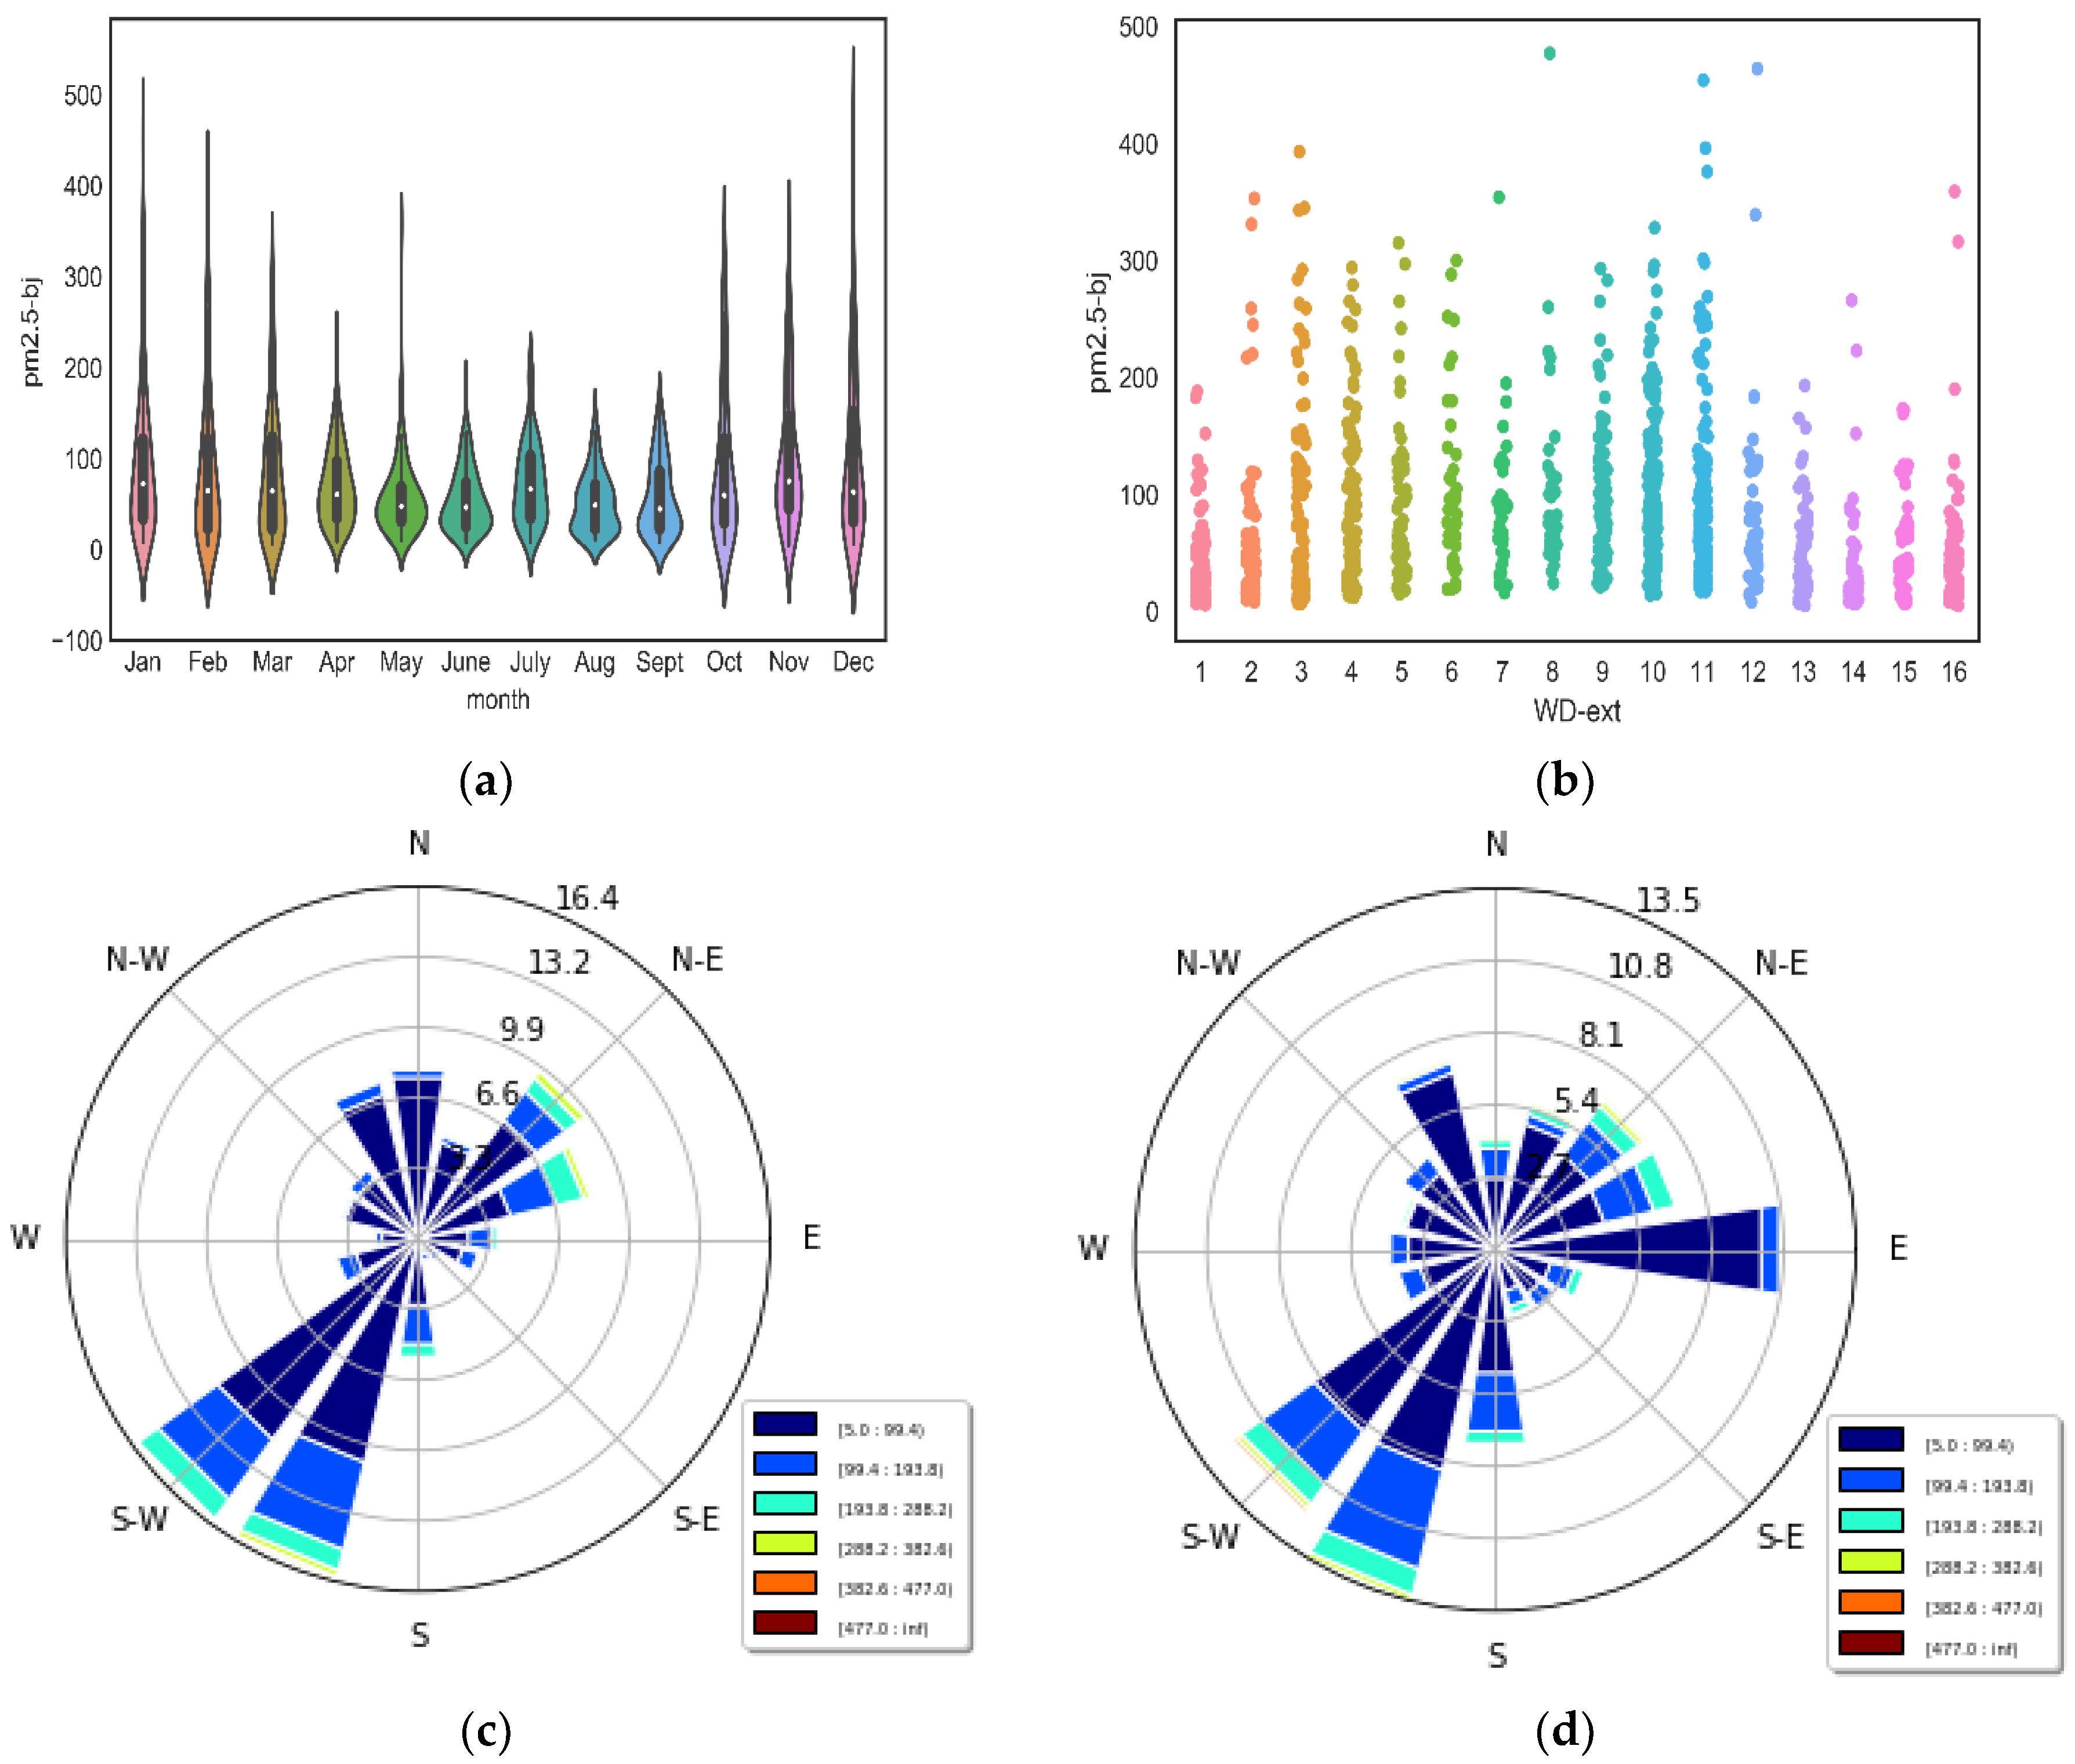
4.2. Seasonal Variation of PM2.5 Concentrations in Beijing

Figure 3 shows the temporal and spatial distribution of seasonal variation of PM2.5 concentrations in Beijing in the year 2017. According to climatological classification, the spring in Beijing is regarded as months March, April, and May, the summer from June to August, the autumn from September to November, and the winter will be regarded as the time from December to February of the next year. This distribution situation diagram uses the monitoring data of 35 monitoring stations in the city, taking into account the anisotropy, autocorrelation, and the trend of data distribution, which is drawn by the Kriging interpolation method in geo-statistics [29,30].
It can be drawn from Figure 3 that the air pollution in Beijing is more serious in spring and winter, and slightly better in summer and autumn. The distribution of pollutants varied dramatically in different seasons. The most seriously polluted regions in spring were the southern and central Beijing. In summer, the overall air pollution situation was better, only the southeast part of the city was more polluted. The main polluted areas in autumn were also concentrated in the southeast and southwest regions. In winter, the pollution situation was further aggravated, and some regions in the north also registered by high level pollution in PM2.5 concentrations. In general, the spatial distributional characteristics of regional air quality were quite different in the four seasons, the pollution levels in the southern regions were more serious, and the concentrations of pollutants gradually reduced from the southwest to the northeast. The seasonal variation of pollutant spatial and temporal distribution may have been caused by different meteorological conditions and the distribution of pollution sources [31,32]. For example, the meteorological conditions formed by the combination of dry climate and strong wind in spring are conducive to the formation and development of sandstorms. The humid and hot environment and the increase of irradiation intensity in summer are beneficial to the formation of photochemical reactions, resulting in secondary pollution. The spatial distribution of pollutants in autumn was mainly due to the regional transport caused by unfavorable weather conditions, which was the main cause of air pollution in this period. In winter, the air quality was inseparable from the biomass burning [33] and coal combustion [34]. With the weakening of the wind and the decrease of the atmospheric height, the diffusion and convection in the horizontal and vertical direction were gradually restricted. The accumulation effect of local pollutants aggravated the outbreak of serious pollution events in winter.

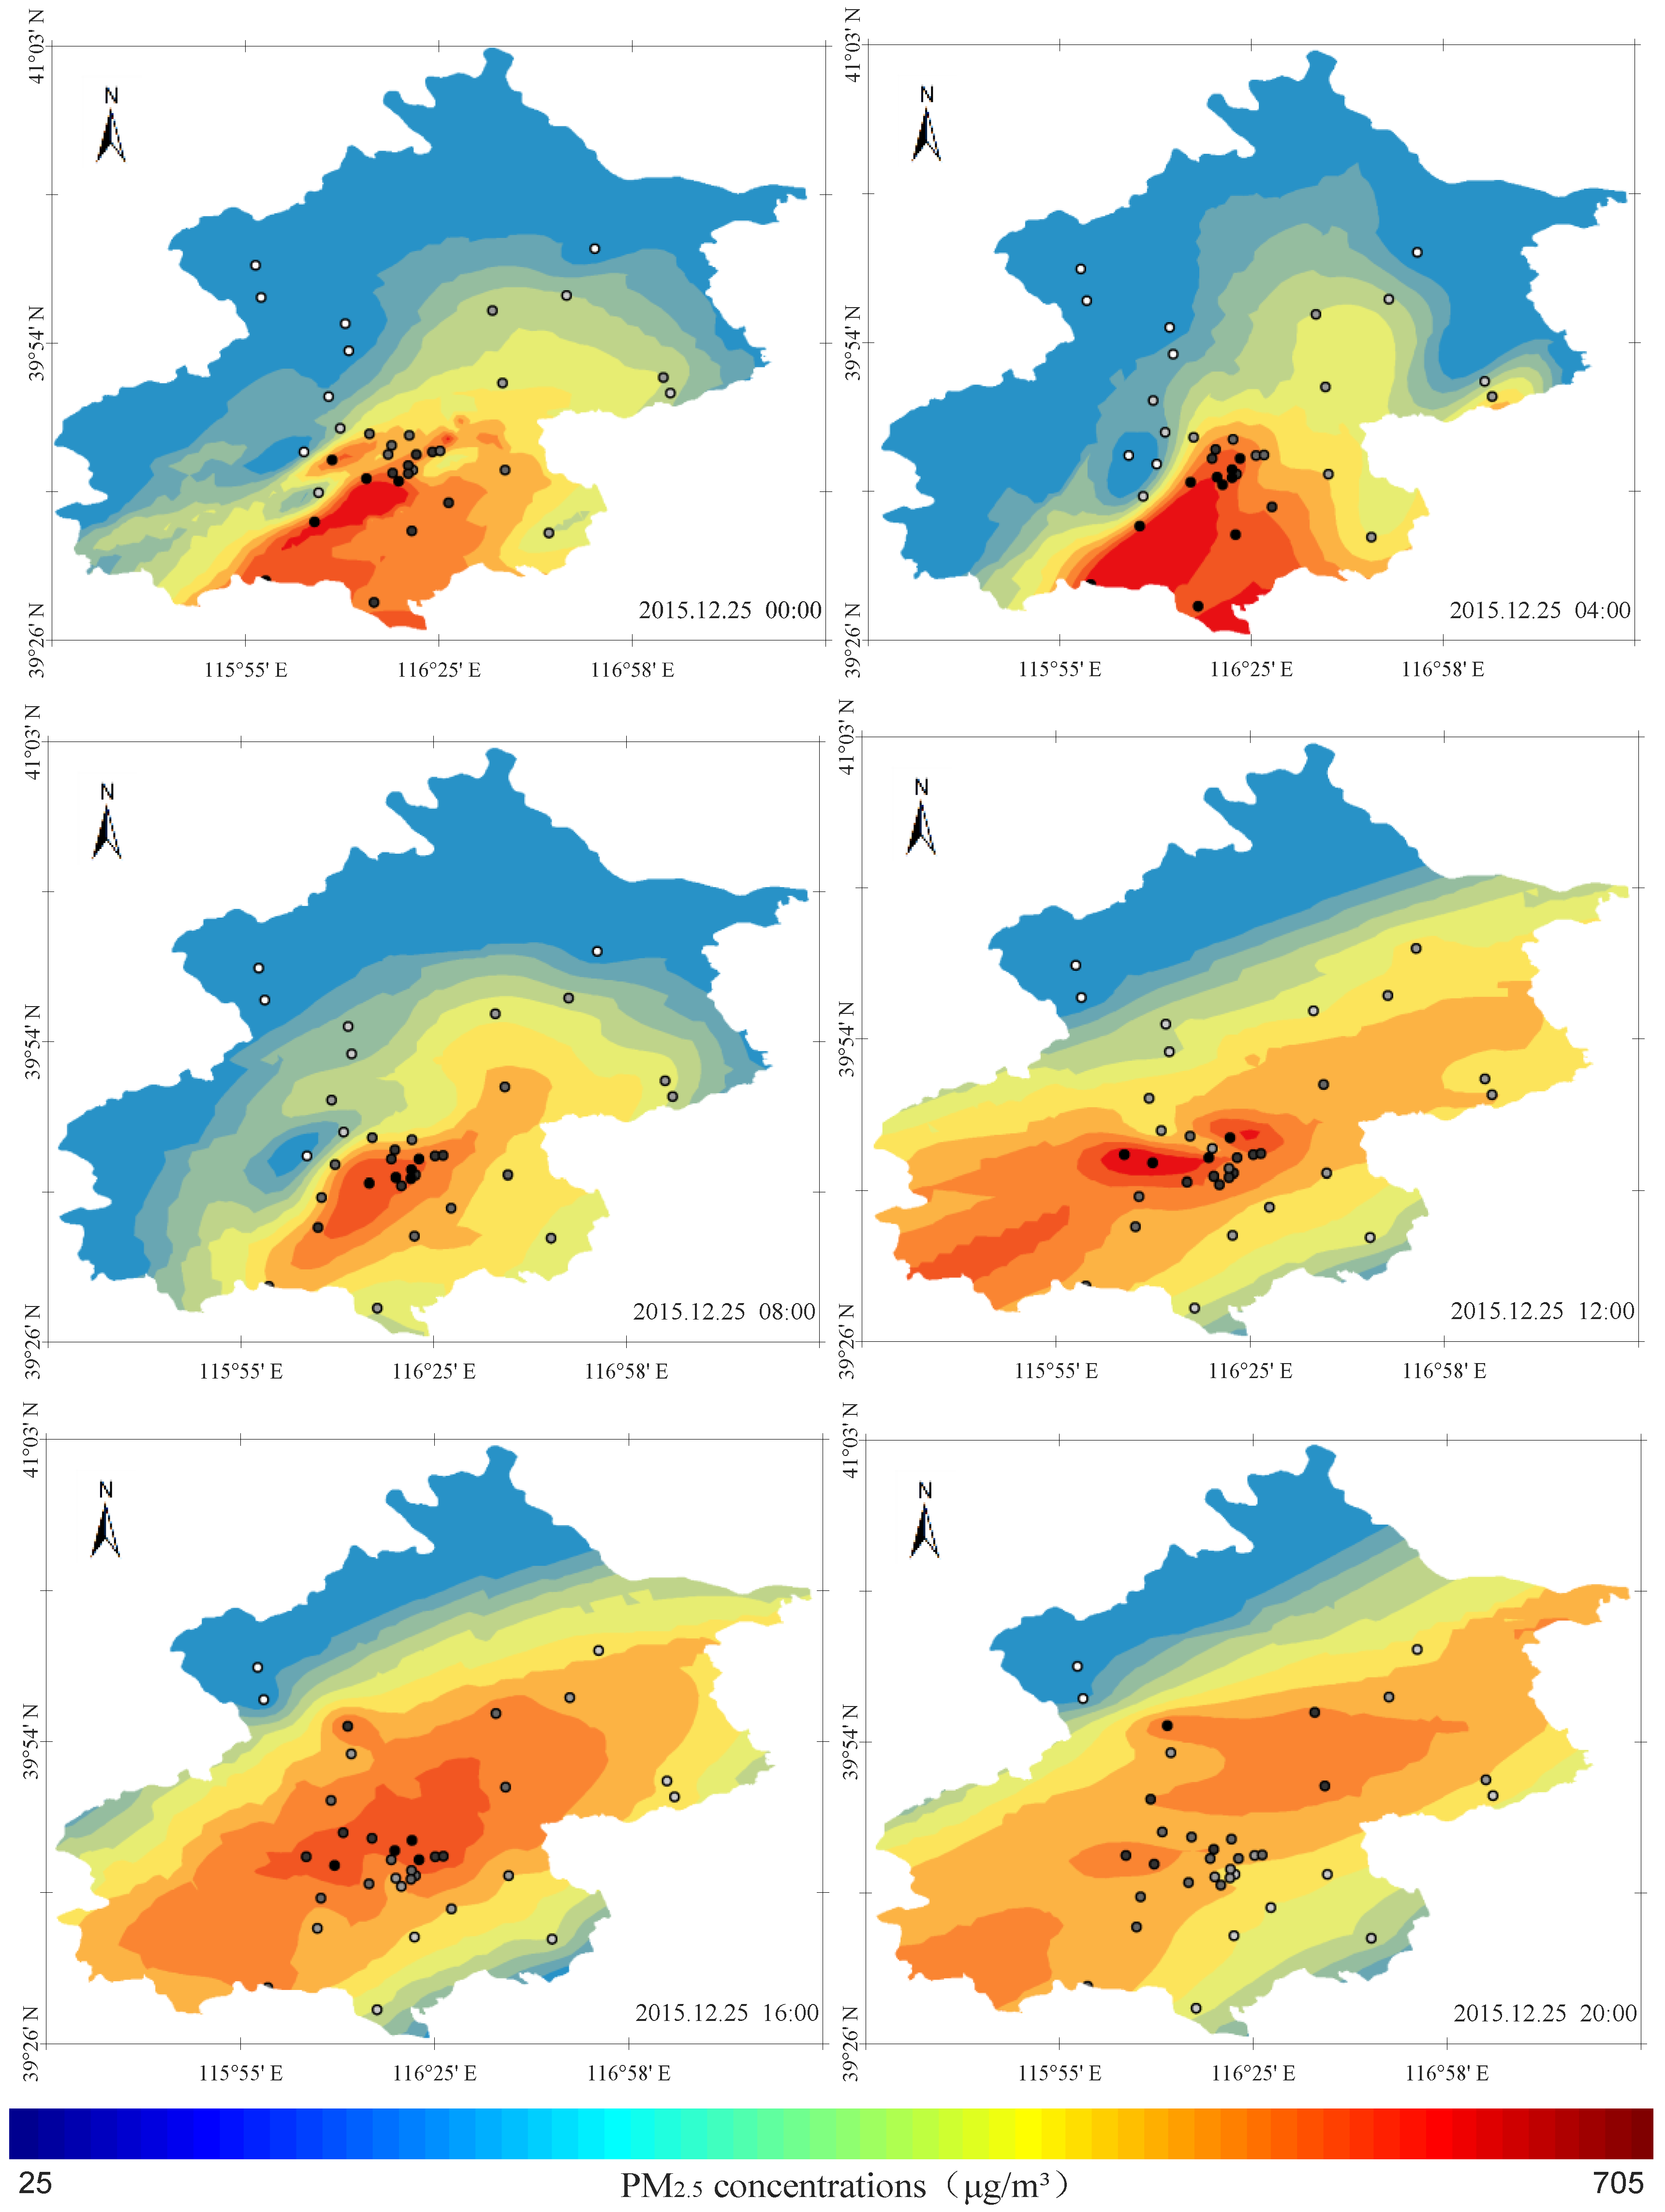
4.3. Diurnal Variation Characteristics of PM2.5 Concentrations in Beijing

Figure 4 shows the diurnal variation of PM2.5 concentrations in different seasons of the year 2017 in Beijing. The curves in different colors represent the variation of the seasonal average PM2.5 concentrations at different times in one day of the corresponding season. The value of each time is the average measured values of 35 monitoring stations around the city. The dashed lines represent the annual mean value of the PM2.5 concentrations in the year 2017 (red line) and the guiding value given by WHO (black line).
It can be observed from Figure 4 that the diurnal variation of air quality presented a certain seasonal difference and there was a certain fluctuation in diurnal concentrations. In the seasons of summer and autumn, the diurnal variation was small, with the daily fluctuation lingering around 10 μg/m3, while the diurnal variations in winter and spring was large, with the daytime fluctuation reaching about 20 μg/m3. The diurnal variation of PM2.5 concentrations was by and large characterized by a “W” type double wave. The peak value in the daytime occurred between 08:00 and 11:00 in the morning, and then continued to decrease to a trough. The peak in the night appeared after 19:00 and then gradually decreased in the early hours of the morning. The occurrence of the peak pollutant concentrations in the daytime could be related to the increase of human activity during the early peak period. With the increase of temperature at noon, the pollutant concentrations gradually decreased, aided by the weather conditions. Subsequently, with the approach of evening peak, the increase of restaurant emissions, and the reduction of the height of the planetary boundary layer, the concentration of pollutants increased further [34]. In the seasons of spring and summer, the average concentrations of pollutants were higher during the daytime and reduced at night, which contrasts with the situations in the autumn and winter. This difference was mainly due to the diverse sources of pollution and their distinct formation mechanisms in different seasons. The air quality in spring and summer was more affected by human activities. With the advent of night and the decrease of human activities, the concentration of pollutants dropped to a lower level in these two quarters. The main influencing factors of outdoor air quality in autumn and winter were the transport and diffusion effect of external pollution sources. The impact of human activity was relatively small and superseded by meteorological conditions. Therefore, during the night time, the lower atmosphere and stagnant wind conditions aggravated the accumulation of pollutants and increased the PM2.5 concentrations [20].
To further reveal the diurnal variation of the pollutant concentrations in Beijing, Figure 5 shows the temporal and spatial variation of the PM2.5 concentrations in Beijing on 25 December 2015. On 25 December 2015, a serious particulate matter pollution incident occurred in Beijing. The concentration of PM2.5 in some areas reached over 700 μg/m3, causing widespread international and social concerns.
As can be drawn from Figure 5, the particulate matters in Beijing were mainly concentrated on the southeast and central areas at 00:00 in the early morning, and the air quality in the northern and western mountainous areas was better than in other regions. At 04:00 and 08:00, the pollution bound expanded to the northern and western regions and the pollution levels in the southern part of the region were also aggravated, however the northern and western parts of the region still maintained high levels of air quality. By noon, the concentration of particulate matters in the city reached a peak and the pollution range was further expanded. From the southwest to the northeast, almost the whole city was immersed in serious pollutions of middle and above-recommended levels and the concentration of PM2.5 in some areas reached more than 705 μg/m3, creating the record of the highest concentration in a single day in the year. At this time, there were still some regions in the northern mountainous areas that were unaffected. At 16:00, the pollution range expanded once again. The core pollution areas were concentrated in the Fengtai, Chaoyang, and Haidian districts in the center of the city and the northern regions were also thereby affected. After nightfall, the concentration of pollutants gradually decreased but the pollution areas did not shrink. The average concentration of pollutants in the city dropped to the levels of 08:00 in the morning. In general, the heavily polluted areas in this serious pollution event were still concentrated in the southern and central areas, and were obviously affected by the transport effect from southwest directions. At the early stage of the development of this air pollution event (before 12:00 a.m.), the air quality level was mainly affected by the local emission and accumulation effects. Influenced by meteorological conditions, the transport effect of the surrounding pollution sources became the leading factor for the overall air quality levels in the city, which aggravated the severity of the air pollution and promoted the outbreak of a serious air pollution event.

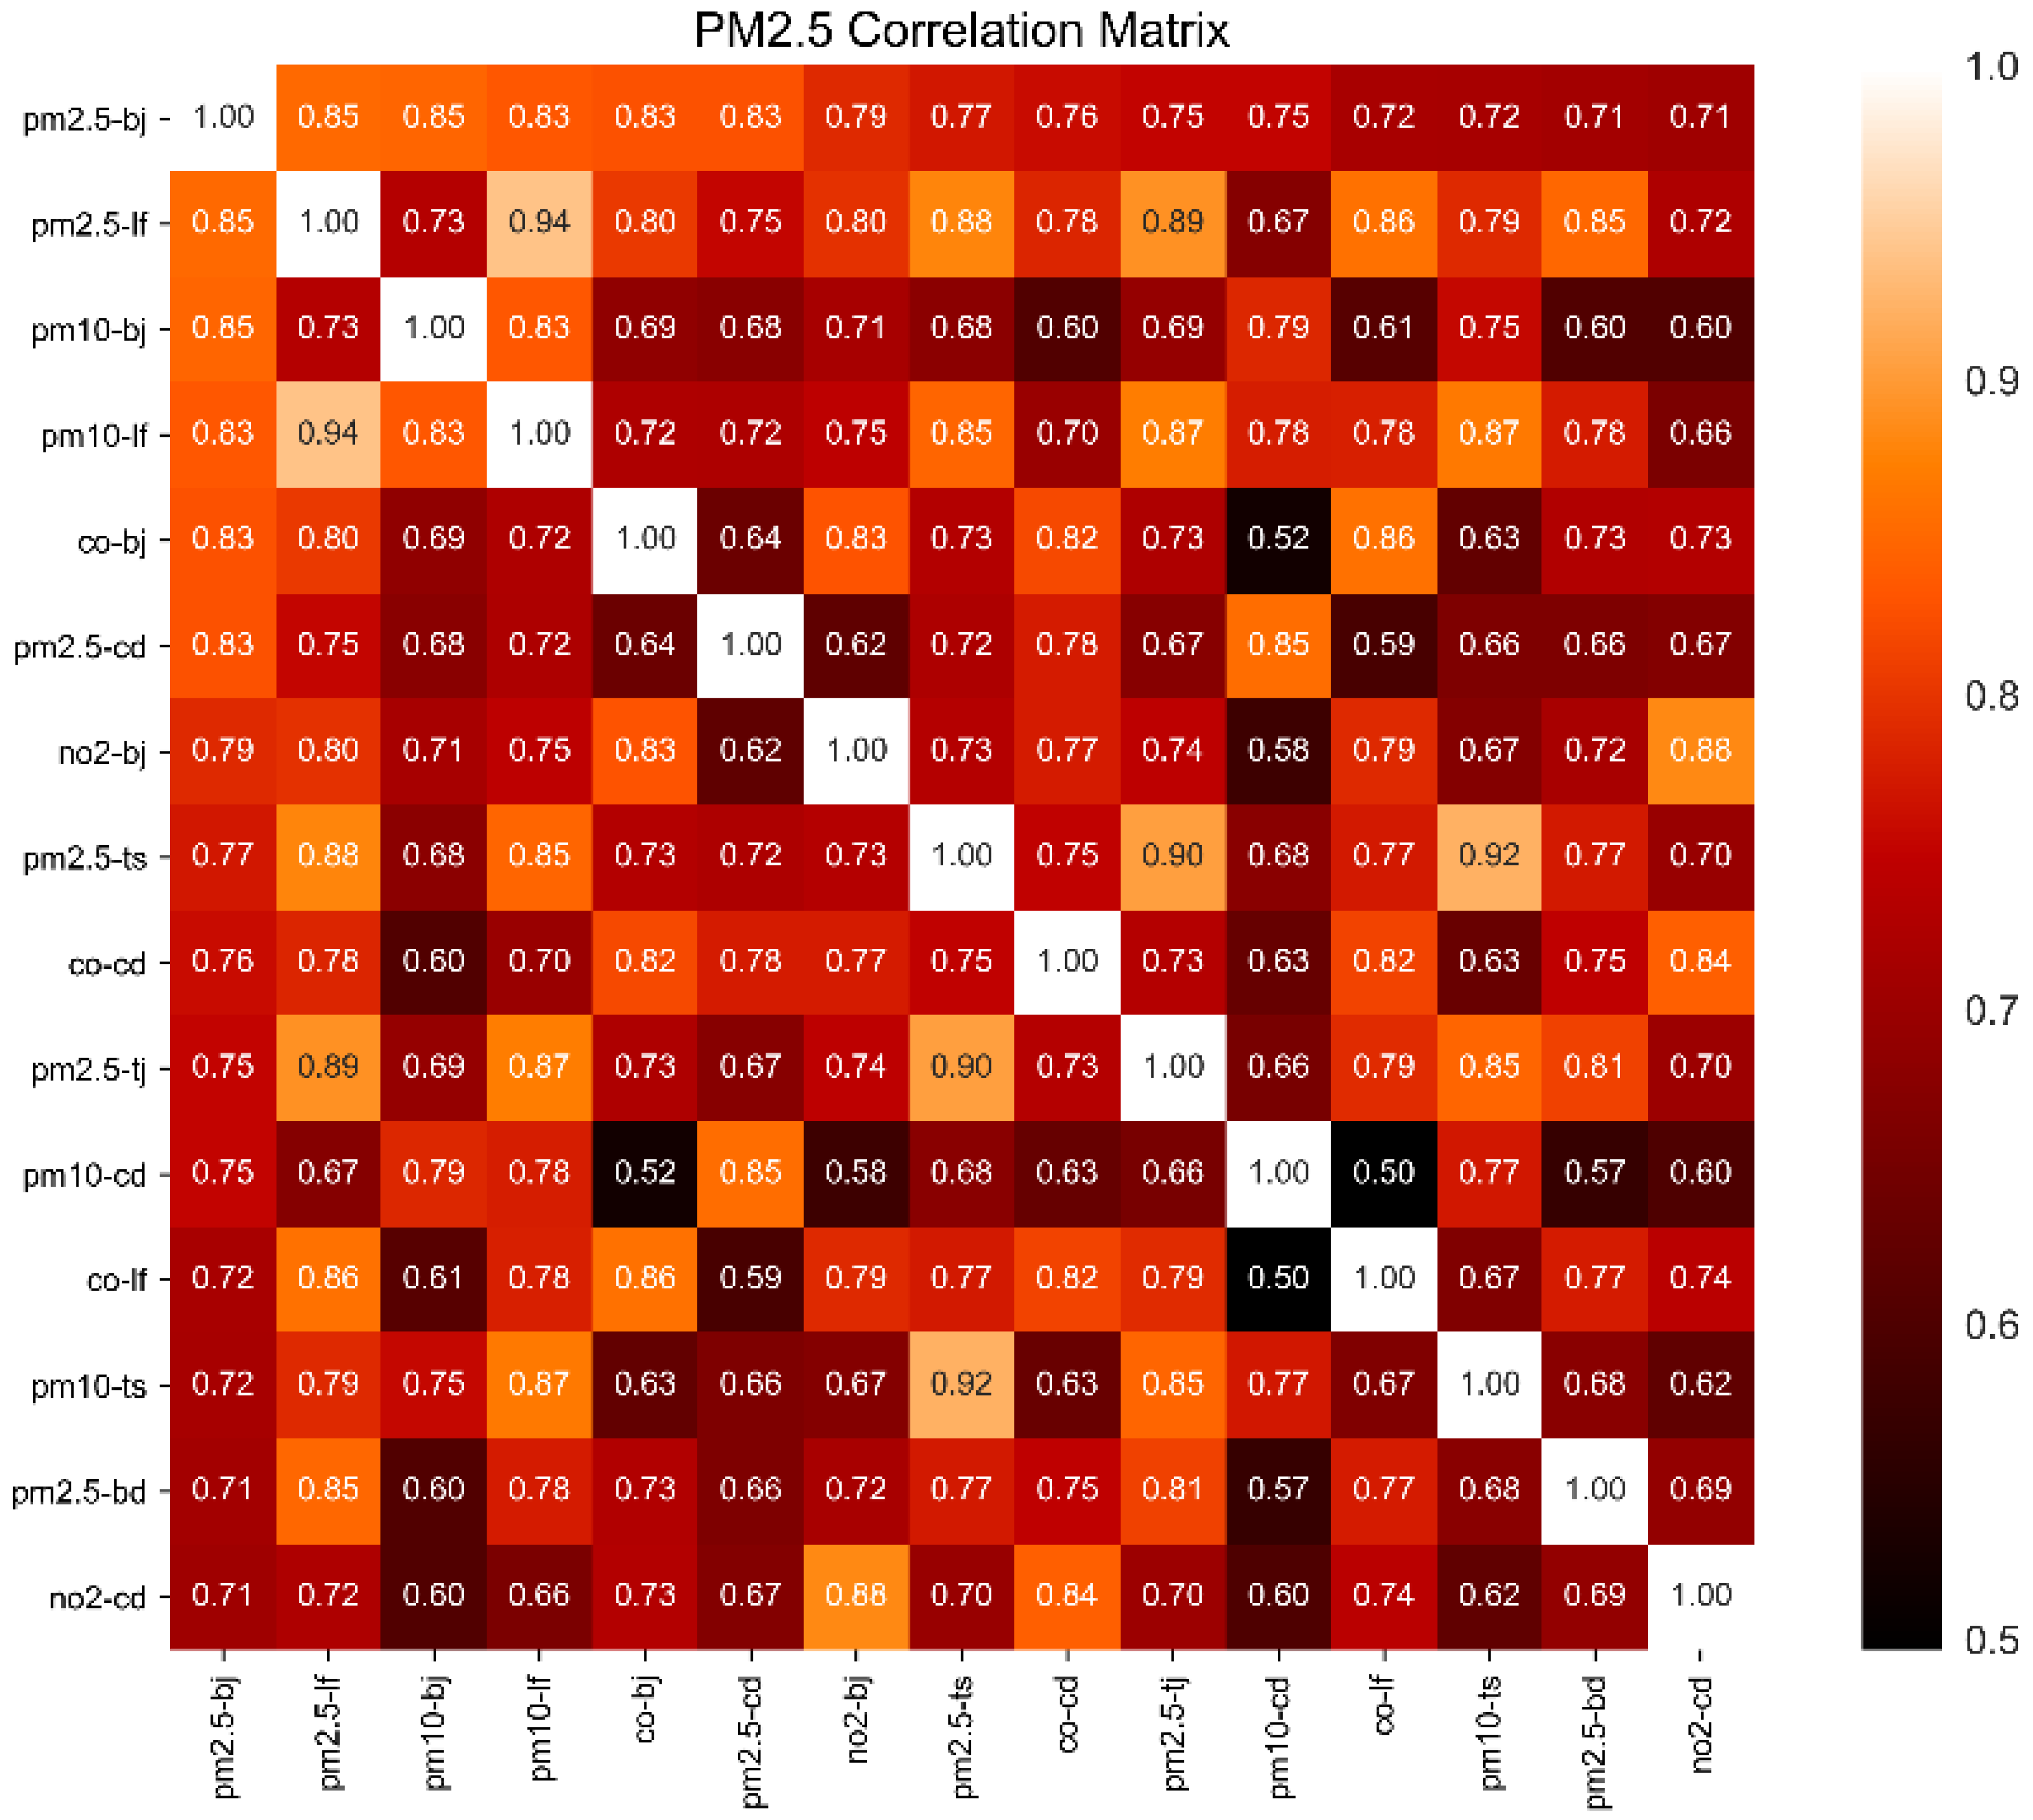
4.4. Relevance Analysis between PM2.5 and Major Pollutants

The raw data can be divided into two types, the numerical variables and categorical ones. For numerical variables, the Pearson coefficient analysis showed that the top five linearly related raw parameters with PM2.5 concentrations in Beijing were the PM2.5 concentrations in Langfang (0.85), PM10 concentrations in Beijing (0.85), PM10 concentrations in Langfang (0.83), CO concentrations in Beijing (0.83), and PM2.5 concentrations in Chengde (0.83), as shown in the upper right and lower left corners of the correlation matrix in Figure 6. At the same time, there was a linear correlation between the variables, as shown in the middle of the correlation matrix. Figure 6 shows a linear correlation matrix of the top 15 variables, with a high linear correlation with PM2.5 concentration. A significance test was performed on these correlation coefficients and found that sig = 0.000, indicating that the significance level p value was less than 0.001, further indicating that the correlation does exist. It can be seen from the figure that there was a strong linear correlation between PM2.5 concentration in Beijing and pollutants in surrounding cities, such as: Langfang, Chengde, Baoding, etc.
Moreover, obvious nonlinear relationships between several independent variables and dependent variables could be found during the exploratory data analysis, as depicted in Figure 7. It can be seen from the figure that the distribution of most numerical variables exhibited different degrees of skewness (the diagonal part of the figure), and there was a significant nonlinear relationship between the independent variable and dependent variable (the upper right and the lower left corner). Meanwhile, the linear relationship between these parameters indicated the risk of multi-collinearity (lower right).
For example, the O3 concentrations, evaporation capacity, and extreme wind speed exhibited an apparent exponential relationship with PM2.5, while the PM10 and PM2.5 concentrations of Langfang presented potential logarithm relevance.
For categorical variables, there was a linear correlation between the variables and the target values. Most of the variables exhibited typical periodic variation and fluctuation characteristics, as shown in Figure 8. Figure 8a refers to the violin plot of PM2.5 monthly concentration. It can be seen that the change in PM2.5 concentration showed typical seasonal fluctuations and that the PM2.5 concentration was smaller in the summer and autumn from June to September. The rest of the months fluctuated greatly and the lowest PM2.5 concentration appeared around August. This is consistent with the conclusions of previous studies. Guo et al. found the lowest and highest monthly mean PM2.5 concentrations appeared in August and January, respectively [35]. We encoded the wind direction from 1 to 16 clockwise and 1 represents a north wind direction. Figure 8b refers to the scatter plot of wind direction of extreme wind speed and PM2.5 concentration. It shows that the PM2.5 concentration exhibited periodic rhythm with the change of extreme wind speed direction and the highest concentration of pollutants occurred when the extreme wind speed direction was northeast and southwest (wind direction code is 3 and 11). When the wind direction was west and northwest (wind direction codes 13 and 15), air quality conditions were generally good. Figure 8c,d further reveal this phenomenon through wind rose for wind direction of maximal and extreme wind speed against PM2.5 concentrations. The radius refers to the frequency of specific wind direction and the intensity refers to the value of PM2.5 concentrations. The prevailing wind direction of Beijing’s maximum wind speed and daily maximum wind speed is northeast-southwest, where the daily maximum wind speed is slightly east. When the wind direction is weak southwest wind, the probability of air pollution is greater, and when the wind direction is north, the air quality is generally better. This phenomenon may be related to the topographical features of the three sides mountains of Beijing and the distribution of southern industrial areas [36,37].
Combined with the analysis of the correlation between surrounding pollutants, meteorological factors, and PM2.5 in Beijing, it can further explain the reason why the air quality in southern Beijing is generally better than that in the north. The surrounding pollutants have a strong influence on Beijing’s air quality and Beijing’s prevailing winds are mostly southerly, so the areas in the south of Beijing have a greater impact and Langfang is closer than Baoding in geographical distance. Therefore, in the correlation analysis, the pollutants in Langfang have a greater impact on Beijing than Baoding.

5. Conclusions

Today, air pollution has become one of the most serious environmental problems in the world. Fine particulate matters (PM2.5) are harmful to ambient air quality, economic development and human health. Considering Beijing and six surrounding cities as main research areas, this study took the daily average pollutant concentrations and meteorological elements from 2 December 2013 to 13 October 2017 into account and studied the spatial and temporal distribution characteristics, the primary influencing factors, and the forecasting method of PM2.5 concentrations in Beijing in order to provide guidance for coping with extreme meteorological disasters and to provide references for improving municipal crisis response and emergency planning.
In this paper, the inter-annual, seasonal and diurnal variation trends, and temporal spatial distribution characteristics of PM2.5 concentration in Beijing were studied by correlation analysis and geo-statistics. The main conclusions are as follows:
(1) The pollutant concentrations in Beijing exhibit obvious seasonal and cyclical fluctuation patterns. Air pollution is more serious in winter and spring and slightly better in summer and autumn, with the spatial distribution of pollutants fluctuating dramatically in different seasons. The pollution in southern Beijing areas are more grievous and the air quality in northern areas are better in general. The diurnal variation of air quality shows a typical seasonal difference and the daily variation of PM2.5 concentrations by and large presented a “W” type of mode with twin peaks. Except for the emissions and accumulation of local pollutants, air quality is susceptible to the transport effect from southwest.
(2) A feature importance analysis reveals that PM10 and PM2.5 concentrations measured from the city of Langfang should be taken as the most important elements of surrounding pollution factors to PM2.5 in Beijing. These concentrations of PM10 and CO are the most significant local factors to PM2.5 in Beijing. Extreme wind speeds and maximal wind speeds are considered to extend most effects of meteorological factors to the cross-regional transportation of contaminants. Pollutants found in the cities of Langfang have a stronger impact on air quality in Beijing than other surrounding factors. Each element affects the air quality of the study areas in a different way.
This study elaborated the spatial and temporal distribution characteristics of PM2.5 concentrations in Beijing and the influencing modes of various factors on PM2.5 concentrations in Beijing. It helps to thoroughly recognize and understand the formation mechanisms of serious haze events.

Author Contributions

B.Z. and J.C. conceived the key ideas and the system architecture; B.Z. conducted the research; W.Y. and Z.H. analyzed the data; B.Z. and J.C. wrote the paper; and W.Y. reviewed the process.

Funding

This research was funded by National Science Foundation of China grant number 71790613.

Acknowledgments

This research was supported through the National Science Foundation of China under Grant No. 71790613 and by the Beijing Key Laboratory of City Integrated Emergency Response Science.

Conflicts of Interest

The authors declare no conflict of interest.

References

  1. Apte, J.S.; Marshall, J.D.; Cohen, A.J.; Brauer, M. Addressing global mortality from ambient PM2.5. Environ. Sci. Technol. 2015, 49, 8057–8066. [Google Scholar] [CrossRef] [PubMed]
  2. Kim, K.H.; Kabir, K.; Kabir, S. A review on the human health impact of airborne particulate matter. Environ. Int. 2015, 74, 136–143. [Google Scholar] [CrossRef] [PubMed]
  3. Kim, K.H.; Jahan, S.A.; Kabir, E. A review on human health perspective of air pollution with respect to allergies and asthma. Environ. Int. 2013, 59, 41–52. [Google Scholar] [CrossRef] [PubMed]
  4. Lelieveld, J.; Evans, J.S.; Fnais, M.; Giannadaki, D.; Pozzer, A. The contribution of outdoor air pollution sources to premature mortality on a global scale. Nature 2015, 525, 367–371. [Google Scholar] [CrossRef] [PubMed]
  5. Maji, K.J.; Dikshit, A.K.; Arora, M.; Deshpande, A. Estimating premature mortality attributable to PM2.5 exposure and benefit of air pollution control policies in China for 2020. Sci. Total Environ. 2017, 612, 683–693. [Google Scholar] [CrossRef] [PubMed]
  6. West, J.J.; Cohen, A.; Dentener, F.; Brunekreef, B.; Zhu, T.; Armstrong, B.; Bell, M.L.; Brauer, M.; Carmichael, G.; Costa, D.L.; et al. What we breathe impacts our health: Improving understanding of the link between air pollution and health. Environ. Sci. Technol. 2016, 50, 4895–4904. [Google Scholar] [CrossRef] [PubMed]
  7. Liu, X.; Zhang, Y.; Cheng, Y.; Hu, M.; Han, T. Aerosol hygroscopicity and its impact on atmospheric visibility and radiative forcing in Guangzhou during the 2006 PRIDE-PRD campaign. Atmos. Environ. 2012, 60, 59–67. [Google Scholar] [CrossRef]
  8. Zhang, Q.; Quan, J.; Tie, X.; Li, X.; Liu, Q.; Gao, Y.; Zhao, D. Effects of meteorology and secondary particle formation on visibility during heavy haze events in Beijing, China. Sci. Total Environ. 2015, 502, 578–584. [Google Scholar] [CrossRef] [PubMed]
  9. Mu, Q.; Zhang, S.Q. An evaluation of the economic loss due to the heavy haze during January 2013 in China. China Environ. Sci. 2013, 33, 2087–2094. [Google Scholar]
  10. Wang, L.T.; Wei, Z.; Yang, J.; Zhang, Y.; Zhang, F.F.; Su, J.; Meng, C.C.; Zhang, Q. The 2013 severe haze over southern Hebei, China: Model evaluation, source apportionment, and policy implications. Atmos. Chem. Phys. 2014, 14, 3151–3173. [Google Scholar] [CrossRef] [Green Version]
  11. Cai, S.; Wang, Y.; Zhao, B.; Wang, S.; Chang, X.; Hao, J. The impact of the “air pollution prevention and control action plan” on PM2.5 concentrations in Jing-Jin-Ji region during 2012–2020. Sci. Total Environ. 2017, 580, 197–209. [Google Scholar] [CrossRef] [PubMed]
  12. Forouzanfar, M.H.; Afshin, A.; Alexander, L.T.; Anderson, H.R.; Bhutta, Z.A.; Biryukov, S.; Brauer, M.; Burnett, R.; Cercy, K.; Charlson, F.J.; et al. Global, regional, and national comparative risk assessment of 79 behavioural, environmental and occupational, and metabolic risks or clusters of risks, 1990–2015: A systematic analysis for the Global Burden of Disease Study 2015. Lancet 2016, 388, 1659–1724. [Google Scholar] [CrossRef]
  13. Xu, W.; Chen, H.; Li, D.; Zhao, F.; Yang, Y. A case study of aerosol characteristics during a haze episode over Beijing. Procedia Environ. Sci. 2013, 18, 404–411. [Google Scholar] [CrossRef]
  14. Zhang, X.; Huang, Y.; Zhu, W.; Rao, R. Aerosol characteristics during summer haze episodes from different source regions over the coast city of North China Plain. J. Quant. Spectrosc. Radiat. Transf. 2013, 122, 180–193. [Google Scholar] [CrossRef]
  15. Jansen, R.C.; Shi, Y.; Chen, J.; Hu, Y.; Xu, C.; Hong, S.; Li, J.; Zhang, M. Using hourly measurements to explore the role of secondary inorganic aerosol in PM2.5 during haze and fog in Hangzhou, China. Adv. Atmos. Sci. 2014, 31, 1427–1434. [Google Scholar] [CrossRef]
  16. Wu, J.; Zhang, P.; Yi, H.; Qin, Z. What Causes Haze Pollution? An Empirical Study of PM2.5 Concentrations in Chinese Cities. Sustainability 2016, 8, 132. [Google Scholar] [CrossRef]
  17. Zhang, Z.; Zhang, X.; Gong, D.; Quan, W.; Zhao, X.; Ma, Z.; Kim, S.J. Evolution of surface O3 and PM2.5 concentrations and their relationships with meteorological conditions over the last decade in Beijing. Atmos. Environ. 2015, 108, 67–75. [Google Scholar] [CrossRef]
  18. Guo, S.; Hu, M.; Zamora, M.L.; Peng, J.; Shang, D.; Zheng, J.; Du, Z.; Wu, Z.; Shao, M.; Zeng, L.; et al. Elucidating severe urban haze formation in China. Proc. Natl. Acad. Sci. USA 2014, 111, 17373–17378. [Google Scholar] [CrossRef] [PubMed] [Green Version]
  19. Li, X.; Chen, X.; Yuan, X.; Zeng, G.; León, T.; Liang, J.; Chen, G.; Yuan, X. Characteristics of Particulate Pollution (PM2.5 and PM10) and Their Spacescale-Dependent Relationships with Meteorological Elements in China. Sustainability 2017, 9, 2330. [Google Scholar] [CrossRef]
  20. Lv, B.; Cai, J.; Xu, B.; Bai, Y. Understanding the rising phase of the PM2.5 concentration evolution in Large China cities. Sci. Rep. 2017, 7, 46456. [Google Scholar] [CrossRef] [PubMed]
  21. Zheng, G.J.; Duan, F.K.; Su, H.; Ma, Y.L.; Cheng, Y.; Zheng, B.; Zhang, Q.; Huang, T.; Kimoto, T.; Chang, D.; et al. Exploring the severe winter haze in Beijing: The impact of synoptic weather, regional transport and heterogeneous reactions. Atmos. Chem. Phys. 2015, 15, 2969–2983. [Google Scholar] [CrossRef]
  22. Chen, D.; Liu, X.; Lang, J.; Zhou, Y.; Wei, L.; Wang, X.; Guo, X. Estimating the contribution of regional transport to PM2.5 air pollution in a rural area on the North China Plain. Sci. Total Environ. 2017, 583, 280–291. [Google Scholar] [CrossRef] [PubMed]
  23. Gao, J.; Wang, K.; Wang, Y.; Liu, S.; Zhu, C.; Hao, J.; Liu, H.; Hua, S.; Tian, H. Temporal-spatial characteristics and source apportionment of PM2.5 as well as its associated chemical species in the Beijing-Tianjin-Hebei region of China. Environ. Pollut. 2018, 233, 714–724. [Google Scholar] [CrossRef] [PubMed]
  24. Li, P.; Yan, R.; Yu, S.; Wang, S.; Liu, W.; Bao, H. Reinstate regional transport of PM2.5 as a major cause of severe haze in Beijing. Proc. Natl. Acad. Sci. USA 2015, 112, E2739–E2740. [Google Scholar] [CrossRef] [PubMed]
  25. Wang, H.; Xu, J.; Zhang, M.; Yang, Y.; Shen, X.; Wang, Y.; Chen, D.; Guo, J. A study of the meteorological causes of a prolonged and severe haze episode in January 2013 over central-eastern China. Atmos. Environ. 2014, 98, 146–157. [Google Scholar] [CrossRef]
  26. Wang, Y.; Zhang, Y.; Schauer, J.J.; de Foy, B.; Guo, B.; Zhang, Y. Relative impact of emissions controls and meteorology on air pollution mitigation associated with the Asia-Pacific Economic Cooperation (APEC) conference in Beijing, China. Sci. Total Environ. 2016, 571, 1467–1476. [Google Scholar] [CrossRef] [PubMed]
  27. Wang, F.; Chen, D.S.; Cheng, S.Y.; Li, J.B.; Li, M.J.; Ren, Z.H. Identification of regional atmospheric PM10 transport pathways using HYSPLIT, MM5-CMAQ and synoptic pressure pattern analysis. Environ. Model. Softw. 2010, 25, 927–934. [Google Scholar] [CrossRef]
  28. Ma, Q.; Wu, Y.; Zhang, D.; Wang, X.; Xia, Y.; Liu, X.; Tian, P.; Han, Z.; Xia, X.; Wang, Y.; et al. Roles of regional transport and heterogeneous reactions in the PM2.5 increase during winter haze episodes in Beijing. Sci. Total Environ. 2017, 599, 246–253. [Google Scholar] [CrossRef] [PubMed]
  29. Hoek, G.; Beelen, R.; De Hoogh, K.; Vienneau, D.; Gulliver, J.; Fischer, P.; Briggs, D. A review of land-use regression models to assess spatial variation of outdoor air pollution. Atmos. Environ. 2008, 42, 7561–7578. [Google Scholar] [CrossRef]
  30. Oliver, M.A.; Webster, R. Kriging: A method of interpolation for geographical information systems. Int. J. Geogr. Inf. Syst. 1990, 4, 313–332. [Google Scholar] [CrossRef]
  31. Hu, J.; Wang, Y.; Ying, Q.; Zhang, H. Spatial and temporal variability of PM2.5 and PM10 over the North China Plain and the Yangtze River Delta, China. Atmos. Environ. 2014, 95, 598–609. [Google Scholar] [CrossRef]
  32. Liu, Z.; Hu, B.; Wang, L.; Wu, F.; Gao, W.; Wang, Y. Seasonal and diurnal variation in particulate matter (PM10 and PM2.5) at an urban site of Beijing: Analyses from a 9-year study. Environ. Sci. Pollut. Res. 2015, 22, 627–642. [Google Scholar] [CrossRef] [PubMed]
  33. Ricciardelli, I.; Bacco, D.; Rinaldi, M. A three-year investigation of daily PM2.5 main chemical components in four sites: The routine measurement program of the Supersito Project (Po Valley, Italy). Atmos. Environ. 2017, 152, 418–430. [Google Scholar] [CrossRef]
  34. Li, R.; Li, Z.; Gao, W.; Ding, W.; Xu, Q.; Song, X. Diurnal, seasonal, and spatial variation of PM2.5 in Beijing. Sci. Bull. 2015, 60, 387–395. [Google Scholar] [CrossRef]
  35. Guo, H.; Cheng, T.; Gu, X.; Wang, Y.; Chen, H.; Bao, F.; Shi, S.; Xu, B.; Wang, W.; Zuo, X.; et al. Assessment of PM2.5 concentrations and exposure throughout China using ground observations. Sci. Total Environ. 2017, 601, 1024–1030. [Google Scholar] [CrossRef] [PubMed]
  36. Shen, R.; Schaefer, K.; Schnelle-Kreis, J.; Shao, L.; Norra, S.; Kramar, U.; Michalke, B.; Abbaszade, G.; Streibel, T.; Fricker, M.; et al. Characteristics and sources of PM in seasonal perspective—A case study from one year continuously sampling in Beijing. Atmos. Pollut. Res. 2016, 7, 235–248. [Google Scholar] [CrossRef]
  37. Yang, F.; Tan, J.; Zhao, Q.; Du, Z.; He, K.; Ma, Y.; Duan, F.; Chen, G. Characteristics of PM2.5 speciation in representative megacities and across China. Atmos. Chem. Phys. 2011, 11, 5207–5219. [Google Scholar] [CrossRef]
Figure 1. The physical geography of the study areas with colors denoting altitudes above sea level.
Sustainability 10 03228 g001
Figure 2. The fluctuation of the PM2.5 concentrations in Beijing during the study period.
Sustainability 10 03228 g002
Figure 3. Temporal and spatial distribution of seasonal variation of PM2.5 concentrations in Beijing in 2017.
Sustainability 10 03228 g003
Figure 4. Diurnal variation of PM2.5 concentrations in different seasons in Beijing.
Sustainability 10 03228 g004
Figure 5. The temporal and spatial variation of the PM2.5 concentrations in Beijing on 25 December 2015.
Sustainability 10 03228 g005
Figure 6. PM2.5 concentration linear correlation matrix.
Sustainability 10 03228 g006
Figure 7. Typical nonlinear relationship between features and PM2.5.
Sustainability 10 03228 g007
Figure 8. The relationship between categorical variables and PM2.5. (a: violin plot of PM2.5 monthly concentration; b: scatter plot of wind direction of extreme wind speed and PM2.5 concentration; c: wind rose for wind direction of maximal wind speed against PM2.5 concentrations; d: wind rose for wind direction of extreme wind speed against PM2.5 concentrations).
Sustainability 10 03228 g008
Table 1. Description of raw data parameters.
ParameterType *UnitDescription
Pollutant factorsPM2.5-BJNμg/m3Daily averaged concentration of PM2.5 in Beijing
PM10-BJNμg/m3Daily averaged concentration of PM10 in Beijing
SO2-BJNμg/m3Daily averaged concentration of SO2 in Beijing
CO-BJNmg/m3Daily averaged concentration of CO in Beijing
NO2-BJNμg/m3Daily averaged concentration of NO2 in Beijing
O3-BJNμg/m3Daily averaged concentration of O3 in Beijing
AQI-BJN-Daily air quality index of Beijing
Class-BJC1–5Daily grade of air quality in Beijing
Meteorological factorsEVPN0.1 mmDaily evaporation capacity of Beijing
GST-meanN0.1 °CDaily averaged ground surface temperature
GST-maxN0.1 °CDaily maximal ground surface temperature
GST-minN0.1 °CDaily minimal ground surface temperature
PRE-208N0.1 mmPrecipitation from 20:00 p.m. to 8:00 a.m.
PRE-820N0.1 mmPrecipitation from 8:00 a.m. to 20:00 p.m.
PRE-2020N0.1 mmPrecipitation from 20:00 p.m. to 20:00 p.m.
PRS-meanN0.1 hPaDaily averaged barometric pressure
PRS-maxN0.1 hPaDaily maximal barometric pressure
PRS-minN0.1 hPaDaily minimal barometric pressure
RHU-meanN1%Daily averaged relative humidity
RHU-minN1%Daily minimal relative humidity
SSDN0.1 hDaily duration of sunshine
TEM-meanN0.1 °CDaily averaged air temperature
TEM-maxN0.1 °CDaily maximal air temperature
TEM-minN0.1 °CDaily minimal air temperature
WIN-meanN0.1 m/sDaily averaged wind speed
WIN-maxN0.1 m/sDaily maximal wind speed
WD-maxC1–16Wind direction of maximal wind speed in category
WIN-extN0.1 m/sExtreme wind speed
WD-extC1–16Wind direction of extreme wind speed in category
* The C in column Type indicates category variables, while the N indicates numerical ones.
Table 2. The statistical description for main indicators.
PM2.5-bjPM10-bjNO2-bjCO-bjSO2-bjO3-bj
Unitμg/m3μg/m3μg/m3mg/m3μg/m3μg/m3
Mean77.40104.9050.411.2314.5297.93
Standard Deviation68.4380.8624.381.0117.0164.70
25%2948330.60450
50%5888440.90885
75%103135611.4018138
Range(5, 477)(0, 820)(8, 155)(0.2, 8.0)(2, 133)(2, 294)

