2.2.1. Data Source
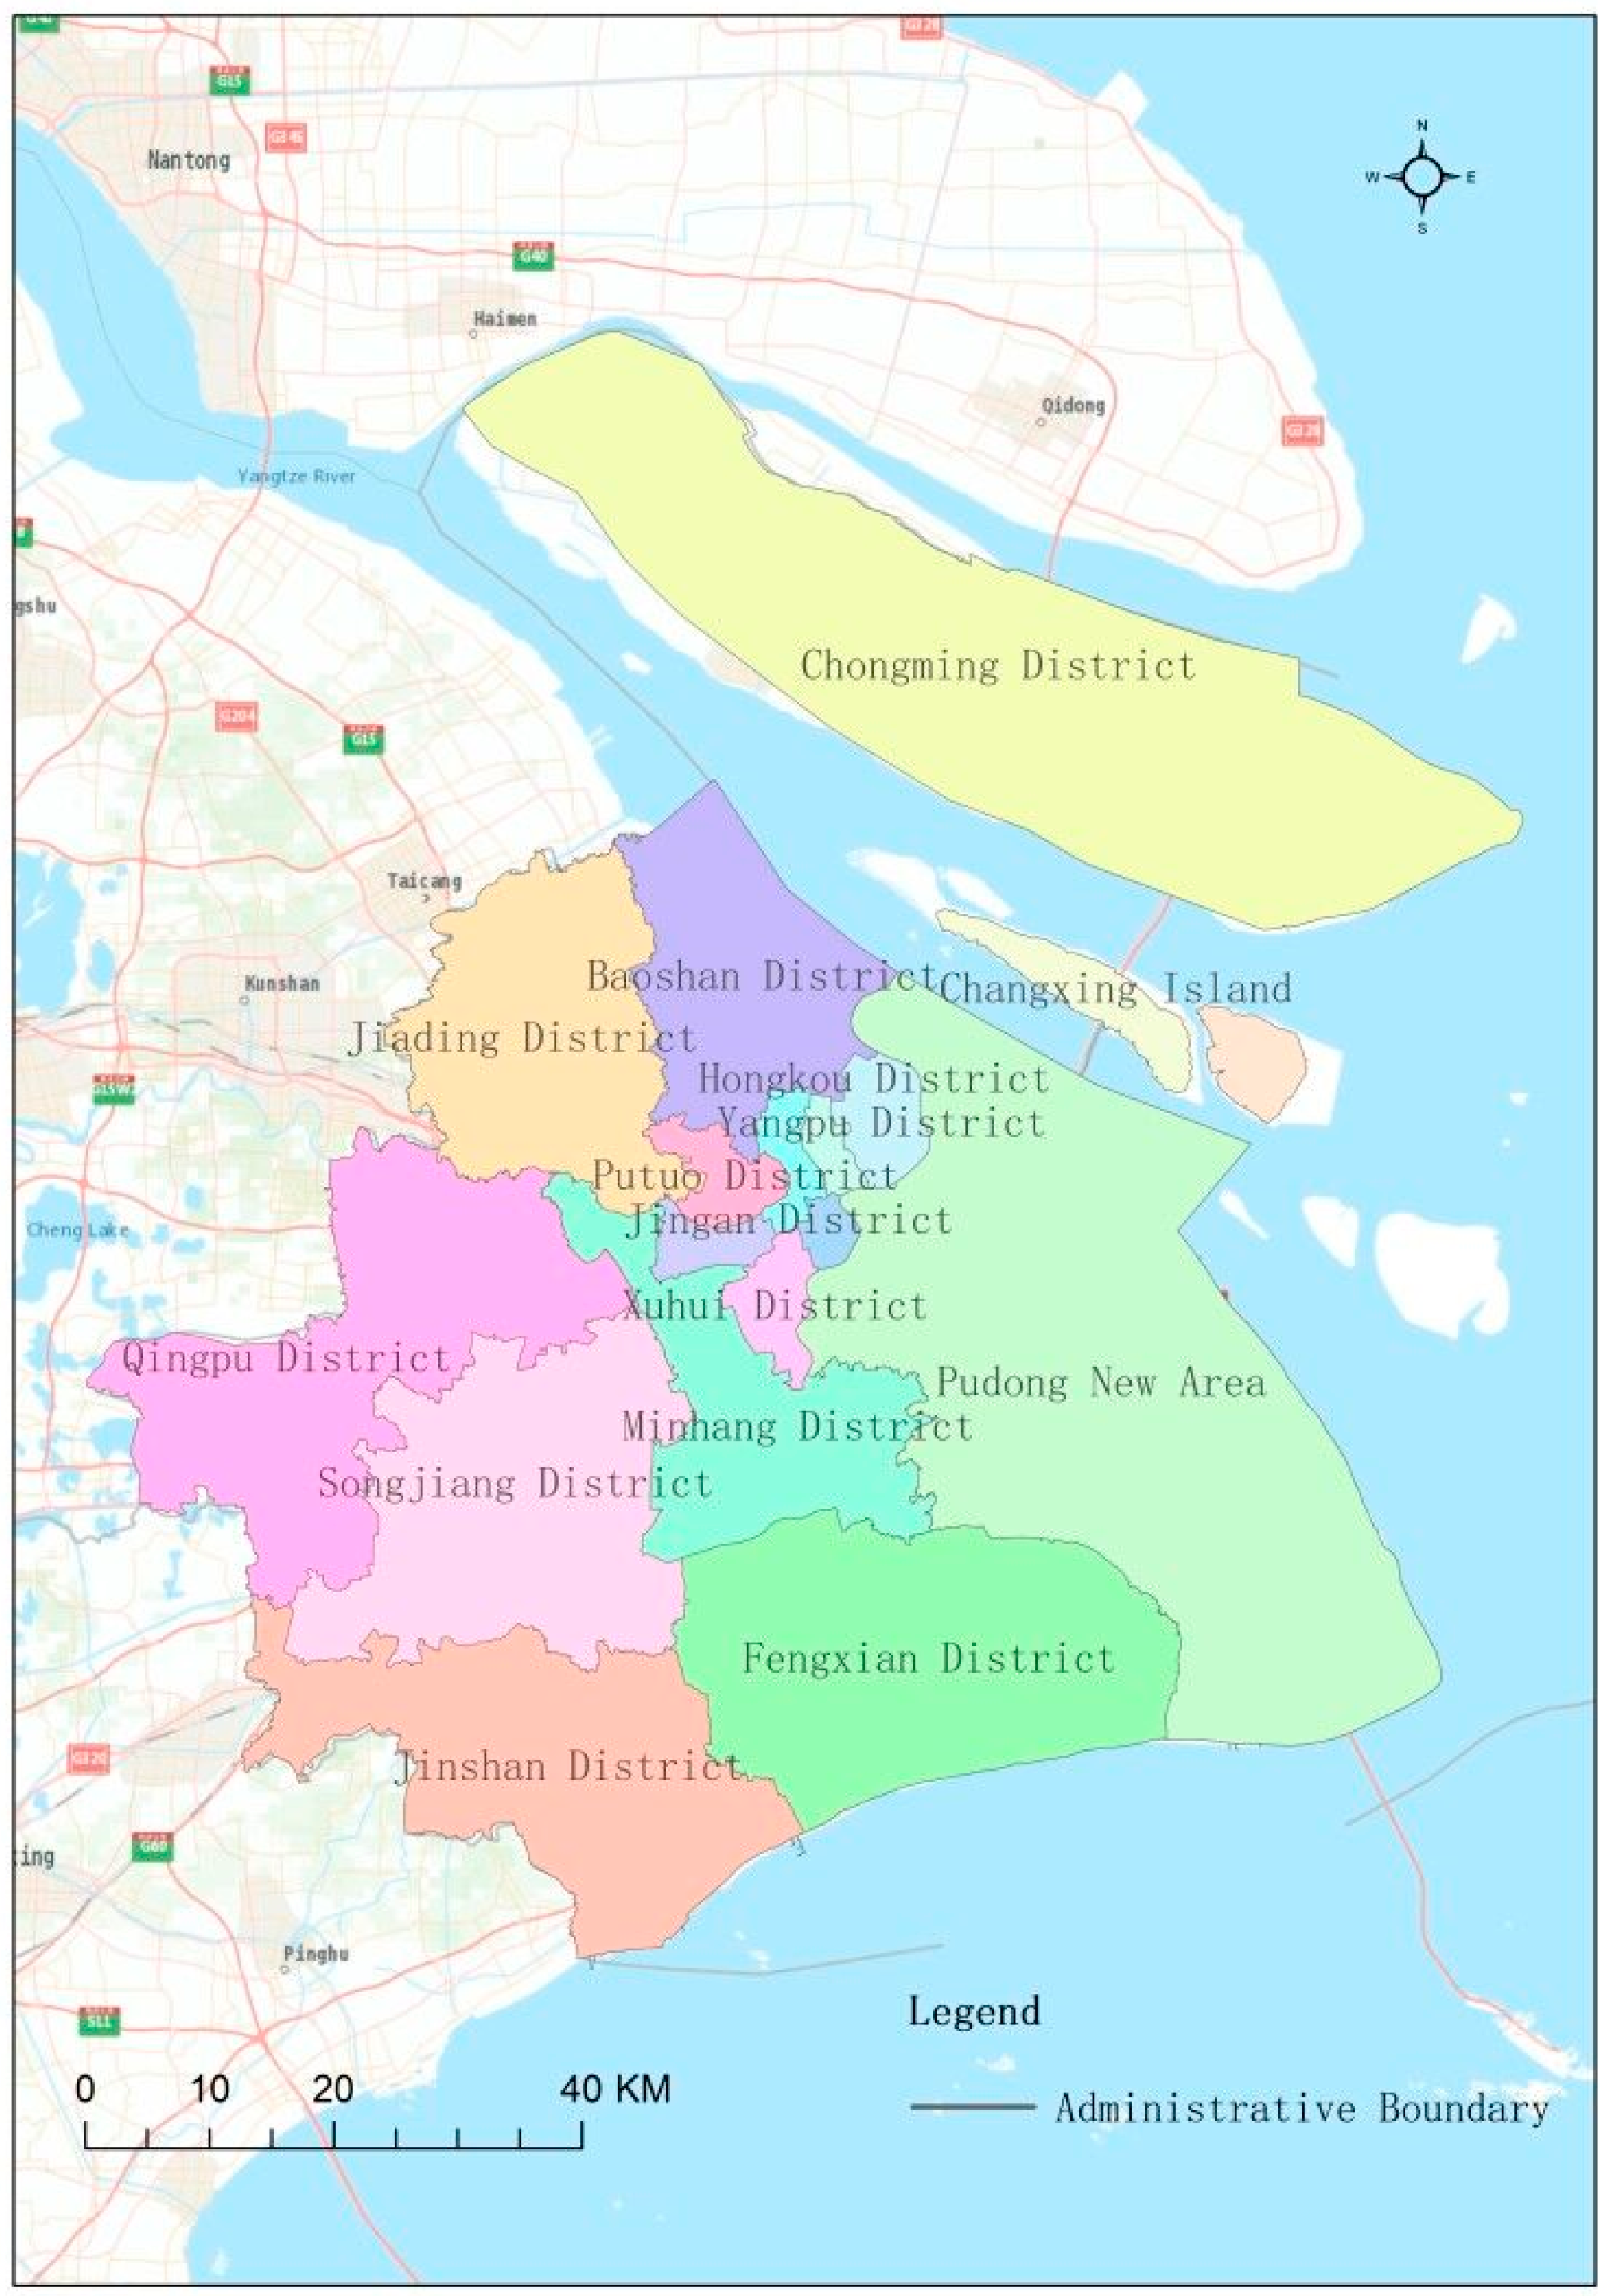
The Shanghai land subsidence data and groundwater exploitation data used in this study are provided by the Shanghai Environmental Geological Bulletin. The land subsidence raster data with a resolution of 30 m × 30 m is obtained by interpolating the Shanghai land subsidence contour maps. The permanent residents, GDP (Gross Domestic Product), and number and area of high-rise buildings are provided by the Shanghai Statistical Yearbook. Sea-level data is collected based on historical tidal level data from the Shanghai tide gauge station shared by the Permanent Service for Mean Sea Level (
http://www.psmsl.org/). The civil vehicles data is from the Qianzhan Database (
https://d.qianzhan.com/xdata/details/a004230075771a68.html).
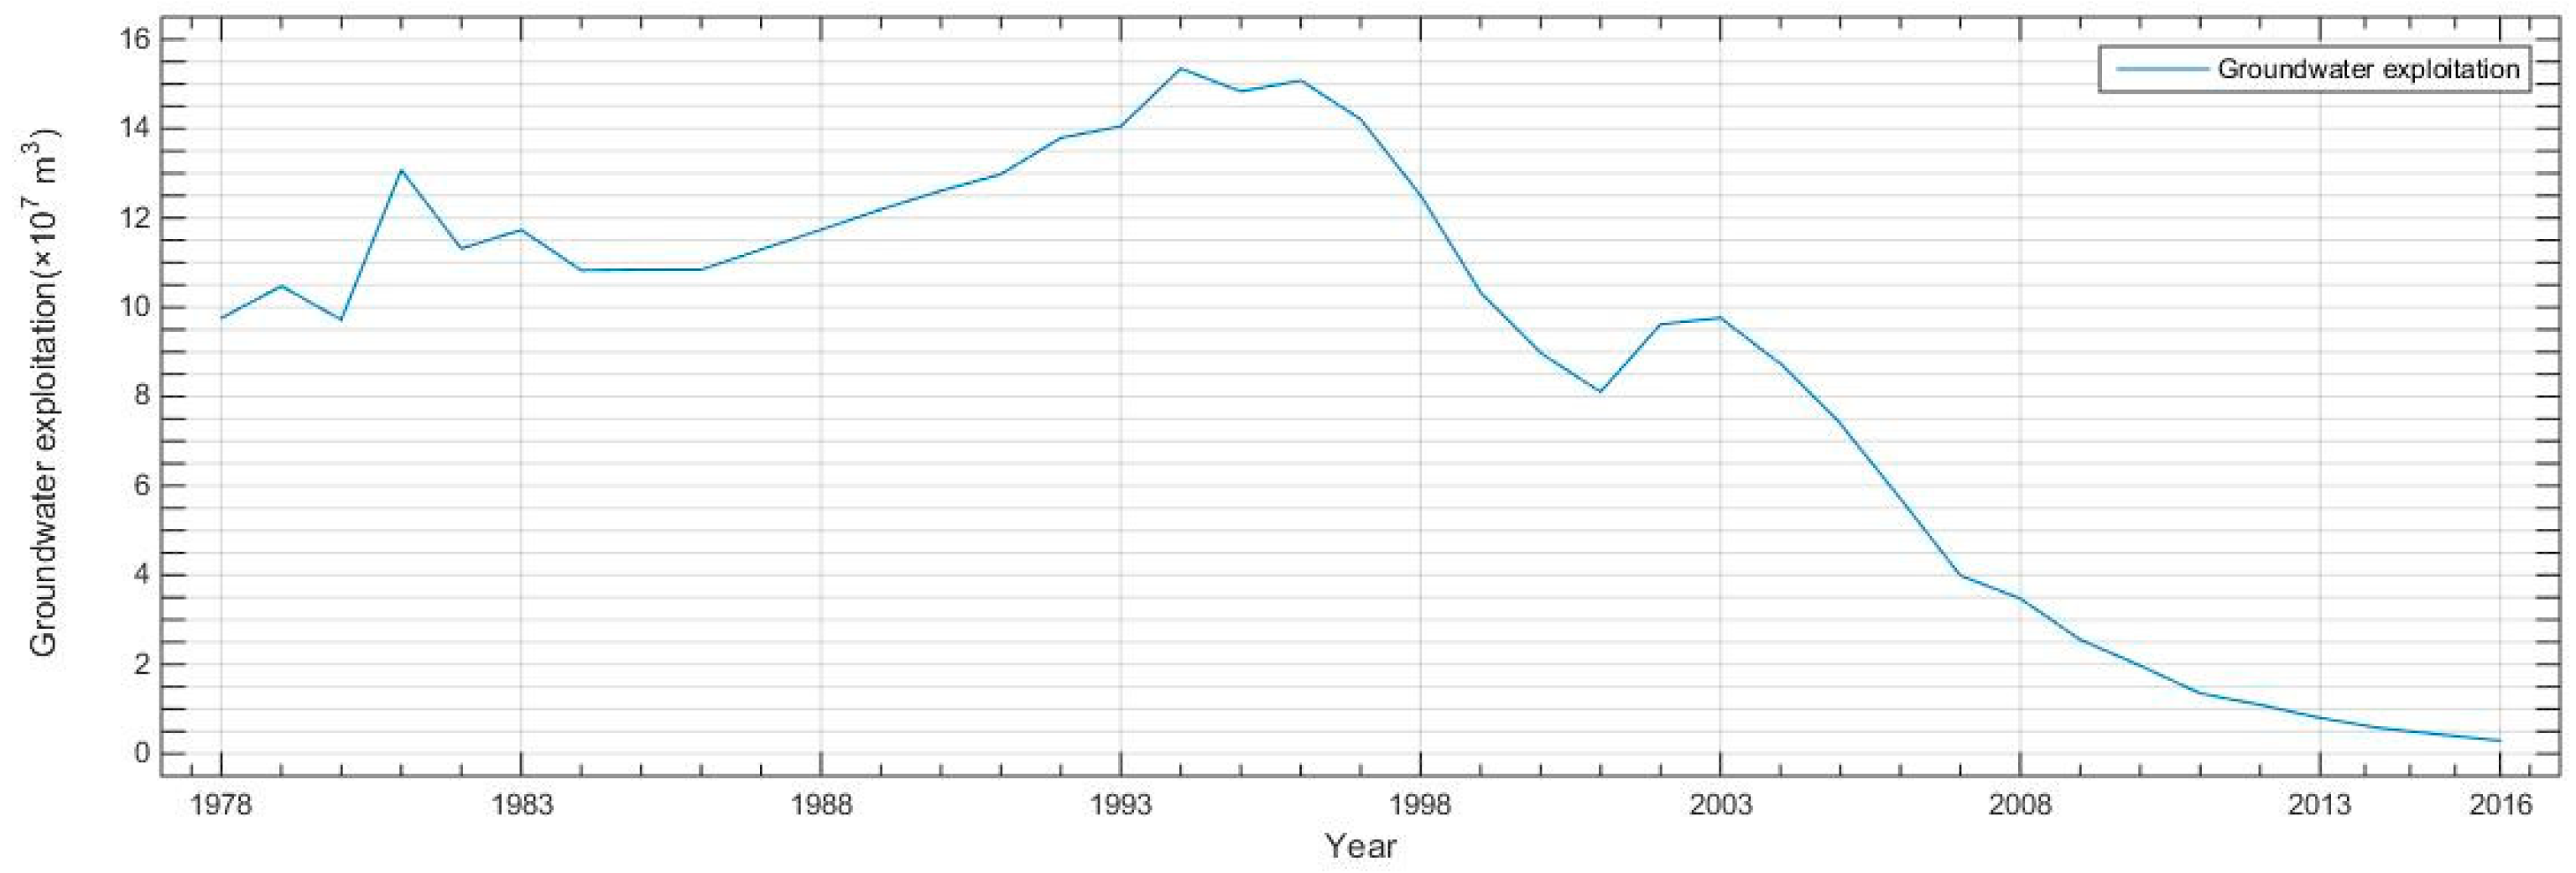
(1) Groundwater exploitation
The first deep well was drilled in Shanghai in 1960, which was when the city began to systematically extract groundwater to provide water for human activities. In addition, rapid industrial development in the 1980s led to a rapid increase in groundwater exploitation, though it has been controlled since 1965. Subsequently, Shanghai recharged underground aquifers with tap water to raise the groundwater level and restore soil elasticity. Overall, after economic reform and open up of China, the exploitation of groundwater in Shanghai increased year by year in the 1980s, increased first and then decreased in the 1990s, and then rapidly decreased after 2000 (
Figure 2).
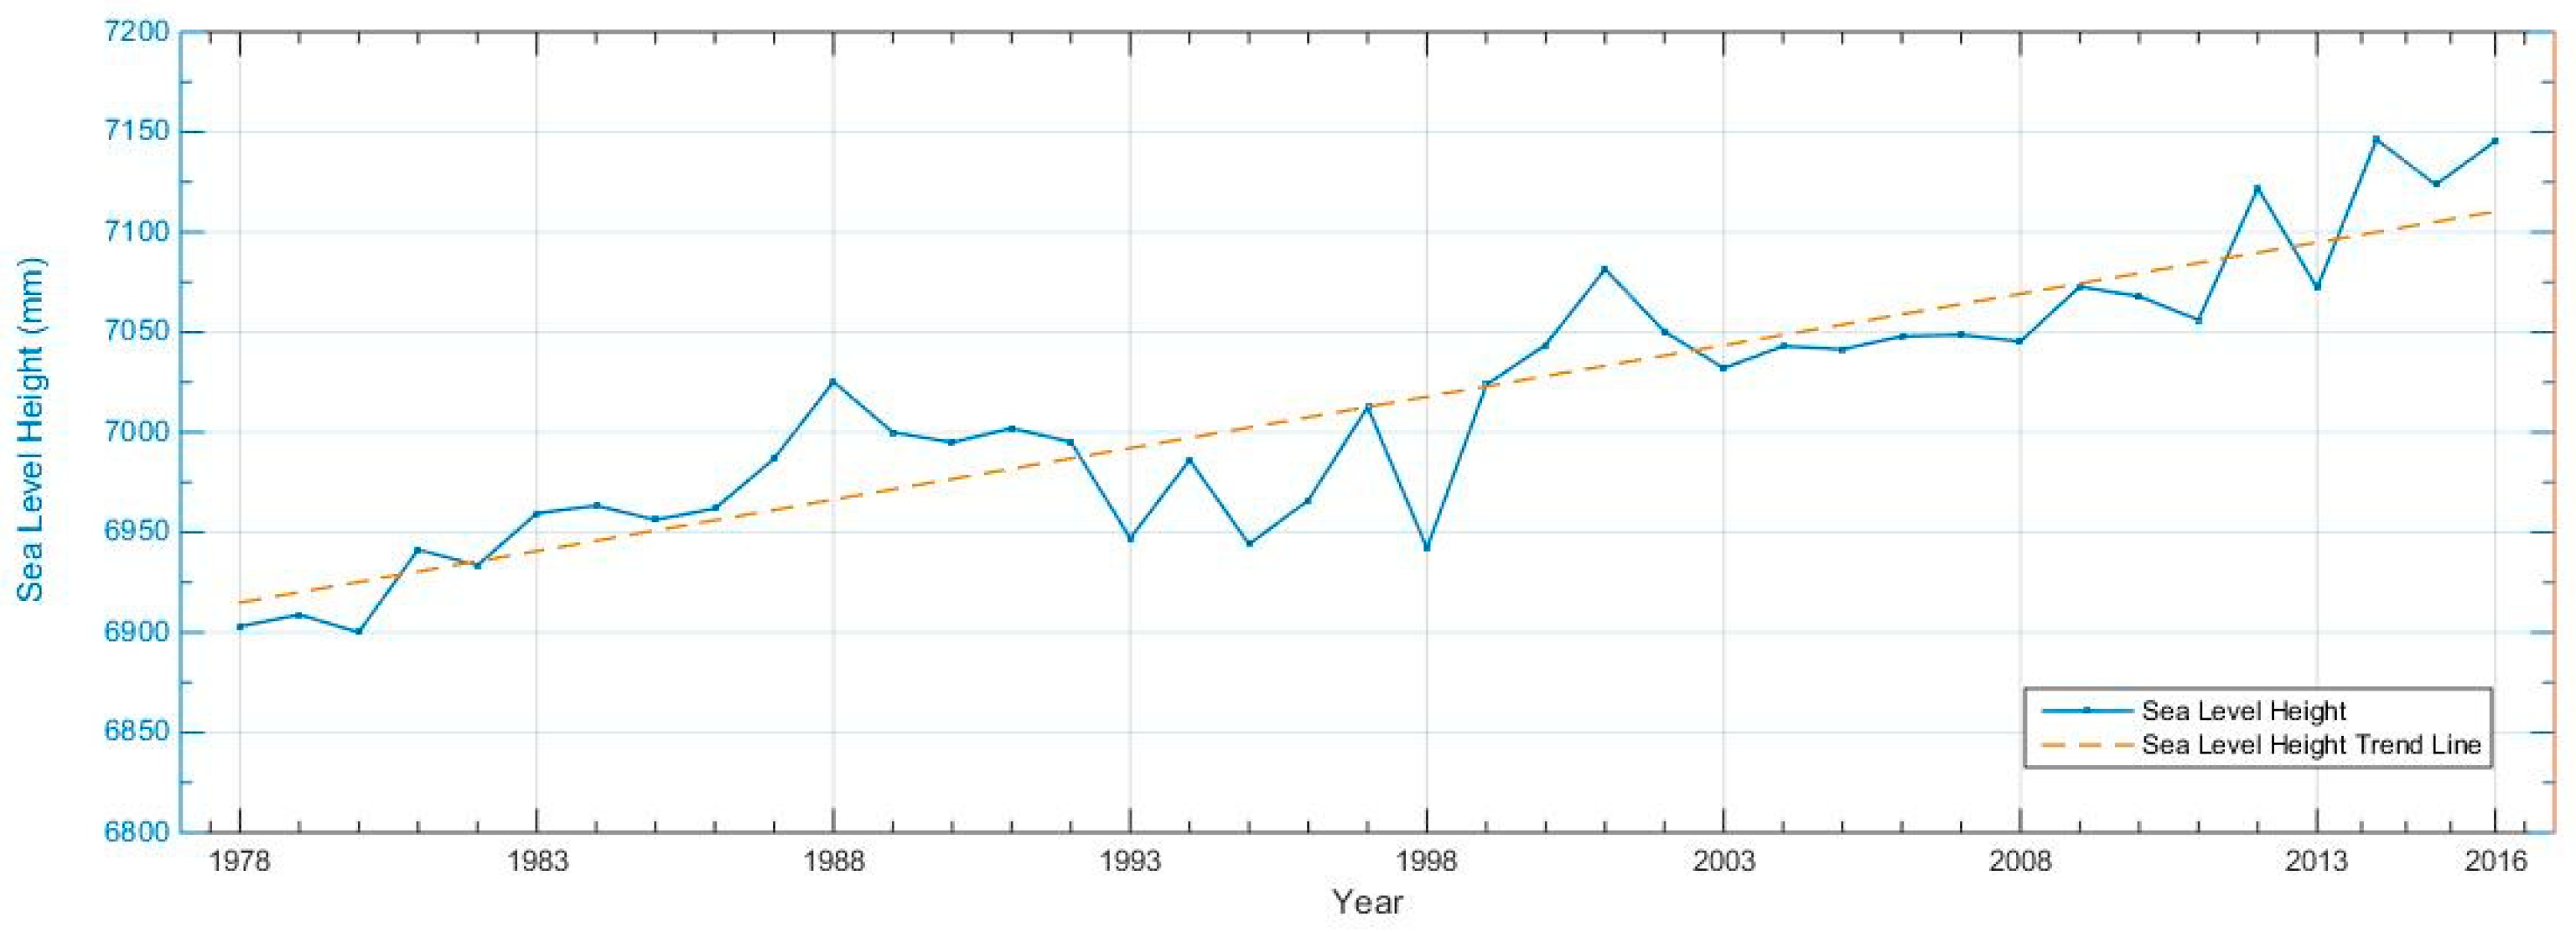
(2) Sea-level rise
Monitoring data shows that the global sea level has risen by 10–20 centimetres over the past 100 years, and it will rise faster in the future [
40]. Obviously, irreversible sea-level rise and serious land subsidence will severely threaten urban development on account of the average ground elevation, which is only slightly higher than sea level in Shanghai [
41,
42]. According to
Figure 3, sea level has been rising with fluctuations since 1978. Sea level rose 96.92 mm from 1978 to 1989, 48.75 mm from 1990 to 2000, and 89.17 mm from 2011 to 2016. Furthermore, sea level was generally stable from 2001 to 2010.
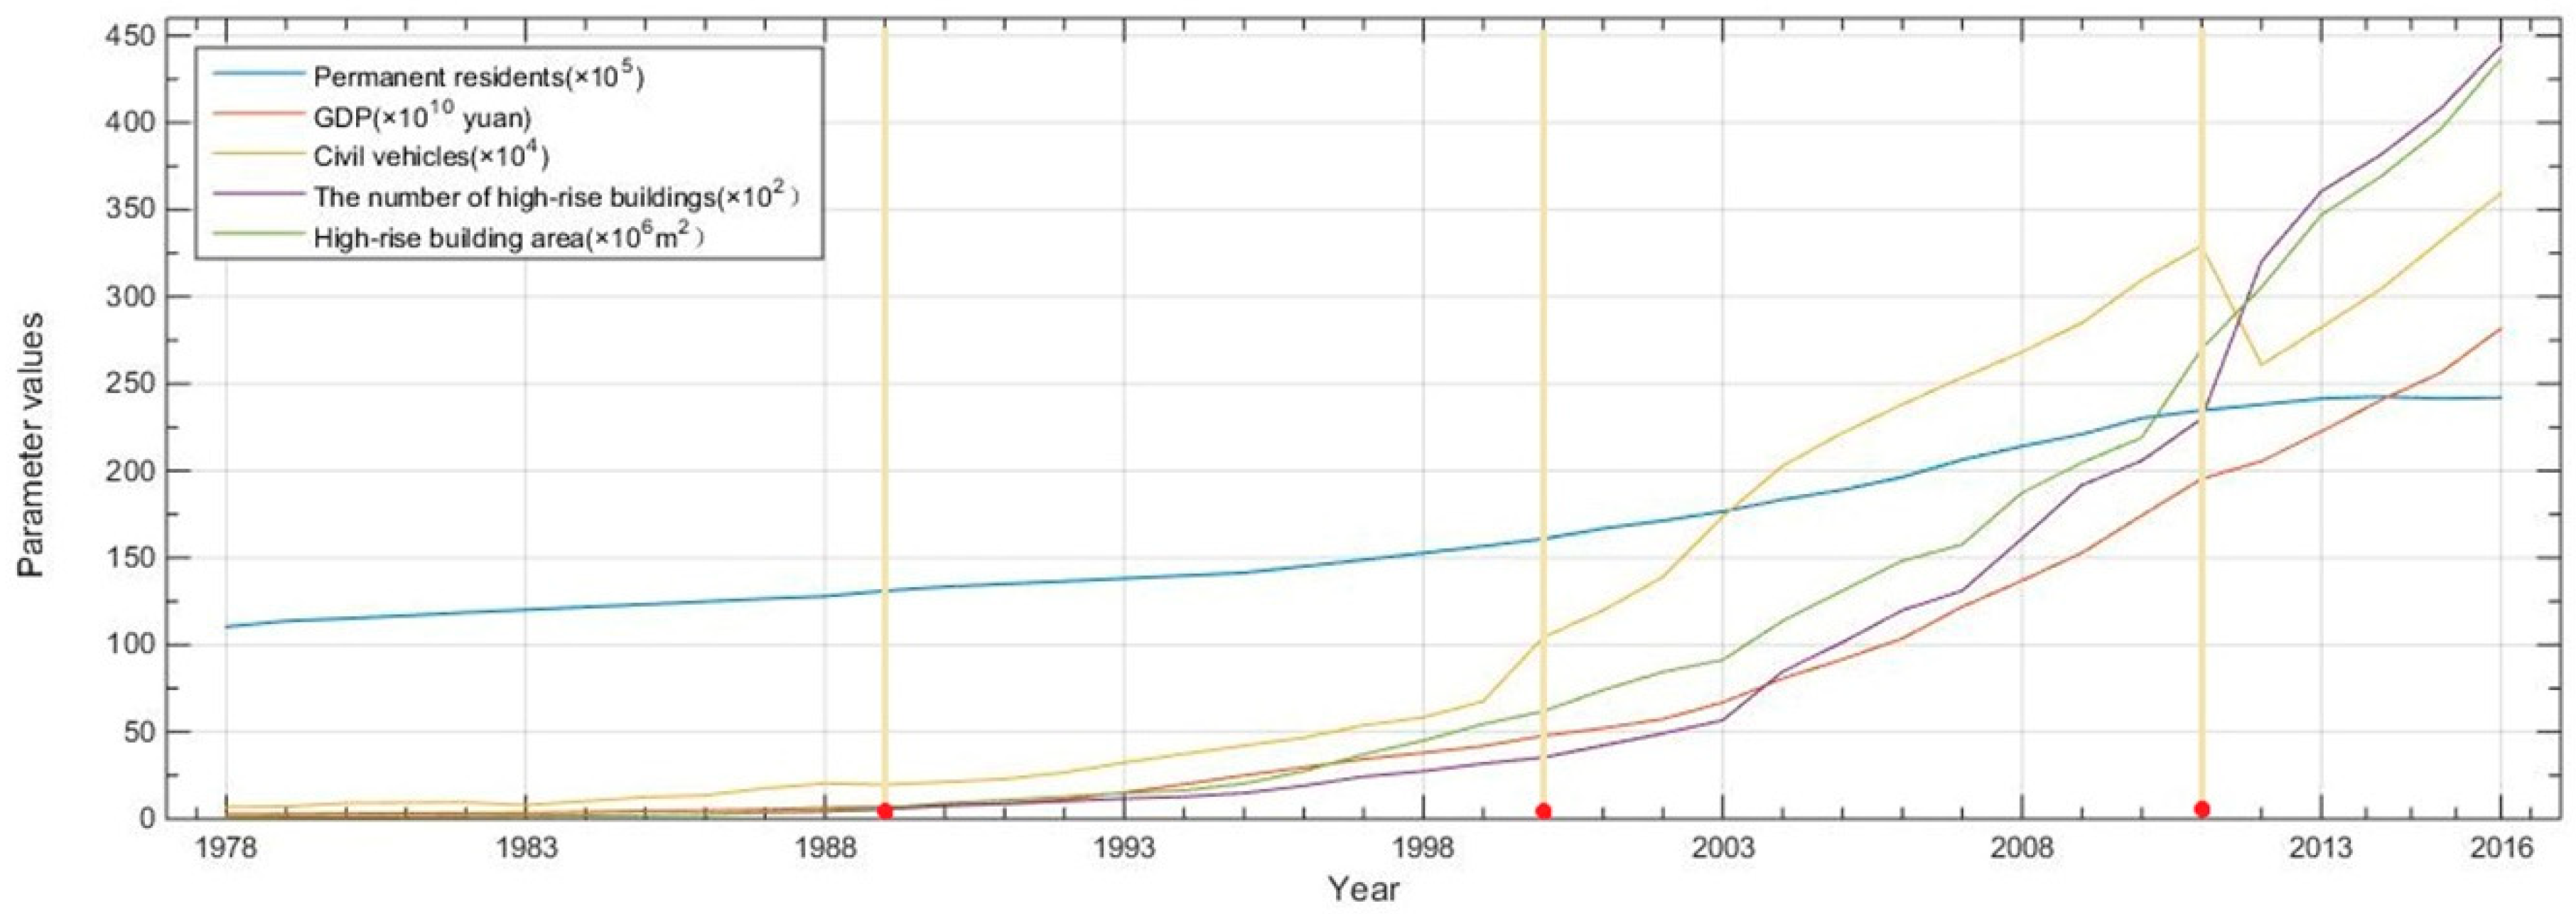
(3) Permanent resident growth
The number of permanent residents in Shanghai increased by 2.07 million, with an annual average increase of 186,800 from 1978 to 1989. The permanent residents increased by 2.75 million, reaching an annual average growth of 270,900 from 1990 to 2000 (
Table 2). Moreover, the population has increased sharply since 2000 to 23.03 million at the end of 2010 and 24.20 million in 2016.
(4) GDP growth
According to statistics and calculations (
Table 3), the GDP of 1989 was 2.6 times that of 1978, and by 2000, the GDP increased to 6.1 times that of 1990. Then, GDP growth slowed down. In 2010, the GDP was 3.3 times that of 2001, and in 2016, the GDP was 1.4 times that of 2012.
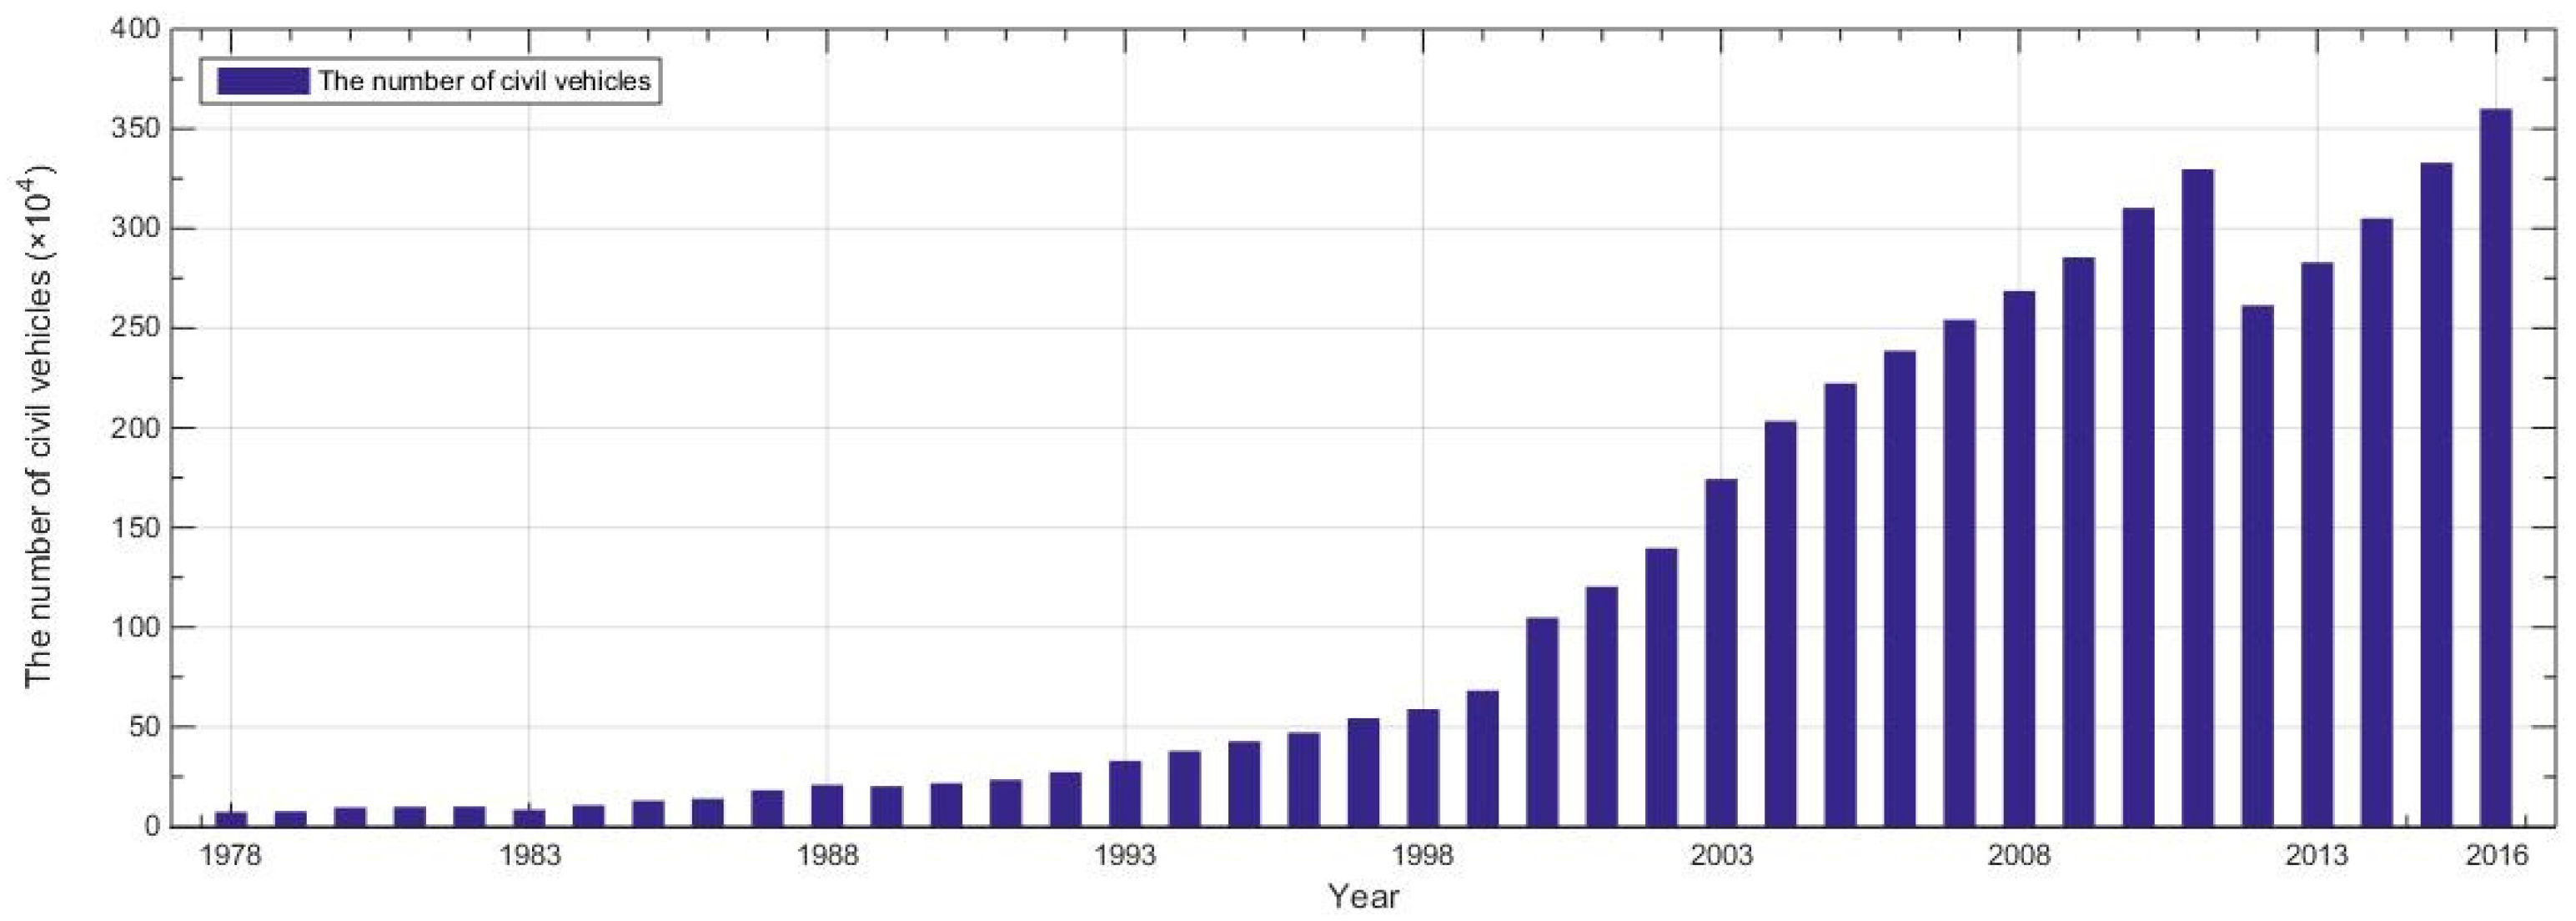
(5) Increase of the civil vehicle number
This study mainly focuses on civil vehicles because there is a large gap between the number of civil vehicles and the number of public transport vehicles in Shanghai. After economic reform and open up, the number of civil vehicles in Shanghai increased exponentially due to the development of the national economy and the improvement of human living standards (
Figure 4).
(6) Increasing number of high-rise buildings
A high-rise building is a tall construction compared to a low-rise building and is defined by its height differently in various jurisdictions. Emporis Standards defines a high-rise building as “A multi-floor structure between 35–100 m tall, or a building of unknown height from 12–39 floors” [
43]. In the U.S., the National Fire Protection Association defines a high-rise building as being higher than 75 feet (23 m) or approximately 7 floors [
44]. Most building engineers, inspectors, architects, and similar professionals define a high-rise building as a building that is at least 75 feet (23 m) tall [
43]. Buildings with 8 floors or more are defined as high-rise buildings in this paper, considering the average floor height is approximately 3 m [
45]. The large number of high-rise buildings in Shanghai has been increasing rapidly since the 21st century according to
Figure 4, worsens the land subsidence.
(7) Expansion of high-rise building area
In the 1980s, the high-rise building area in Shanghai increased by nearly 5.22 km2. In the 1990s, 52.66 km2 was added, and the total number was up to 61.80 km2 at the end of 2000. The area reached 219.11 km2 in 2010 and 436.48 km2 in 2016.
2.2.2. Methodology
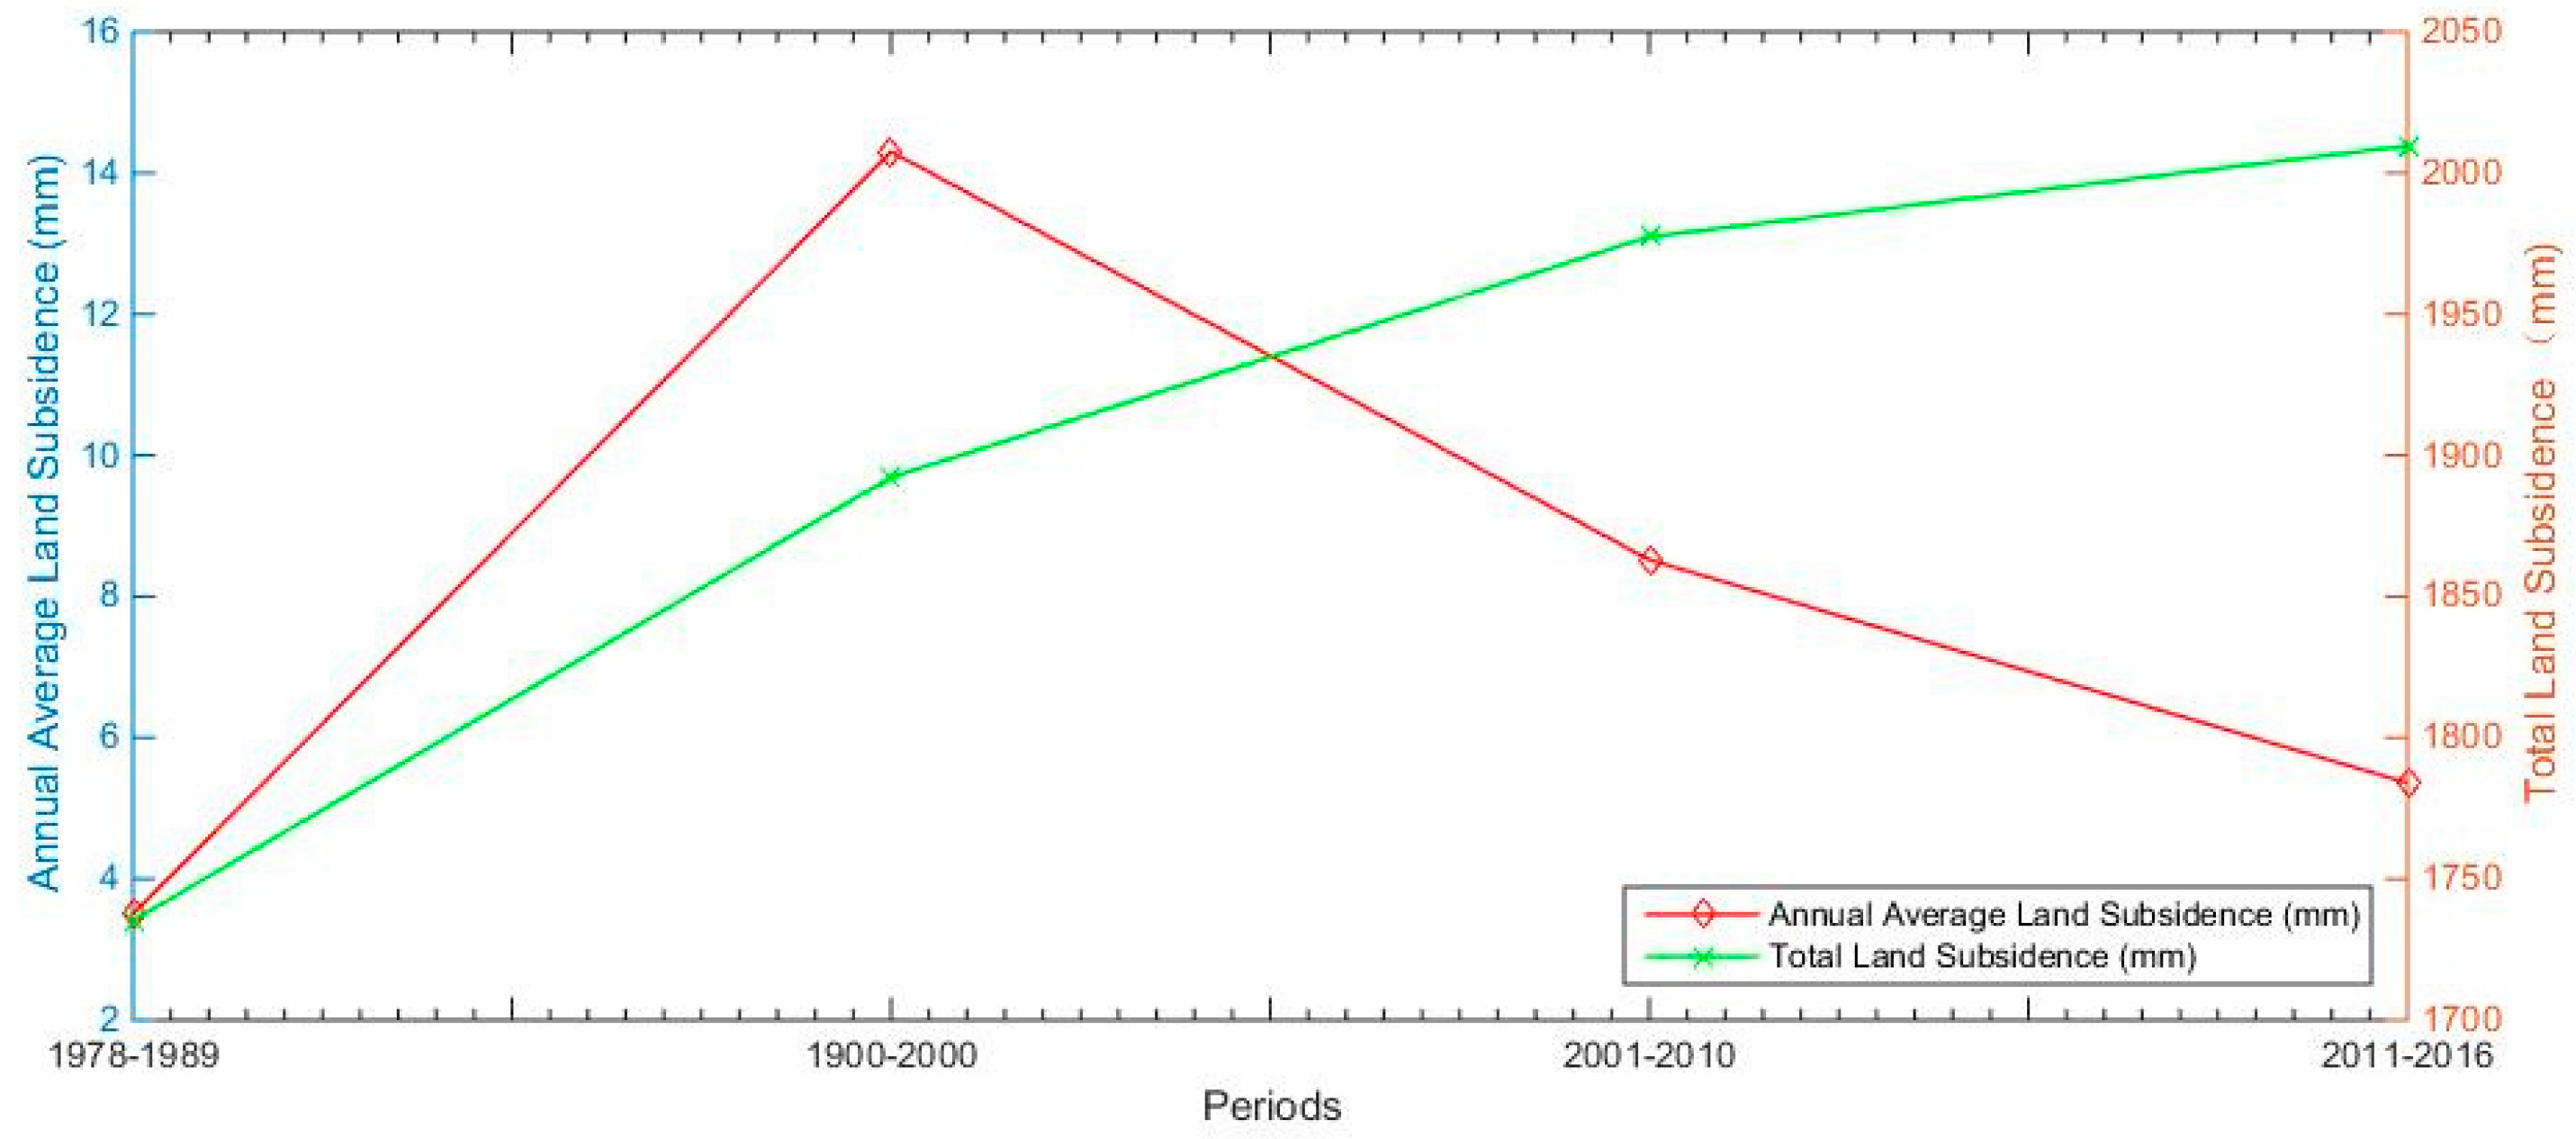
First, we have identified several key time points according to the change in impacting factors since 1978 (
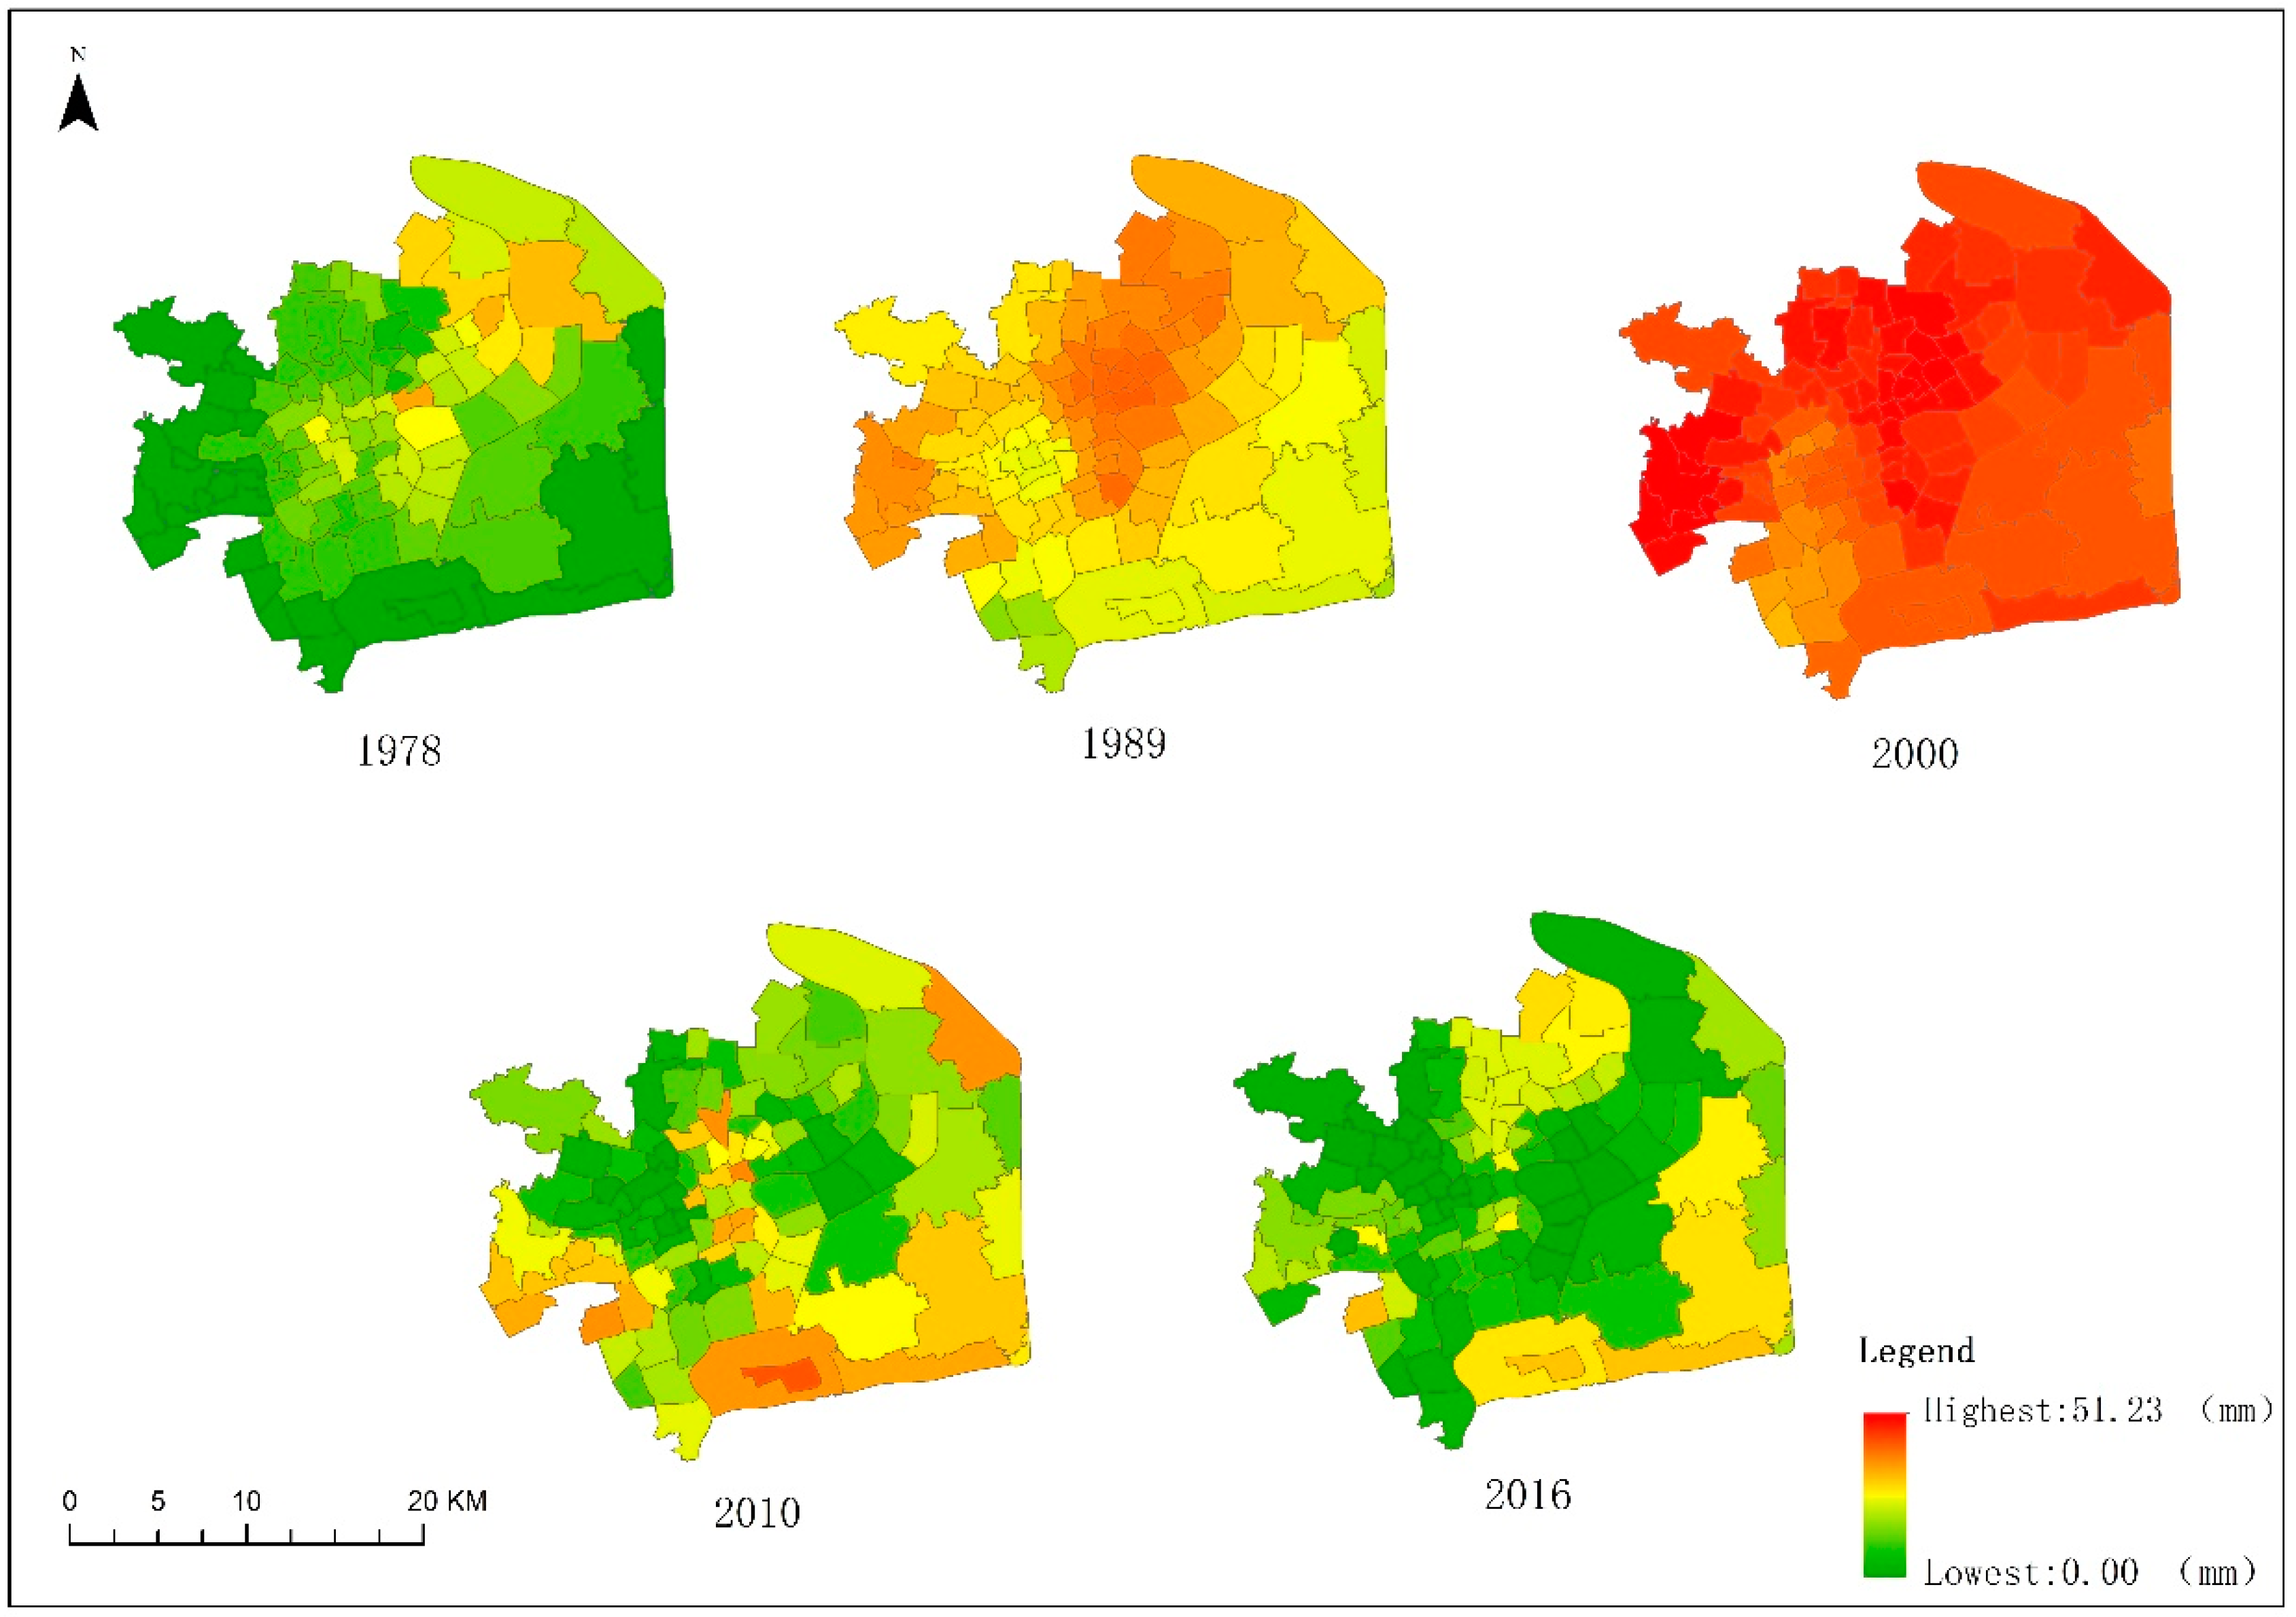
Figure 5): 1989, 2000, and 2011. The factors were almost unchanged from 1978 to 1989, and began to grow slowly in 1989. They have grown rapidly since 2000. Year 2011 is very important as factors began to change obviously. For example, the number of civil vehicles reduced, the amount and area of high-rise building and GDP grew at a faster rate, the number of permanent residents began to stabilize. According to these key time points, we divided the land subsidence into four stages: 1978–1989, 1990–2000, 2001–2010, and 2011–2016. Second, Grey Correlation Degree Analysis (GCDA) of land subsidence and seven impacting factors at different stages in Shanghai from 1978 was carried out. According to the grey correlation degree, the influence of each factor was determined. Third, Exploratory Spatial Data Analysis (ESDA) was adopted, and Moran’s
I analysis and Getis–Ord General G analysis were used to explore the spatial autocorrelation and spatial distribution characteristics of the main subsidence area in Shanghai—the urban centre. Spatial autocorrelation refers to the potential interdependence of observations in the same distribution [
46], and it is a kind of spatial correlation.
(1) Grey Correlation Degree Analysis (GCDA)
In a complex system affected by multiple factors, the relationship between the factors is unknown [
36]. It is difficult to distinguish which factors are dominant and subordinate and which factors are closely related and unrelated. In the past, regression analysis, correlation analysis, variance analysis, principal component analysis, and other traditional statistical methods were commonly used [
8,
9]. However, these methods have strict requirements on data volume and sample distribution, and there may be problems, such as the quantitative results being inconsistent with the qualitative results and failure of the standard statistical tests.
The theory of grey systems [
47] was first introduced in 1982 by Deng (1982). The basic idea [
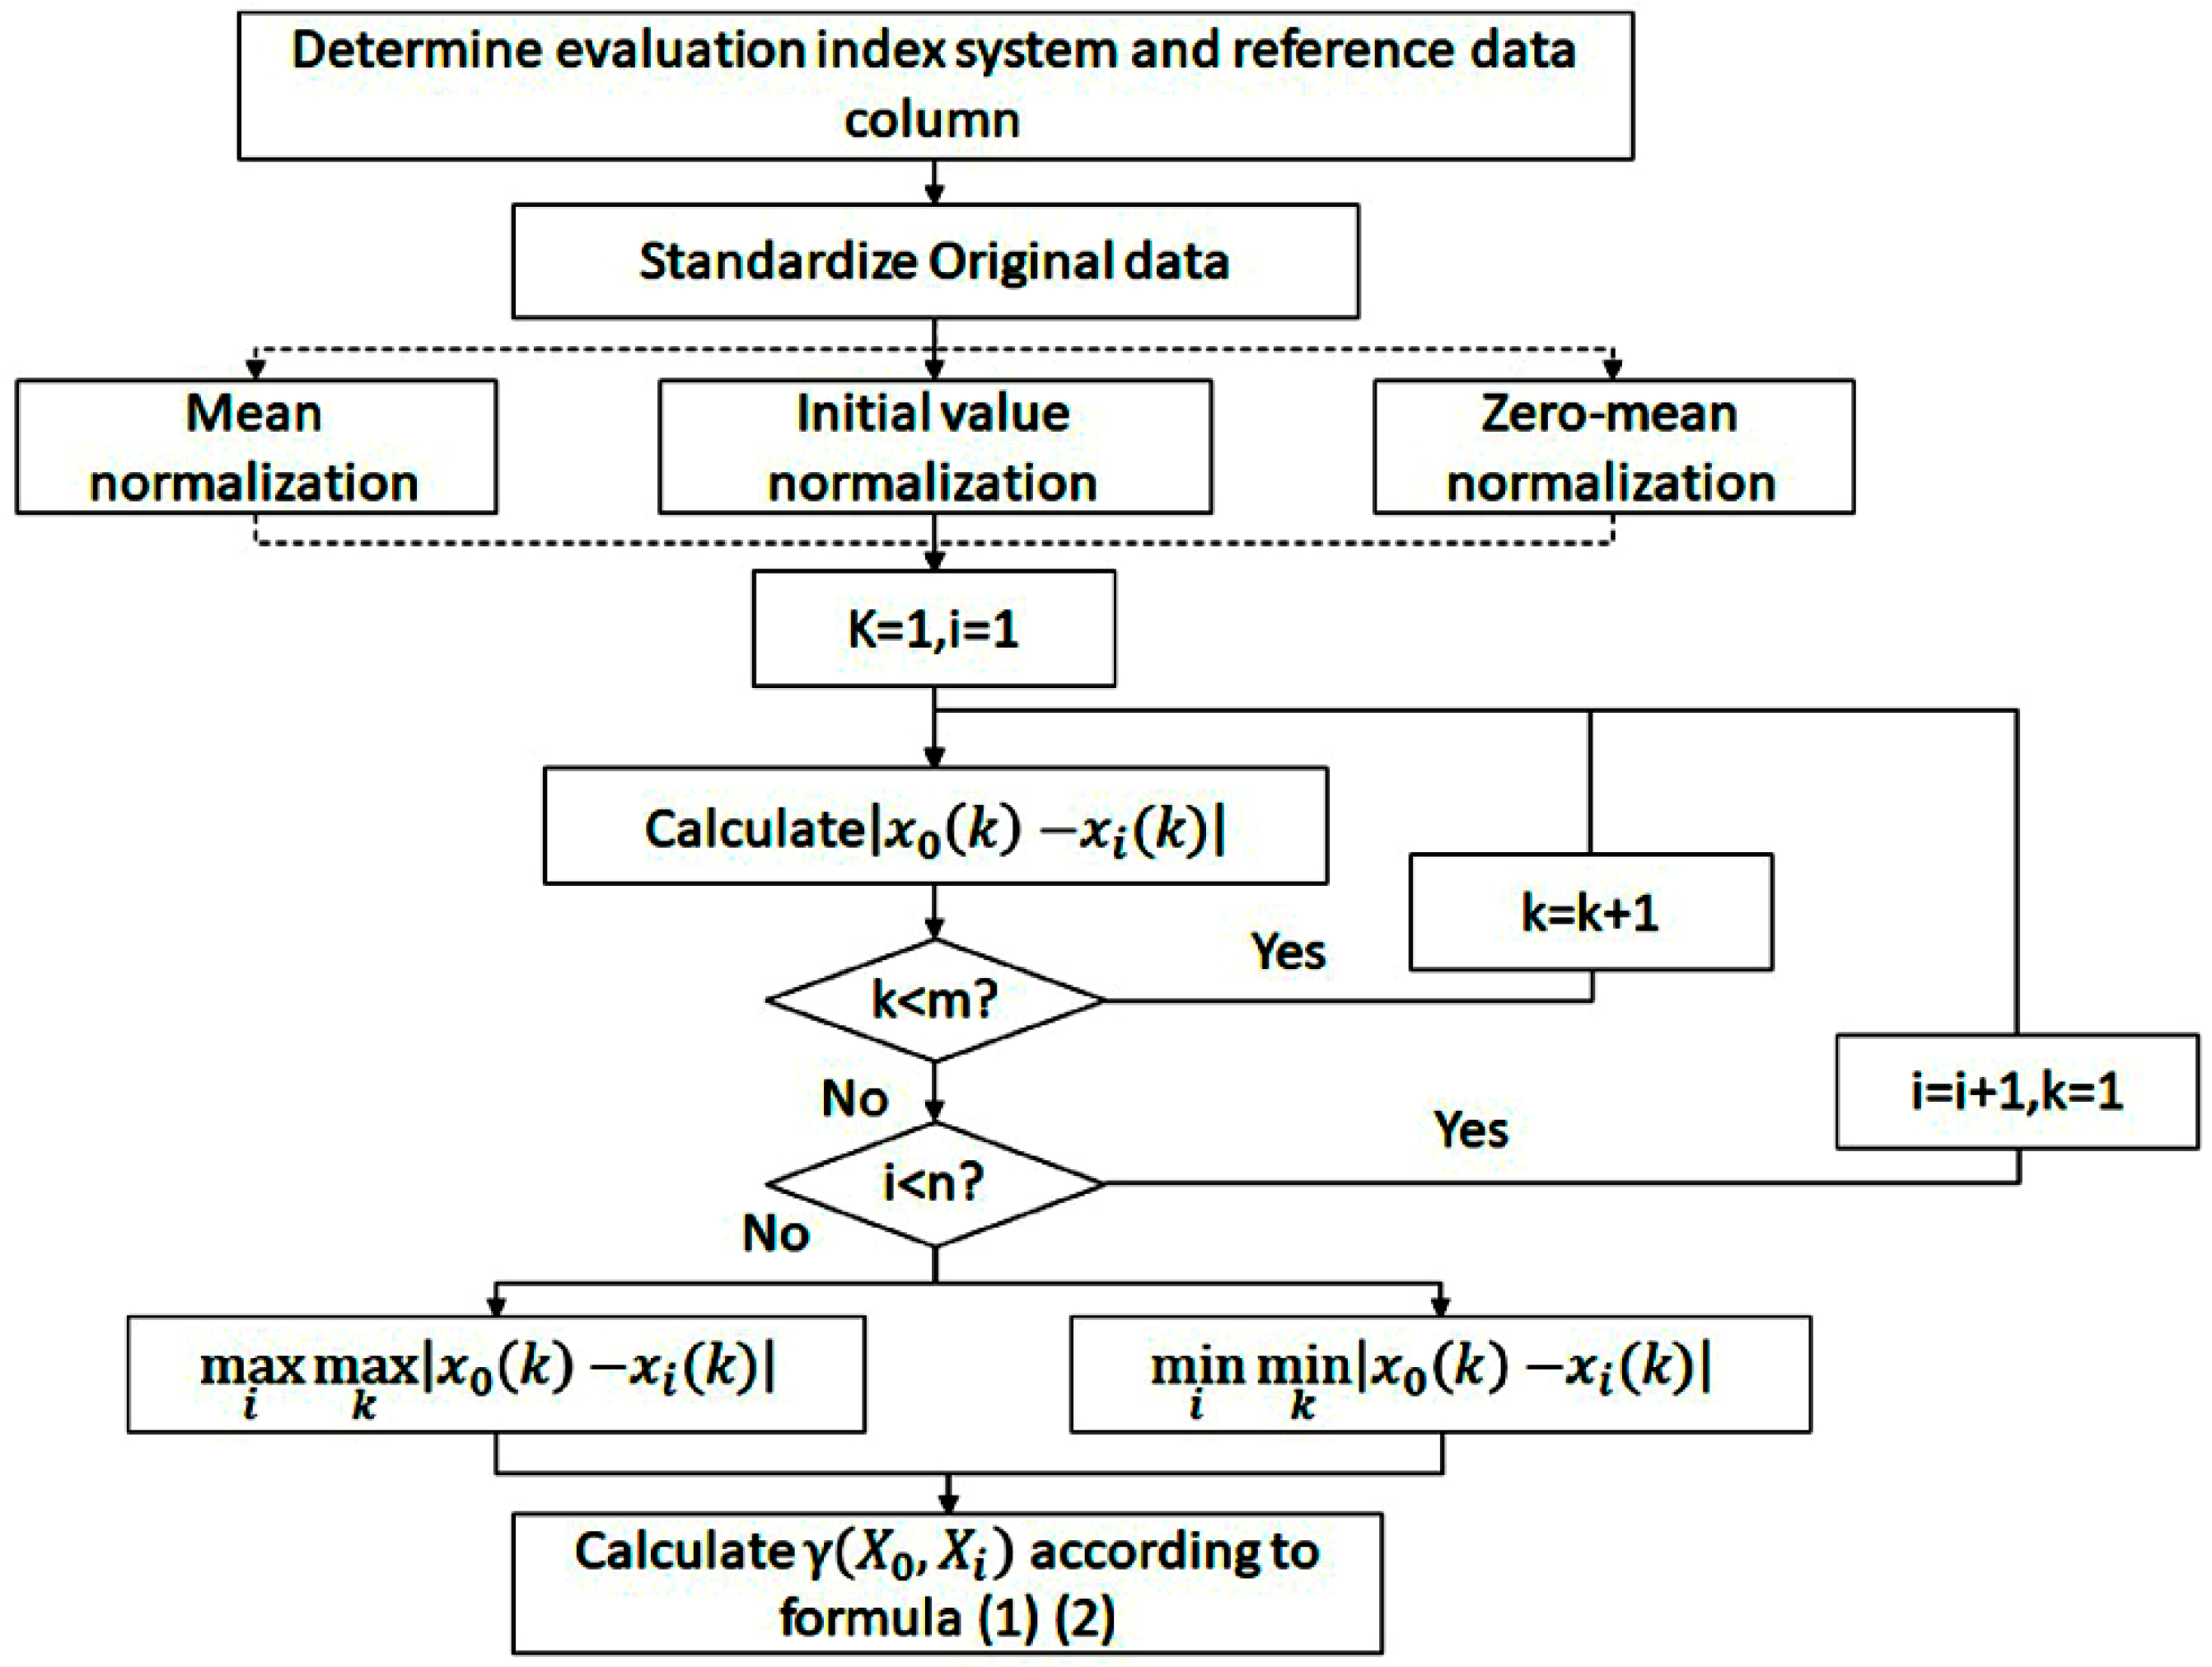
48] is to determine whether the relations between different data sequences are close based on the similarity of the geometry of the data sequence curves. With the application of the linear interpolation method, the discrete observations of system factors can be transformed into segmented continuous polylines, whose geometric characteristics reflect the correlation of the data sequences. The closer the geometry of the polyline is, the greater the correlation between the data sequences, and vice versa. Grey correlation analysis provides a quantified measure of the system’s development and is very suitable for dynamic process analysis. There are few requirements for the sample size and distribution and no situation where the quantitative result is inconsistent with the qualitative analysis in grey correlation degree analysis. The formula is:
where
is the grey correlation coefficient at point k,
is the grey correlation degree between data sequences
and
, and
is the resolution coefficient, with a value between 0 and 1. The smaller ξ is, the greater the difference between the correlation coefficient values of the data sequences and the stronger the discrimination between the data sequences. The calculation process of the grey correlation degree is shown in
Figure 6.
Different data standardization methods will lead to different grey correlation degrees and deserve special attention. Common methods include mean normalization, initial value normalization, and zero-mean normalization (also called z-score normalization). In general, the initial value normalization is applicable to socio-economic data, because most of these sequences show a steady growth trend, and the initial value normalization makes the growth trend more obvious [
49]. Therefore, the initial value normalization is used in this study according to the statistical characteristics.
(2) Exploratory Spatial Data Analysis (ESDA)
Exploratory spatial data analysis (ESDA) is supported by spatial analysis, emphasizes the spatial correlation of events, focuses on the nature of spatial data, and explores the spatial patterns of data. ESDA includes global and local statistical analysis. In this paper, two global statistical analysis indexes, Moran’s
I and Getis–Ord General G [
46], are used to carry out spatial autocorrelation and spatial clustering.
(3) Spatial Autocorrelation
Spatial autocorrelation refers to the potential interdependencies among observed data of some variables in the same distribution area. Tobler (1970) once pointed out “the first law of geography: everything is related to everything else, but near things are more related to each other” [
50]. Moran’s
I is a good indicator of spatial correlation and was proposed by Moran [
51], an Australian statistician. Moran’s
I reflects the degree of similarity among attributes of regional units that adjoin or are adjacent to each other. Moran’s
I is a rational number, and after normalization of variance, the number is normalized between −1 and 1 and is defined as:
where
n is the number of special units indexed by
i and
j;
x is the variable of interest;
is the mean of
x; and
is a matrix of spatial weights.
Moran’s
I > 0 means there is a positive spatial correlation between observations, and the larger the Moran’s
I value is, the more significant the correlation is. When Moran’s
I is close to 1, the observations gather in specific areas. In other words, similar observations (high or low) tend to agglomerate in space. Moran’s
I < 0 indicates that there is a spatially negative correlation between the observations, and the smaller Moran’s
I is, the greater the spatial difference among the observations. When Moran’s
I approaches −1, the observations follow a discrete spatial pattern, and similar observations tend to be distributed. Moran’s
I = 0 means that the observations are spatially random and there is no spatial correlation [
52].
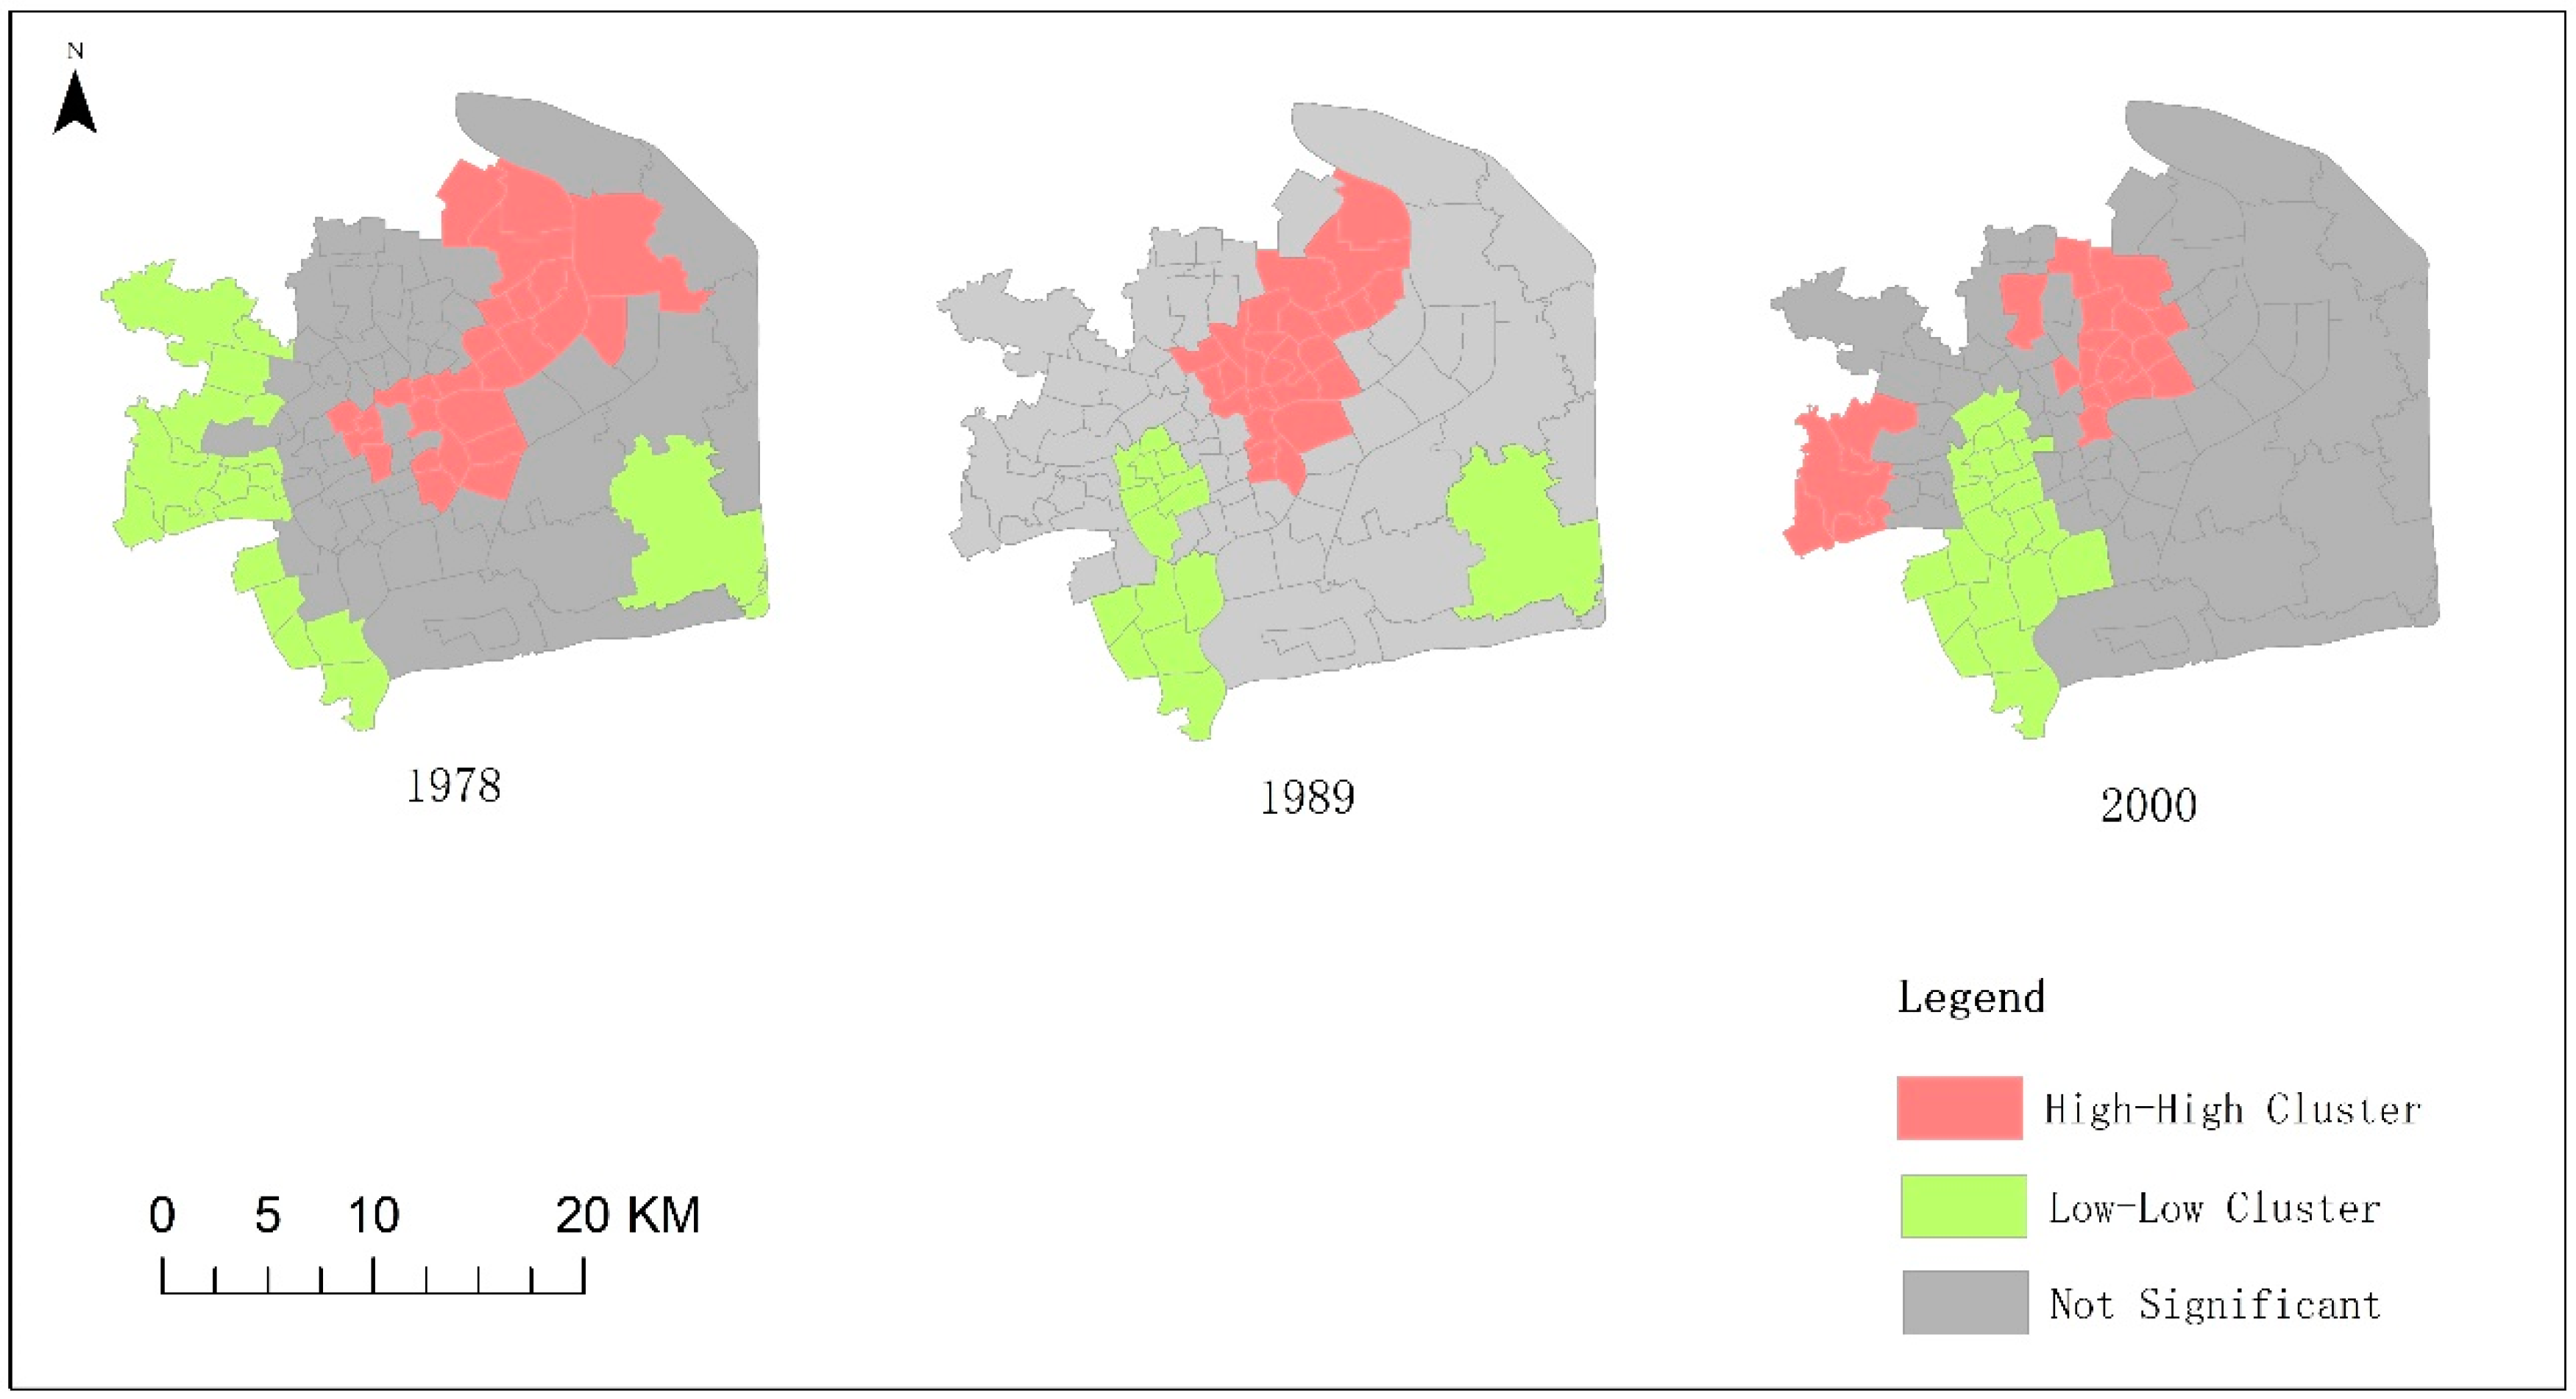
(4) Spatial Clustering
Clustering is the grouping of observations according to a similar criterion, which maximizes the intra-group similarities and the differences among groups to discover meaningful structural features. “High/low” spatial cluster analysis (also known as Getis–Ord General G analysis) determines which observations are clustered based on the possibility of data clustering. In the results of General G, high-high cluster shows that observations larger than the mean are spatially clustered, low-low cluster indicates that observations smaller than the mean are spatially clustered, and not significant means that the observations are not spatially clustered. The method was proposed by Ord and Getis [
53]. In this method, the z-score and p-value reflect statistical significance and determine whether to reject the null hypothesis which indicates that study objects are randomly distributed.
The z-score is a multiple of the standard deviation. The higher (or lower) the z-score is, the more clustered the observations are. Z being positive and greater than the threshold indicates high-value clustering, z being negative and less than the threshold indicates low-value clustering, and z = 0 indicates no clustering of observations. The
p-value is defined as the probability under the null hypothesis in which the spatial pattern of the observation is random. The null hypothesis is rejected if any of these probabilities is less than or equal to a small, fixed but arbitrarily pre-defined threshold value, which is commonly set to 0.10, 0.05, or 0.01 (
Table 4).


