1. Introduction
The original idea of input–output (IO) theory, which models all of the sectors of the economy via an input–output table, was firstly proposed by Wassily Leontief in the 20
th century [
1,
2]. This great innovation in the economic field earned Leontief a Nobel Prize in 1973 [
3]. Since then, the theory and methodology of input–output analysis has been developed rapidly. For example, the traditional static input–output model has been further developed into a dynamic integrated input–output simulation model [
4]. The combination of the input–output model and system optimization technology is also an important development trend. Integrating the input–output model with linear programming, nonlinear programming, and dynamic programming models, an input–output optimization model can be established [
5,
6]. Input–output analysis not only has great development in terms of theory, methods, and tabulation, it has also been expanding in its application scope. Many researchers have extensively employed input–output models to environmental impact evaluations [
7], energy analysis [
8], and material metabolism measurements [
9].
In general, researchers from a number of countries have carried out input–output-related research from various aspects, and these studies have been published in diverse journals. Therefore, an objective and quantitative evaluation on the rapid growing literatures in the field of IO analysis is desired. Bibliometric analysis can systematically assess the relative importance of scientific research results in a certain area, and characterize the geographical distribution of the field. After considering that the related research about those topics rose in the 1990s in our pre-information collection, the total majority of the published literature emerged in mainly 1990 to 2017. This study reveals the characteristics and evolution process of the global input–output analysis literature between 1990–2017. By using bibliometric analysis in combination with social network theory, in particular co-occurrence analysis and bibliographic coupling analysis, this paper helps to discover the hidden collaboration relationship among researchers from different institutions and countries, and the scientific fundamentals of this research field. With the assistance of various statistic indicators and science mapping, this paper will address the following questions:
Who are the important contributing countries/institutions/authors in the IO analysis field?
What are the collaboration relationships in the IO analysis field?
What are the most influential papers in the IO analysis-related research?
What is the evolution process of the research frontiers in the IO analysis field?
What clusters of research focuses and topics can be found?
This sketch of the scientific structures would provide new insight into the breadth and depth of this body of knowledge. The obtained results will help scientific researchers better understand the research status and frontier trends in this field, permit researchers to know the current research interests in the input–output analysis field, and provide useful information for further investigation and publication strategy.
2. Data and Methods
2.1. Methodology
Bibliometric analysis is one of the most important tools for exploring library and information science. It has become an indispensable technology for evaluating the research status and trends of a given topic or a certain journal [
10]. Based on statistical and mathematical methods, the bibliometric method can not only investigate the distributed characteristics, mathematical regularities, and patterns of the underlying science and technology, it can also reveal the research hotspots and future trends [
11]. Through this, it will provide future research directions and guidelines for researchers or readers in this field. There are several bibliometric analysis methods. For example, word frequency analysis is a common method to calculate statistics on the content distribution and provide information for future trends. Citation analysis is widely applied to evaluate the quality of publications and the performance of countries/institutions/authors in the related field. Keyword co-occurrence analysis can determine the hotspots and knowledge structure in a certain discipline or research topic. If two keywords appear in one document at the same time, it may indicate that there must be some inherent connection between them. The higher the frequency at which those two keywords appear together, the closer their relationship. Co-occurrence analysis, when applied to the text in the bylines of articles, can be also used to discover the cooperation relationship among different authors or institutions.
With the emergence of bibliometric research, the visualization of a bibliometric network, which is also called science mapping, and helps display and excavate interrelationships between knowledge, has received more attention. Similar to other networks, the bibliometric networks consist of nodes and edges, where nodes can be authors, keywords, articles, and journals, while edges represent the relationships among the nodes [
12]. According to graph theory, bibliometric network analysis can be used to map the interrelationships between various nodes, identify the communities/modules, detective the structural characteristics of complex networks, and reveal research hotpots [
13]. Several different software packages have been developed for bibliometric analysis and visualization, e.g., Pajek [
14], CiteSpace [
15], Gephi [
16], and VOS Viewer [
17]. In this study, VOS Viewer was adopted to visualize and explore the networks.
2.2. Data Sources
The Institute for Scientific Information (ISI) Web of Science (WoS) has been extensively used as the data source in bibliometric analysis. In particular, its subfield databases, the Science Citation Index (SCI) and Social Sciences Citation Index (SSCI), include the most influential scientific literatures of different research fields. Therefore, in this study, the SCI and SSCI databases are selected as the data sources for searching for publications related to input–output analysis. The tag TS (=topic), which results in a search within the title, keywords, and abstract fields, was used for querying. The TS = (“input–output analysis” or “input–output model” or “input–output table” or “input–output technique*” or “input–output method” or “IO model” or “IO analysis” or “IO table” or “IO technique*” or “input–output framework” or “IO framework”) was retrieved on 19 January 2018. As a result, there are total 3172 articles in English. While according to this query, not all of the articles with “input–output” words indicate the input–output theory proposed by Leontief. For example, some representations of the input–output model are for energy systems, some are for the input–output structure in neural network systems, some are for input–output in control systems. These irrelevant papers in other research fields should be excluded. In addition, in order to guarantee more accurate results, we further narrowed the investigation. In our work, article with “input–output” or “IO” appearing two or more times in the title/author keywords/abstract was considered as relative research in this field; otherwise, the record would be removed due to insignificant relation. After filtering the irrelevant and less relative publications manually, 2565 records were downloaded with author(s), titles, sources (journal title), languages, document types, author keywords, addresses, cited reference count, times cited, publisher information, page count, ISSN, and subject category information for further analysis in this study.
3. Results and Discussion
3.1. General Publication
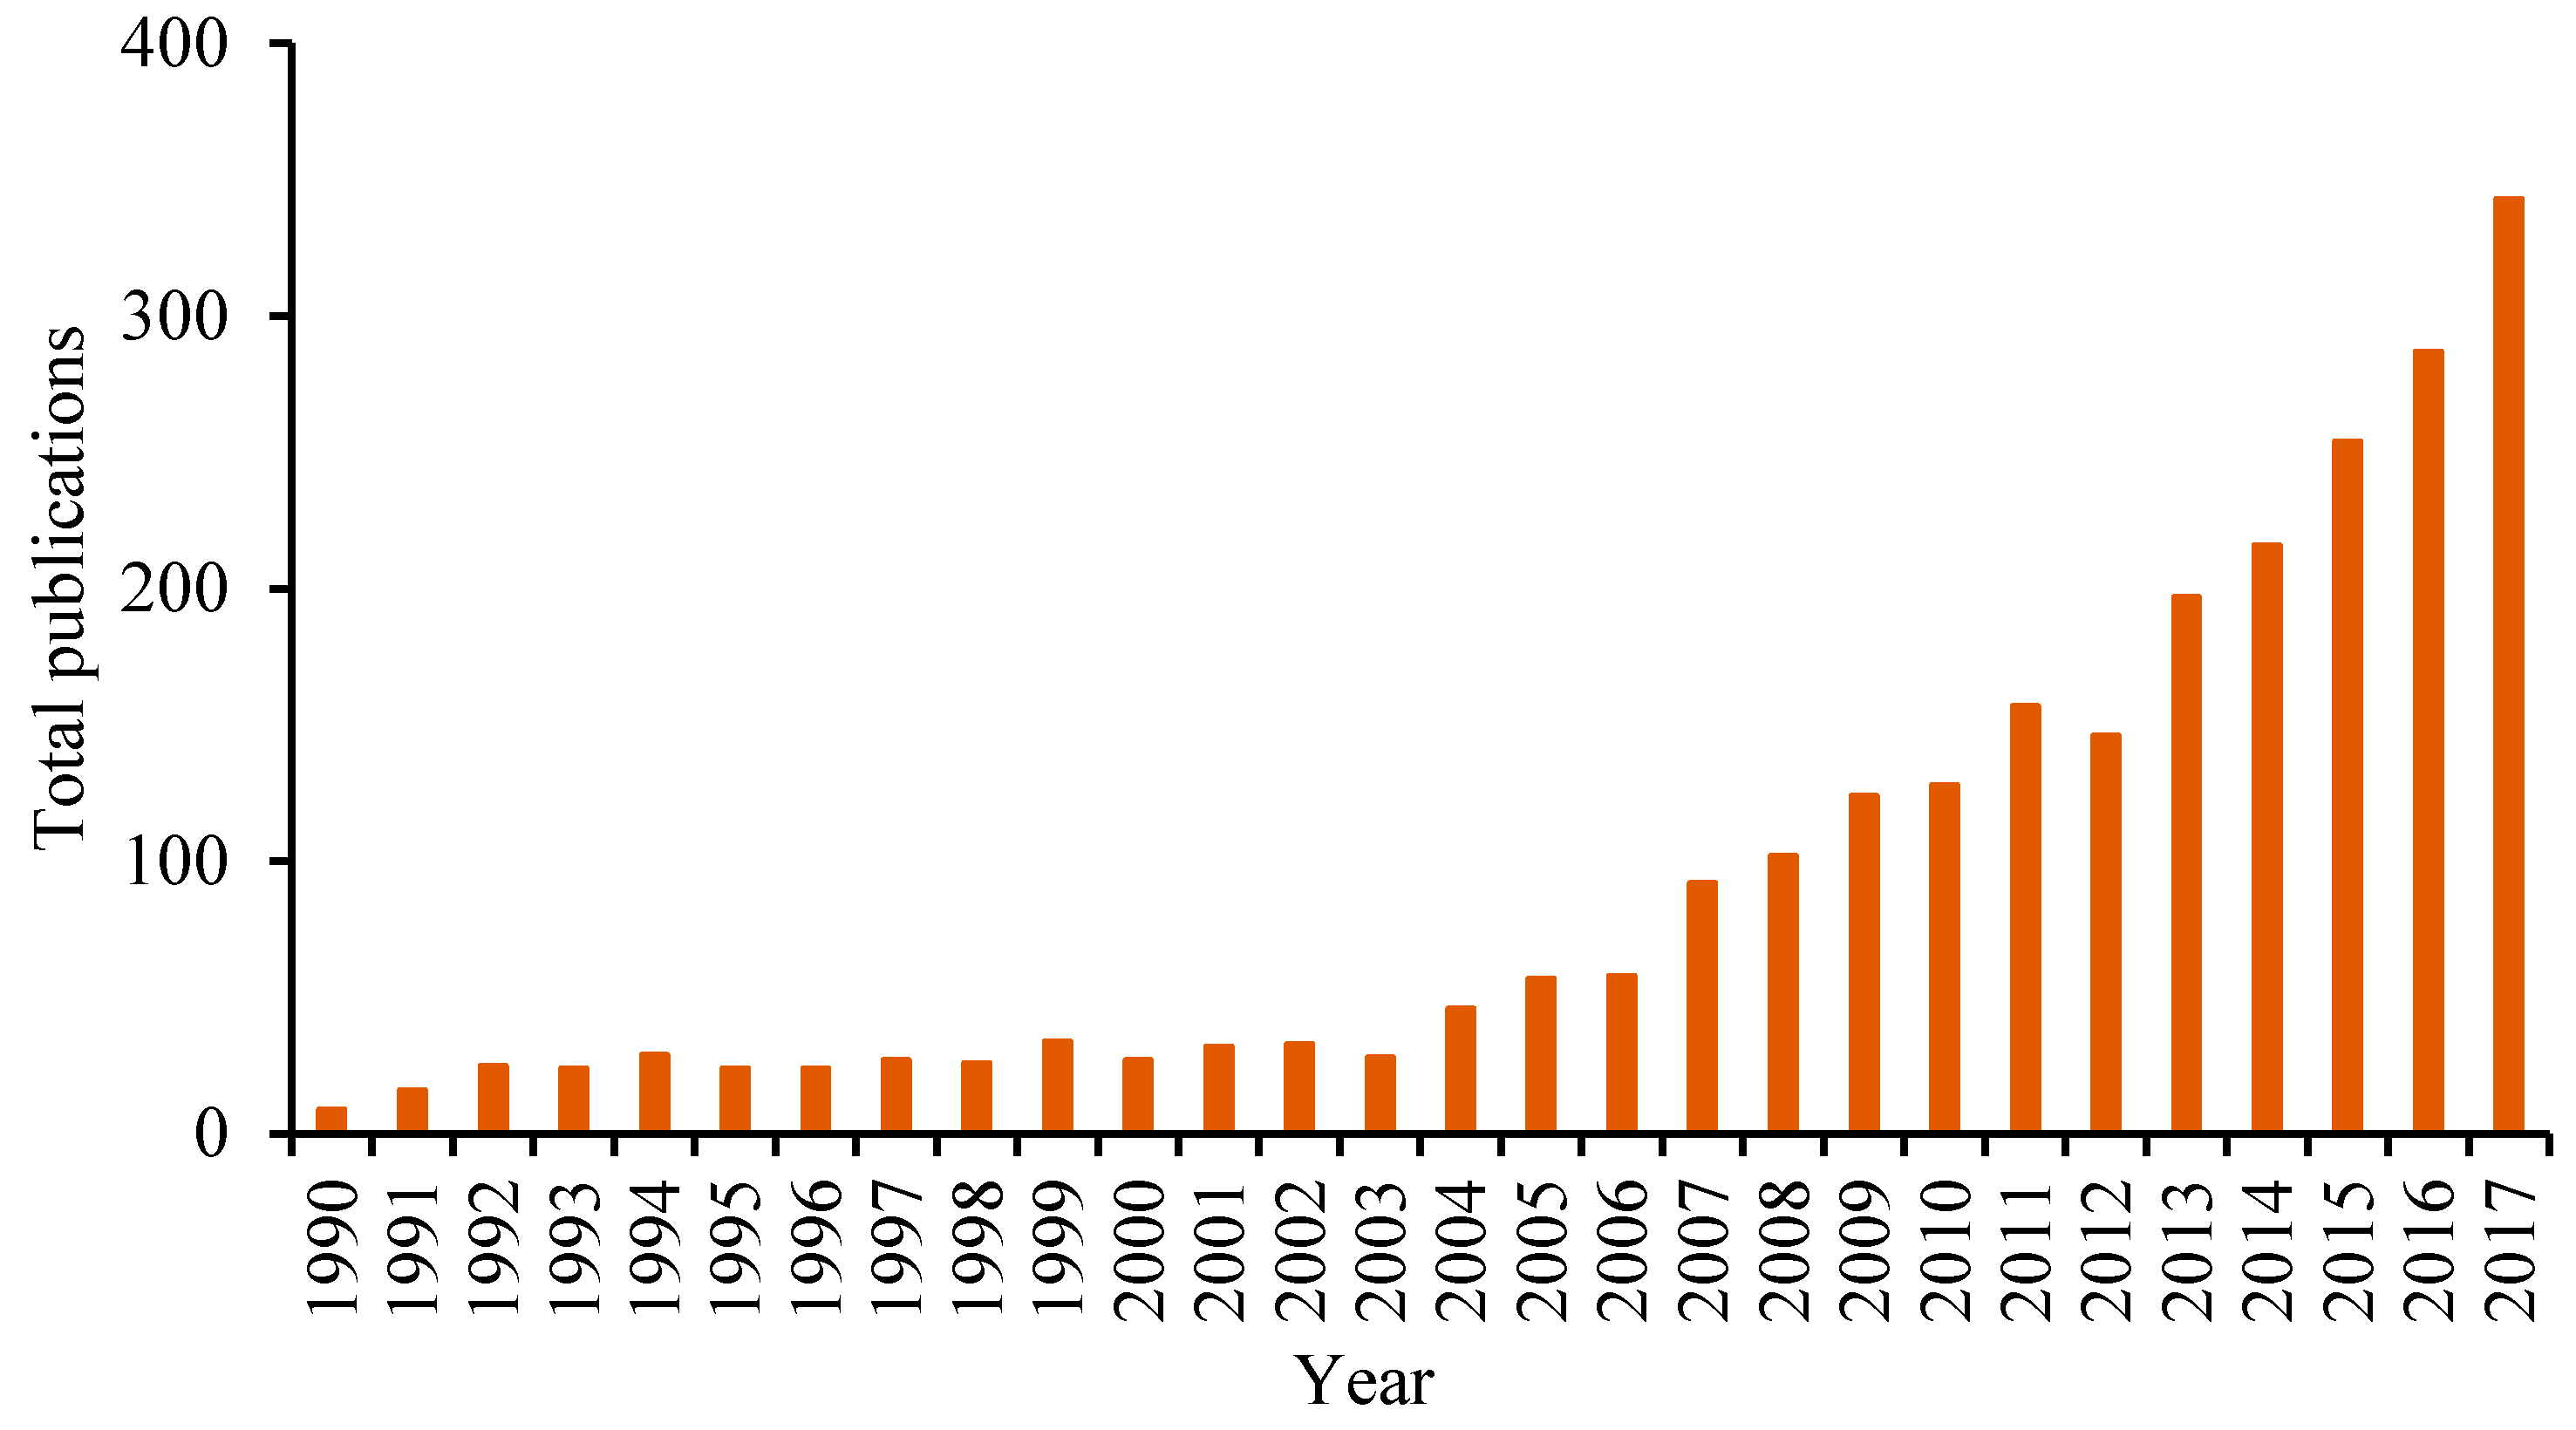
Table 1 shows the characteristics of the input–output analysis-related publications from 1990 to 2017, including the total publication, total authors, total citations, average authors per publication, and average citations per publication for a certain year. In general, the steady growth trend of total publications indicates that there is an increase in the studies on the topic. The whole period can be divided into two stages: the first stage covers from 1990 to 2003, where the number of publications fluctuated but was still stable, and the second stage covers from 2004 to 2017, where the quantity of the relative literature increased rapidly (
Figure 1). The fast increasing trend indicates that more and more researchers will use input–output analysis. In addition, currently the articles published between 1996–2012 gained relatively high average citations.
3.2. Distribution of Journals
There are a total of 584 journals published the related articles in the input–output analysis research field from 1990 to 2017.
Table 2 shows the top 15 journals in this field. It can be found that these top 15 journals have contributed to about 44% of the total publications over the past 18 years, which indicates they are the mainstream journals in this field. Among them, the Journal of Cleaner Production is the most influential journal, with 151 publications in this field. It is followed by Ecological Economics (147 articles) and Energy Policy (137 articles). Applied Energy ranks sixth in term of total publication, but has the highest impact factor (7.182) among them. Ecological Economics and Energy Policy have the highest h-index (40) among the top 15 most productive journals. In general,
Applied Energy,
Ecological Economics, and
Energy Policy are the key journals with a substantial influence on the input–output analysis research, and other key journals are also important to support such studies. In addition,
Table 2 also provides the variation in these journals during different time periods. It can be found that the total publications in these journals are increasing. Some published journals have begun to pay more attention in this field, especially the
Journal of Cleaner Production, whose relative publications are 0, 10, and 141 during the periods of 1990–1999, 2000–2009, and 2010–2017, respectively. By contrast, the rank of
The International Journal of Production Economics has come down in recent years; as it was first for 1990–1999, 11th for 2000–2009, and 17th for 2010–2017.
3.3. Contribution of Countries/Institutions/Authors
In total, 4814 authors from 79 countries/areas and 1698 institutions made their contributions to the development of input–output analysis-related studies during the past 18 years.
3.3.1. Contribution of Countries
According to the location of the author’s affiliated institution,
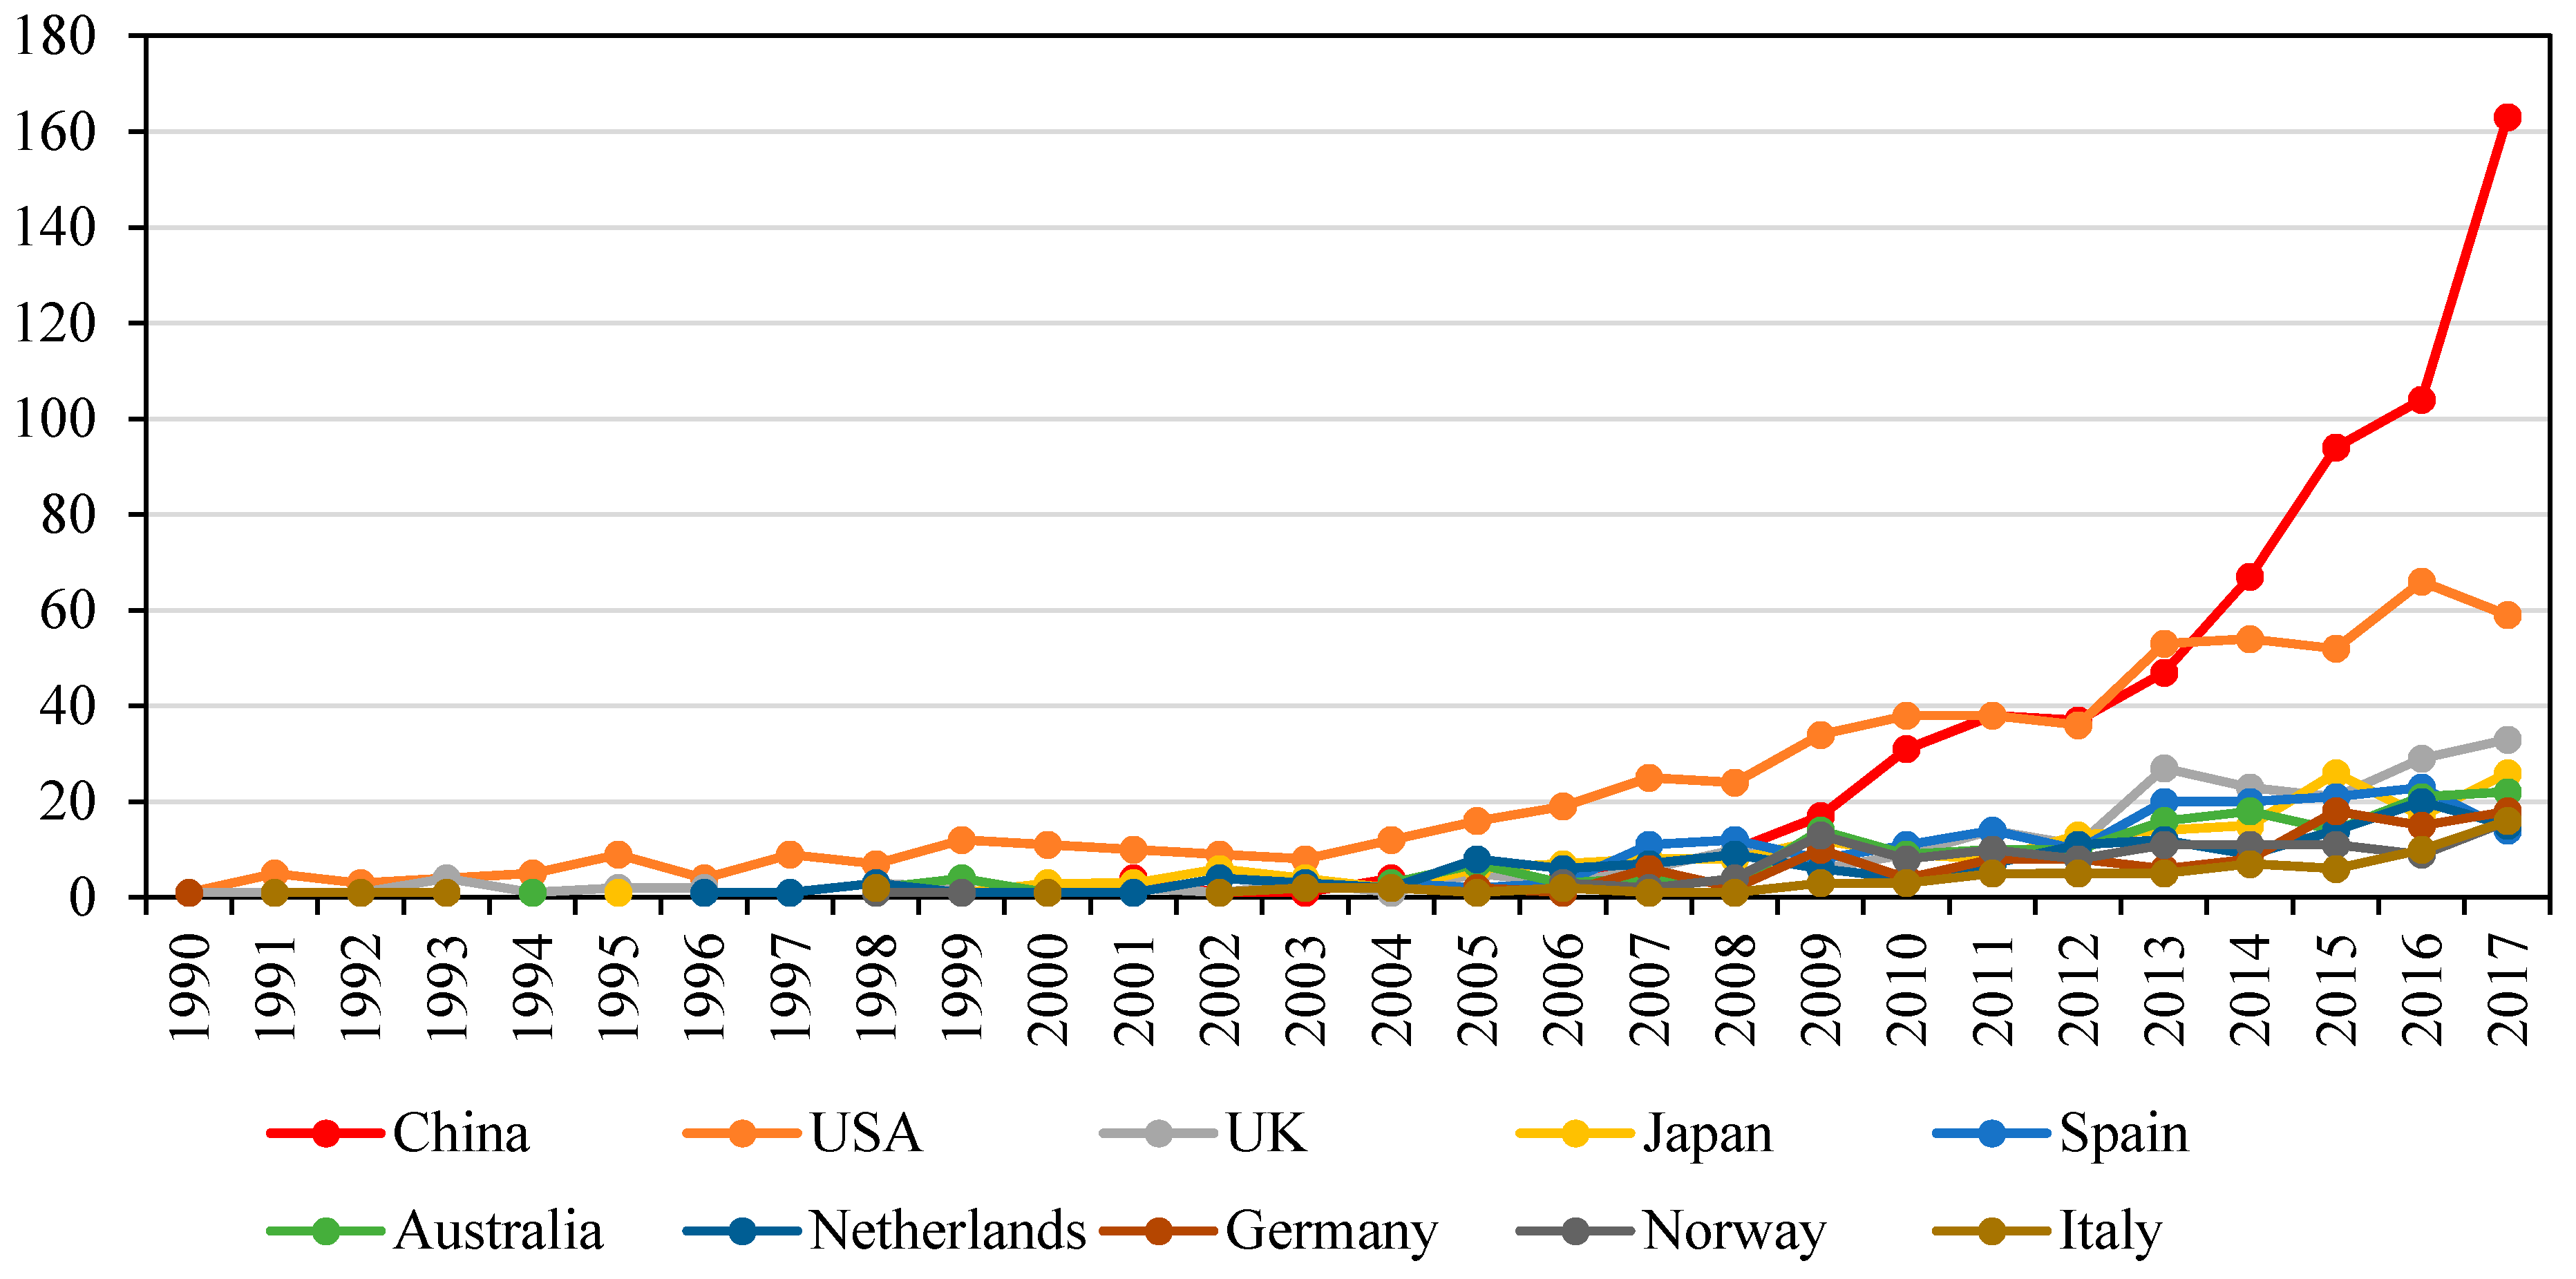
Table 3 lists the top 10 most productive countries’ statistical information with regard to the number of total publications, the performance of international collaboration, and h-index. Among the 79 countries, China (630 papers) and the United States (USA) (623 papers) are clearly leading in terms of publications output, which are much more than the United Kingdom (UK) (230), Japan (192), and Spain (174). All of the countries show a favorable international cooperation relationship with other countries, especially Norway and Germany.
Table 3 also shows their h-indexes. USA has the highest h-index (57), followed by China (47). A higher h-index indicates a relatively greater influence in this field.
Figure 2 illustrates the annual publications of these top 10 most productive countries. The publications of these countries show an upward growth trend. The USA took a leading position in the early period from 1990 to 2010. However, China has enjoyed a rapid growth since 2009, and even surpassed the USA to rank first since 2014.
3.3.2. Contribution of Institutions
Table 4 presents the main performance of the top 10 most productive institutions in the research field of input–output analysis during 1990–2017. Among the top 10 institutes, half came from China, and the rest came from Australia, Netherlands, the United Kingdom (UK), and Japan, respectively. This indicates that the institutions from China have played an increasingly prominent role in the research field of input–output analysis. Except for the Chinese Academy of Sciences and the National Institute of Environmental Studies, the others are all universities. The Chinese Academy of Sciences had the highest contribution, with 127 articles in terms of total publications, followed by the Beijing Normal University (87 papers) and the University of Sydney in Australia (87 papers). The University of Sydney also has the most total citations (3897 times) and the highest h-index (36). The University of Leeds and the University of Sydney rank first and second in terms of citations per publication. This indicates that the publications from these two institutes have relatively greater influence in the research field of input–output analysis, while the average citation per article in China is still relatively lower than other institutions. This reflects the gap between China and other international high-yield institutions in terms of the quality and influence of publications.
3.3.3. Contribution of Authors
The most active authors can also be called key authors.
Table 5 presents the top 20 most productive authors in the field of input–output analysis between 1990–2017. The most prominent author regarding productivity is Lenzen from The School of Physics in The University of Sydney, who has published 50 articles. The second and third key authors are Guan from The University of East Anglia (36 articles) and Hubacek from The University of Maryland (35 articles). However, Peters, ranking 12
th in the total volume of publications, has the highest average citation per publication (78.20). Su has published 18 articles with 1056 citations, which makes him rank second in terms of average citation per publication. This indicates that they are also influential authors in the field of input–output analysis.
3.4. Highly Cited Articles
Table 6 shows the most highly cited articles in the field of input–output analysis from 1990 to 2017, including the article’s name, author(s), journal’s name, the country of the first author, total citations, average annual citations, and publication year. It can be found that the authors of four articles are from Australia, three are from the United States (USA), two are from the United Kingdom (UK), and the rest countries appear only once. The indicators of total citations and average annual citations can help to evaluate the impact of publications. Among the input–output analysis-related articles published between 1990–2017, the most highly cited article is entitled “Growth in emission transfers via international trade from 1990 to 2008”, which was published in The Proceedings of the National Academy of Sciences of the United States of America in 2011, and had 406 total citations and 58 annual citations. It is an international collaborative paper whose authors were from Norway, Germany, and the USA. Based on a trade-linked global input–output analysis, this article evaluates the CO
2 emission transfers via international trade during 1990–2008 in a quantitative way. The research concluded that the emissions in developed countries seem have stabilized, while in fact, their consumption-based emissions have growth faster than local emissions via international trade. This indicated that countries should pay more attention to the emission transfers via international trade, and evaluate the change in emissions from both a productive and consumption perspective [
18]. “A modified ecological footprint method and its application to Australia”, authored by Lenzen and Murray and published in
Ecological Economics, ranked second in terms of total citations (288). By employing a single-region, static, partially closed input–output framework, it presented a new calculation of Australia’s ecological footprint. The results indicate that the per-capita ecological footprint has a correlation with household expenditure, and that the ecological footprint decreases noticeably with household size [
19].
3.5. Cooperation Network Analysis
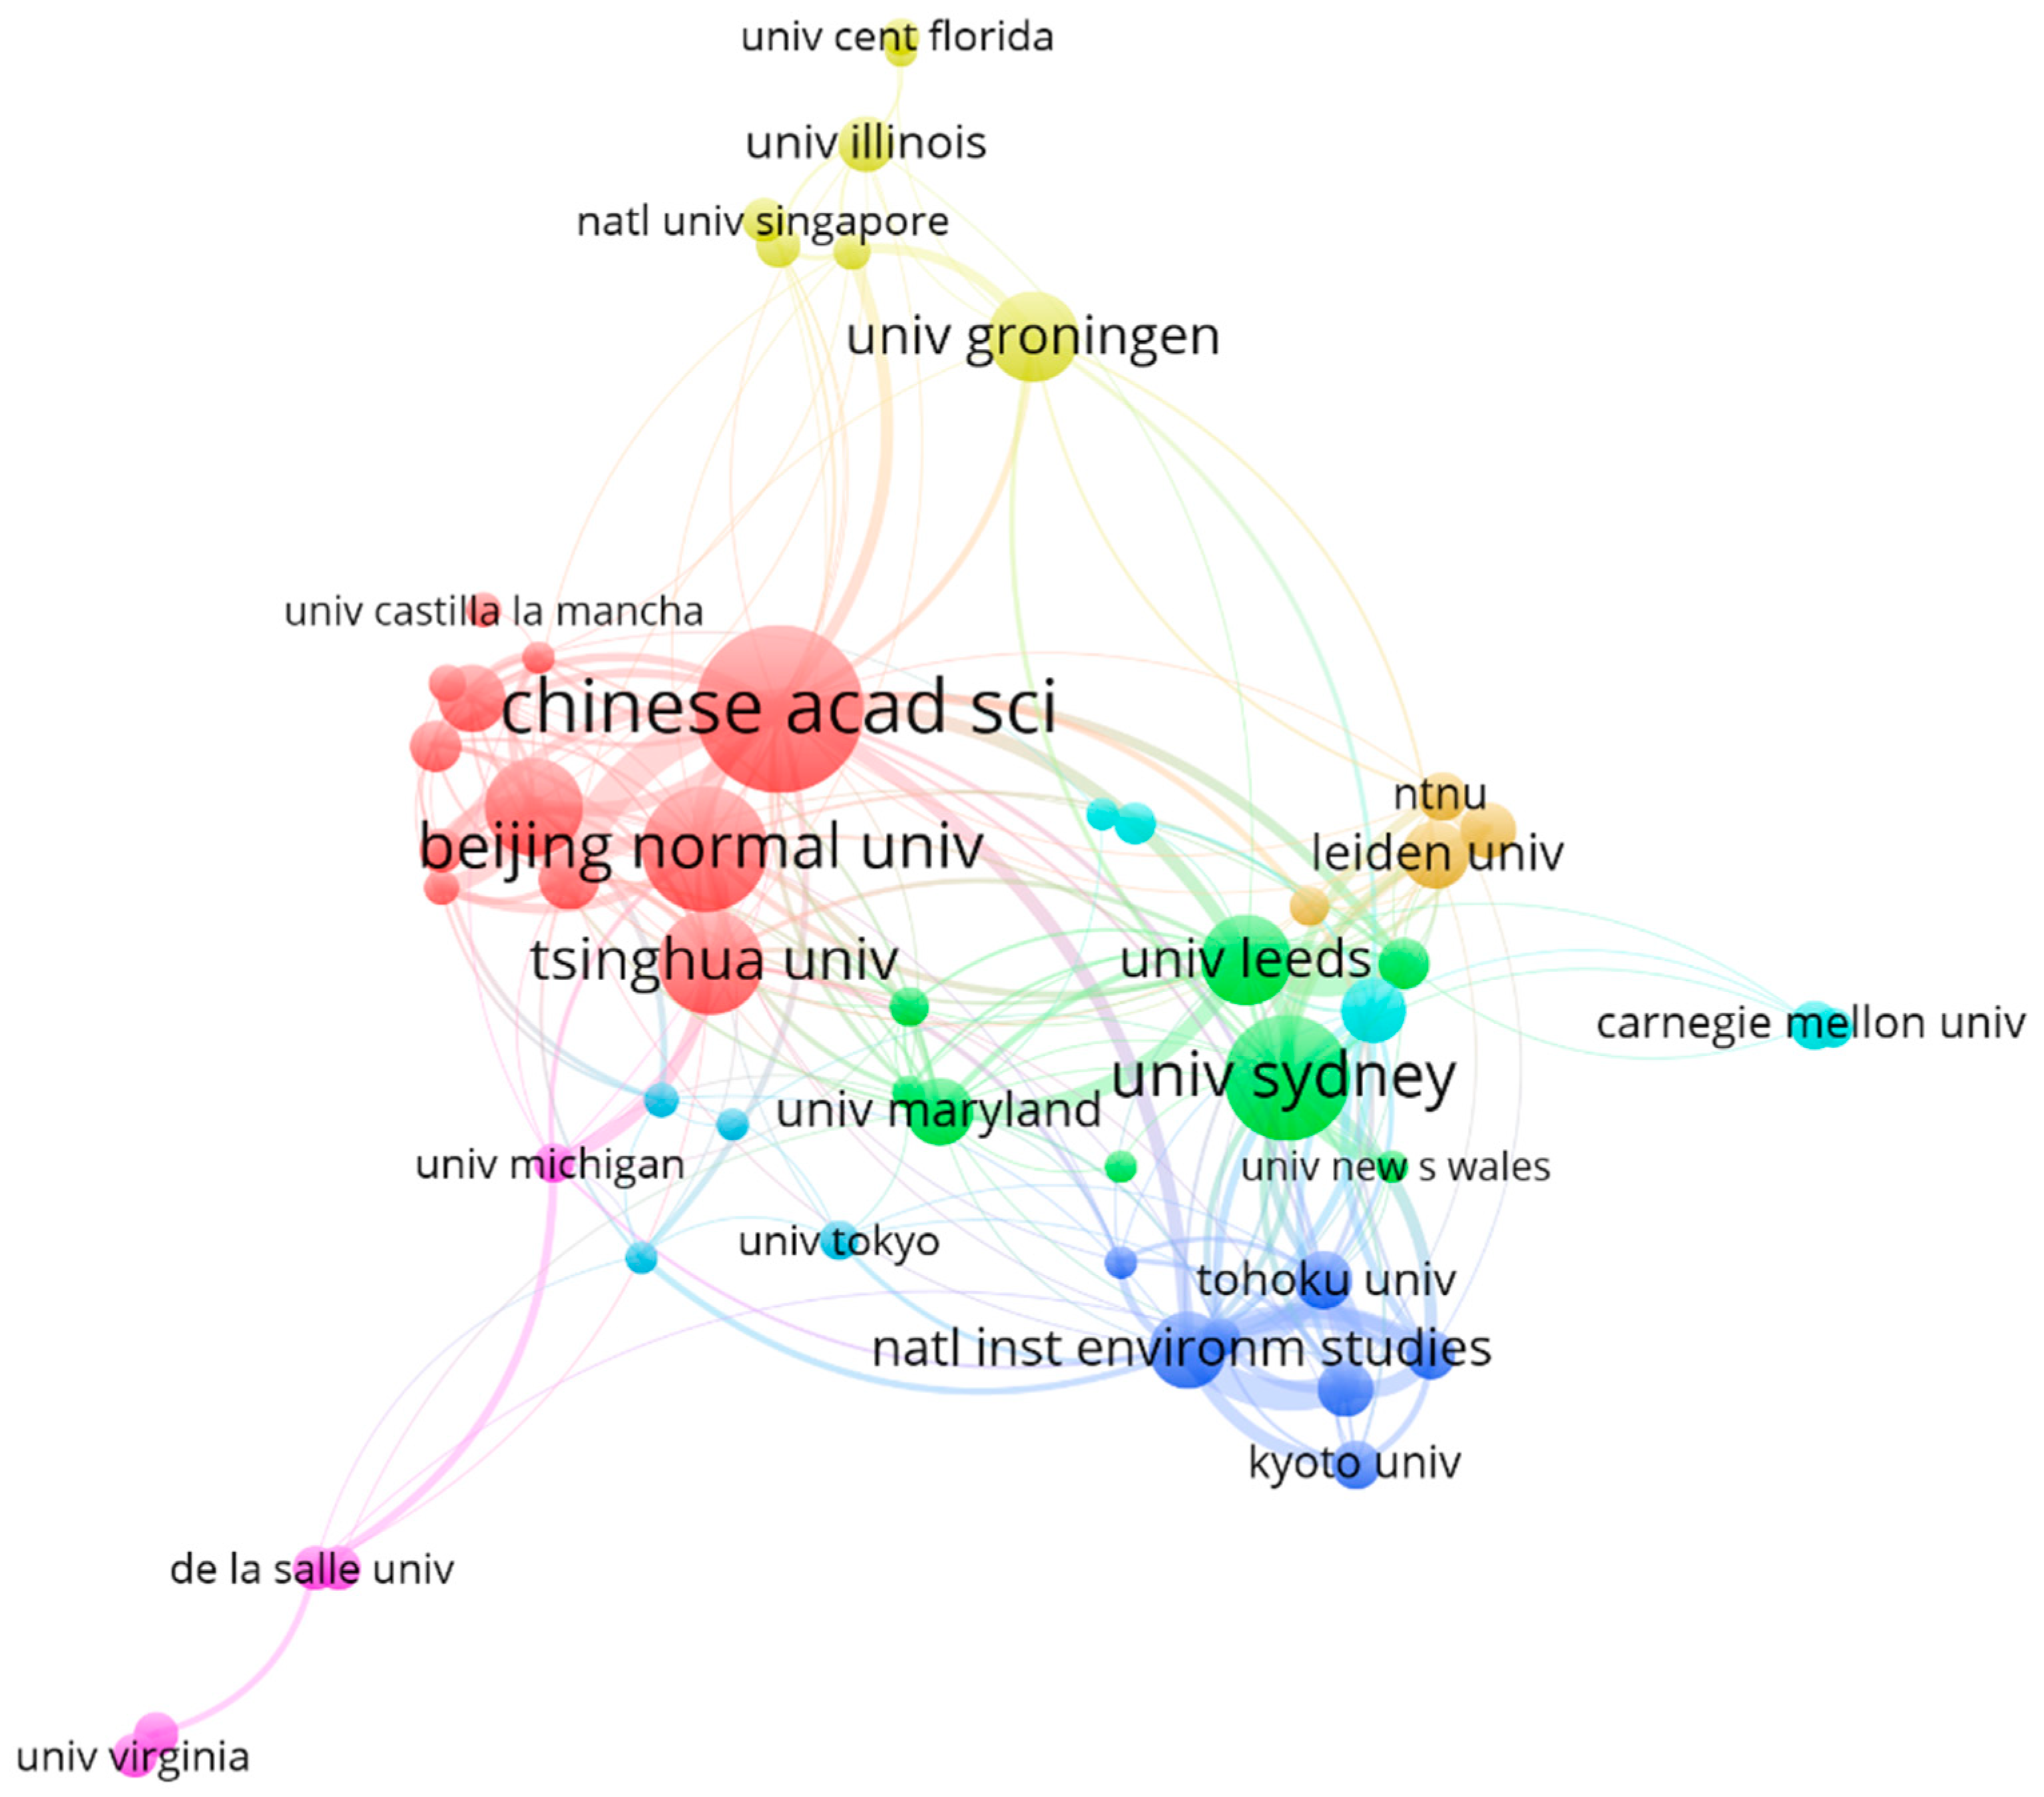
There are numerous researchers around the world from different counties and institutions; it is possible to observe the social interaction and understand the organization of the scientific community of the IO analysis field through cooperation network analysis. In the cooperation network, the nodes can be countries/institutions/authors, and the links represent the collaboration relationship between them. This study focuses on the cooperation networks of key institutions and authors. In total, 53 institutions have published more than 15 papers in the field of input–output analysis. Among them, 52 institutions have collaborative relationships, and only the Linkoping Institute of Technology has no cooperation with other institutions in this field.
Figure 3 visualizes the collaborative network of these 52 institutions. The largest cluster is consisted of 12 nodes, where the biggest node is the Chinese Academy of Science with 127 publications and 30 cooperation partners. The members in this cluster are mainly institutions from China. The second large cluster consisted of eight nodes. The largest node is The University of Sydney, which has 98 publications and 19 cooperation partners.
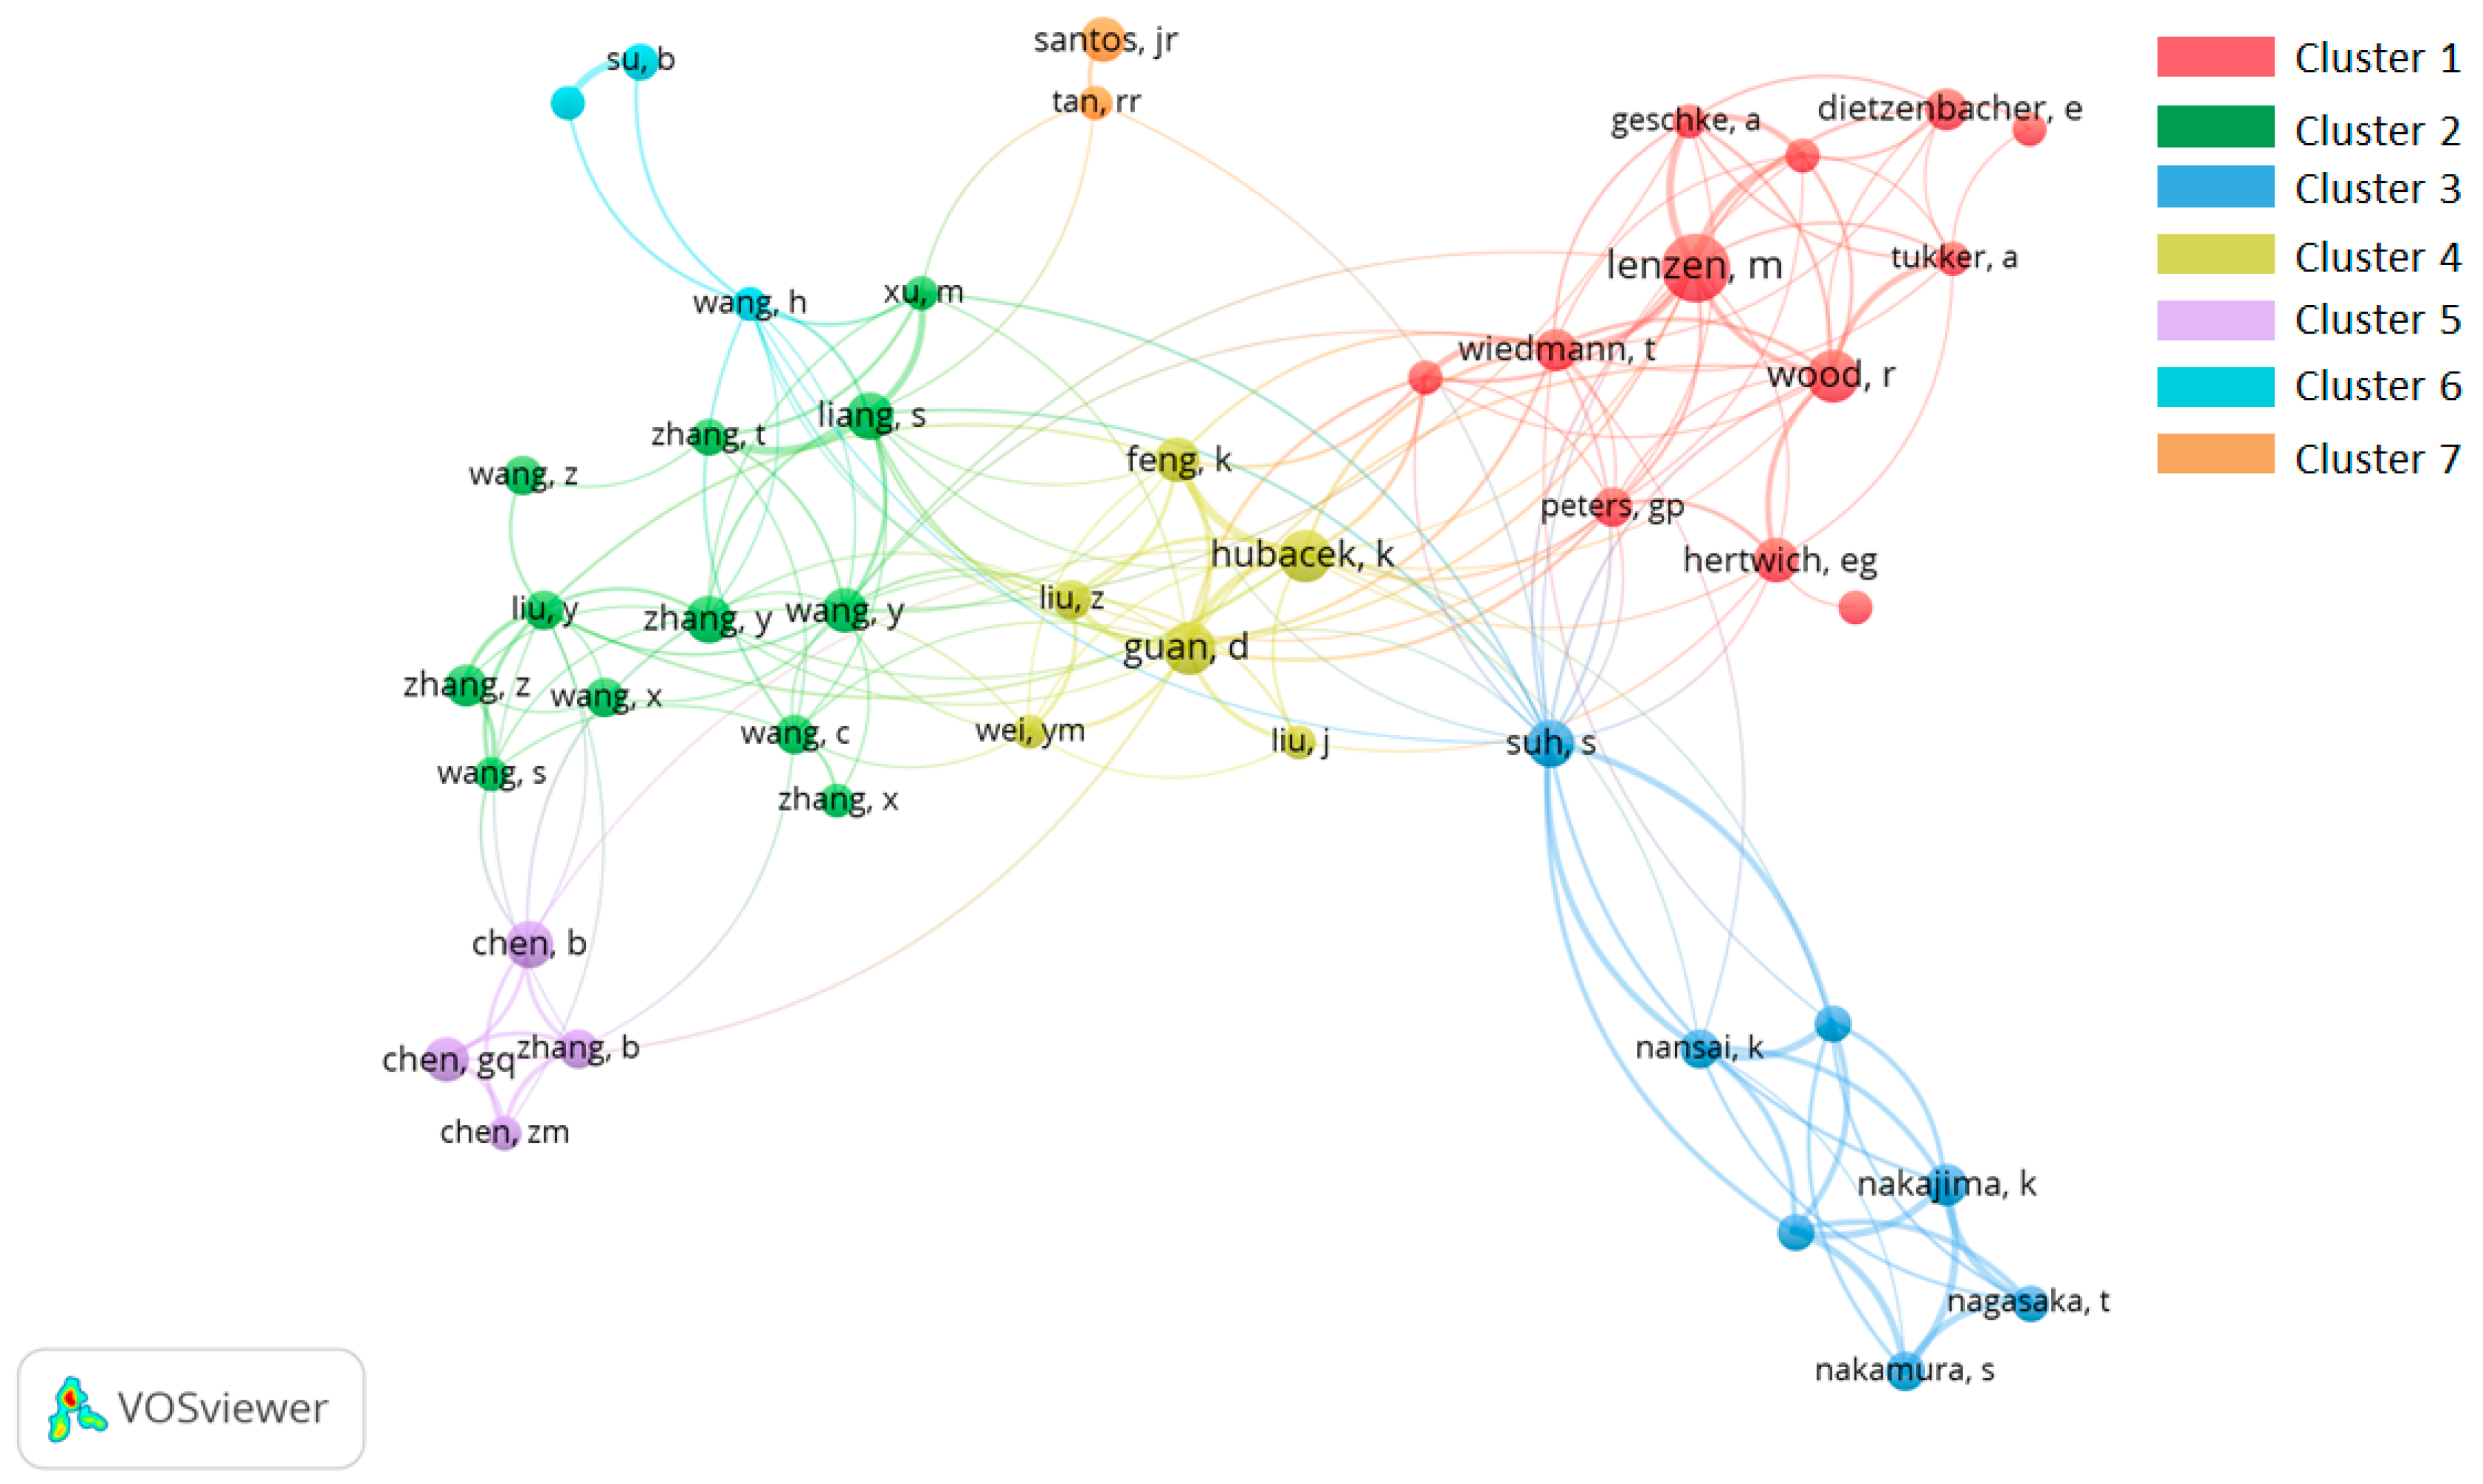
There are 48 authors publishing at least 15 papers in the field of input–output analysis.
Figure 4 shows the largest subnetwork of 46 nodes and 176 links. The top high-yield authors have formed their own cooperative team. Among them, the largest node is Lenzen, who has 50 publications and 12 neighbors, and is followed by Guan, who has 36 publications and 12 partners. Meanwhile, Hubacek and Feng have the most close and frequent cooperation relationship. The authors in the subnetwork are divided into seven clusters in different colors. Both Cluster 1 and Cluster 2 have the largest number of members (12).
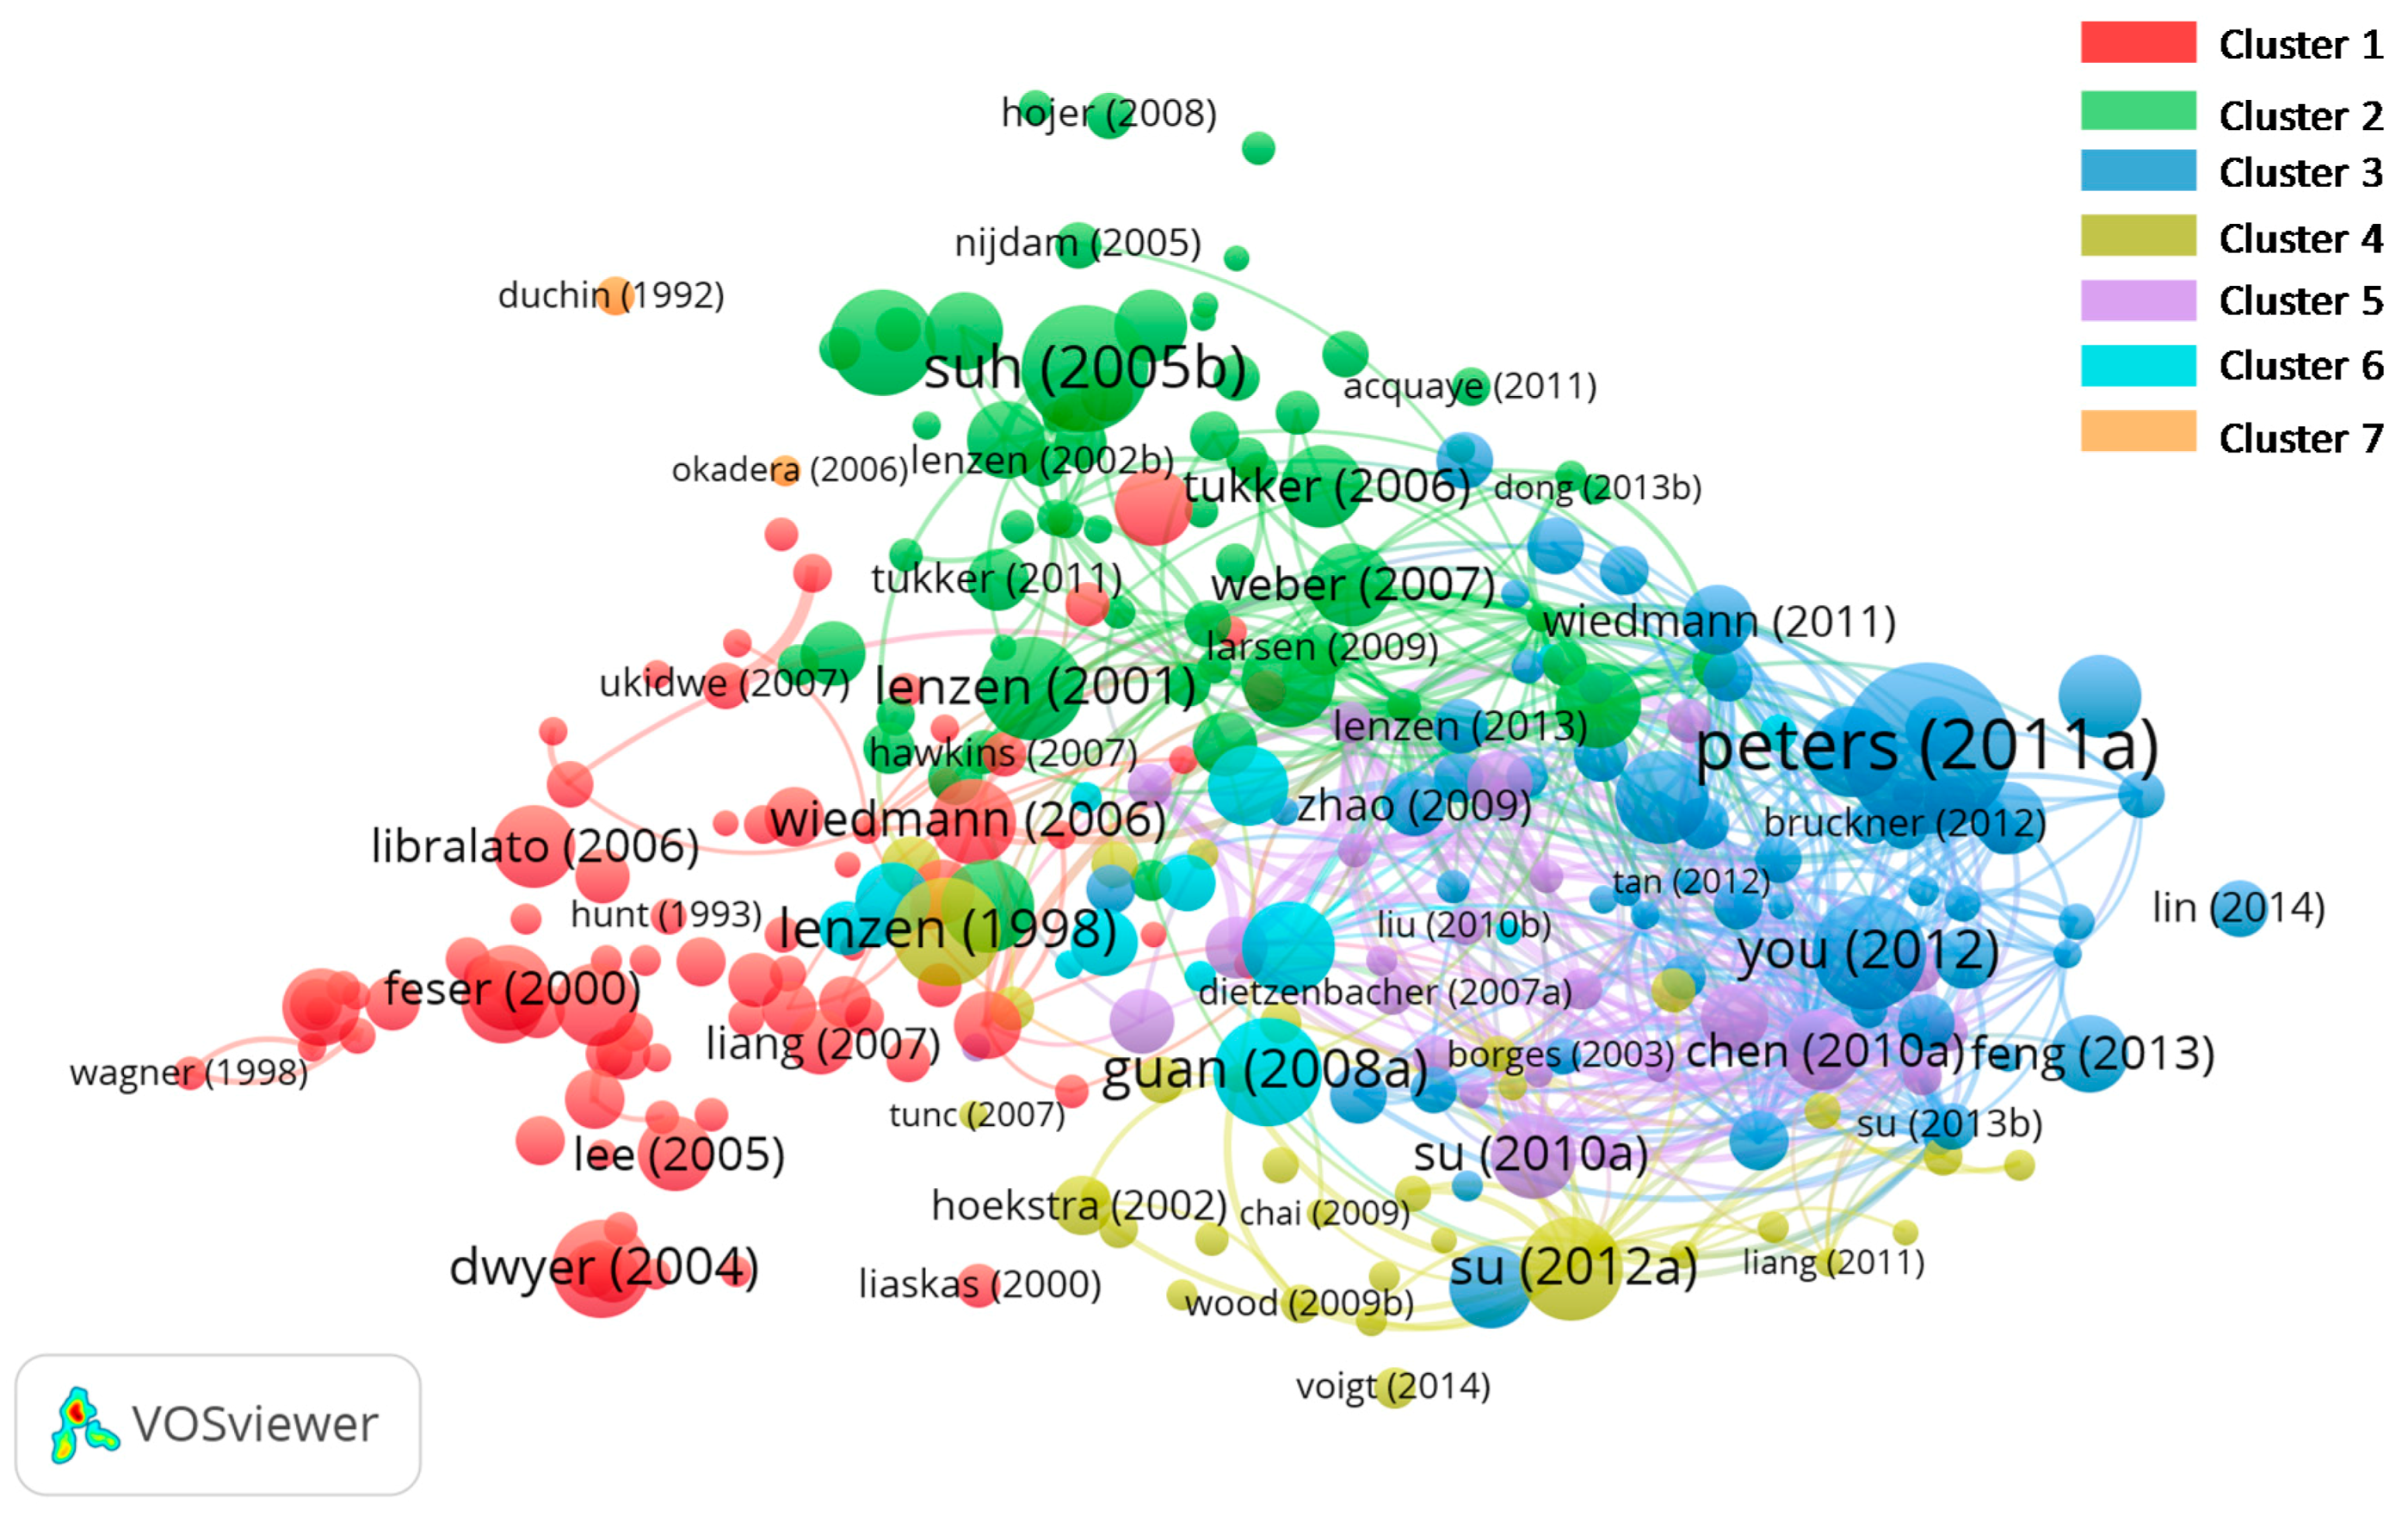
3.6. Bibliographic Coupling Analysis
Bibliographic coupling occurs when two documents share one or more references, which indicates that these two documents probably treat a related subject matter [
20]. The higher the coupling strength of these two documents, the more references they share [
21]. Bibliographic coupling analysis is able to explore the hidden relationships among articles and partly present the evolutionary pattern of the research frontiers in a specific topic [
22].
Figure 5 illustrates the bibliographic coupling network with the citation threshold set as 40, which consists of 277 articles. These nodes are classified into seven clusters in different colors. By analyzing the papers in each cluster, the specific research focus of each cluster can be discovered.
Table 7 lists the lead papers and summarizes the research focus for each of the seven clusters. The topical literature classification summarized in
Table 7 shows that input–output theory has tended to focus on environmental impacts, footprint analyses (such as the water, carbon, or ecological footprint), and energy flow analysis. Especially, multi-region input–output (MRIO) has been developed to measure resource use and pollution generation embodied in the interregional and international trade flows [
23]. Based on the environmental extended IO framework, many studies have investigated the driving forces of energy consumption and emission changes using structural decomposition studies. IO analysis is also referred as a tool to complement process-based life cycle assessment (LCA) to form a hybrid LCA approach, which has been the focus of research in the past 20 years [
3,
24]. In addition, according to the average publication year, it can be found that “carbon footprint” and “embodied emission” (Cluster 3) have attracted high attention and become research hotspots in recent years. Therefore, the primary insight that can be gained from this classification is the opportunity for additional research in the IO analysis field.
3.7. Keywords Analysis
Keywords provide important information that reflects the core content of the articles. There are a total of 5168 author keywords in 2565 publications. After merging similar keywords (i.e., “biofuel” and “biofuels” are merged into “biofuel”), a total number of 4597 keywords were gained for further analysis. Among them, 3543 (77.07%) of them were used only once, and 475 (10.33%) keywords were used twice. This indicates a research focus dispersion and a lack of continuity. Furthermore, 381 (8.29%) keywords appearing more than three times, representing the main research streams of input–output analysis.
Table 8 lists the top 20 author keywords in this field. “Input–output analysis” is the most frequently (1148 times) used keyword without a doubt. “Multi-region input–output analysis” is the second most frequently used keyword. “China” ranks the third, which indicates that the economic and environmental issues in China have attracted great concern. The keywords’ frequency change from 1990 to 2017 can be used to discover the evolution tendency of these studies, which can be divided into five periods. The rank of keywords’ frequency has been changed greatly. For example, “carbon footprint” appeared after 2004, and become a hot topic due to global intense concern regarding climate change and carbon emissions. “International trade” and “industrial ecology” have gained greater attention since 2000. “life-cycle assessment” and “structural decomposition analysis (SDA)” are the key research methods combined with IO theory. By contrast, the rank of “economic impact” has declined.
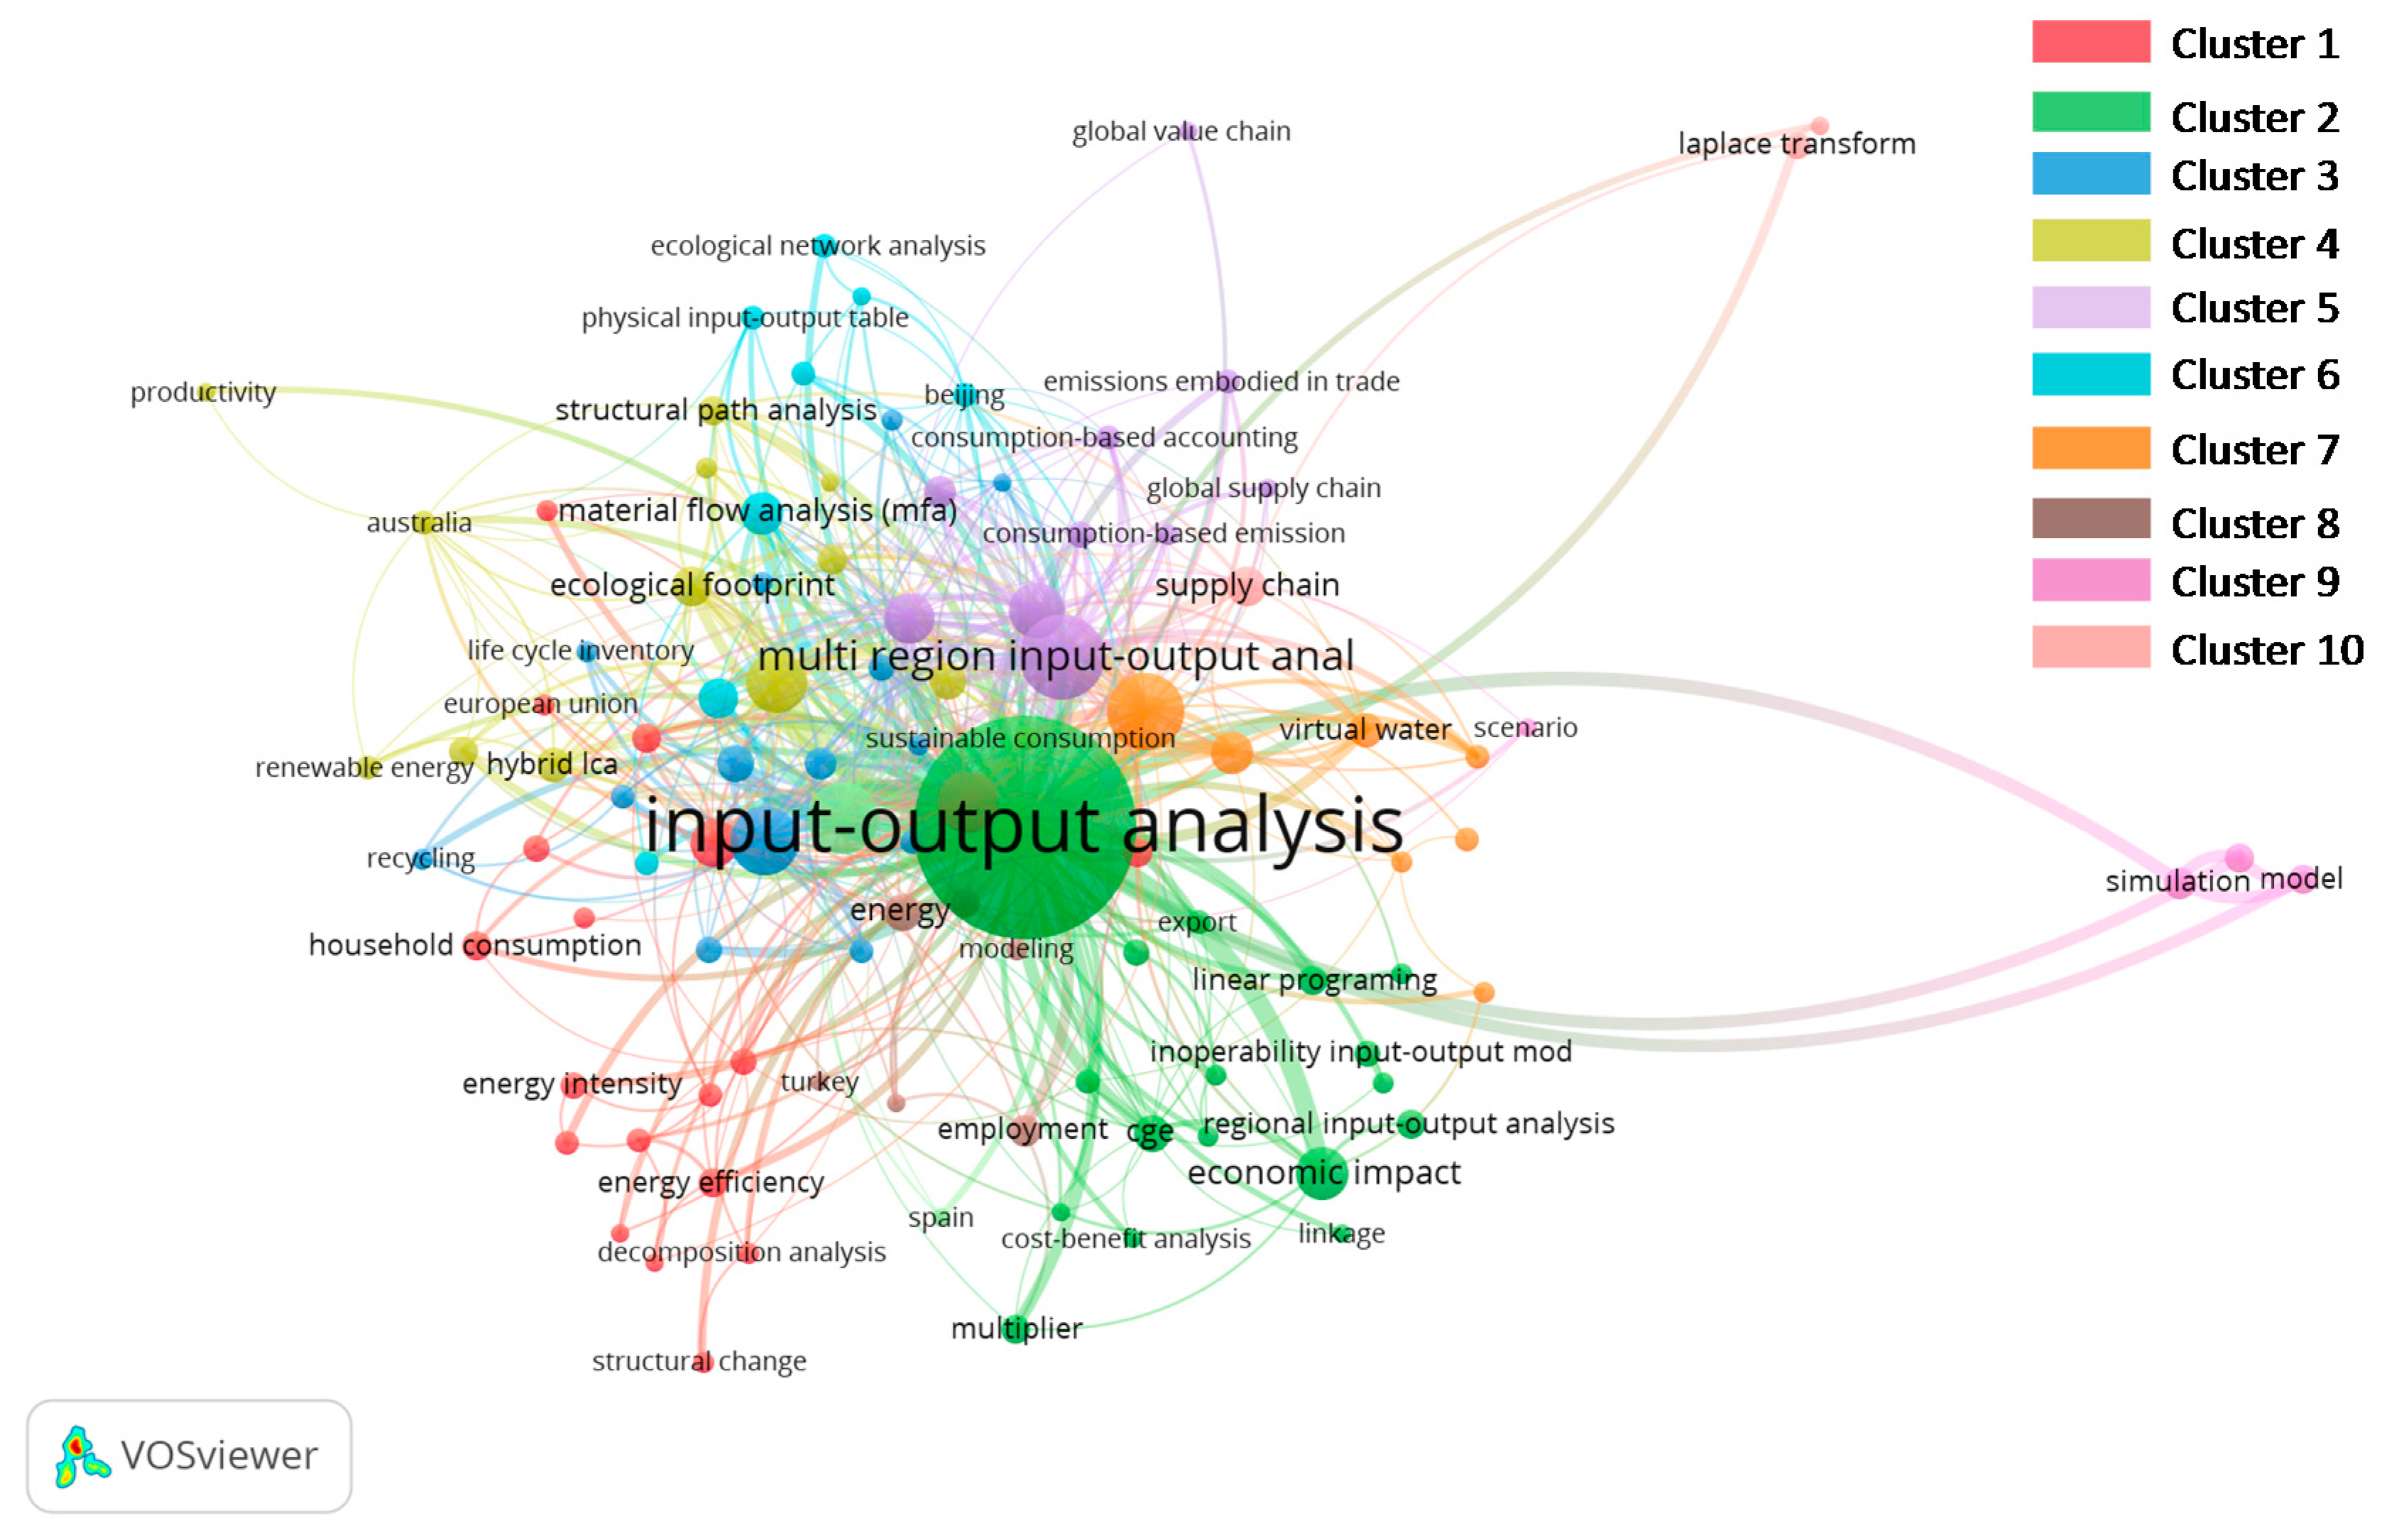
The co-occurrence network of high-frequency keywords (frequency more than 10) was visualized and clustered in
Figure 6 to discover the theme cluster. The keywords’ co-occurrence network consisted of 101 nodes and 914 links. It provides a useful indication of the main topics within the input–output analysis research field. According to the cluster results in VOS Viewer, 10 clusters vary in size and partially overlap. The detail research topics for each cluster are summarized in
Table 9. Some clusters mainly focus on its wide application, such as, greenhouse gas (GHG) emissions (Cluster 1), embodied emissions in international trade (Cluster 4), water footprint and virtual water (Cluster 6), or agriculture and biofuel (Cluster 8). Meanwhile, some clusters investigate the methodology combination; for example, Cluster 2 focuses on evaluating the regional economic impacts of various policy measures based on IO tables and the CGE model; Cluster 3 mainly utilizes the hybrid LCA method and structural path analysis; the literature in Cluster 5 is mainly based on material flow analysis (MFA) and LCI; Cluster 9 studies urban metabolism based on a physical input–output table and network analysis; and in Cluster 10, material requirements planning (MRP) theory is applied to combined with IO analysis and Laplace transforms for the economic evaluation in multi-level or multi-stage production inventory systems. Thus, IO analysis can also be applied to processes on the company level.
4. Conclusions
In this study, bibliometric analysis technology is developed to characterize the input–output analysis-related literature during the period of 1990–2017 based on the Science Citation Index and Social Sciences Citation Index databases. Bibliographic coupling analysis and keyword analysis are conducted to discover the evolution pattern of the research frontiers in the IO analysis field. Recently, the issues regarding environmental impacts and carbon/water/ecological footprint have increasingly received more focus, while the traditional economic impact analysis has gained less attention. The MRIO model has been extensively applied to measure resource utilization and pollution generation embodied in interregional and international trade flows, especially since the increased level of discussion surrounding carbon leakage and carbon responsibility distribution against the global climate change background. In addition, in terms of research methods, IO table/analysis is widely combined with other theories (e.g., CGE, MFA, LCI, and MRP theory) for more holistic and comprehensive analyses. The integration of different methods can help researchers deal with different and complex problems that cannot be handle by single method.
Through retrieving the SCI and SSCI databases and manual screening, 2565 articles in English were collected for bibliometric analysis. The results are indicated as follows. Firstly, the number of total publications in this field grew steadily in the early stage, from 1990 to 2003; in addition, with the growing concern for the environment and the development of environmental extended IO analysis, more and more papers were published from 2004 to 2017. Secondly, from a country point of view, China and the USA are the top two most active countries with large numbers of publications in this field. Especially, China has enjoyed rapid growth, and even surpassed the USA to rank first currently. The Chinese Academy of Sciences, Beijing Normal University, and The University of Sydney are top three most productive institutions, and The University of Leeds, with a high number of citations per publication, also has great influence in the research field of IO analysis. Thirdly, it is found that the top 15 journals contribute approximately 44% of the total publications in the IO analysis-related field, where The Journal of Cleaner Production was the most productive journal, followed by Ecological Economics and Energy Policy.
This study can be seen as a snapshot of the IO analysis-related research from 1990 to 2017, which could help researchers gain the interesting and meaningful information from abundant bibliometric data quickly. For example, the identified highly cited articles may prove a good starting point. Carefully monitoring the work of influential scholars in this field may provide some guidelines for future research. Identifying the mainstream journals may be useful when researchers choose to publish their studies in a proper channel. However, there are still some limitations in this study. (i) There are opportunities for a more detailed and in-depth analysis on the research gaps and future research directions. For example, meta-analysis is a statistical approach that combines the results from multiple studies in an effort to increase power (over individual studies) and improve the estimates of the size of the effect and/or resolve uncertainty when reports disagree. (ii) The data used in this study was collected from the WoS database, and the scope of data sources could be expanded to the studied selection of any language and other citation information, such as Scopus and Google Scholar, in the future. Further studies should mitigate these limitations.
Author Contributions
Y.X. and L.J. designed the manuscript; Y.X., L.J., and G.H. drafted the manuscript; B.Z., Y.X., and L.J. collected the data and revised the manuscript; G.H., Y.X., and L.J. checked the content and revised the manuscript. All authors made contributions to the study and the writing of the manuscript.
Funding
This research was funded by Natural Science Foundation of Beijing Municipality (No. 9174028), National Natural Science Foundation of China (No. U1765101, No. 71603016, and No. 51609003), and the Fundamental Research Funds for the Central Universities (FRF-BD-18-015A).
Conflicts of Interest
The authors declare no conflict of interest.
References
- Leontief, W. Die wirtschaft als Kreislauf. Arch. Sozialwissenschaft Soz. 1928, 60, 577–623. [Google Scholar]
- Leontief, W. Quantitative input and output relations in the economic systems of the United States. Rev. Econ. Stat. 1936, 18, 105–125. [Google Scholar] [CrossRef]
- Crawford, R.H.; Bontinck, P.A.; Stephan, A.; Wiedmann, T. Hybrid life cycle inventory methods—A review. J. Clean. Prod. 2018, 172, 1273–1288. [Google Scholar] [CrossRef]
- Song, J.; Yang, W.; Wang, S.; Wang, X.; Higano, Y.; Fang, K. Exploring potential pathways towards fossil energy-related GHG emission peak prior to 2030 for China: An integrated input-output simulation model. J. Clean. Prod. 2018, 178, 688–702. [Google Scholar] [CrossRef]
- Xu, M.; Li, C.; Wang, X.; Cai, Y.; Yue, W. Optimal water utilization and allocation in industrial sectors based on water footprint accounting in Dalian City, China. J. Clean. Prod. 2018, 176, 1283–1291. [Google Scholar] [CrossRef]
- Cheng, H.; Dong, S.; Li, F.; Yang, Y.; Li, S.; Li, Y. Multiregional input-output analysis of spatial-temporal evolution driving force for carbon emissions embodied in interprovincial trade and optimization policies: Case study of Northeast industrial district in China. Environ. Sci. Technol. 2018, 52, 346–358. [Google Scholar] [CrossRef] [PubMed]
- Liu, S.; Tian, X.; Cai, W.; Chen, W.; Wang, Y. How the transitions in iron and steel and construction material industries impact China’s CO2 emissions: Comprehensive analysis from an inter-sector linked perspective. Appl. Energy 2018, 211, 64–75. [Google Scholar] [CrossRef]
- Dixit, M.; Singh, S. Embodied energy analysis of higher education buildings using an input-output—Based hybrid method. Energy Build. 2018, 161, 41–45. [Google Scholar] [CrossRef]
- Owen, A.; Scott, K.; Barrett, J. Identifying critical supply chains and final products: An input-output approach to exploring the energy-water-food nexus. Appl. Energy 2018, 210, 632–642. [Google Scholar] [CrossRef]
- Van Raan, A.F.J. For your citations only? Hot topics in bibliometric analysis. Measurement 2005, 3, 50–62. [Google Scholar] [CrossRef]
- Du, H.; Li, B.; Brown, M.A.; Mao, G.; Rameezdeen, R.; Chen, H. Expanding and shifting trends in carbon market research: A quantitative bibliometric study. J. Clean. Prod. 2015, 103, 104–111. [Google Scholar] [CrossRef]
- Van Eck, N.J.; Waltman, L. Visualizing Bibliometric Networks; Springer International Publishing: New York, NY, USA, 2014. [Google Scholar]
- Ji, L.; Liu, C.W.; Huang, L.C.; Huang, G.H. The evolution of resources conservation and recycling over the past 30 years: A bibliometric overview. Resour. Conserv. Recycl. 2018, 134, 34–43. [Google Scholar] [CrossRef]
- De Nooy, W.; Mrvar, A.; Batagelj, V. Exploratory Network Analysis with Pajek; Cambridge University Press: Cambridge, UK, 2005. [Google Scholar]
- Chen, C. CiteSpace II: Detecting and visualizing emerging trends and transient patterns in scientific literature. J. Am. Soc. Inf. Sci. Technol. 2006, 57, 359–377. [Google Scholar] [CrossRef]
- Bastian, M.; Heymann, S.; Jacomy, M. Gephi: An open source software for exploring and manipulating networks. In Proceedings of the International AAAI Conference on Weblogs and Social Media, San, Jose, CA, USA, 17–20 May 2009. [Google Scholar]
- Van Eck, N.J.; Waltman, L. Software survey: Vosviewer, a computer program for bibliometric mapping. Scientometrics 2010, 84, 523–538. [Google Scholar] [CrossRef] [PubMed]
- Peters, G.P.; Minx, J.C.; Weber, C.L.; Edenhofer, O. Growth in emission transfers via international trade from 1990 to 2008. Proc. Natl. Acad. Sci. USA 2011, 108, 8903–8908. [Google Scholar] [CrossRef] [PubMed]
- Lenzen, M.; Murray, S.A. A modified ecological footprint method and its application to Australia. Ecol. Econ. 2001, 37, 229–255. [Google Scholar] [CrossRef]
- Kessler, M.M. Bibliographic coupling between scientific papers. Am. Doc. 1963, 14, 10–25. [Google Scholar] [CrossRef]
- Zhao, D.; Strotmann, A. Evolution of research activities and intellectual influences in information science 1996–2005: Introducing author bibliographic-coupling analysis. J. Am. Soc. Inf. Sci. Technol. 2008, 59, 2070–2086. [Google Scholar] [CrossRef]
- Boyack, K.W.; Klavans, R. Co-citation analysis, bibliographic coupling, and direct citation: Which citation approach represents the research front most accurately? J. Assoc. Inf. Sci. Technol. 2010, 61, 2389–2404. [Google Scholar] [CrossRef]
- Turner, K.; Lenzen, M.; Wiedmann, T.; Barrett, J. Examining the global environmental impact of regional consumption activities—Part 1: A technical note on combining input-output and ecological footprint analysis. Ecol. Econ. 2007, 62, 37–44. [Google Scholar] [CrossRef]
- Wiedmann, T.; Minx, J.; Barrett, J.; Wackernagel, M. Allocating ecological footprints to final consumption categories with input-output analysis. Ecol. Econ. 2006, 56, 28–48. [Google Scholar] [CrossRef]
- Lenzen, M. Errors in conventional and input-output-based life-cycle inventories. J. Ind. Ecol. 2000, 4, 127–148. [Google Scholar] [CrossRef]
- Lenzen, M. Structural path analysis of ecosystem networks. Ecol. Model. 2007, 200, 334–342. [Google Scholar] [CrossRef]
- Hawkins, T.; Hendrickson, C.; Higgins, C.; Matthews, H.S. A mixed-unit input-output model for environmental life-cycle assessment and material flow analysis. Environ. Sci. Technol. 2007, 41, 1024–1031. [Google Scholar] [CrossRef] [PubMed]
- Mcgregor, P.G.; Swales, J.K.; Turner, K. The CO2 ‘trade balance’ between scotland and the rest of the UK: Performing a multi-region environmental input-output analysis with limited data. Ecol. Econ. 2008, 66, 662–673. [Google Scholar] [CrossRef]
- Wiedmann, T. A first empirical comparison of energy Footprints embodied in trade -MRIO versus PLUM. Ecol. Econ. 2009, 68, 1975–1990. [Google Scholar] [CrossRef]
- Minx, J.C.; Wiedmann, T.; Wood, R.; Peters, G.P.; Lenzen, M.; Owen, A.; Scott, K.; Barrett, J.; Hubacek, K.; Baiocchi, G.; et al. Input-output analysis and carbon footprint: An overview of applications. Econ. Syst. Res. 2009, 21, 187–216. [Google Scholar] [CrossRef]
- Hertwich, E.G. The fife cycle environmental impacts of consumption. Econ. Syst. Res. 2011, 23, 27–47. [Google Scholar] [CrossRef]
- Wiedmann, T.O.; Lenzen, M.; Barrett, J.R. Companies on the scale comparing and benchmarking the sustainability performance of businesses. J. Ind. Ecol. 2010, 13, 361–383. [Google Scholar] [CrossRef]
- Munksgaard, J.; Wier, M.; Lenzen, M.; Dey, C. Using input-output analysis to measure the environmental pressure of consumption at different spatial levels. J. Ind. Ecol. 2005, 9, 169–185. [Google Scholar] [CrossRef]
- Wiedmann, T.; Wilting, H.C.; Lenzen, M.; Lutter, S.; Palm, V. Quo Vadis MRIO? Methodological, data and institutional requirements for multi-region input-output analysis. Ecol. Econ. 2011, 70, 1937–1945. [Google Scholar]
- Andrew, R.; Peters, G.P.; Lennox, J. Approximation and regional aggregation in multi-regional input-output analysis for national carbon footprint accounting. Econ. Syst. Res. 2009, 21, 311–335. [Google Scholar] [CrossRef]
- Su, B.; Ang, B.W.; Low, M. Input-output analysis of CO2 emissions embodied in trade and the driving forces: Processing and normal exports. Ecol. Econ. 2013, 88, 119–125. [Google Scholar] [CrossRef]
- Peters, G.P.; Davis, S.J.; Andrew, R. A synthesis of carbon in international trade. Biogeosciences 2012, 9, 3247–3276. [Google Scholar] [CrossRef]
- Kanemoto, K.; Lenzen, M.; Peters, G.P.; Moran, D.D.; Geschke, A. Frameworks for comparing emissions associated with production, consumption, and international trade. Environ. Sci. Technol. 2012, 46, 172–179. [Google Scholar] [CrossRef] [PubMed]
- Liu, H.; Xi, Y.; Guo, J.; Li, X. Energy embodied in the international trade of China: An energy input-output analysis. Energy Policy 2010, 38, 3957–3964. [Google Scholar] [CrossRef]
- Su, B.; Ang, B.W. Structural decomposition analysis applied to energy and emissions: Some methodological developments. Energy Econ. 2012, 34, 177–188. [Google Scholar] [CrossRef]
- Su, B.; Ang, B.W. Structural decomposition analysis applied to energy and emissions: Aggregation issues. Econ. Syst. Res. 2012, 24, 299–317. [Google Scholar] [CrossRef]
- Weber, C.L. Measuring structural change and energy use: Decomposition of the US economy from 1997 to 2002. Energy Policy 2009, 37, 1561–1570. [Google Scholar] [CrossRef]
- Wood, R.; Lenzen, M. Structural path decomposition. Energy Econ. 2009, 31, 335–341. [Google Scholar] [CrossRef]
- Guo, S.; Shao, L.; Chen, H.; Li, Z.; Liu, J.B.; Xu, F.X.; Li, J.S.; Han, M.Y.; Meng, J.; Chen, Z.M.; et al. Inventory and input-output analysis of CO2 emissions by fossil fuel consumption in Beijing 2007. Ecol. Inform. 2012, 12, 93–100. [Google Scholar] [CrossRef]
- Chen, G.Q.; Chen, Z.M. Carbon emissions and resources use by Chinese economy 2007: A 135-sector inventory and input-output embodiment. Commun. Nonlinear Sci. Numer. Simul. 2010, 15, 3647–3732. [Google Scholar] [CrossRef]
- Chen, G.Q.; Zhang, B. Greenhouse gas emissions in China 2007: Inventory and input-output analysis. Energy Policy 2010, 38, 6180–6193. [Google Scholar] [CrossRef]
- Su, B.; Huang, H.C.; Ang, B.W.; Zhou, P. Input-output analysis of CO2 emissions embodied in trade: The effects of sector aggregation. Energy Econ. 2010, 32, 166–175. [Google Scholar] [CrossRef]
- Serrano, M.; Dietzenbacher, E. Responsibility and trade emission balances: An evaluation of approaches. Ecol. Econ. 2010, 69, 2224–2232. [Google Scholar] [CrossRef]
- Druckman, A.; Jackson, T. The carbon footprint of UK households 1990–2004: A socio-economically disaggregated, quasi-multi-regional input-output model. Ecol. Econ. 2009, 68, 2066–2077. [Google Scholar] [CrossRef]
- Lenzen, M. Aggregation versus disaggregation input-output analysis of the environment. Econ. Syst. Res. 2011, 23, 73–89. [Google Scholar] [CrossRef]
- Hubacek, K.; Guan, D.; Barrett, J.; Wiedmann, T. Environmental implications of urbanization and lifestyle change in China: Ecological and Water Footprints. J. Clean. Prod. 2009, 17, 1241–1248. [Google Scholar] [CrossRef]
- Guan, D.; Hubacek, K.; Weber, C.L.; Peters, G.P.; Reiner, D.M. The drivers of Chinese CO2 emissions from 1980 to 2030. Glob. Environ. Chang. 2008, 18, 626–634. [Google Scholar] [CrossRef]
- Liu, H.T.; Guo, J.E.; Qian, D.; Xi, Y.M. Comprehensive evaluation of household indirect energy consumption and impacts of alternative energy policies in China by input-output analysis. Energy Policy 2009, 37, 3194–3204. [Google Scholar] [CrossRef]
- Duchin, F. Industrial input-output-analysis-implications for industrial ecology. Proc. Natl. Acad. Sci. USA 1992, 89, 851–855. [Google Scholar] [CrossRef] [PubMed]
- Okadera, T.; Watanabe, M.; Xu, K. Analysis of water demand and water pollutant discharge using a regional input-output table: An application to the City of Chongqing, upstream of the Three Gorges Dam in China. Ecol. Econ. 2006, 58, 221–237. [Google Scholar] [CrossRef]
© 2018 by the authors. Licensee MDPI, Basel, Switzerland. This article is an open access article distributed under the terms and conditions of the Creative Commons Attribution (CC BY) license (http://creativecommons.org/licenses/by/4.0/).


