Electric Power Investment Risk Assessment for Belt and Road Initiative Nations

Abstract
:1. Introduction
2. Materials and Methods
2.1. Indicator System for the Evaluation of Electric Power Investment Risk
2.2. Fuzzy Integrated Evaluation Model for National Investment Risk Based on Entropy Weight
2.3. Research Countries for Electric Power Investment Risk Assessment
3. Results and Analysis of the Risk
3.1. National Investment Risk Assessment Results Based on a Four-Dimension Evaluation System
3.2. National Electric Power Investment Risk Results Based on a Nine-Dimension Evalustion System
4. Conclusions and Implications
4.1. Research Conclusions
4.2. Policy Proposal
Author Contributions
Funding
Conflicts of Interest
Appendix A

| Country | Original Data | Standardized Data | ||||||||
|---|---|---|---|---|---|---|---|---|---|---|
| Coal Surplus Degree | Proportion of Electric Coal | Coal Power Planning | Proportion of Coal and Electricity | Coal Power Growth | Coal Surplus Degree | Proportion of Electric Coal | Coal Power Planning | Proportion of Coal and Electricity | Coal Power Growth | |
| Pakistan | 735.73 | 1.85% | 12,385 | 0.16 | 33.64% | 0.6905 | 0.0000 | 0.4551 | 1.0000 | 0.3074 |
| Poland | 178.57 | 67.76% | 9090 | 82.99 | −0.37% | 0.4307 | 0.6871 | 0.4106 | 0.1078 | 0.1016 |
| Korea | 184.67 | 69.72% | 7359 | 42.41 | 1.67% | 0.4356 | 0.7075 | 0.3826 | 0.5449 | 0.1139 |
| Russia | 431.46 | 46.52% | 720 | 14.90 | −0.88% | 0.5779 | 0.4656 | 0.1763 | 0.8412 | 0.0985 |
| Philippines | 44.52 | 79.04% | 12,141 | 42.78 | 9.85% | 0.2711 | 0.8046 | 0.4521 | 0.5409 | 0.1634 |
| Kazakhstan | 238.85 | 54.71% | 636 | 71.95 | 2.89% | 0.4746 | 0.5510 | 0.1692 | 0.2268 | 0.1213 |
| Cambodia | 0.00 | 97.79% | 3325 | 28.21 | 148.06% | 0.0000 | 1.0000 | 0.2936 | 0.6978 | 1.0000 |
| Czech | 79.19 | 72.74% | 660 | 51.46 | −3.48% | 0.3284 | 0.7389 | 0.1713 | 0.4475 | 0.0827 |
| Malaysia | 70.16 | 89.21% | 2600 | 37.86 | 7.30% | 0.3155 | 0.9106 | 0.2705 | 0.5940 | 0.1480 |
| Bangladesh | 314.81 | 11.50% | 21,998 | 1.97 | 9.80% | 0.5203 | 0.1006 | 0.5512 | 0.9805 | 0.1631 |
| Burma | 9.44 | 15.73% | 2030 | 2.02 | −17.15% | 0.1617 | 0.1447 | 0.2491 | 0.9799 | 0.0000 |
| South Africa | 137.75 | 64.00% | 11,892 | 93.00 | −0.72% | 0.3950 | 0.6479 | 0.4490 | 0.0000 | 0.0994 |
| Thailand | 167.83 | 51.87% | 5256 | 21.64 | 6.92% | 0.4219 | 0.5215 | 0.3420 | 0.7686 | 0.1457 |
| Turkey | 256.33 | 53.91% | 42,890 | 30.27 | 9.71% | 0.4859 | 0.5426 | 0.6886 | 0.6757 | 0.1625 |
| Ukraine | 1130.36 | 59.44% | 1320 | 38.74 | 0.27% | 0.7967 | 0.6003 | 0.2158 | 0.5845 | 0.1054 |
| Singapore | 0.00 | 62.90% | 0 | 1.10 | 25.29% | 0.0000 | 0.6364 | 0.0000 | 0.9899 | 0.2569 |
| New Zealand | 2235.01 | 32.97% | 0 | 4.50 | 4.62% | 1.0000 | 0.3244 | 0.0000 | 0.9532 | 0.1317 |
| Israel | 0.00 | 96.80% | 0 | 49.56 | −2.91% | 0.0000 | 0.9897 | 0.0000 | 0.4680 | 0.0862 |
| India | 162.28 | 67.03% | 131,359 | 75.08 | 10.19% | 0.4172 | 0.6795 | 1.0000 | 0.1931 | 0.1655 |
| Indonesia | 65.24 | 76.60% | 37,905 | 52.65 | 15.41% | 0.3079 | 0.7792 | 0.6608 | 0.4346 | 0.1970 |
| Vietnam | 90.34 | 52.90% | 46,525 | 24.53 | 14.60% | 0.3432 | 0.5321 | 0.7075 | 0.7375 | 0.1922 |
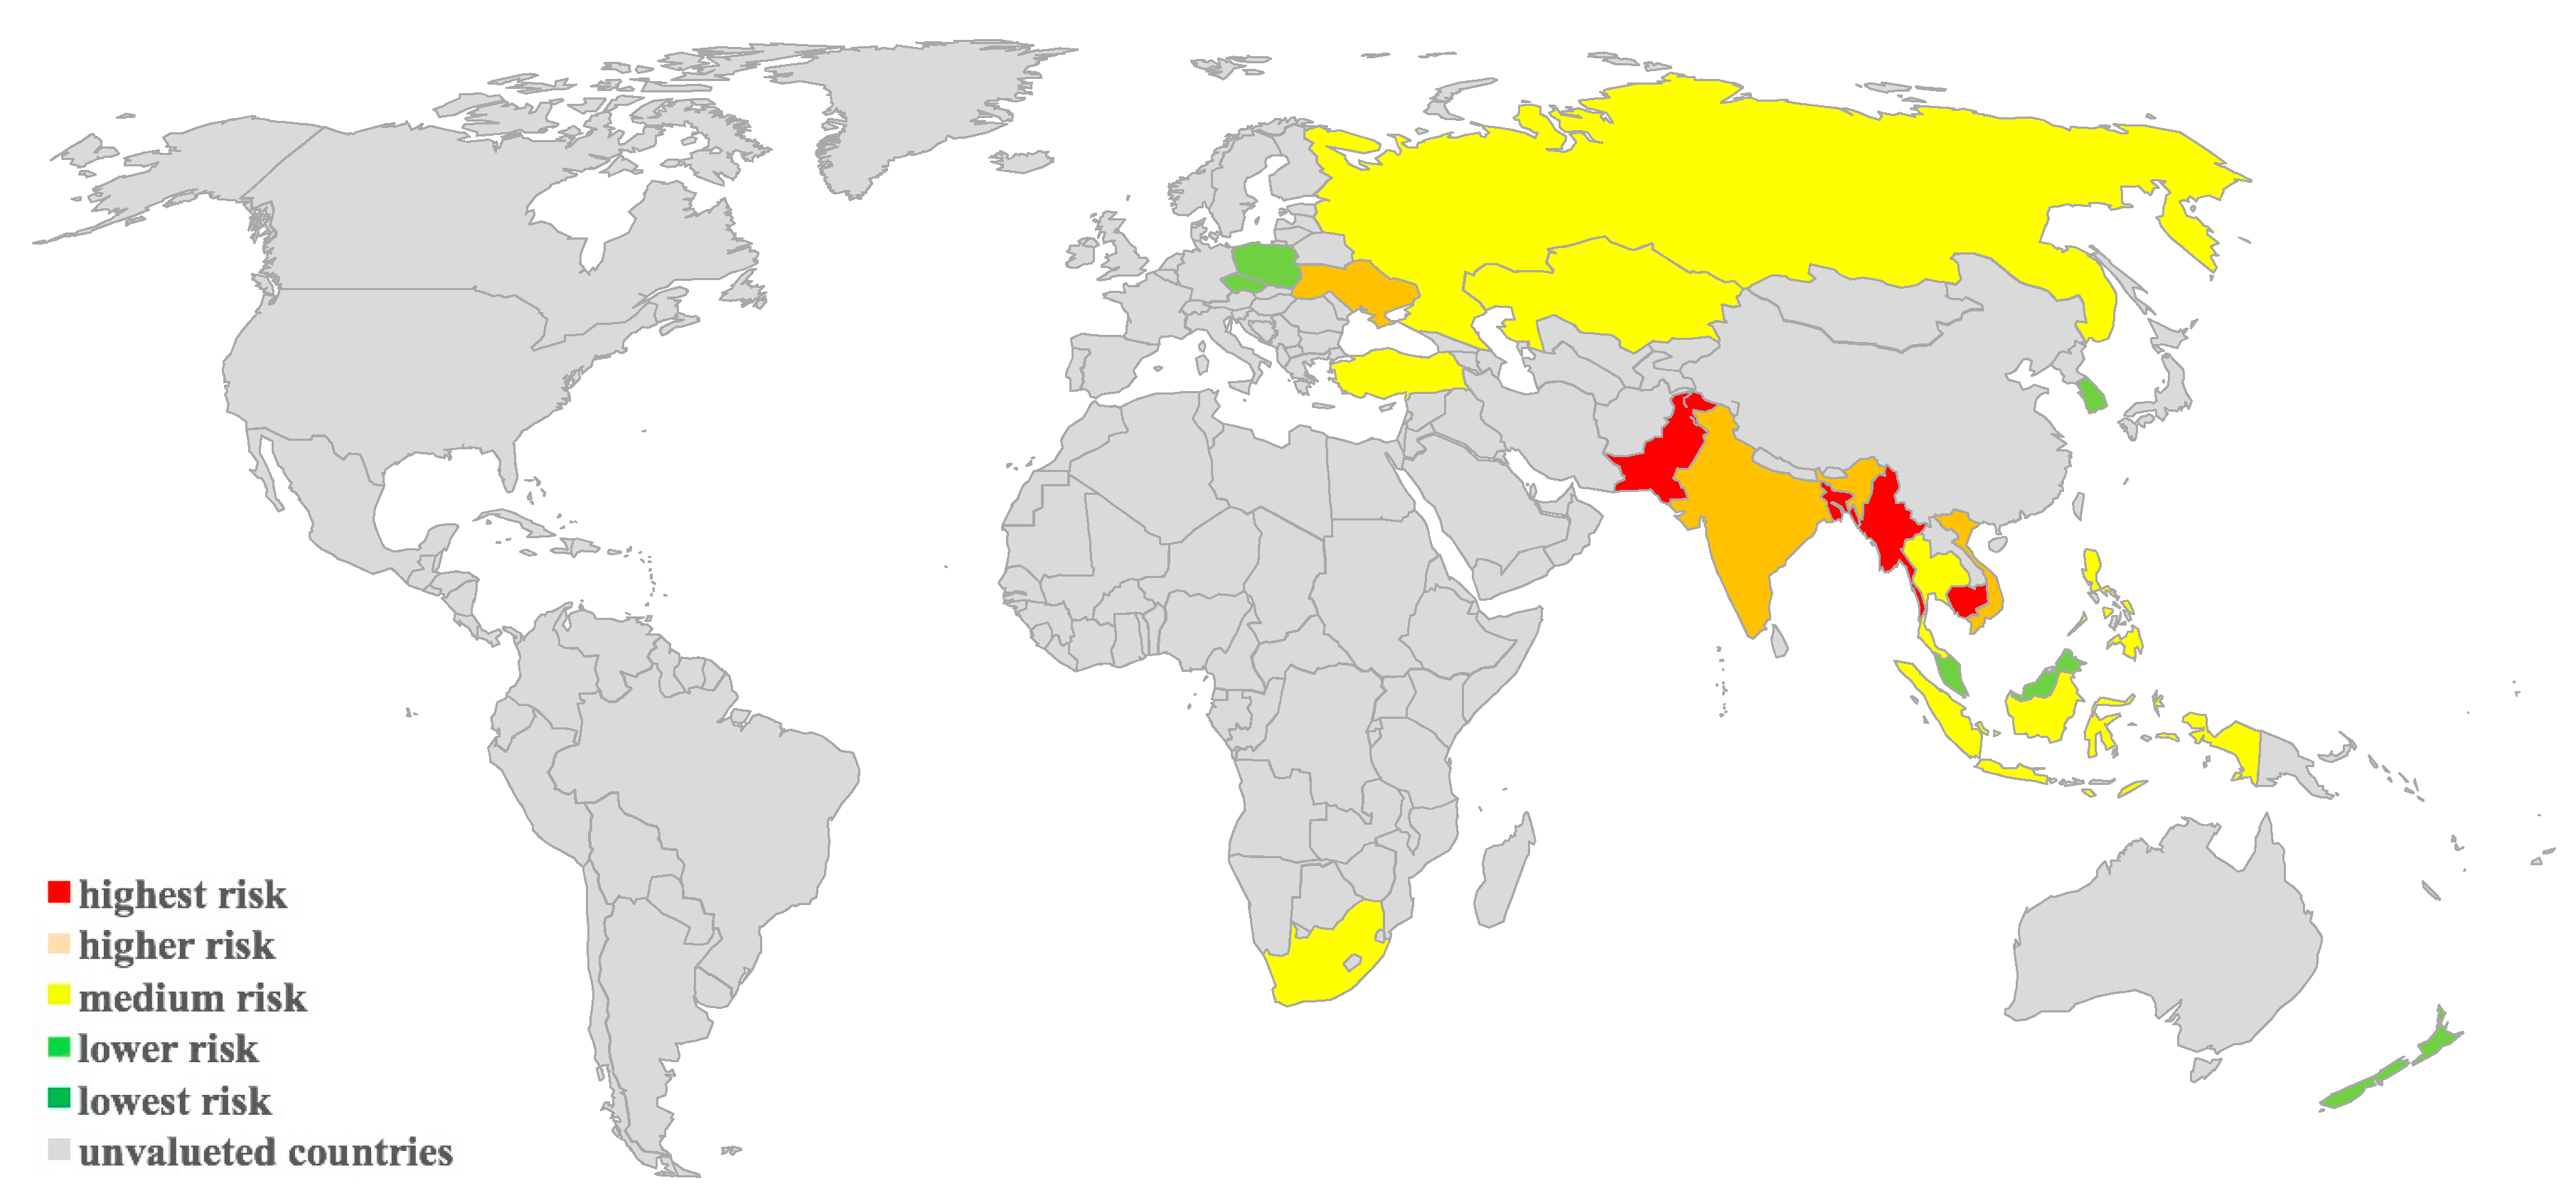
| Country | Highest Risk | Higher Risk | Medium Risk | Lower Risk | Lowest Risk | Risk Level |
|---|---|---|---|---|---|---|
| Poland | 0.5334 | 0.6465 | 0.7917 | 0.9111 | 0.2835 | lower risk |
| Korea | 0.4876 | 0.6055 | 0.7297 | 0.8750 | 0.2800 | lower risk |
| New Zealand | 0.3473 | 0.4099 | 0.4925 | 0.6078 | 0.2855 | lower risk |
| Malaysia | 0.6033 | 0.7022 | 0.8205 | 0.8755 | 0.2582 | lower risk |
| Czech | 0.4697 | 0.6016 | 0.7802 | 0.9444 | 0.3027 | lower risk |
| Singapore | 0.2178 | 0.2263 | 0.2501 | 0.4178 | 0.2939 | lower risk |
| Israel | 0.5487 | 0.6066 | 0.6551 | 0.7862 | 0.2730 | lower risk |
| Philippines | 0.6994 | 0.8454 | 0.8876 | 0.8046 | 0.2162 | medium risk |
| Russia | 0.7309 | 0.7918 | 0.8024 | 0.7225 | 0.1945 | medium risk |
| Kazakhstan | 0.6868 | 0.7554 | 0.7913 | 0.7102 | 0.2032 | medium risk |
| Thailand | 0.6967 | 0.8419 | 0.9167 | 0.8027 | 0.1994 | medium risk |
| Turkey | 0.6907 | 0.8087 | 0.8934 | 0.8622 | 0.2215 | medium risk |
| Indonesia | 0.7296 | 0.8747 | 0.8992 | 0.7536 | 0.1916 | medium risk |
| South Africa | 0.7215 | 0.7695 | 0.8326 | 0.7586 | 0.1927 | medium risk |
| India | 0.8036 | 0.8745 | 0.7704 | 0.6806 | 0.1755 | higher risk |
| Vietnam | 0.7121 | 0.7976 | 0.7511 | 0.7208 | 0.2090 | higher risk |
| Ukraine | 0.8433 | 0.8561 | 0.7755 | 0.6221 | 0.1464 | higher risk |
| Cambodia | 0.7352 | 0.6834 | 0.5599 | 0.5007 | 0.1559 | highest risk |
| Burma | 0.8182 | 0.7406 | 0.5793 | 0.4972 | 0.1433 | highest risk |
| Pakistan | 0.8806 | 0.8189 | 0.6350 | 0.5016 | 0.1247 | highest risk |
| Bangladesh | 0.8539 | 0.8324 | 0.6513 | 0.5347 | 0.1349 | highest risk |
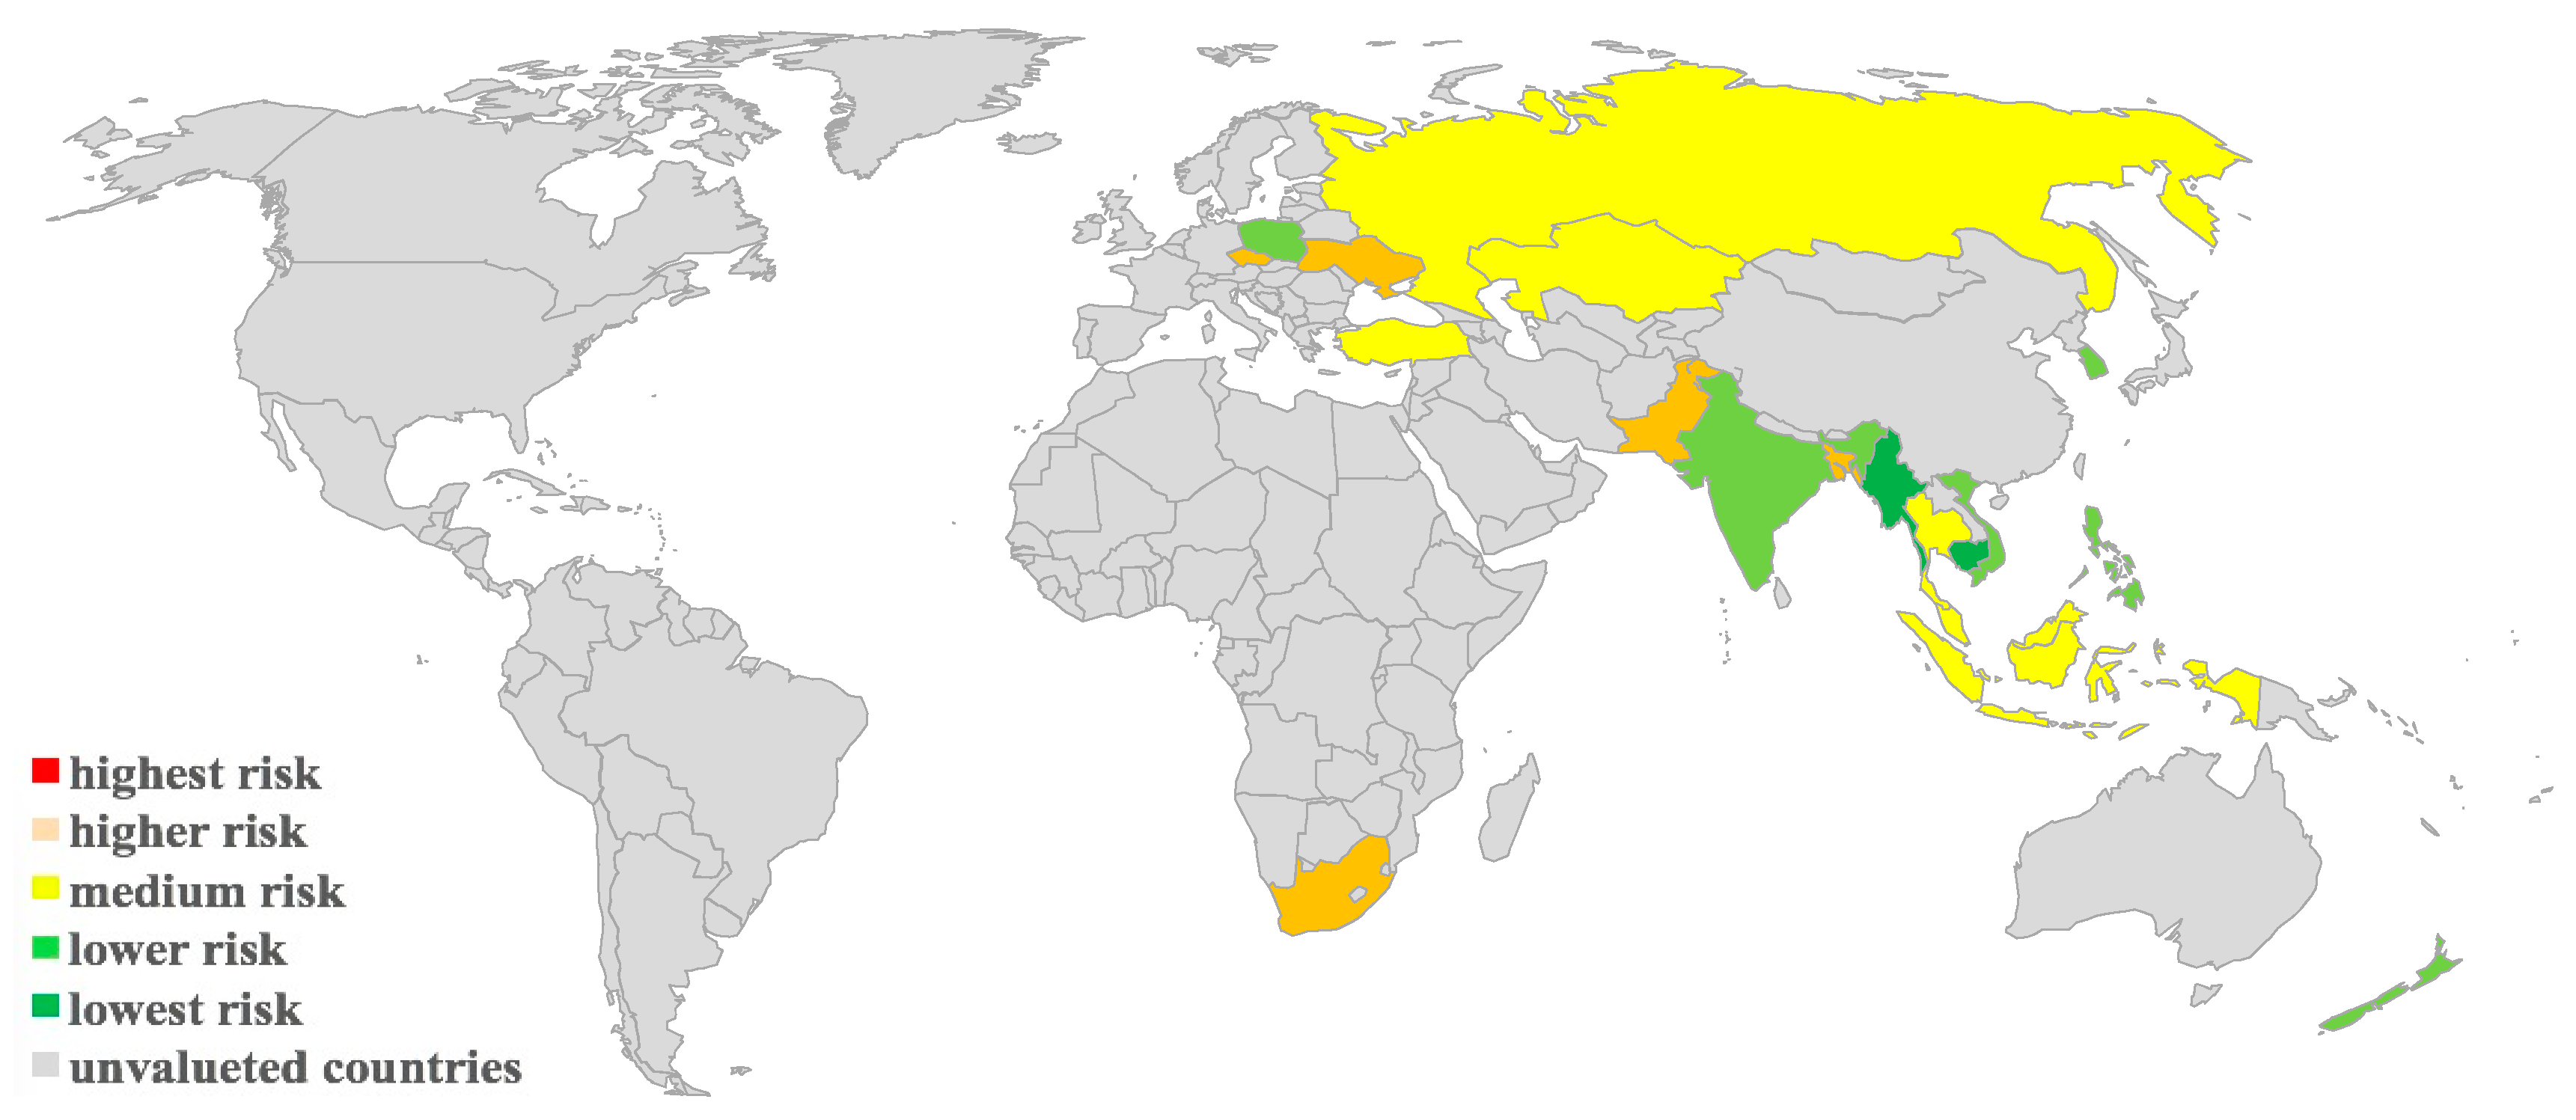
| Country | Highest Risk | Higher Risk | Medium Risk | Lower Risk | Lowest Risk | Risk Level |
|---|---|---|---|---|---|---|
| Cambodia | 0.4676 | 0.4409 | 0.4091 | 0.3954 | 0.6619 | lowest risk |
| Burma | 0.5685 | 0.5101 | 0.4446 | 0.4455 | 0.6102 | lowest risk |
| Philippines | 0.7033 | 0.7783 | 0.8225 | 0.8303 | 0.6865 | lower risk |
| Vietnam | 0.6662 | 0.7467 | 0.7757 | 0.8232 | 0.6671 | lower risk |
| Korea | 0.7249 | 0.7798 | 0.8154 | 0.8212 | 0.5894 | lower risk |
| Poland | 0.7082 | 0.7757 | 0.7953 | 0.8186 | 0.5805 | lower risk |
| India | 0.6946 | 0.7345 | 0.7288 | 0.7627 | 0.7103 | lower risk |
| New Zealand | 0.6243 | 0.6575 | 0.6665 | 0.6759 | 0.5762 | lower risk |
| Thailand | 0.7220 | 0.8602 | 0.9427 | 0.8804 | 0.5830 | medium risk |
| Malaysia | 0.7098 | 0.8285 | 0.8829 | 0.8664 | 0.6285 | medium risk |
| Indonesia | 0.7443 | 0.8633 | 0.8691 | 0.8071 | 0.5874 | medium risk |
| Turkey | 0.7522 | 0.8441 | 0.8620 | 0.8255 | 0.5621 | medium risk |
| Kazakhstan | 0.7287 | 0.7845 | 0.7765 | 0.7350 | 0.5609 | medium risk |
| Russia | 0.7164 | 0.7733 | 0.7833 | 0.7664 | 0.5599 | medium risk |
| Ukraine | 0.8418 | 0.8915 | 0.8132 | 0.6885 | 0.4137 | higher risk |
| South Africa | 0.7376 | 0.7953 | 0.8027 | 0.7826 | 0.6521 | higher risk |
| Czech | 0.7333 | 0.7877 | 0.7848 | 0.7805 | 0.5369 | higher risk |
| Bangladesh | 0.7198 | 0.7512 | 0.7055 | 0.6947 | 0.6349 | higher risk |
| Pakistan | 0.7307 | 0.7354 | 0.7196 | 0.7224 | 0.5421 | higher risk |
| Singapore | 0.6351 | 0.6493 | 0.5998 | 0.6059 | 0.5720 | higher risk |
| Israel | 0.7953 | 0.7778 | 0.6987 | 0.6562 | 0.4446 | highest risk |
References
- Ming, Z. The power cooperation between China and Southeast Asia under the “One Belt, One Road” strategy. China Power Enterp. Manag. 2015, 23, 75–77. [Google Scholar]
- Tianrong, W. Lighting up the “Belt and Road”—A new chapter in the development of “going out” for Chinese power companies. China Power Enterp. Manag. 2015, 13, 26–28. [Google Scholar]
- Yi, W. Chinese power companies carry out investment business in 52 countries along the “Belt and Road”. Chin. Electr. Power 2017, 08–22. [Google Scholar]
- World Energy Outlook 2017. Available online: https://webstore.iea.org/world-energy-outlook-2017 (accessed on 20 August 2018).
- Grinmsy, D.; Lewis, M.K. Evaluating the risks of public private partnerships for infrastructure projects. Int. J. Proj. Manag. 2002, 20, 227–231. [Google Scholar]
- Coase, R.H. The problem of social cost. Int. J. Proj. Manag. 2002, 20, 227–231. [Google Scholar]
- Shakouri, G.H.; Eghlimi, M.; Manzoor, D. Economically optimized electricity trade modeling: Iran-Turkey case. Energy Policy 2009, 37, 472–483. [Google Scholar] [CrossRef]
- Liu, Y.A.; Xiao, G. Purchase allocation and demand bidding in electric Power markets. IEEE Trans. Power Syst. 2003, 18, 106–112. [Google Scholar]
- Dockner, E.J.; Kucsera, D.; Rammerstorfer, M. Investment, firm value, and risk for a system operator balancing energy grids. Energy Econ. 2013, 37, 182–192. [Google Scholar] [CrossRef]
- Farfan, J.; Breyer, C. Structural changes of global power generation capacity towards sustainability and the risk of stranded investments supported by a sustainability indicator. J. Clean. Prod. 2017, 141, 370–384. [Google Scholar] [CrossRef]
- Gal, N.; Milstein, I.; Tishler, A.; Woo, C.K. Fuel cost uncertainty, capacity investment and price in a competitive electricity market. Energy Econ. 2017, 61, 233–240. [Google Scholar] [CrossRef]
- Tietjen, O.; Pahle, M.; Fuss, S. Investment risks in power generation: A comparison of fossil fuel and renewable energy dominated markets. Energy Econ. 2016, 58, 174–185. [Google Scholar] [CrossRef]
- Liwei, Z. Structure Analysis of Power Investment Risk Elements and the Grade Synthesis Appraises of Risk. Master’s Thesis, Harbin Institute of Technology, Harbin, China, July 2007. [Google Scholar]
- Min, L.; Lixia, W. Risk management framework for power generation companies in power market environment. Power Syst. Autom. 2004, 28, 1–6. [Google Scholar]
- Chongqing, K.; Lichao, B. Risk decisions of power producers in the power market. Proc. CSEE 2004, 24, 1–6. [Google Scholar]
- Zhang, M.M.; Zhou, P.; Zhou, D.Q. A real options model for renewable energy investment with application to solar photovoltaic power generation in China. Energy Econ. 2016, 59, 213–226. [Google Scholar] [CrossRef]
- Duan, F.; Ji, Q.; Liu, B.Y.; Fan, Y. Energy investment risk assessment for nations along China’s Belt & Road Initiative. J. Clean. Prod. 2018, 170, 538–547. [Google Scholar]
- Yuan, J.; Wu, M.; Zhang, W.; Guo, Y.; Xiong, M. Coal Power Environmental Stress Testing in China. Sustainability 2018, 10, 2151. [Google Scholar] [CrossRef]
- Yuan, J.H.; Lei, Q.; Xiong, M.P.; Guo, J.S. The prospective of coal power in China: Will it reach a plateau in the coming decade? Energy Policy 2016, 98, 495–504. [Google Scholar] [CrossRef]
- Yuan, J.H.; Ding, W.; Hu, Z.G. Analysis of cointegration and fluctuations of power consumption and China’s economic development. Grid Technol. 2006, 9, 10–15. [Google Scholar]
- Yuan, J.H.; Li, P.; Wang, Y.; Liu, Q. Coal power overcapacity and investment bubble in China during 2015–2020. Energy Policy 2016, 97, 136–144. [Google Scholar] [CrossRef]
- Hao, C.; Guo, Y.; Yuan, J.; Wu, M.; Li, D.; Zhou, Y.; Kang, J. ESG and Corporate Financial Performance: Empirical Evidence from China’s Listed Power Generation Companies. Sustainability 2018, 10, 2607. [Google Scholar] [CrossRef]
- Yuan, J.; Xu, Y.; Hu, Z.; Zhao, C.; Xiong, M.; Guo, J. Peak energy consumption and CO2 emissions in China. Energy Policy 2014, 68, 508–523. [Google Scholar] [CrossRef]
- Na, C.N.; Yuan, J.H.; Xu, Y.; Hu, Z. Penetration of clean coal technology and its impact on China’s power industry. Energy Strategy Rev. 2015, 7, 1–8. [Google Scholar] [CrossRef]
- Yuan, J.; Zhao, C.; Yu, S.; Hu, Z. Electricity consumption and economic growth in China: Cointegration and co-feature analysis. Energy Econ. 2007, 29, 1179–1191. [Google Scholar] [CrossRef]
- Lou, C.W. A Sovereign Credit Risk Assessment Study on the Basis of the Integrated Method of Multi-Objective Decision Making and Data Mining. Ph.D. Thesis, University of Electronic Science and Technology of China, Chengdu, China, April 2012. [Google Scholar]
- Herring, R. Managing International Risk; Cambridge University Press: Cambridge, UK, 1983; pp. 56–97. [Google Scholar]
- Cosset, J.C.; Suret, J.M. Political risk and the benefit of international portfolio diversification. J. Int. Bus. Stud. 1995, 26, 301–318. [Google Scholar] [CrossRef]
- Wang, C. Comparative study on national risk assessment index system. Econ. Manag. Res. 2008, 6, 51–55. [Google Scholar]
- World Development Indicator. Available online: https://datacatalog.worldbank.org/dataset/world-development-indicators (accessed on 20 August 2018).
- Index of Economic Freedom. Available online: https://www.heritage.org/index/about (accessed on 20 August 2018).
- Numbeo. Available online: https://www.numbeo.com/common/ (accessed on 20 August 2018).
- Wordwide Governance Indicators. Available online: http://info.worldbank.org/governance/wgi/index.aspx#home (accessed on 20 August 2018).
- World Bank Open Data. Available online: https://data.worldbank.org (accessed on 20 August 2018).
- National Bureau of Statistics of China. Available online: http://www.stats.gov.cn/english/ (accessed on 20 August 2018).
- National Information Center “Belt and Road” Big Data Center. “Belt and Road” Big Data Report; The Commercial Press: Beijing, China, 2016; pp. 1–27. [Google Scholar]
- Chinese Foreign Ministry. Available online: http://www.fmprc.gov.cn/web/ (accessed on 20 August 2018).
- International Energy Agency. Available online: https://www.iea.org (accessed on 20 August 2018).
- Aqueduct Projected Water Stress Country Rankings. Available online: http://www.wri.org/publication/aqueduct-projected-water-stress-country-rankings (accessed on 20 August 2018).
- World Health Organization. Available online: http://www.who.int (accessed on 20 August 2018).
- Intended Nationally Determined Contributions—Post2020 Climate Action Commitments. Available online: http://www.wri.org/our-work/topics/indcs (accessed on 20 August 2018).
- U.S. Energy Information Administration. Available online: https://www.eia.gov (accessed on 20 August 2018).
- Global Coal Plant Tracker. Available online: https://endcoal.org/global-coal-plant-tracker/ (accessed on 20 August 2018).
- Bp. Available online: https://www.bp.com (accessed on 20 August 2018).
- Report on Development of China’s Outward Investment and Economic Cooperation. Available online: http://fec.mofcom.gov.cn/article/tzhzcj/tzhz/upload/zgdwtzhzfzbg2017.pdf (accessed on 20 August 2018).
- Word Bank Group. Power Shortage Status Report 2017. Available online: https://openknowledge.worldbank.org/handle/10986/26646 (accessed on 20 August 2018).
- Electrical Planning and Design Institute. China Electric Power Development Report 2016. Available online: http://www.cec.org.cn/guihuayutongji/gongzuodongtai/2017-09-11/172982.html (accessed on 20 August 2018).
- Sustainable Development Goals. Available online: https://www.un.org/sustainabledevelopment/ (accessed on 20 August 2018).
- Mo, L.S. Solution to Green Investment Cost and Benefit on One Belt and One Road; People’s Press: Beijing, China, 2018; pp. 9–21. [Google Scholar]
- Xu, S.S. One Belt and One Road Two-way Investment Research and Case Analysis; Machine Press: Beijing, China, 2016; pp. 9–12. [Google Scholar]
| Dimensions | Indicators | Indicator Description | Source | Standardization |
|---|---|---|---|---|
| Economic Foundation | Economic scale | GDP Total | WDI [30] | Logarithmic |
| Development level | GDP per capita | WDI | Logarithmic | |
| Economic growth | GDP growth rate | WDI | Linear | |
| Inflation index | Annual inflation rate measured by the GDP deflator | WDI | Power function | |
| Debt level | Public debt as a percentage of GDP | IEF [31] | Power function | |
| Finance and Trade | Financial freedom | Degree of convenience of international business capital flows | IEF | Linear |
| Business Freedom | Degree of facilitation of international business operations by transnational corporations | IEF | Linear | |
| Exchange rate changes | Mean variance of the official exchange rate (equivalent to 1USD in local currency unit, period average) | WDI | Power function | |
| Trade opening degree | Imports of goods and services as a share of GDP | WDI | Power function | |
| Investment level | NET inflow of foreign direct investment as a share of GDP | WDI | Power function | |
| Social Development | Population growth | Percentage of annual population growth | WDI | Linear |
| Urbanization rate | Urban population (% of total population) | WDI | Linear | |
| Unemployment | Proportion of unemployed population | WDI | Power function | |
| Social crime | Crime index | Numbeo [32] | Linear | |
| Education level | Proportion of secondary school population | WDI | Linear | |
| Political Risk | Control of corruption | Degree of government controls over corruption | WGI [33] | Linear |
| Political stability and absence of violence | Quality of public service, administrative department, and its independence from politics, policy formation, and implementation | WGI | Linear | |
| Government stability | Government stability, political violence, and terrorism | WGI | Linear | |
| Rule and law | Establishment, perfection, enforcement, and supervision of laws and regulations | WGI | Linear | |
| War and conflict | Number of people killed in war in the last 10years | WB [34] | Power function | |
| Chinese Factors | Degree of dependence on import and export | Total exports to China/total exports of a country + imports from China total trade/total import of a country | National Bureau of Statistics, WB [35] | Power function |
| Degree of investment dependence | Proportion of bilateral investment between China and one country | Ceic, WDI | Linear | |
| Partnership | A cooperative relationship between states for the search for common interests | BRI Big Data Report [36] | Linear | |
| Bilateral agreements | Coordination of tax and trade agreements between the two sovereign states | BRI Big Data Report | Linear | |
| Date of establishment of diplomatic relations | National time of diplomatic relations with China | Chinese Foreign Ministry [37] | Linear | |
| Environmental Constraints | Emission level | Per capita carbon emission level/per capita metric ton | IEA [38] | Linear |
| Emissions growth | Per capita carbon emission growth level | IEA | Linear | |
| Water pressure | 2030BAU situation water pressure | WRI Water pressure national rankings data set [39] | Linear | |
| PM2.5 | Particulate matter concentration PM2.5(μg/m3) | W.H.O. [40] | Linear | |
| NDC Target | Ratio of current emission value to NDC emission value | INDCs [41] | Linear | |
| Electric Power Foreground | Electrified rate | Proportion of people with electricity services | WB | Power function |
| Electrification rate | Proportion of electricity consumption to primary energy consumption | WB | Linear | |
| Power demand growth | Average annual growth of electricity demand | WB | Linear | |
| Power import degree | NET electricity imports as a proportion of total output | IEA | Power function | |
| Per capita power consumption | 2015 annual per capita electricity consumption | WB | Linear | |
| Coal Power Economy | Coal Surplus degree | Coal storage and production ratio | EIA [42] | Power function |
| Proportion of electric coal | Proportion of coal for coal production | IEA | Linear | |
| Coal Power Planning | Ratio (absolute value) of planned installed capacity of coal and electricity to the total capacity of existing generators | Prosperity and decline [43] | Power function | |
| Proportion of coal and electricity | 2014 annual coal electricity generation proportion of total power generation | WB | Linear | |
| Coal power growth | 2014 annual average growth rate of coal power generation | WB | Power function | |
| Renewable Power Economy | Renewable generating capacity | Non-water renewable energy 2014 annual generating capacity | WB | Power function |
| Planning renewable machine | 2030 planning the ratio of renewable installed capacity to the total amount of the existing generation installed (absolute value) | WB | Linear | |
| Growth rate of PV power generation | 2012–2017 annual growth rate of PV generation | BP [44] | Power function | |
| Wind power generation growth | 2012–2017 annual wind power generation growth | BP | Power function | |
| Hydropower generation growth | 2010–2015 annual hydropower generation growth rate | WB | Power function |
| Country | Region |
|---|---|
| South Africa | Africa |
| Kazakhstan | Central Asia |
| Poland | Central Europe |
| Czech | Central Europe |
| Korea | East Asia |
| Russia | Eastern Europe |
| Ukraine | Eastern Europe |
| New Zealand | Oceania |
| India | South Asia |
| Pakistan | South Asia |
| Bangladesh | South Asia |
| Cambodia | Southeast Asia |
| Burma | Southeast Asia |
| Philippines | Southeast Asia |
| Vietnam | Southeast Asia |
| Malaysia | Southeast Asia |
| Thailand | Southeast Asia |
| Indonesia | Southeast Asia |
| Singapore | Southeast Asia |
| Turkey | West Asia |
| Israel | West Asia |
| Dimensions | Weight of Dimensions | Indicators | Weight of Indicators |
|---|---|---|---|
| Economic Foundation | 0.2537 | Economic scale | 0.0273 |
| Development level | 0.0848 | ||
| Economic growth | 0.0523 | ||
| Inflation index | 0.0508 | ||
| Debt level | 0.0385 | ||
| Finance and Trade | 0.2216 | Financial freedom | 0.0888 |
| Business Freedom | 0.0253 | ||
| Change of exchange rate | 0.0324 | ||
| Trade opening degree | 0.0494 | ||
| Investment level | 0.0257 | ||
| Social Development | 0.2070 | Population growth | 0.0230 |
| Urbanization rate | 0.0389 | ||
| Unemployment | 0.0464 | ||
| Social crime | 0.0449 | ||
| Education level | 0.0538 | ||
| Political Risk | 0.3176 | Corruption control | 0.1220 |
| Government effectiveness | 0.0529 | ||
| Government stability | 0.0399 | ||
| Legal and law | 0.0732 | ||
| War and conflict | 0.0298 |
| Dimensions | Weight of Dimensions | Indicators | Weight of Indicators |
|---|---|---|---|
| Economic Foundation | 0.0843 | Economic scale | 0.0091 |
| Development level | 0.0282 | ||
| Economic growth | 0.0174 | ||
| Inflation index | 0.0169 | ||
| Debt level | 0.0128 | ||
| Finance and Trade | 0.0736 | Financial freedom | 0.0295 |
| Business Freedom | 0.0084 | ||
| Exchange rate changes | 0.0108 | ||
| Trade opening degree | 0.0164 | ||
| Investment level | 0.0085 | ||
| Social Development | 0.0688 | Population growth | 0.0076 |
| Urbanization rate | 0.0129 | ||
| Unemployment | 0.0154 | ||
| Social crime | 0.0149 | ||
| Education level | 0.0179 | ||
| Political Risk | 0.1056 | Corruption control | 0.0405 |
| Government effectiveness | 0.0176 | ||
| Government stability | 0.0132 | ||
| Legal and law | 0.0243 | ||
| War and conflict | 0.0099 | ||
| Chinese Factors | 0.1371 | Degree of dependence on import and export | 0.0327 |
| Degree of investment dependence | 0.0388 | ||
| Partnership | 0.0237 | ||
| Bilateral agreements | 0.0135 | ||
| Date of establishment of diplomatic relations | 0.0284 | ||
| Environmental Constraints | 0.0728 | Emission level | 0.0160 |
| Emissions growth | 0.0120 | ||
| Water pressure | 0.0235 | ||
| PM2.5 | 0.0087 | ||
| NDC Target | 0.0126 | ||
| Electric Potential | 0.2162 | Electrified rate | 0.1367 |
| Electrification rate | 0.0128 | ||
| Power demand growth | 0.0391 | ||
| Power import degree | 0.0134 | ||
| Per capita power consumption | 0.0142 | ||
| Coal Power Economy | 0.1128 | Coal Surplus degree | 0.0233 |
| Proportion of electric coal | 0.0132 | ||
| Coal power planning | 0.0277 | ||
| Proportion of coal and electricity | 0.0148 | ||
| Coal power growth | 0.0338 | ||
| Renewable Power Economy | 0.1289 | Renewable generating capacity | 0.0240 |
| Planning renewable machine | 0.0151 | ||
| Growth rate of PV power generation | 0.0212 | ||
| Wind power generation growth | 0.0361 | ||
| Hydropower generation growth | 0.0325 |
| Country | Risk Level | Compared with Four-Dimension |
|---|---|---|
| Cambodia | lowest risk | ↑4 |
| Burma | lowest risk | ↑4 |
| Poland | lower risk | →0 |
| Korea | lower risk | →0 |
| Philippines | lower risk | ↑1 |
| New Zealand | lower risk | →0 |
| India | lower risk | ↑2 |
| Vietnam | lower risk | ↑2 |
| Russia | medium risk | →0 |
| Kazakhstan | medium risk | →0 |
| Malaysia | medium risk | ↓−1 |
| Thailand | medium risk | →0 |
| Turkey | medium risk | →0 |
| Indonesia | medium risk | →0 |
| Pakistan | higher risk | ↑1 |
| Czech | higher risk | ↓−2 |
| Bangladesh | higher risk | ↑1 |
| South Africa | higher risk | ↓−1 |
| Ukraine | higher risk | →0 |
| Singapore | higher risk | ↓−2 |
| Israel | highest risk | ↓−3 |
© 2018 by the authors. Licensee MDPI, Basel, Switzerland. This article is an open access article distributed under the terms and conditions of the Creative Commons Attribution (CC BY) license (http://creativecommons.org/licenses/by/4.0/).
Share and Cite
Yuan, J.; Zeng, Y.; Guo, X.; Ai, Y.; Xiong, M. Electric Power Investment Risk Assessment for Belt and Road Initiative Nations. Sustainability 2018, 10, 3119. https://doi.org/10.3390/su10093119
Yuan J, Zeng Y, Guo X, Ai Y, Xiong M. Electric Power Investment Risk Assessment for Belt and Road Initiative Nations. Sustainability. 2018; 10(9):3119. https://doi.org/10.3390/su10093119
Chicago/Turabian StyleYuan, Jiahai, Yurong Zeng, Xiaoxuan Guo, Yu Ai, and Minpeng Xiong. 2018. "Electric Power Investment Risk Assessment for Belt and Road Initiative Nations" Sustainability 10, no. 9: 3119. https://doi.org/10.3390/su10093119
APA StyleYuan, J., Zeng, Y., Guo, X., Ai, Y., & Xiong, M. (2018). Electric Power Investment Risk Assessment for Belt and Road Initiative Nations. Sustainability, 10(9), 3119. https://doi.org/10.3390/su10093119