1. Introduction
It is known that the indoor environment of a building affects the health, productivity, and comfort of the occupants, so thermal comfort has been studied by many researchers for decades.
There are various authors who set the basis for a bioclimatic approach to buildings’ design by incorporating principles of sustainable design to control the indoor climate and improve building functionality [
1,
2]. However, in 1973, Fanger published the first works on the influence of weather conditions on buildings’ occupants. Fanger’s research defined two main indices in the analysis of occupants’ comfort: PMV (Predicted Mean Vote) and PPD (Predicted Percentage of Dissatisfied) [
3]. Both these indexes are the basis for the subsequent development of the two most extended models of thermal comfort: steady-state models, based on more traditional aspects, and adaptive models, which provide a more current approach [
4].
The steady-state models, also known as thermal balance or constant models, have been the basis adopted in many standards of thermal comfort. However, it is a steady-state model resulting from research in thermal chambers, and is only applicable to people exposed to a long period of constant conditions. These reasons, along with others, have led to there being authors in the research community who question its predictive capacity, suggesting other models instead, such as the adaptive comfort models [
5].
Unlike the steady-state models, the adaptive comfort models are defined by considering the possible adaptation of the occupants, both in behavioural and psychological aspects which are related to the expectations. In the field of people’s behaviour, Baker and Standeven [
6], as well as Morgan et al. [
7], among others, showed that the indoor environment, to which people are exposed every day, is what determines clothing choices across time, causing people to be thermally comfortable most of the time despite the fact that the existing temperatures themselves are surely uncomfortable. On the other hand, works on psychological adaptation tried to consider the various influences on thermal perceptions of individuals from culture, social rules, previous experiences, and context. In this regard, research by Oseland [
8] revealed how the neutral temperature varied depending on the context, and stated that previous experiences of perceptions in different spaces changed people’s expectations (the temperature could differ by up to 2 °C). In turn, Humphreys [
5] concluded that in situations where there were no limitations in adaptation processes, the passing of time would allow neutral temperatures to be closer to the temperatures perceived in the environment, leading to the occupants’ adaptation and modifying their expectations so that a comfortable situation is perceived and obtained.
On this note, it is interesting to see how the perception of occupants being in a mechanically air-conditioned building as opposed to a naturally ventilated one differs. It is also important to bear in mind that indoor temperatures in naturally ventilated buildings depend on the temperatures outside, while air-conditioned buildings have their own range of thermal conditions. As a result, several case studies [
9,
10] have revealed that occupants in heating and/or air-conditioning environments tend to adapt much more to their thermal conditions, leading to an increase in energy demand, whereas users in passive buildings (without heating and/or air-conditioning systems) have a tendency to adapt to their climatic conditions. Therefore, for passive buildings, being under favorable climates and outdoor thermal conditions gives a greater percentage of people satisfied with the comfort situation compared to the air-conditioned buildings. Furthermore, other authors also included other factors influencing thermal comfort, quoting the climate of the study area [
8,
11], or age [
12], among others.
In this context, it is worth highlighting that all research on this matter cited above has been the basis of the development of several current standards on comfort, such as ASHRAE 55:2013 [
13], ISO 7730:2005 [
14], and EN 15251:2007 [
15], as well as of the regulation on thermal installations applicable in Spain (RITE in Spanish) [
16].
To achieve an analysis of thermal comfort in this case study which is as reliable as possible, the European Standard EN 15251:2007 was used. This standard is an adaptive model of thermal comfort, which is very suitable for the study of thermal comfort in rooms with natural ventilation, and therefore is in line with the aim of this research which is to optimize the energy demand as much as possible through using natural ventilation. The adaptive model of thermal comfort defined in this standard (the European Standard EN 15251:2007), written by the European Committee for Standardization (CEN), was developed from the Smart Control and Thermal Comfort project (SCATs) [
17] carried out from December 1997 to December 2000, in which information on naturally ventilated buildings and their occupants was collected.
The standard lays down a method for the estimation of acceptable indoor conditions in mechanically air-conditioned and naturally ventilated buildings. The standard also sets out four groups based on the expectations of the occupants of the buildings, as well as other factors which determine the perception of thermal comfort and the building’s age (
Table 1).
The calculation of temperatures establishing the internal thermal comfort range has been defined by using equations given by the standard according to the category to which the analyzed building belongs. For the case study considered in this paper—that is, an office building—Equation (1) (which defines the upper limit of the comfort area) and Equation (2) (which defines the lower limit of the comfort area) were used, given by the standard for environments of Category II:
where θ
rm is the running mean outdoor temperature for the considered day (°C).
In turn, the average operative temperature was obtained by using the following Equation (3):
where:
θed-1 is the daily mean external temperature for the previous day (°C).
θed‒2 is the daily mean external temperature for the θed‒1 previous day (°C), and so on.
Note that this standard (Equations (1) and (2)) is only applied when 10 °C ≤ θ
rm < 30 °C for the upper limit, and 15 °C ≤ θ
rm < 30 °C for the lower limit (see
Table 2 for details).
Table 2 shows the comfort–temperature ranges according to the environmental Category II for cases without mechanical cooling systems, where the occupants can freely adapt to the outdoor and/or indoor thermal conditions.
Finally, this research focuses on the influence of passive elements to improve the environmental conditions of the offices located in the Torre Sevilla building. To do this, two main objectives have been defined:
Analyzing the thermal comfort situation inside the Torre Sevilla building according to its initial configuration, by calculating the percentage of hours in thermal comfort.
Providing a new, passive measurement based on natural ventilation that improves the thermal comfort situation inside the building and consequently reduces energy expenditure.
2. Method of Study
The mandatory regulation in Spain sets out several standards in energy efficiency, ventilation, and environmental sustainability which were met by the building studied, but parameters directly related to the comfort level are not discussed in the foreground.
As a result, to perform the thermal comfort analysis, this research followed the guidelines from the EN 15251:2007 standard as a method of study, whose approach is based on the optimization of the building comfort level by studying the natural ventilation regime (only with the help of the façade) in order to obtain adequate thermal comfort levels, leading to a reduction of energy expenditure required to meet actual users’ demands. To obtain the adequate thermal comfort level by only using natural ventilation, the installation of a new ventilation system in the superior part of each façade unit has been studied.
For this purpose, a set of long-term thermal simulations, comparing results from the initial configuration of the building and the proposed solution (all year round) was carried out, as well as in-situ measurement of air permeability. This permeability, which comes from the air tightness level of the façade, is crucial for the establishment of the best ventilation solution through itself, thus avoiding excessive ventilation.
2.1. Case Study
The EN 15251:2007 standard has been used to analyze the influence of natural ventilation on the indoor thermal comfort of the Torre Sevilla building.
The building, which is an office building considered as a skyscraper, was finished in 2015 and is located in the city of Seville in the south of Spain, which, according to the Köppen-Geiger classification, belongs to the Csa (Mediterranean climate) [
18], as well as to zone B in the classification of climatic zones from the Building Technical Code in Spain [
19]. This means that this climate generally has warm summers and mild winters, low precipitations (although this varies considerably from year to year), low relative humidity, and high evaporation rates. The building has a ground floor and 39 floors over the building line (26 floors are dedicated to offices and 13 to hotel rooms), as well as four levels of basement included in the plot. The floor has an oval-shaped form (
Figure 1) and a surface which decreases depending on the height, with an approximate average of 1200 m per floor.
The building envelope is formed by a lightweight glass and aluminium façade, with units approximately 4.50 m wide for the entire perimeter of each floor. Each of these units has triple-glass windows of 2.85 m height, and a windowsill of approximately 1 m (
Figure 1). Furthermore, there are slats and an overhang of different sizes, according to the orientation.
2.2. Determining the Air Permeability of the Envelope
To obtain final results with maximum feasibility and air infiltration data, as well as air velocity, air temperature, air relative humidity, and mean radiant temperature (all included in the model suggested), these were obtained from in-situ tests (which were done in 2016). Air permeability is one of the most difficult aspects to deal with in high-rise buildings [
20], as well as the one that most influences thermal comfort.
Determining air tightness was carried out by using the Blowerdoor test, which determines air tightness by means of pressurization or depressurization of the rooms under testing, according to regulations in the EN 13829:2000 standard currently in force [
21]. Method B (testing of the building envelope) of that standard was used, since the data needed to be obtained were those exclusively from the outdoor air infiltrations by means of the envelope. For this purpose, all test perimeters in contact with other rooms were sealed.
The equipment used is shown in
Table 3, and tests were carried out on the 26th floor, which was the last of the first 26 floors dedicated to offices (the remaining 13 floors were dedicated to hotel rooms), where climatological factors were most severe, and thus the results most extreme. The resulting average values of permeability through the envelope are reflected in
Table 4 and are from the surface of the façade.
2.3. Thermal Modelling
The methodology used for the study of thermal comfort was based on the modelling or thermal simulation of the building during a full year and without air-conditioning installations.
There is a huge number of research about thermal modelling by means of energy computer tools for the study of buildings’ behaviour, and we quote some of them which were conducted in similar weather conditions [
19,
22], or on a skyscraper [
20]. This research has also established several guidelines for performing these procedures.
In this case, the work started by using a Spanish energy certification program called the unified tool LIDER-CALENER (HULC in Spanish) [
23], which is used in an auxiliary way for the geometric configuration of the building to be modelled and the introduction of the input parameters, allowing verification of the Basic Document of Energy Saving (BDES) [
24]. Afterwards, by using a gateway program, the output files were converted to be used in the DOE-2 simulation calculation engine [
25], a freeware building energy analysis program that can estimate energy demand, indoor temperatures, and moisture levels from all types of buildings.
The definition of the building floor was carried out by dividing the floor into three rooms, creating three internal areas of the tower to be separately evaluated: Room R01, facing north and internally limited by the central nucleus; Room R02, facing south and internally limited by the central nucleus; and Room R03, the central nucleus of the tower (
Figure 2).
For the meteorological data, those published by the State Meteorological Agency of Spain (AEMET in Spanish) for the city of Seville in 2016, belonging to the climate zone B4 according to the Spanish standard, were applied. This was severe summer weather, with temperatures reaching up to 45 °C maximum in summer and 2 °C minimum in winter [
26].
The real air infiltrations through the façade came from the results obtained by the Blowerdoor tests, and the usage established for the rooms studied was of low intensity, i.e., eight hours daily.
According to the passive approach established, all the inhabitable spaces under use conditions are considered in the hygrothermal simulation, but without activating the existing mechanical ventilation and air-conditioning installations. With this, the conditions that the building envelope itself was able to provide for the indoor environment could be seen.
3. Results
Records per hour in a complete annual cycle were obtained (8760 records) from the building performance simulation. Due to the fact that the most extreme climatic values were produced in winter and summer periods in Seville, two different analyses were carried out before the thermal comfort analysis along the whole year: variation of temperatures along the different hours of the day for summer and winter, and variation of temperatures inside rooms R01 and R02 during the most severe two days in summer and winter.
Figures 4 and 5 illustrate the variation of temperatures in the different hours of the day for those seasons, showing how wide the values amongst maximum and minimum temperatures were in summer and winter days.
As can be seen in
Figure 3 (analysis of temperatures in winter), 26 °C is the maximum temperature occasionally reached during winter in the room facing south (R02), although the tendency is between 17 °C and 18 °C. However, for the room facing north (R01), the tendency falls one degree, and is established between 16 °C and 17 °C. During the summer, as can be seen in
Figure 4, the temperature is very similar in both rooms, occasionally reaching a maximum temperature of 36 °C. It is important to highlight that the tendency marked by the temperatures is established in a range between 30 °C and 32 °C.
On the other hand,
Figure 5 and
Figure 6 represent the temperature variations inside rooms R01 and R02 during the most severe two days (the coldest and hottest days) in winter and summer, respectively. As can be seen in
Figure 5, for the winter days, there is a difference between the minimum and maximum temperature reached of 9 °C (15 °C–24 °C) in the room facing south (R02), whereas the thermal variation is only 4 °C (14 °C–18 °C) in the room facing north (R01). Furthermore, it is worth highlighting that the efficient thermal insulation and the low level of infiltrations provided by the façade led to a mild indoor temperature in winter (15 °C of minimum temperature).
Regarding the summer days, it can be seen from
Figure 6 that the temperature is very similar in both rooms throughout the day, except in the period between 16:00 and 19:00 in which the temperature reached in the south room (R02), 35 °C, is higher than in the north room (R01), 33 °C. This fact shows that it is important to have a special control of the period in which the building can be ventilated by using the outdoor thermal conditions through the openings of façade, since the maximum indoor temperature for winter has in no case exceeded the maximum limit temperature of 26.0 °C during the days with the highest temperatures, allowing it to keep a comfortable temperature by closing the façade. In return, the minimum temperature reached during the days with the highest temperature has not been lower than 30.0 °C, requiring switching on of the cooling systems during the period in which the opening of the façade is not possible due to the high outdoor temperatures, since it could lead to overheating in the room.
Then, from the results obtained in the thermal simulation, and according to the EN 15251:2007 standard, the analysis of internal thermal comfort that the building provides in passive conditions was performed. Rooms R01 and R02 were studied—room R03 was not included in the analysis because it was intended for lifts, stairs, and common areas.
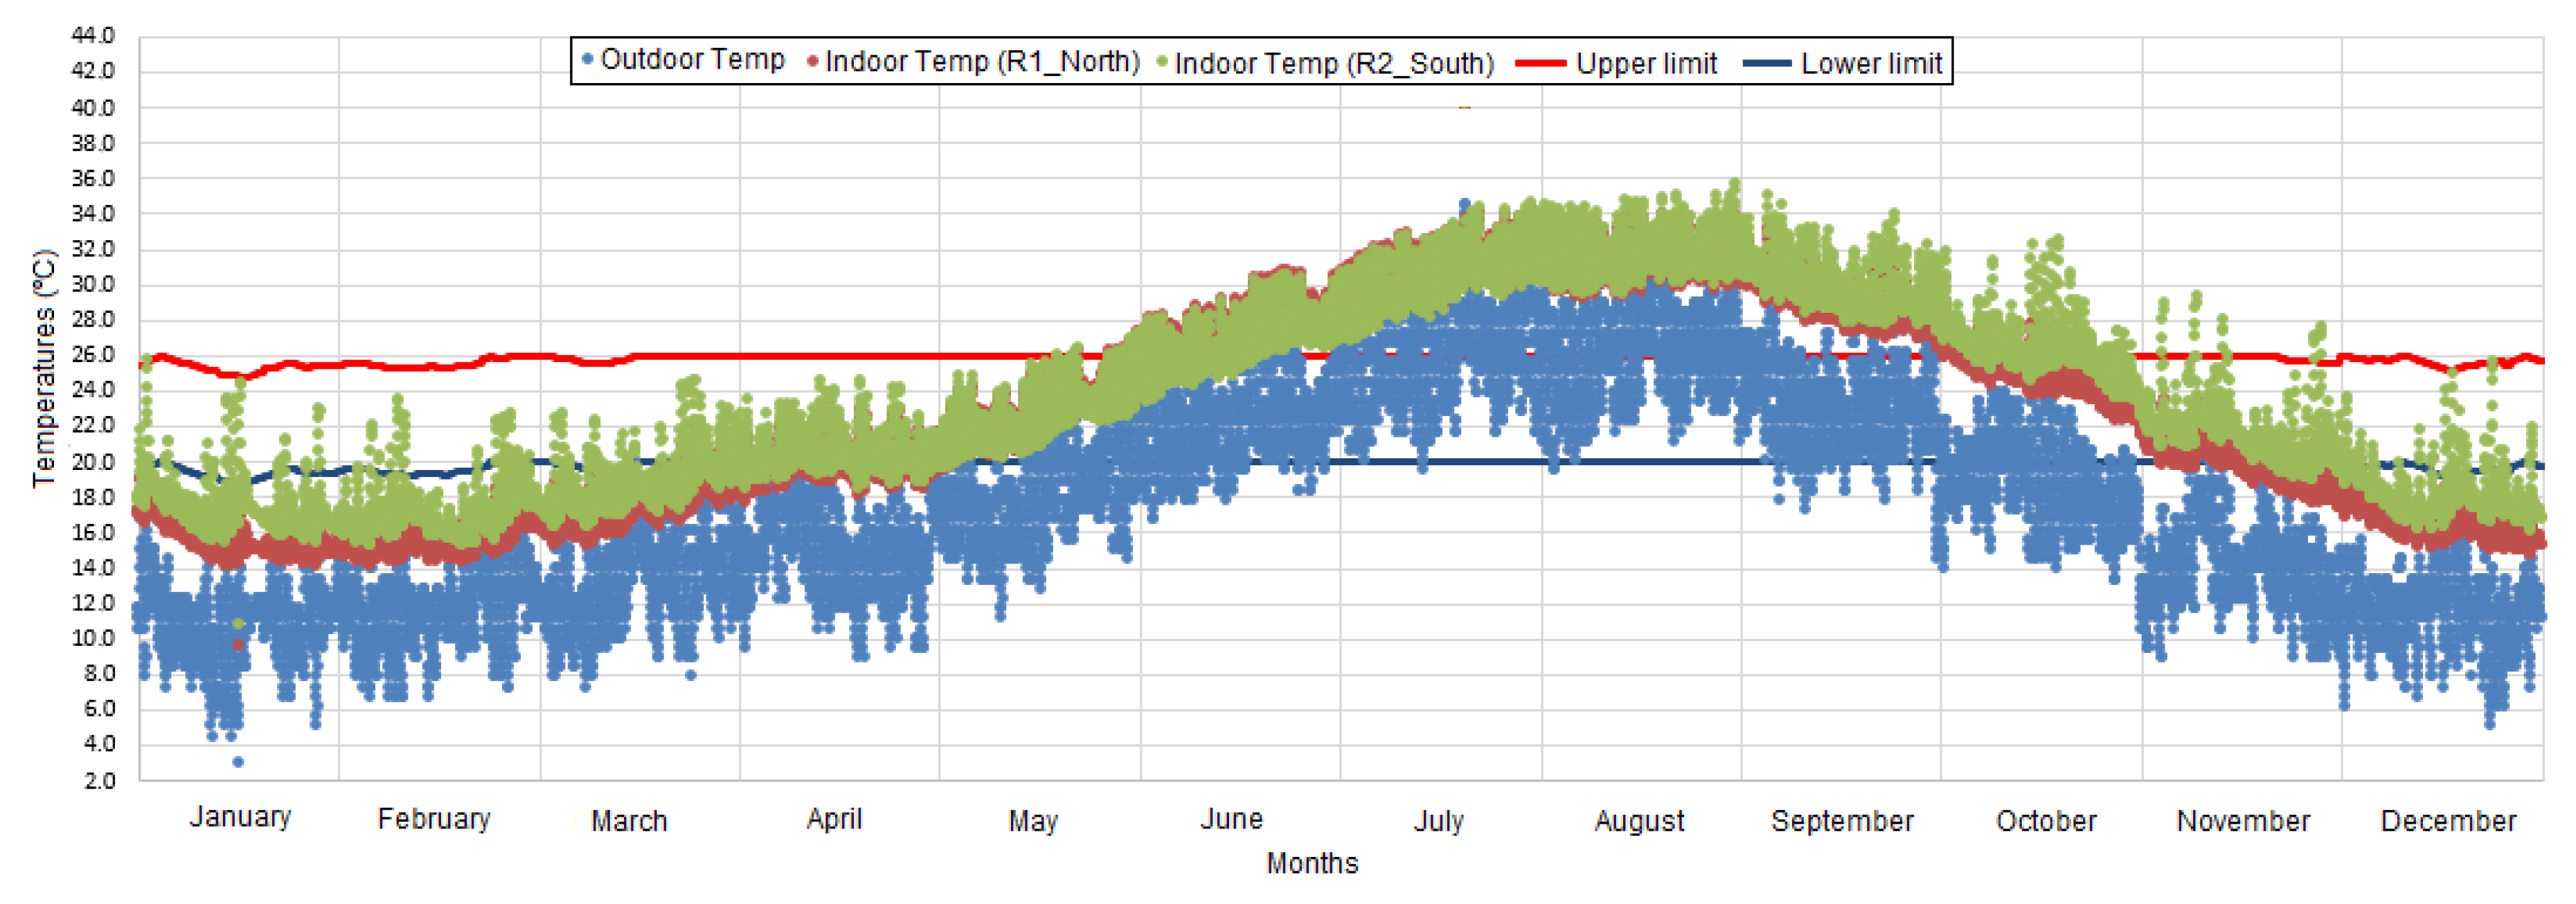
Figure 7 shows an analysis of the annual variation of the indoor temperature (not considering the air-conditioning operation) as well as its contrast with respect to the indoor thermal comfort range. Thus, the potential of comfort given exclusively by the envelope is seen, and consequently the needs for using the energy equipment can be determined. Red and blue lines show the upper and lower limits of comfort, respectively, calculated for the period of analysis depending on the outdoor temperature (
Table 2). On the other hand, the green and pink strips present the indoor temperatures of the south (R02) and north (R01) rooms, respectively, whereas the blue strip details the outdoor temperature produced during the period of analysis in these circumstances.
Considering the natural ventilation regime on an hourly basis during a full year (8760 h), only 2121 and 2580 h of the comfort situation in north (R01) and south (R02) rooms are achieved, respectively, meaning it is equal to the periods from mid-April to late May, and from mid-October to mid-November (
Figure 7). In our analysis of the number of hours through which a comfort situation inside the building could be reached from outdoor temperatures, it is important to highlight that, in a total of 2077 h, the outdoor temperature will ease the achievement of comfort levels inside the building. Furthermore, from
Figure 7 it can be seen that those comfortable hours are in the periods in which the temperature inside the building is higher than the comfort limit established, i.e., the months from May to October.
Table 5 sums up the percentage of the operation hours when the different rooms reach a comfortable situation in a passive way—therefore, the remaining time percentage is when using the air-conditioning systems to keep the thermal comfort is required. For instance, in room R01 (north), 24.21% of the hours of using the envelope achieves a comfort situation, so the occupants should use heating or air-conditioning for the remaining time (75.79%) to try and make sure that the environment remains in the comfort time zone.
4. Discussion
The results show the duality of approach between criteria of energy efficiency and thermal comfort. The building under study not only complies rigorously with the standard currently in force, but is designed to achieve high energy and sustainability features. This aspect is materialized by the maximum level ‘A’ from the energy efficiency classification [
27], and the ‘Gold’ category from the Leed certification for sustainable buildings [
28]. The study on the comfort conditions without using air-conditioning or mechanical ventilation shows that indoor rooms achieve an internal comfort during a part of the analyzed period (one year)—in particular, 24.21% of the occupation hours in room R01 (north,) and 29.45% for room R02 (south)—requiring the use of air-conditioning systems in order to maintain the mentioned comfort situation during the remaining occupation hours (49.14% for heating and 26.65% for cooling out of 75.79% in room R01 (north), and 45.75% for heating and 24.81% for cooling out of 70.55% in room R02 (south)).
These values led us to think that it is advisable to suggest the incorporation of complementary measurements which benefit the indoor thermal comfort in a passive way. This will allow a reduction of the number of hours in which air-conditioning systems are used, and consequently, the total energy consumption. Furthermore, improving the natural ventilation of the building is the cooling strategy studied in this paper. This proposal is based on the geographic location of the building (city of Seville, Spain), since, in general, its Mediterranean climate provides mild temperatures for most of the year. According to Barbadilla et al. [
29], for these climatic characteristics, and in particular for office buildings, designing buildings with mixed air-conditioning systems by combining natural ventilation (by means of the manual opening of windows or mechanically-controlled openings) and mechanical air-conditioning is the best solution to achieve an optimal performance of cooling and heating systems, as well as having a higher energy efficiency and best thermal comfort. Hellwing et al. [
9] showed that the satisfaction concerning thermal comfort is higher in office buildings in which a natural ventilation system is included, with respect to buildings with only mechanical ventilation., Research by Baker et al. [
6] also revealed that those buildings where the occupants have control over the ventilation system and can adapt the indoor environment to meet their daily needs show a higher index of thermal satisfaction. The increase of natural ventilation, which a priori would be inadvisable due to the relationship between air permeability and the increase in energy demand [
30], could be considered adequate if it is only used during the period in which the outdoor environment is comfortable, especially at night (
Figure 8). In this context, many researchers presented night-time ventilation as an optimistic technique for office and commercial buildings in climates Central, East, and North of Europe [
31], and is even considered to be one of the best passive cooling techniques, mainly due to the excellent relation between the buildings with high cooling demand and its consequent high reduction by using nighttime ventilation [
32]. Moreover, in the case of the Torre Sevilla building, the results of the Blowerdoor tests show that the envelope airtightness level is high, meaning the building has a reduced exchange of air with the exterior, reducing the positive effects of the thermal balance with the exterior during the long mild periods that the environment provides.
Consequently, the main performance area to be considered when thinking about improving thermal comfort in a passive way is making the natural “breathing” of the building easier by increasing its ventilation in a controlled way. The hypothesis suggested for this case study is based on studies carried out by the Center for the Built Environment at UC Berkeley about thermal comfort in office buildings by increasing air movement [
33,
34], as well as by research showing the potential passive cooling of buildings for demand savings [
35,
36], and consists of installing a ventilation system in the superior part of each façade unit to increase the air volume which goes into the building from the exterior. This new system would not affect the aesthetics of the façade, since it is installed in the superior part of each glass façade by re-using the existing glass modules just under the building’s corbel, leading to a reduction in installation costs. With this, the indoor conditions are adapted during the hourly periods in which the outdoor conditions provide a comfort situation (
Table 6). Based on advances on the state of the technique, the controlled mechanical ventilation (VMC in Spanish) currently allows the management of efficient energy consumption. There are several studies in this field that encourage the use of advanced energy control and comfort systems in the building [
37,
38], guaranteeing the choice of the mixed air-conditioning system (mechanically-controlled natural ventilation and mechanical air-conditioning) as the most optimal system for this study, since this system adapts the needs of ventilation to each moment depending on the indoor temperature [
39]. It is also important to indicate that the air speed will be adjustable according to the thermal variation to be covered between the exterior and interior, always being higher than 0.25 m/s and lower than 0.75 m/s, as an excessive increase of the operative temperature would be achieved with a higher air speed (see EN 15251:2007, p 28 for details [
13]). In
Figure 8, the average temperature per hour during summer 2016 (e.g., 21 °C was the average outdoor temperature during summer 2016 at 8:00), shows an example of using the openings in a façade during the time zones in which those openings can be closed and opened to cool the interior of the building from an increase in ventilation. The brown and green lines represent the average temperature per hour of the rooms facing south (R02) and north (R01), respectively, whereas the blue and red lines represent the average outdoor temperature per hour and the upper limit temperature of comfort, respectively. Thus, as can be seen in
Figure 8, the outdoor temperature allows an increase in ventilation of the façade during the time zone from 00:00 to 11:00, as well as from 23:00 to 00:00, to achieve a comfort situation in the interior of the building. On the contrary, in the time zone from 12:00 to 22:00, the outdoor temperature does not provide a comfort situation in the interior of the building, causing overheating [
12] and requiring that the ventilation through the façade be closed, as well as the air-conditioning systems to be activated.
Extending to the whole annual period, in regard to the selective increase of the ventilation that
Figure 8 represents for summer, the result of the modelling provides a natural adaptation of the indoor temperature during the period in which the outdoor environment is within the comfort limits.
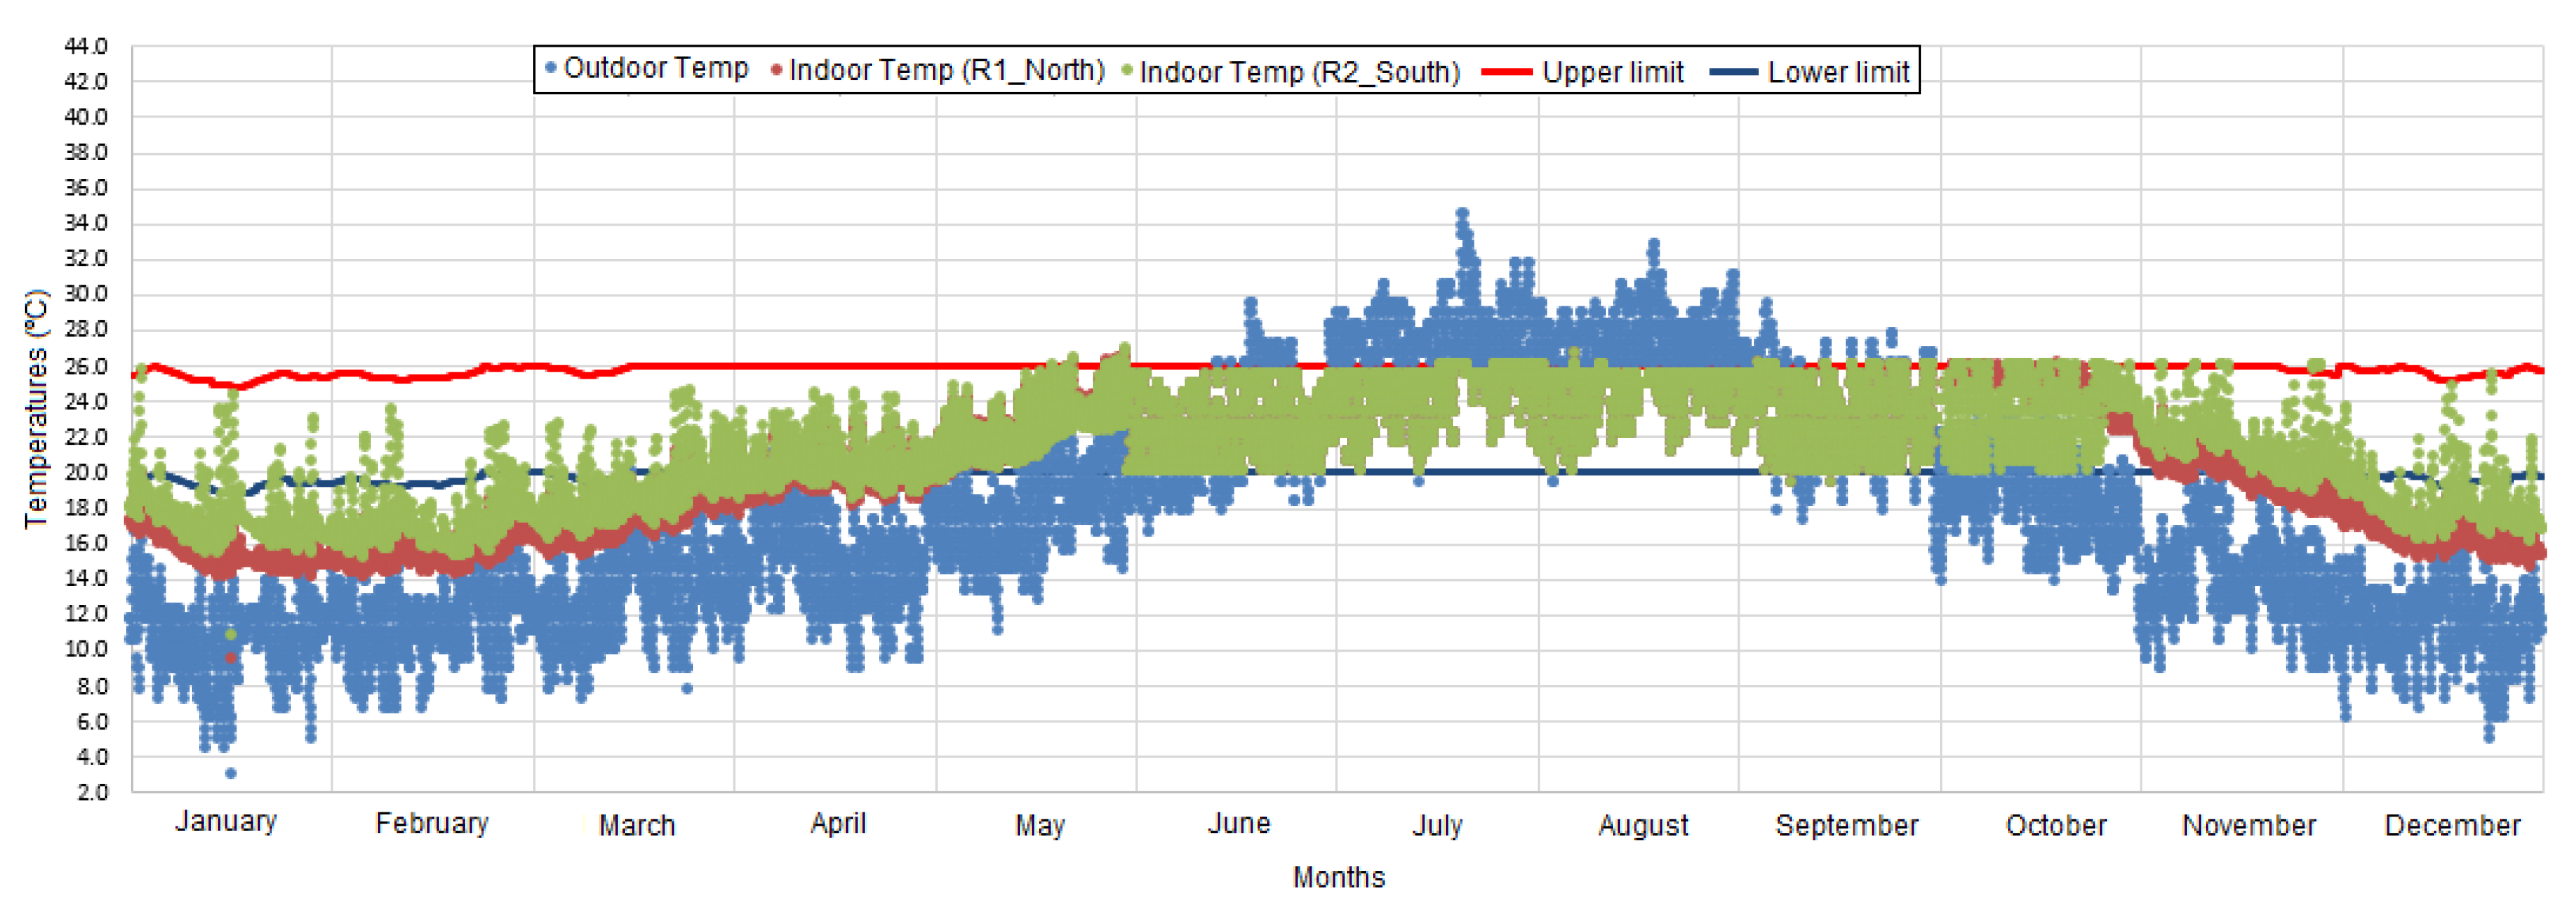
Figure 9 shows a graphical analysis of the thermal comfort improvement due to the implementation of the ventilation strategy by simulating the indoor temperatures along a whole year. Note that the interior heat generation by equipment and people as well as the specific flow rates have been considered in the simulation. As a result, room R01, facing north, would be in a comfortable situation for 51.91% of the hours. On the other hand, room R02, facing south, would reach a comfortable situation for 58.89% of the hours.
Table 6 shows a comparison between the percentages of comfortable hours of the use schedule of the building reached in free-running and with air-conditioning, before and after applying the controlled ventilation system.
5. Conclusions
This paper has outlined the case study of Torre Sevilla, a sustainable building which has good energy features. It was analyzed this time using the adaptive comfort model defined by the European Standard EN 15251:2007.
In this field, after a simulation strategy focused on indoor thermal comfort, it is concluded that, due to the fact that the building is designed in order to compulsorily guarantee comfort having its own air-conditioning systems, their use during 75.79% of the occupation hours in room R01 (north) and 70.55% for room R02 (south) is required in the initial configuration. Because of this, experimental measures easing the natural ventilation of the building when the outdoor environment is favorable, as well as activating the air-conditioning system when it is unfavorable, are suggested—consequently achieving a reduction by 22.70% during the occupation hours in which the use of air-conditioning equipment for room R01 (north) is required, and a 29.45% decrease for room R02 (south). Furthermore, the proposal studied would positively influence energy consumption levels of the building by reducing the air-conditioning demand during the time of improvement.
After implementing the new glass-window solution in the simulation software (DOE-2 simulation calculation engine [
25]), the results provided in this paper show that the combination of a controlled natural ventilation with air-conditioning systems is the most suitable design solution in a Mediterranean climate, when an improvement in thermal comfort and a reduction in energy demand need to be reached together. Furthermore, it is evident that the influence of controlled ventilation to create an adequate indoor environment for office buildings located in this climate by using the extended periods of time in which the outdoor environment is thermally comfortable (in particular, during night-time).
This research can be used as a reference for designing and constructing future buildings, high-rise or not, in cities with a similar climatic typology (Mediterranean climate).


