1. Introduction
Energy consumption is one of the most crucial issues in the massive application of the table grapes supply chain [
1]. In recent years, the table grapes supply chain has been developed rapidly with the swift increase in the table grapes production and consumer demand [
2,
3,
4]. The massive energy consumption has been also increased, owing to the energy-intensive characteristic of the table grapes supply chain [
5,
6,
7]. However, the energy consumption in the supply chain, for example, the electricity, the petroleum and the natural gas, are part of the non-renewable energy resources [
8,
9,
10]. Therefore, it is necessary and important to synthetically assess the energy consumption and energy conservation potential in table grapes supply chain.
There are mainly three kinds of table grapes supply chain modes that are applied widely. They are the normal chain, the cold insulation chain and the cold chain. The normal chain of the table grapes, which is most and widely used, is mainly applied in short distance transportation, and the table grapes are all transported at the ambient environment in the chain [
11,
12,
13]. The cold insulation chain, which is applied in medium distance transportation, are fully pre-cooled and stored at the low temperature by refrigeration method, and then transported to the market with the method of the cold insulation such as the quilt covering method [
14]. The temperature in the cold insulation transportation increases slowly and the quality of the table grapes also decays slowly [
15]. The cold chain, which is used for long-distance transportation, are also fully pre-cooled and stored at the low temperature by refrigeration method, and then refrigeration transported to the market [
16]. The temperature is kept at a low temperature with the refrigeration method all the time [
17]. However, the challenging issue for the energy conservation potential assessment of the different supply chain mode still exists, because the different supply chain mode has a different process and cost to guarantee the quality and safety of the table grapes. The more the process in the supply chain, the more devices are needed, thus contributing towards more energy consumption [
18,
19].
Currently, various studies about energy consumption and conservation potential in different energy-intensive supply chains have been reported. Chen et al. [
20] have reported the energy conservation and optimization for the shale gas supply chain planning based on the life cycle assessment. Shen et al. [
21] discussed the low carbon supply chain practices in China’s textile industry by evaluating the energy consumption in actual supply chain, and finally made the optimal decisions of the supply chain. McBrien et al. [
22] have analyzed the energy conservation potential in a typical steel supply chain by the integrated heat recovery method. Wang and Rutherford [
23] have assessed the energy consumption and conservation potential in natural gas supply chain by the liquefied natural gas carriers. Vanek and Sun [
24] explored the energy conservation potential for the temperature controlled perishable food supply chain, from crop to packaged product to consumer, by integrating the life cycle energy consumption model. However, most of these studies are focused on the single or typical process of the supply chain, and the unified energy conservation assessment method is needed to be applied to the different supply chain modes of table grapes.
Energy consumption per unit energy factor method, which is a scientific and reasonable energy consumption evaluation index to represent the total energy consumption of product per kilogram processed and the average energy conservation potential of the product throughout its entire lifecycle, provides a unified way for the different process of the industries [
25,
26,
27]. For example, Zhang and Li [
28] have calculated and estimated the energy consumption and energy conservation potential of the product lifecycle, from cradle to grave, based on the energy factor method. Feng et al. [
29] and Xie [
30] have assessed the energy consumption and energy conservation potential in the refinery industry by adopting the energy consumption per unit energy factor method, and the evaluation results showed that the method could effectively represent the energy conservation potential of the process in refinery industry.
The main objective of this study is to propose an energy conservation potential assessment method for the supply chain management of table grapes. The energy consumption and conservation potential assessment in three kinds of supply chain mode, which are the normal chain, the cold insulation chain and the cold chain, were realized by integrating the actual energy consumption investigated with the unified energy consumption per unit energy factor. The energy consumption analysis in the normal chain, the cold insulation chain and the cold chain, the energy consumption comparison and the energy conservation potential in table grapes supply chain were comprehensively evaluated in actual supply chain of table grapes. The proposed energy conservation potential assessment method could provide a unified method for evaluating the energy conservation potential in different supply chain mode of table grapes, increase the energy consumption transparency, and finally help the manager take the appropriate energy conservation measures to reduce the energy consumption in different supply chain mode.
The rest of the paper is organized as follows. The energy conservation potential materials and methods are described in
Section 2. The evaluation results of the energy conservation potential method are discussed in
Section 3. Conclusions and future work are presented in
Section 4.
2. Materials and Methods
This section illustrates the materials and methods for the research in more detail, which includes the properties of the table grapes supply chain investigated, the energy calculation method for the energy consumption calculation, the energy consumption assessment method, and the experimental scheme for the actual supply chain energy consumption assessment.
2.1. Properties of the Tale Grapes Supply Chain Investigated
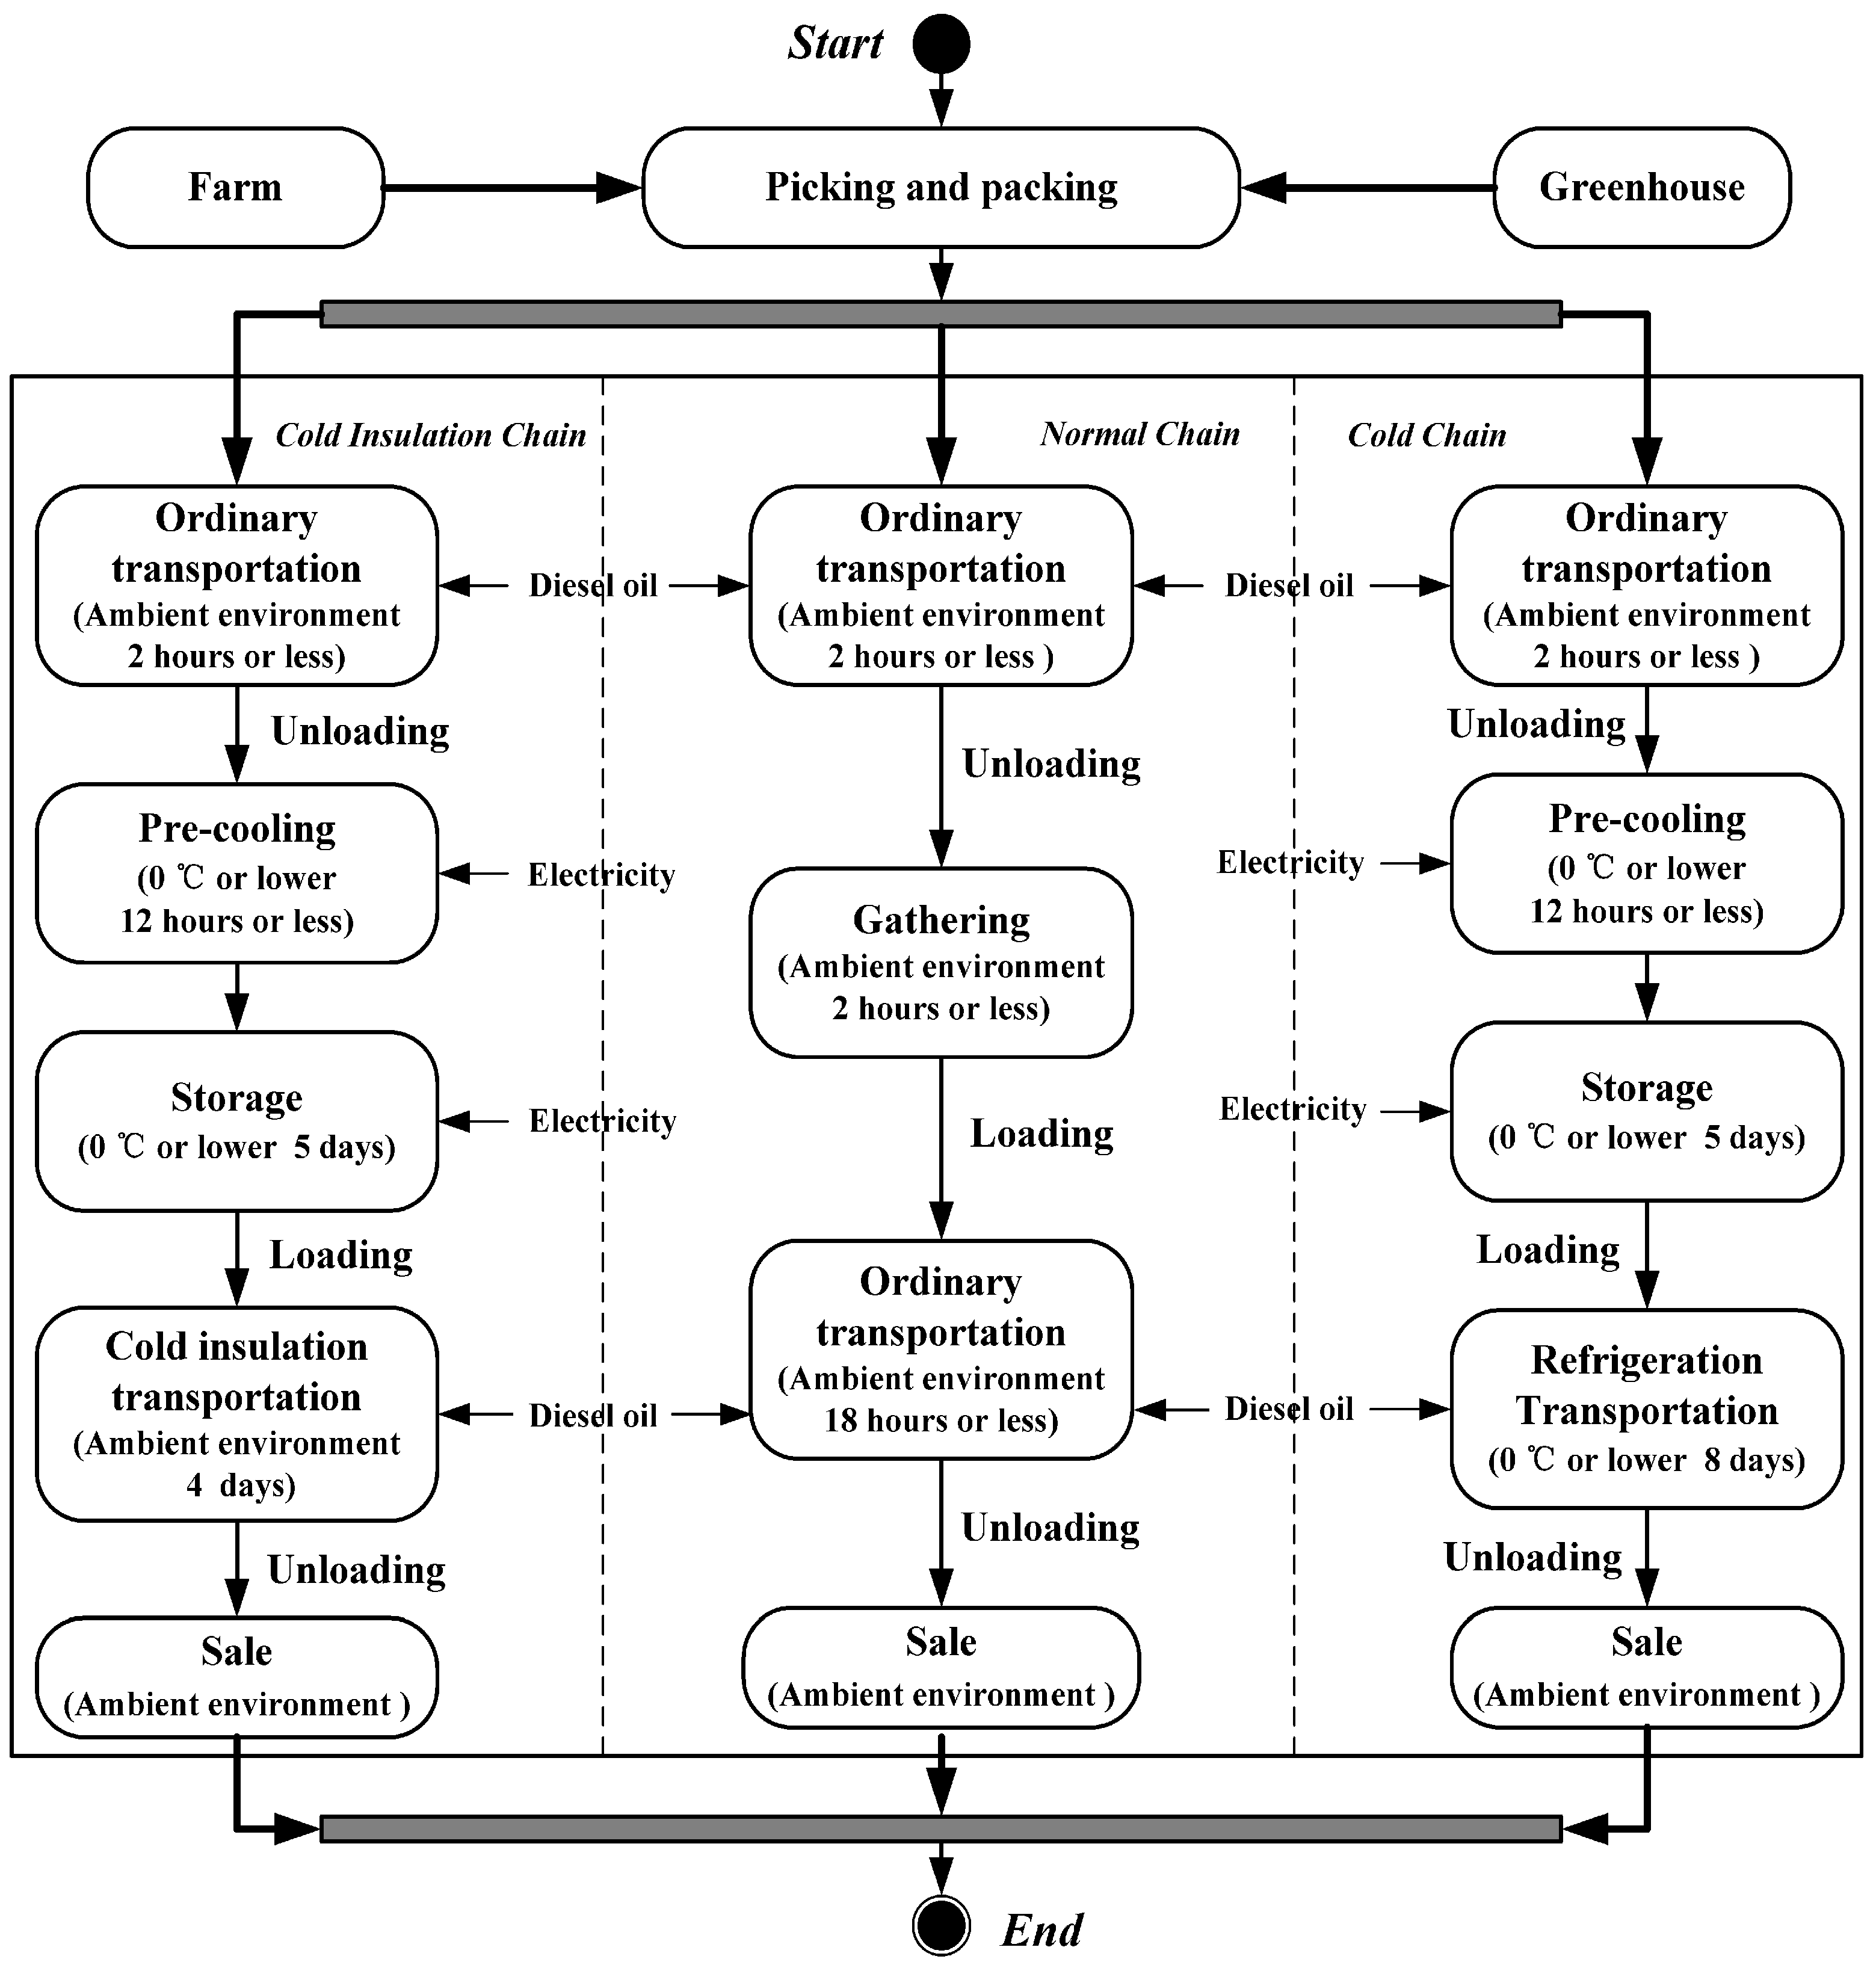
To understand more about the properties and energy consumption of the table grapes supply chain, the field observation and investigation method was conducted in China in 2016. Three kinds of table grapes supply chain were classified according to the different transportation distance. They are the normal chain, cold insulation chain and the cold chain. The normal chain of table grapes is most and widely used for short distance transportation with the ambient environment. The cold insulation chain is applied in the medium distance transportation with the low temperature in cold insulation method, and the cold chain is used for the long-distance transportation with the low temperature in refrigeration method all the time. The normal chain was conducted from the Hebei province to Beijing city. The cold insulation chain was chosen from Xingjiang uygur autonomous region to Shandong province and the cold chain was from Xingjiang uygur autonomous region to Guangzhou city. The workflow of the table grapes supply chain is demonstrated in
Figure 1.
As shown in
Figure 1, the first step for all the table grapes supply chain was picking and packing at the farm or the greenhouse, and then ordinarily transported to the pre-cooling and storage in the cold storage for the cold insulation chain and the cold chain, and to the gathering in the distribution center for the normal chain. Finally, the stored table grapes were cold insulation and refrigeration transported to the market for sale in cold insulation and cold chain, and the gathered table grapes were ordinarily transported to the market for sale in normal chain.
The energy in the pre-cooling and storage process of the cold insulation and cold chain are mainly consumed from the electricity, and the energy in the transportation process of all the supply chain, which includes the ordinary transportation from the farm or the greenhouse to cold storage or distribution center and the cold storage or distribution center to the market, are mainly consumed from the diesel oil of the truck.
However, the energy consumption in the different supply chains is not comparable and cannot comprehensively evaluate the energy consumption level and energy conservation potential in the table grapes supply chains, because of the complex composition of the supply chain and the different kinds of energy source in different phases. It is important to assess the energy consumption in different phases and explore the energy conservation potential in table grapes supply chain.
2.2. Energy Consumption Calculation Method
The energy calculation method is applied to calculate the energy consumption in the process of the pre-cooling, storage and transportation according to the actual supply chain investigation.
The pre-cooling energy in cold insulation and cold chain consist of the power of the pre-cooling equipment and the pre-cooling time of the table grapes in cold storage. The pre-cooling energy
is calculated as demonstrated in Equation (1).
where the
is the power of the pre-cooling equipment and the
is the pre-cooling time of the table grapes in cold storage.
The storage energy in the cold insulation and cold chain are composed of the power of the refrigeration plant and the refrigeration time of the table grapes in cold storage. The storage energy
is calculated as illustrated in Equation (2).
where the
is the power of the refrigeration plant and the
is the refrigeration time of the table grapes in cold storage.
The transportation is the critical and essential process in the supply chain. The energy in cold insulation and normal chain transportation are mainly the driving energy, while the energy in cold chain transportation is mainly composed of the driving energy and the refrigeration energy.
The driving energy is related to the driving engine power and transportation time. The refrigeration energy is related to the power of the refrigeration plant and the refrigeration time in refrigeration transportation. The transportation energy
is calculated as described in Equations (3)–(5).
where the
is the driving energy, the
is the refrigeration energy in refrigeration transportation, the
is the driving engine power of the truck, the
is the total transportation time, the
is the power of the refrigeration plant and the
is the refrigeration time of the table grapes in refrigeration transportation.
2.3. Energy Conservation Potential Assessment Method
The energy consumption per unit energy factor [
28,
29,
30], which is a scientific and reasonable energy consumption evaluation index to represent the total energy consumption of product per kilogram processed and the average energy conservation potential of the supply chain, was applied to assess the comprehensive energy consumption of table grapes supply chain through its entire lifecycle in various situations. The energy conservation potential of the product was higher if its value was also higher.
Assuming that the table grapes supply chain includes
energy consumption phases, the number of the table grapes processed in the phases are
, the actual energy consumption in the phases are
and the calculated energy consumption in the phases are
, then the energy consumption per unit energy factor of table grapes supply chain
is defined as Equation (6).
where the
is the energy factor that represents the complexity of table grapes supply chain, the
represents the calculated theoretical energy consumption of table grapes supply chain, and the
represents the actual energy consumption.
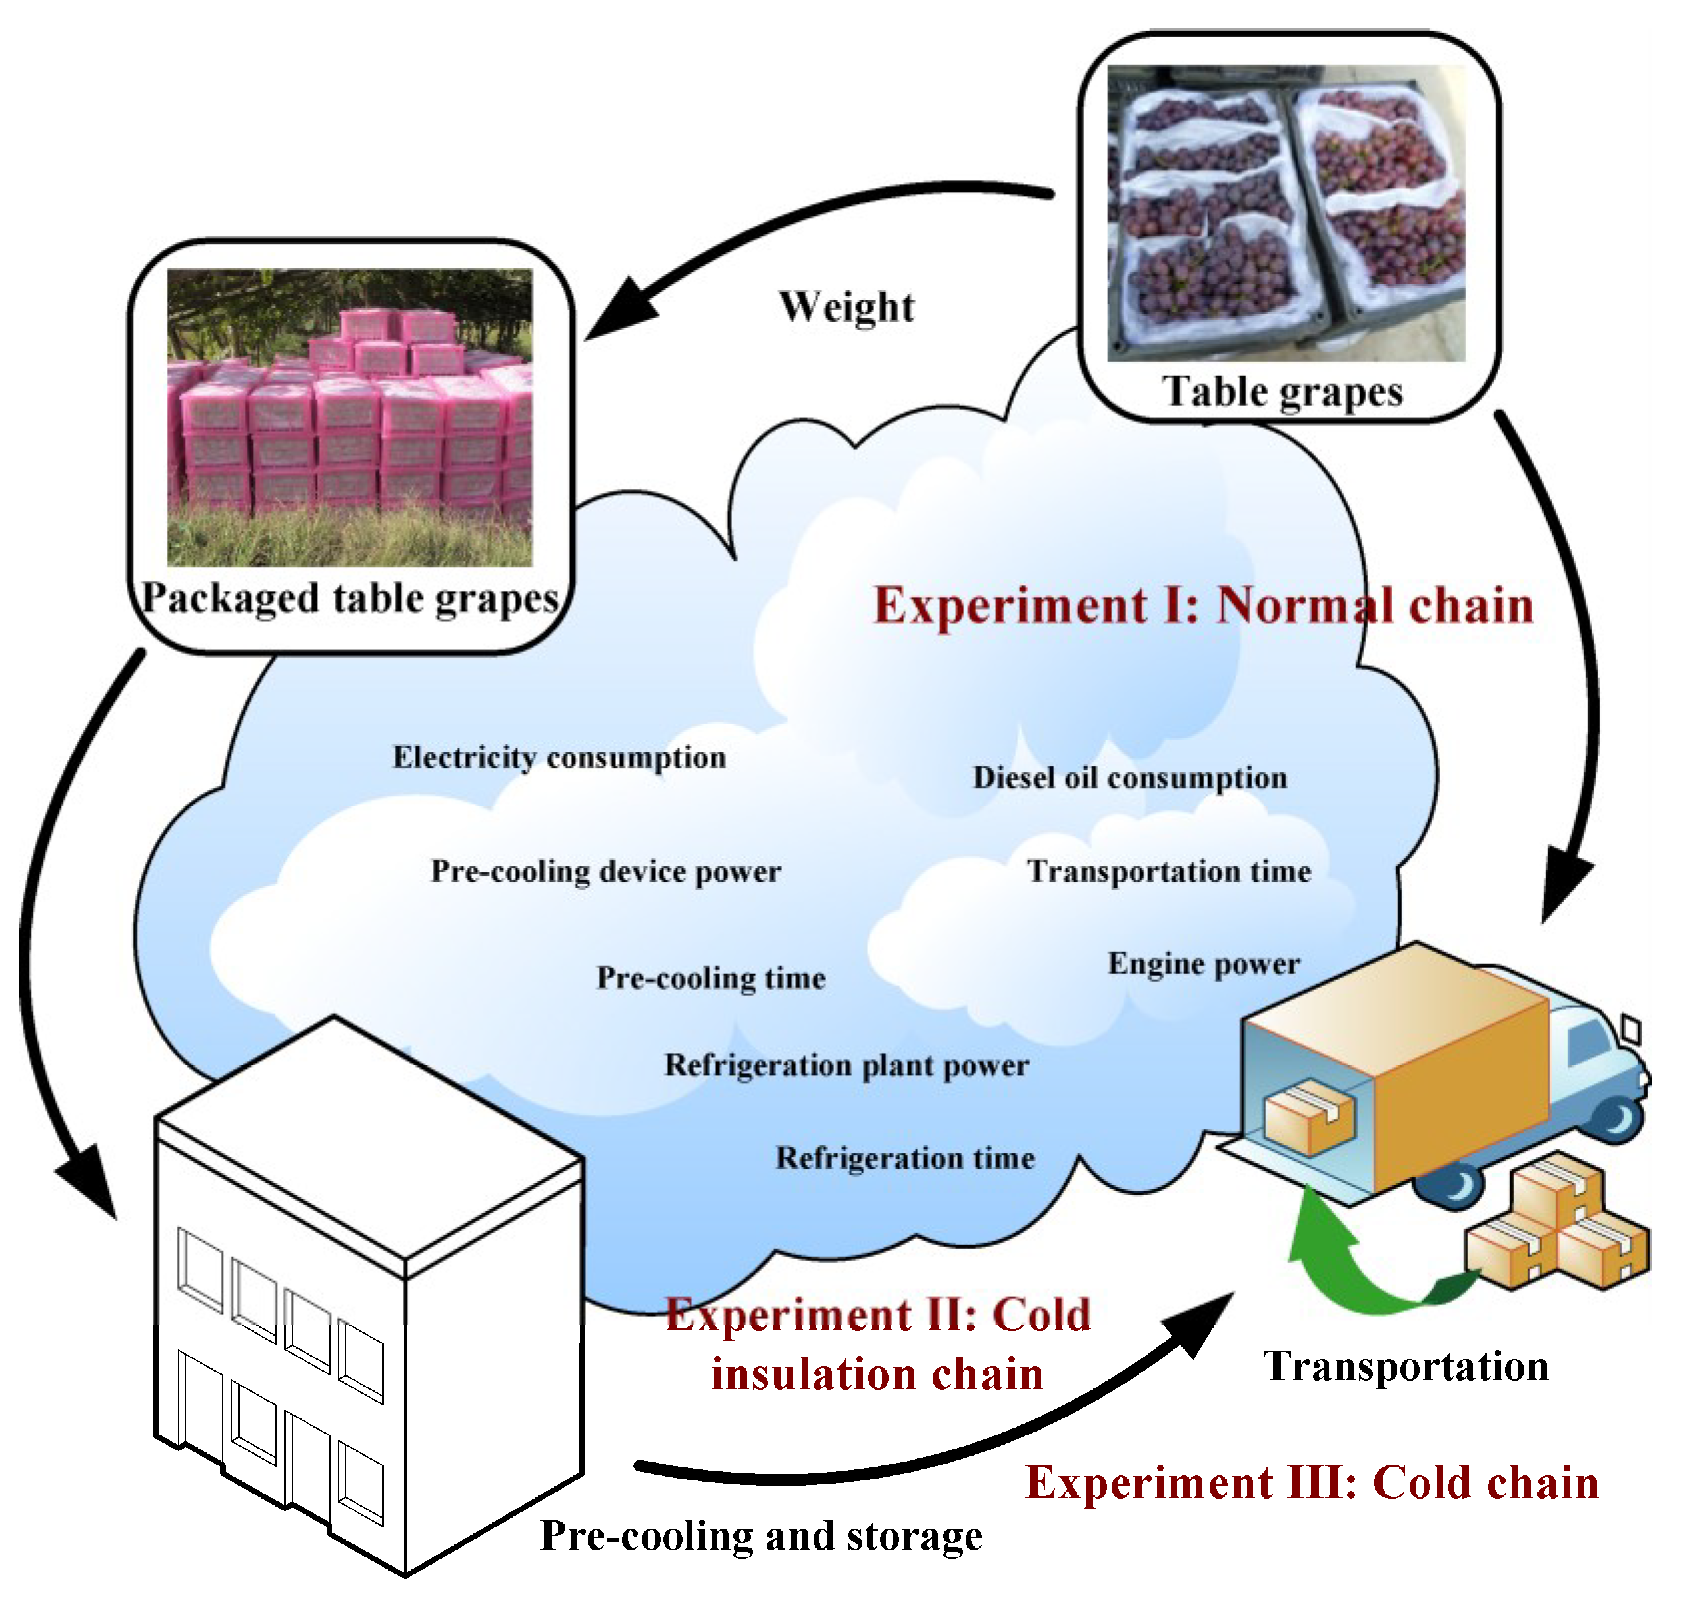
2.4. Experimental Scheme
The Kyoho table grapes (
Vitis vinifera L. ×
V. labrusca L. cv. Kyoho) were chosen as the experimental material. Three experiments were performed to the table grapes supply chain of the normal chain, cold insulation and cold chain. The experimental scheme of the table grapes supply chain is demonstrated in
Figure 2.
Experiment I was conducted for the normal chain of table grapes for investigating the energy consumption in the process of the ordinary transportation.
Experiment II was performed in relation to the cold insulation chain of table grapes for calculating the energy consumption in the process of the pre-cooling, the storage and the cold insulation transportation.
Experiment III was conducted for the cold chain of table grapes for evaluating the energy consumption in the process of the pre-cooling, the storage and the refrigeration transportation.
For Experiment I, the table grapes were picked and packed in a greenhouse from Hebei province, and ordinarily transported to Beijing city. The table grapes were manually harvested at complete ripeness without machinery and pest damage. The diesel oil consumption, which includes the ordinary transportation from the greenhouse to the distribution center and from the distribution center to Beijing city, was evaluated.
For Experiment II, the table grapes, which were the same as the harvest of Experiment I, were picked and packed in a farm from Xingjiang uygur autonomous region, and finally cold insulation transported to Shandong province. The electricity consumption in pre-cooling and storage, and the diesel oil consumption which includes the ordinary transportation from the farm to the cold storage and the cold insulation transportation from the cold storage to Guangzhou city, were assessed.
For Experiment III, which were the same as Experiment II, the table grapes were refrigeration transported from the Xingjiang uygur autonomous region to Guangzhou city. The electricity consumption in pre-cooling and storage, and the diesel oil consumption, which includes the ordinary transportation from the farm to the cold storage and the refrigeration transportation from the cold storage to Guangzhou city, were evaluated.
The table grapes were weighed after the package by using the platform scale (TGT-1000B, Shanghai, China). The electricity consumption was measured by recording the power of the pre-cooling and refrigeration devices and the pre-cooling and the refrigeration time in cold storage. The diesel oil consumption was assessed by recording to the engine power, the transportation distance and the average velocity in cold insulation chain and the cold chain, and also the refrigeration plant power and the refrigeration time in the process of refrigeration transportation in cold chain.
2.5. Statistical Analysis
The energy consumption in table grapes supply chain was analyzed by using energy consumption loss rate [
31]. The definition is demonstrated as Equation (7).
In addition, the energy consumption in the table grapes supply chain was expressed by mega joule (MJ) [
32]. The electricity consumption of 1 kWh was about 3600 kJ [
33]. The diesel oil consumption of 1 L was about 0.85 kg [
34], and the diesel oil consumption of 1 kg was about 42,652 kJ [
35].
The data statistical and processing were performed by using Matlab R2012b software (MathWorks Incorporated, Massachusetts Natick, MN, USA) and Microsoft Office Excel 2016 software (Microsoft Corporation, Redmond Washington, RW, USA).
3. Results
Comparison results of the energy consumption and the energy conservation potential in the table grapes supply of the normal chain, cold insulation chain and cold chain are analyzed and assessed in this section according to the experimental scheme.
3.1. Energy Consumption Analysis in Normal Chain
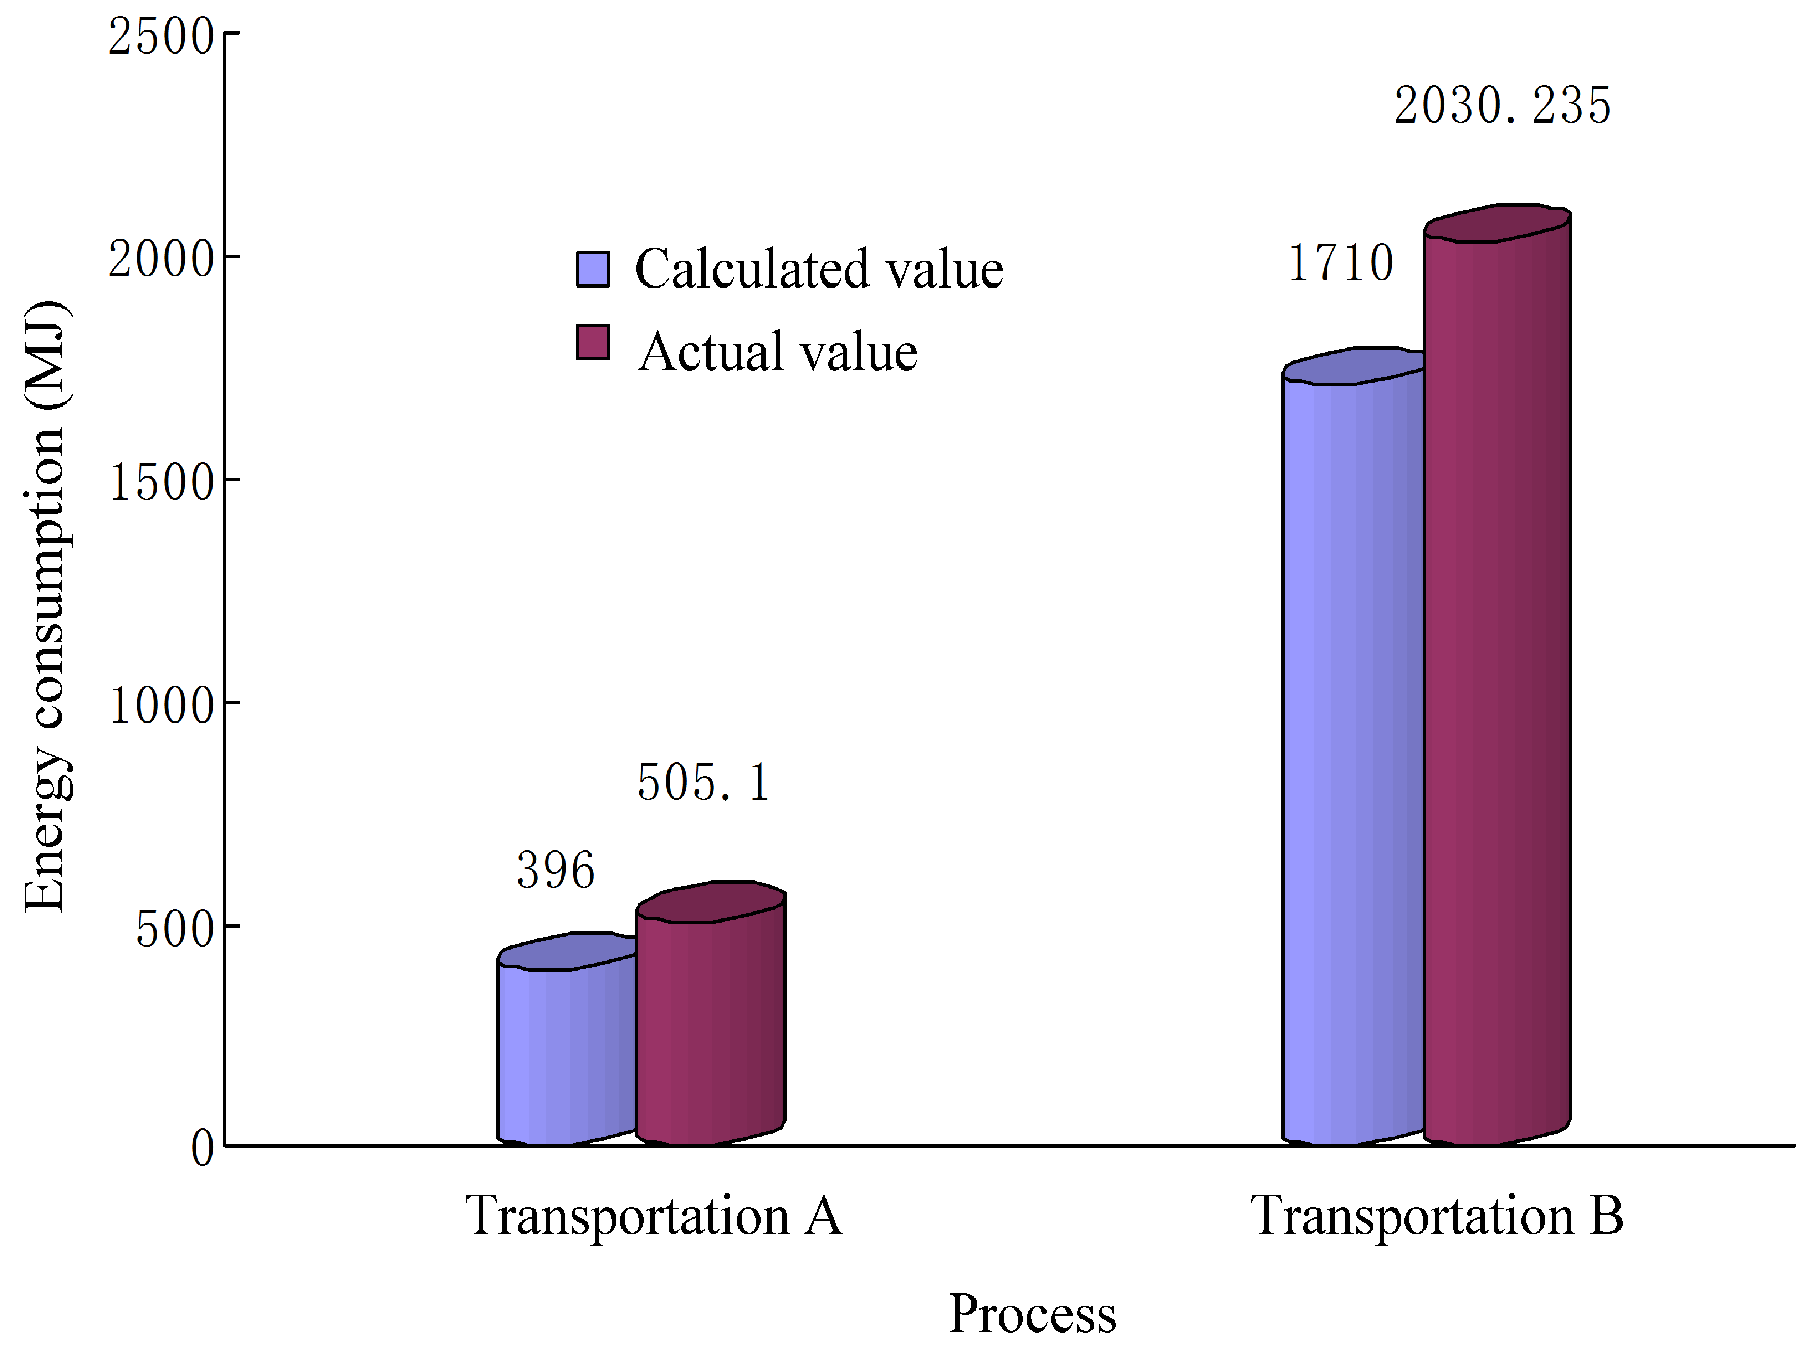
As illustrated in Experiment I, the table grapes in normal chain were transported from Hebei province to Beijing city in China. The total weight of the table grapes was about 10,000 kg, and the time of the whole chain was about 10 h. The energy consumption in normal chain was mainly from the transportation process.
The general small truck, whose engine power was about 22 kW, was employed to the ordinary transportation from the greenhouse to the distribution center. The one-way transportation distance was about 3 km. The total transportation frequency was about 10, and the average weight was about 1000 kg every time. The total transportation time was about 5 h. The total diesel oil consumption was about 13 L in the actual transportation.
The general medium truck, whose engine power was about 95 kW, was applied to the ordinary transportation from the distribution center to the market. The transportation distance was about 202 km, and the average transportation time was about 5 h. The total diesel oil consumption was about 56 L in actual transportation.
The comparison of the calculated and actual energy consumption in normal chain is demonstrated in
Figure 3. The calculated energy consumption in the ordinary transportation from the greenhouse to the distribution center was about 396 MJ, and the calculated energy consumption in the ordinary transportation from the distribution center to the market was about 1710 MJ. The actual energy consumption in the ordinary transportation from the greenhouse to the distribution center was about 505.1 MJ, and the actual energy consumption in the ordinary transportation from the distribution center to the market was about 2030.235 MJ.
The loss rate of the calculated and actual energy consumption in normal chain was described in
Table 1. The loss rate of the energy consumption in the ordinary transportation from the greenhouse to the distribution center (Transportation A) was about 21.59%, and the loss rate of the energy consumption in the ordinary transportation from the distribution center to the market (Transportation B) was about 15.78%. The total loss rate of the energy consumption in normal chain was about 16.93%.
3.2. Energy Consumption Analysis in Cold Insulation Chain
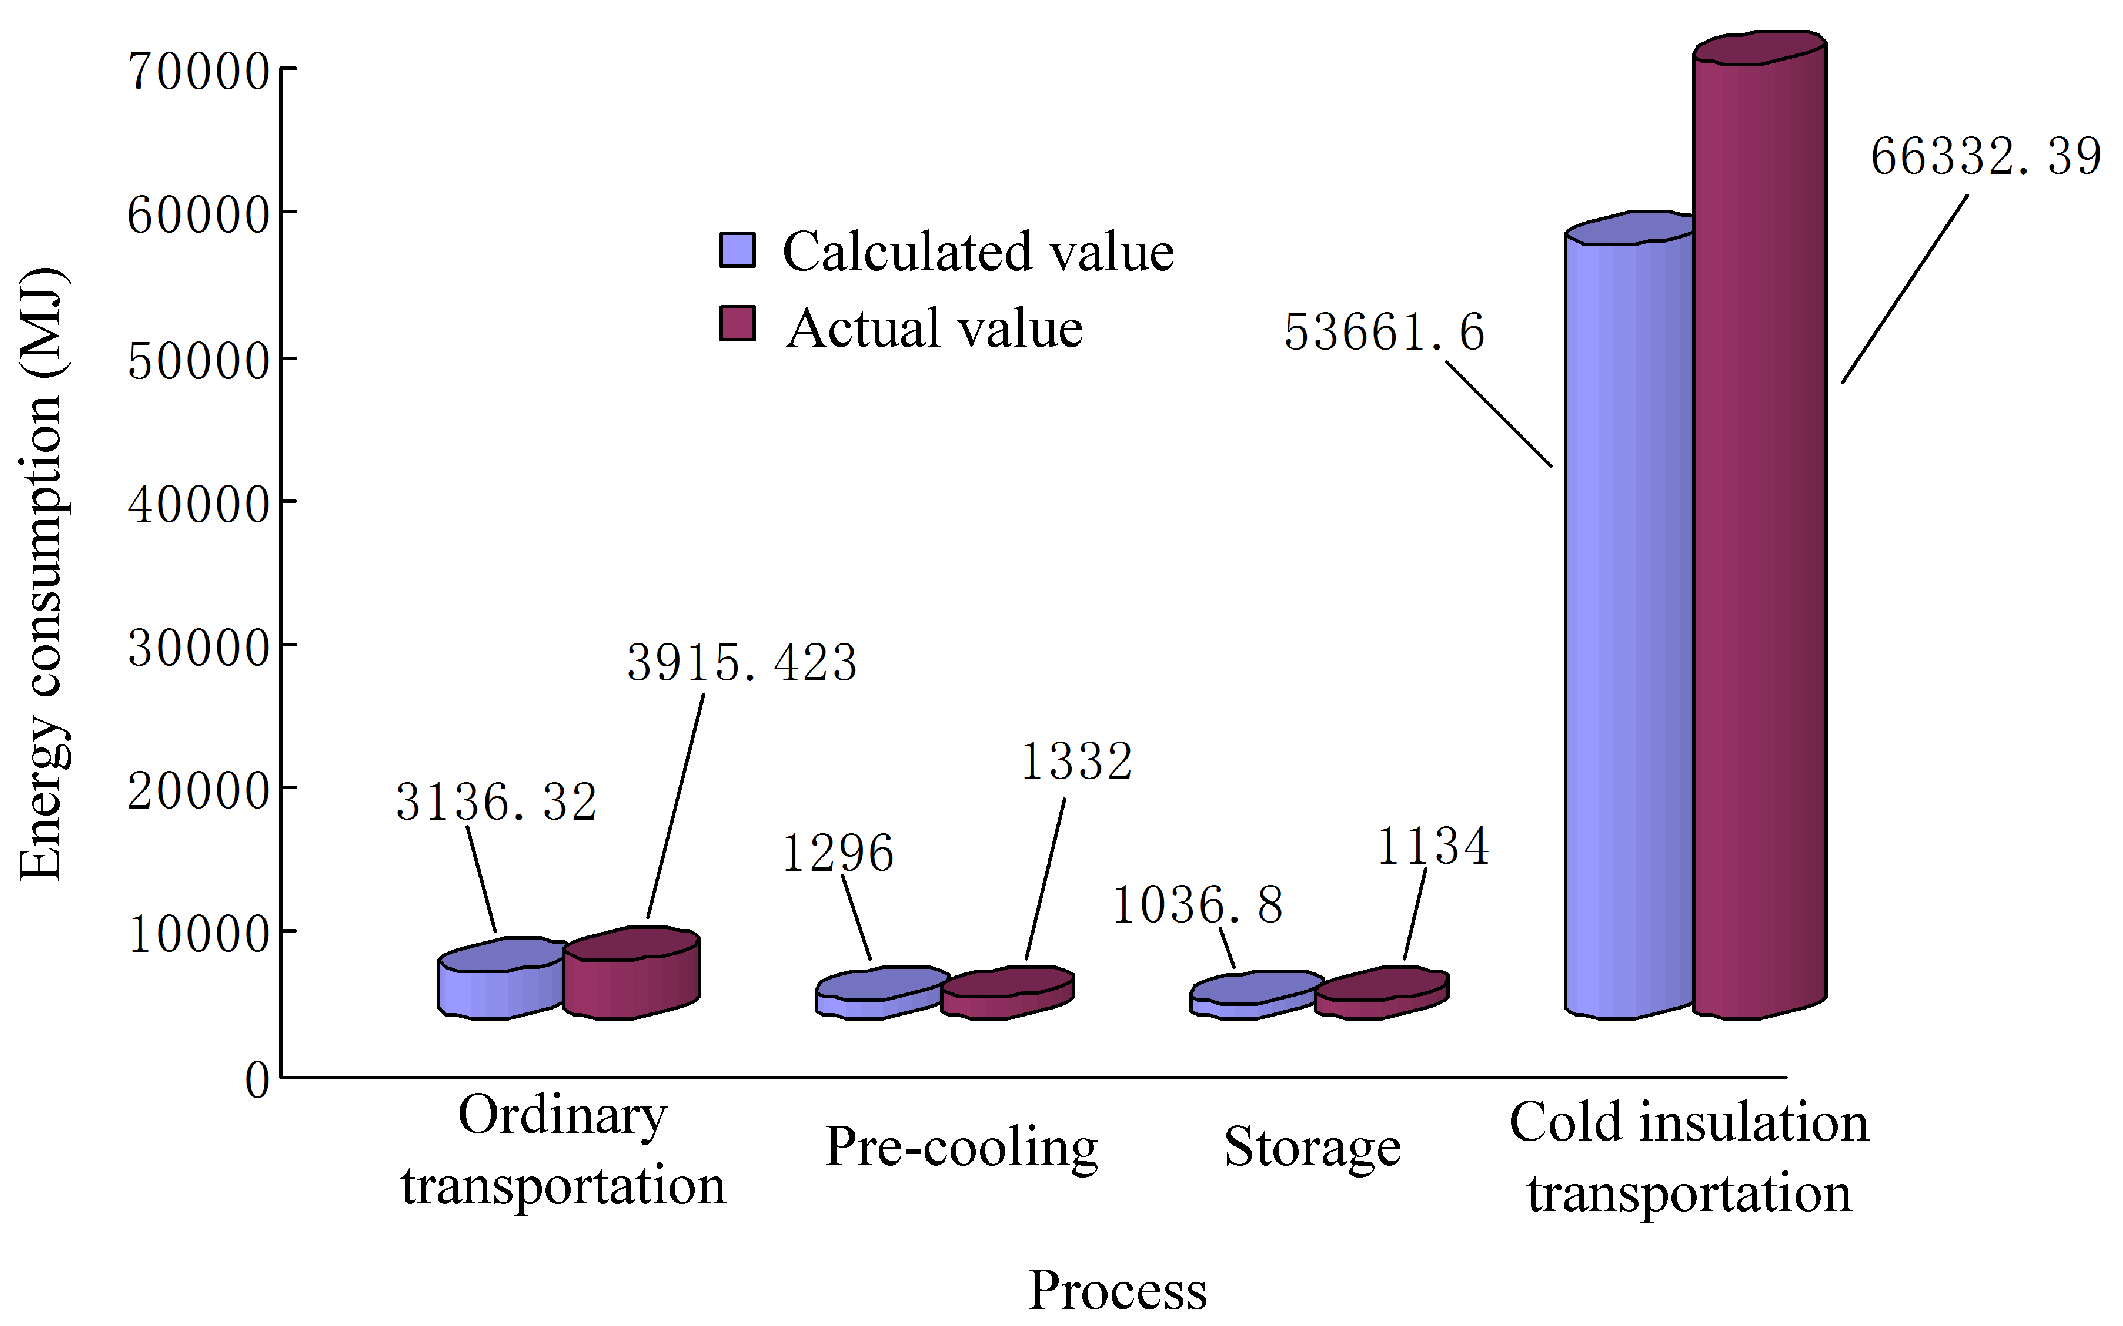
As illustrated in Experiment II, the table grapes in cold insulation chain were transported from Xingjiang uygur autonomous region to Shandong province in China. The total weight of the table grapes transported was about 26,000 kg, and the time of the whole chain was about 8 days. The energy consumption in cold insulation chain was mainly from the process of pre-cooling, storage and transportation.
The general small truck, the same as Experiment I, was employed to the ordinary transportation from the farm to the cold storage. The one-way transportation distance was about 5 km. The total transportation frequency was about 20, and the average weight was about 1300 kg every time. The total transportation time was about 39.6 h. The total diesel oil consumption was about 108 L in actual transportation.
The forced air-cooling method, which forces the cool air flowing in the cold storage in cycle, was applied to the pre-cooling and storage. The power of the refrigeration plant in pre-cooling was about 15 kW, and the power of the refrigeration plant in storage was about 4 kW. The pre-cooling time was about 24 h, and the storage refrigeration time in storage was about 72 h.
The general heavy truck, whose engine power was about 257 kW, was applied to the cold insulation chain transportation from the cold storage to the market. The transportation distance was about 3689 km. The average transportation time was about 4 days, and the actual driving time was about 58 h. The total diesel oil consumption was about 1642 L in actual transportation.
The comparison of the calculated and actual energy consumption in cold insulation chain is illustrated in
Figure 4. The calculated energy consumption in the process of the ordinary transportation, pre-cooling, storage, and cold insulation transportation was about 3136.32 MJ, 1296 MJ, 1036.8 MJ and 53,661.6 MJ. The actual energy consumption in the ordinary transportation, pre-cooling, storage and cold insulation chain was about 3915.453 MJ, 1332 MJ, 1134 MJ and 66,332.39 MJ.
The loss rate of the calculated and actual energy consumption in cold insulation chain is presented in
Table 2. The loss rate of the energy consumption in the ordinary transportation, pre-cooling, storage and cold insulation transportation was about 19.9%, 2.7%, 8.57% and 19.11%. The total loss rate of the energy consumption in cold insulation chain was about 18.87%.
3.3. Energy Consumption Analysis in Cold Chain
As illustrated in Experiment III, the table grapes in cold chain were transported from Xingjiang uygur autonomous region to Guangzhou city in China. The total weight of the table grapes transported was about 30,000 kg, and the time of the whole chain was about 10 days. The energy consumption in cold chain was mainly from the process of pre-cooling, storage and transportation.
The general small truck, the same as the experiment I, was employed to the ordinary transportation from the farm to the cold storage. The one-way transportation distance was about 6 km. The total transportation frequency was also about 20, and the average weight was about 1500 kg every time. The total transportation time was about 33.6 h. The total diesel oil consumption was about 97 L in actual transportation.
The pressure cooling method, which forced the cool air flowing through the different pressure on both sides of the packaged table grapes in the cold storage, was applied to the pre-cooling and the storage. The power of the refrigeration plant in pre-cooling was about 56 kW, and the power of the refrigeration plant in storage was also about 2 kW. The pre-cooling time was about 15 h, and the storage refrigeration time in storage was about 113 h.
The heavy refrigeration truck, whose engine power was about 275 kW, was used to the refrigeration transportation from the cold storage to the market. The transportation distance was about 4780 km. The average transportation time was about 5 days, and the actual driving time was about 95 h. The total diesel oil consumption was about 3073 L in actual transportation.
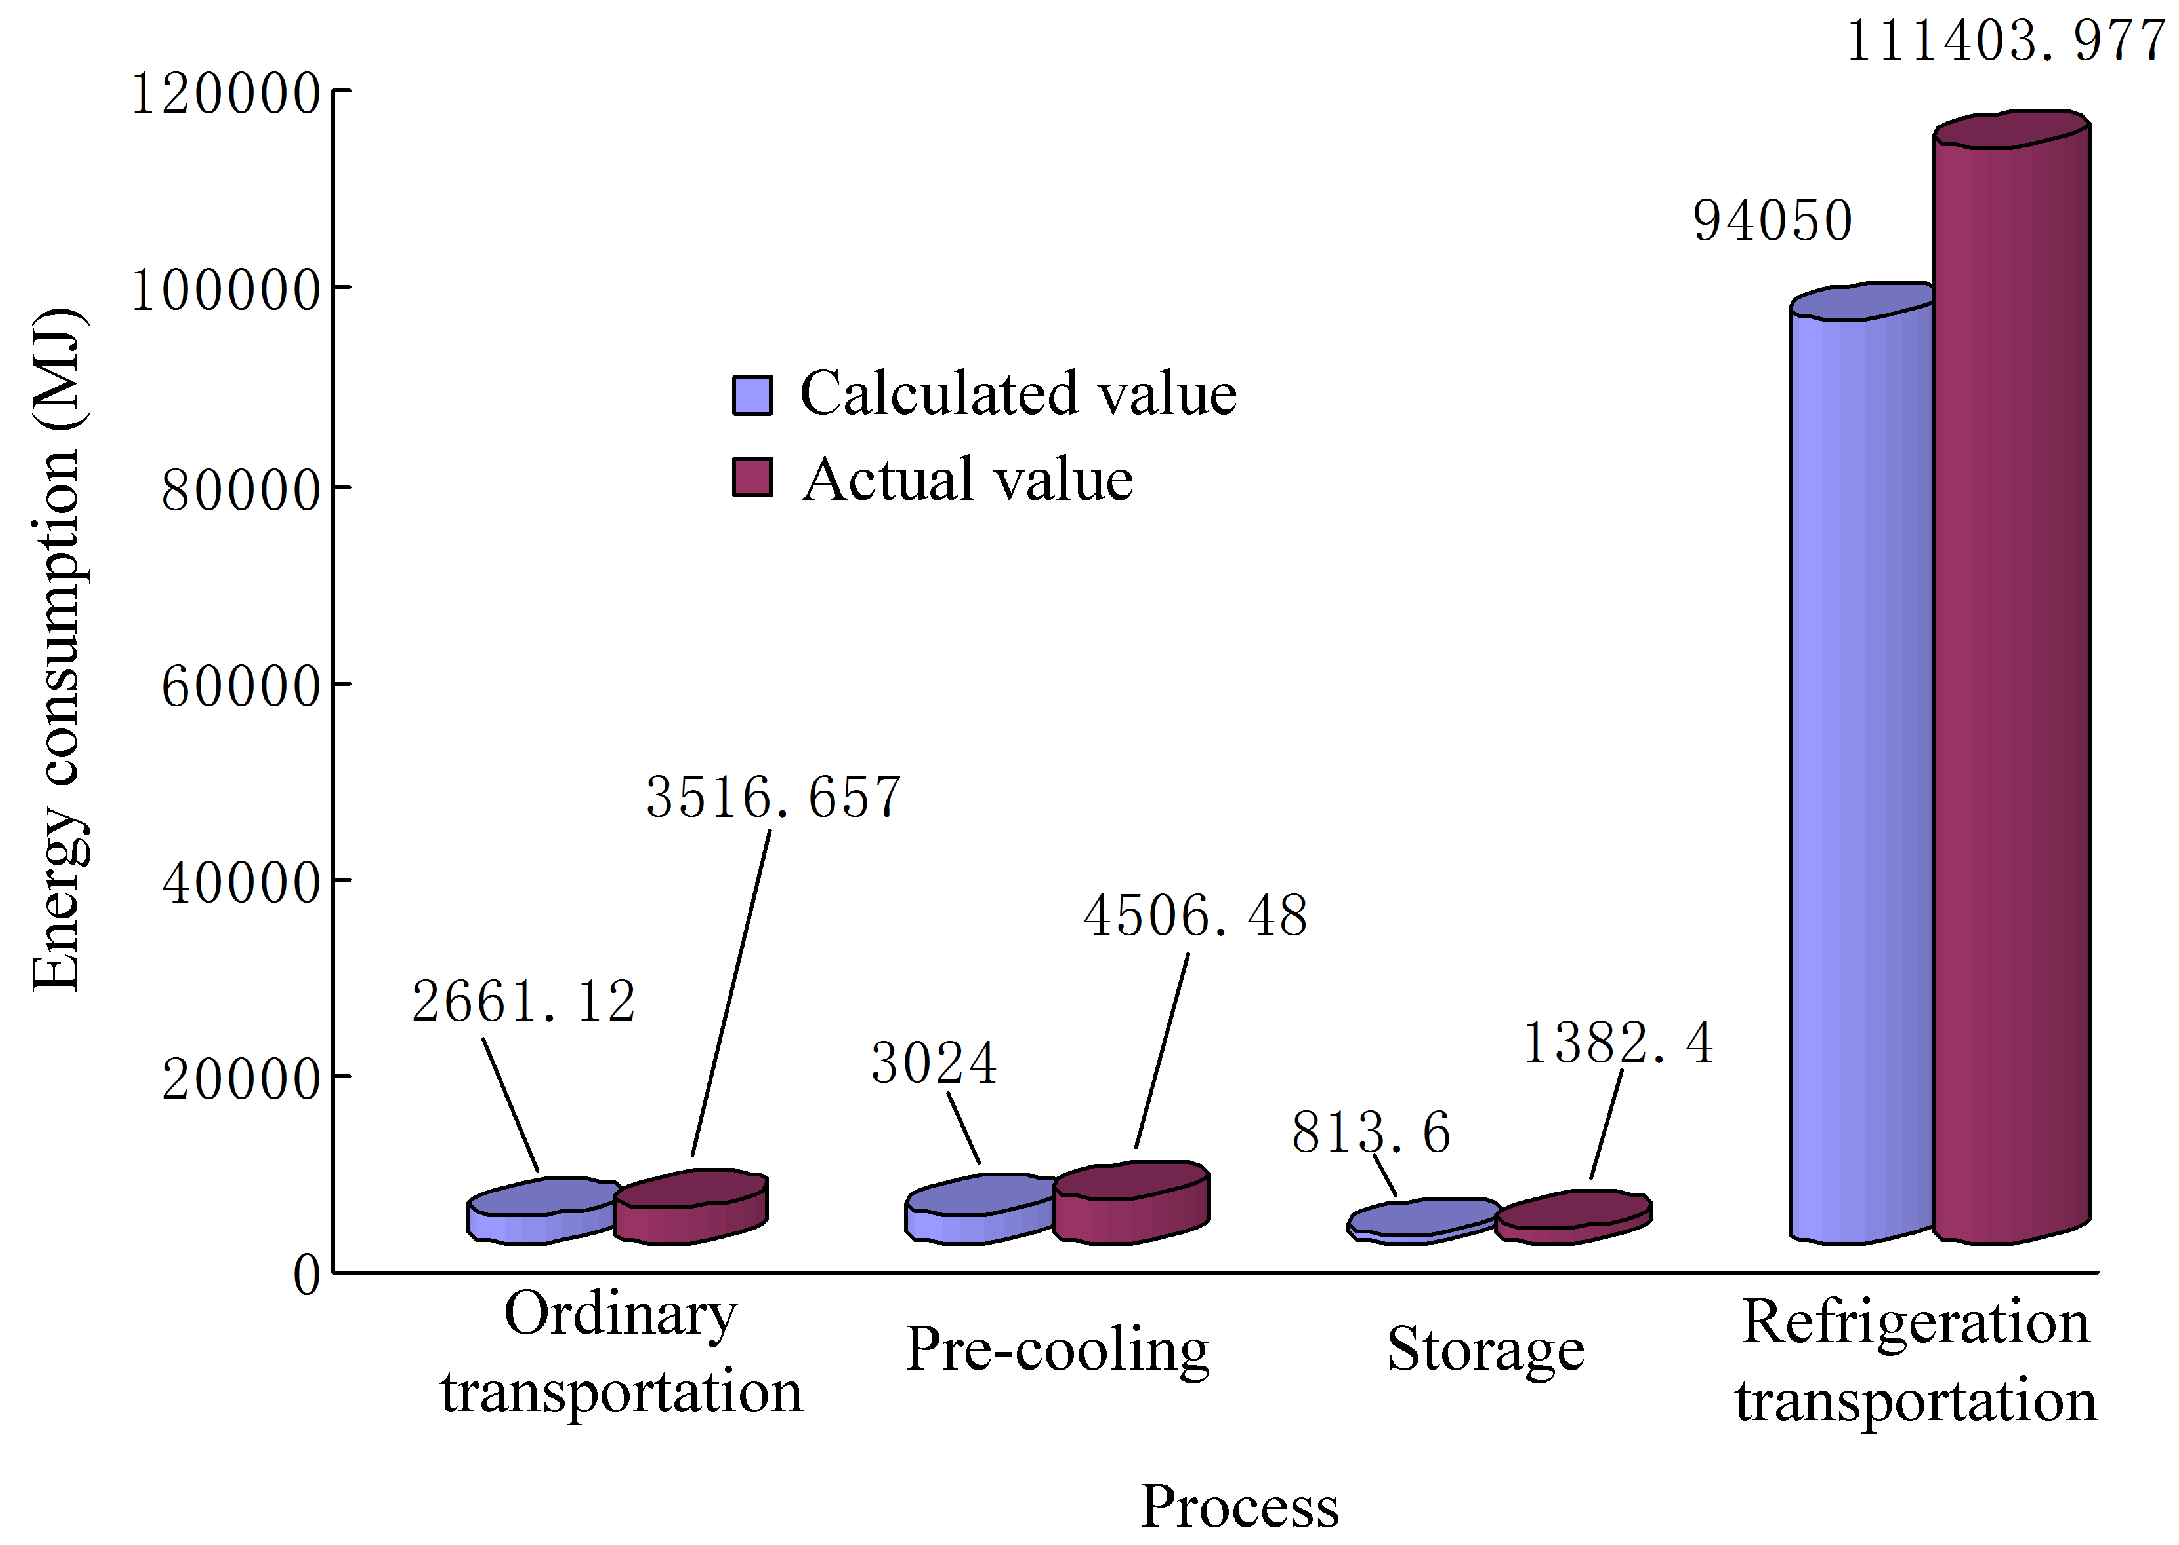
The comparison of the calculated and actual energy consumption in cold chain is illustrated in
Figure 5. The calculated energy consumption in the ordinary transportation, pre-cooling, storage and refrigeration transportation was about 2661.12 MJ, 3024 MJ, 813.6 MJ and 94,050 MJ, and the actual energy consumption in the ordinary transportation, pre-cooling, storage and cold insulation chain was about 3516.657 MJ, 4506.48 MJ, 1382.400 MJ and 111,403.977 MJ.
The loss rate of the calculated and actual energy consumption in cold chain was presented in
Table 3. The loss rate of the energy consumption in the ordinary transportation, pre-cooling, storage and refrigeration transportation was about 24.33%, 32.9%, 41.15% and 15.58%. The total loss rate of the energy consumption in cold chain was about 15.21%.
3.4. Energy Consumption Comparison Analysis in Table Grapes Supply Chain
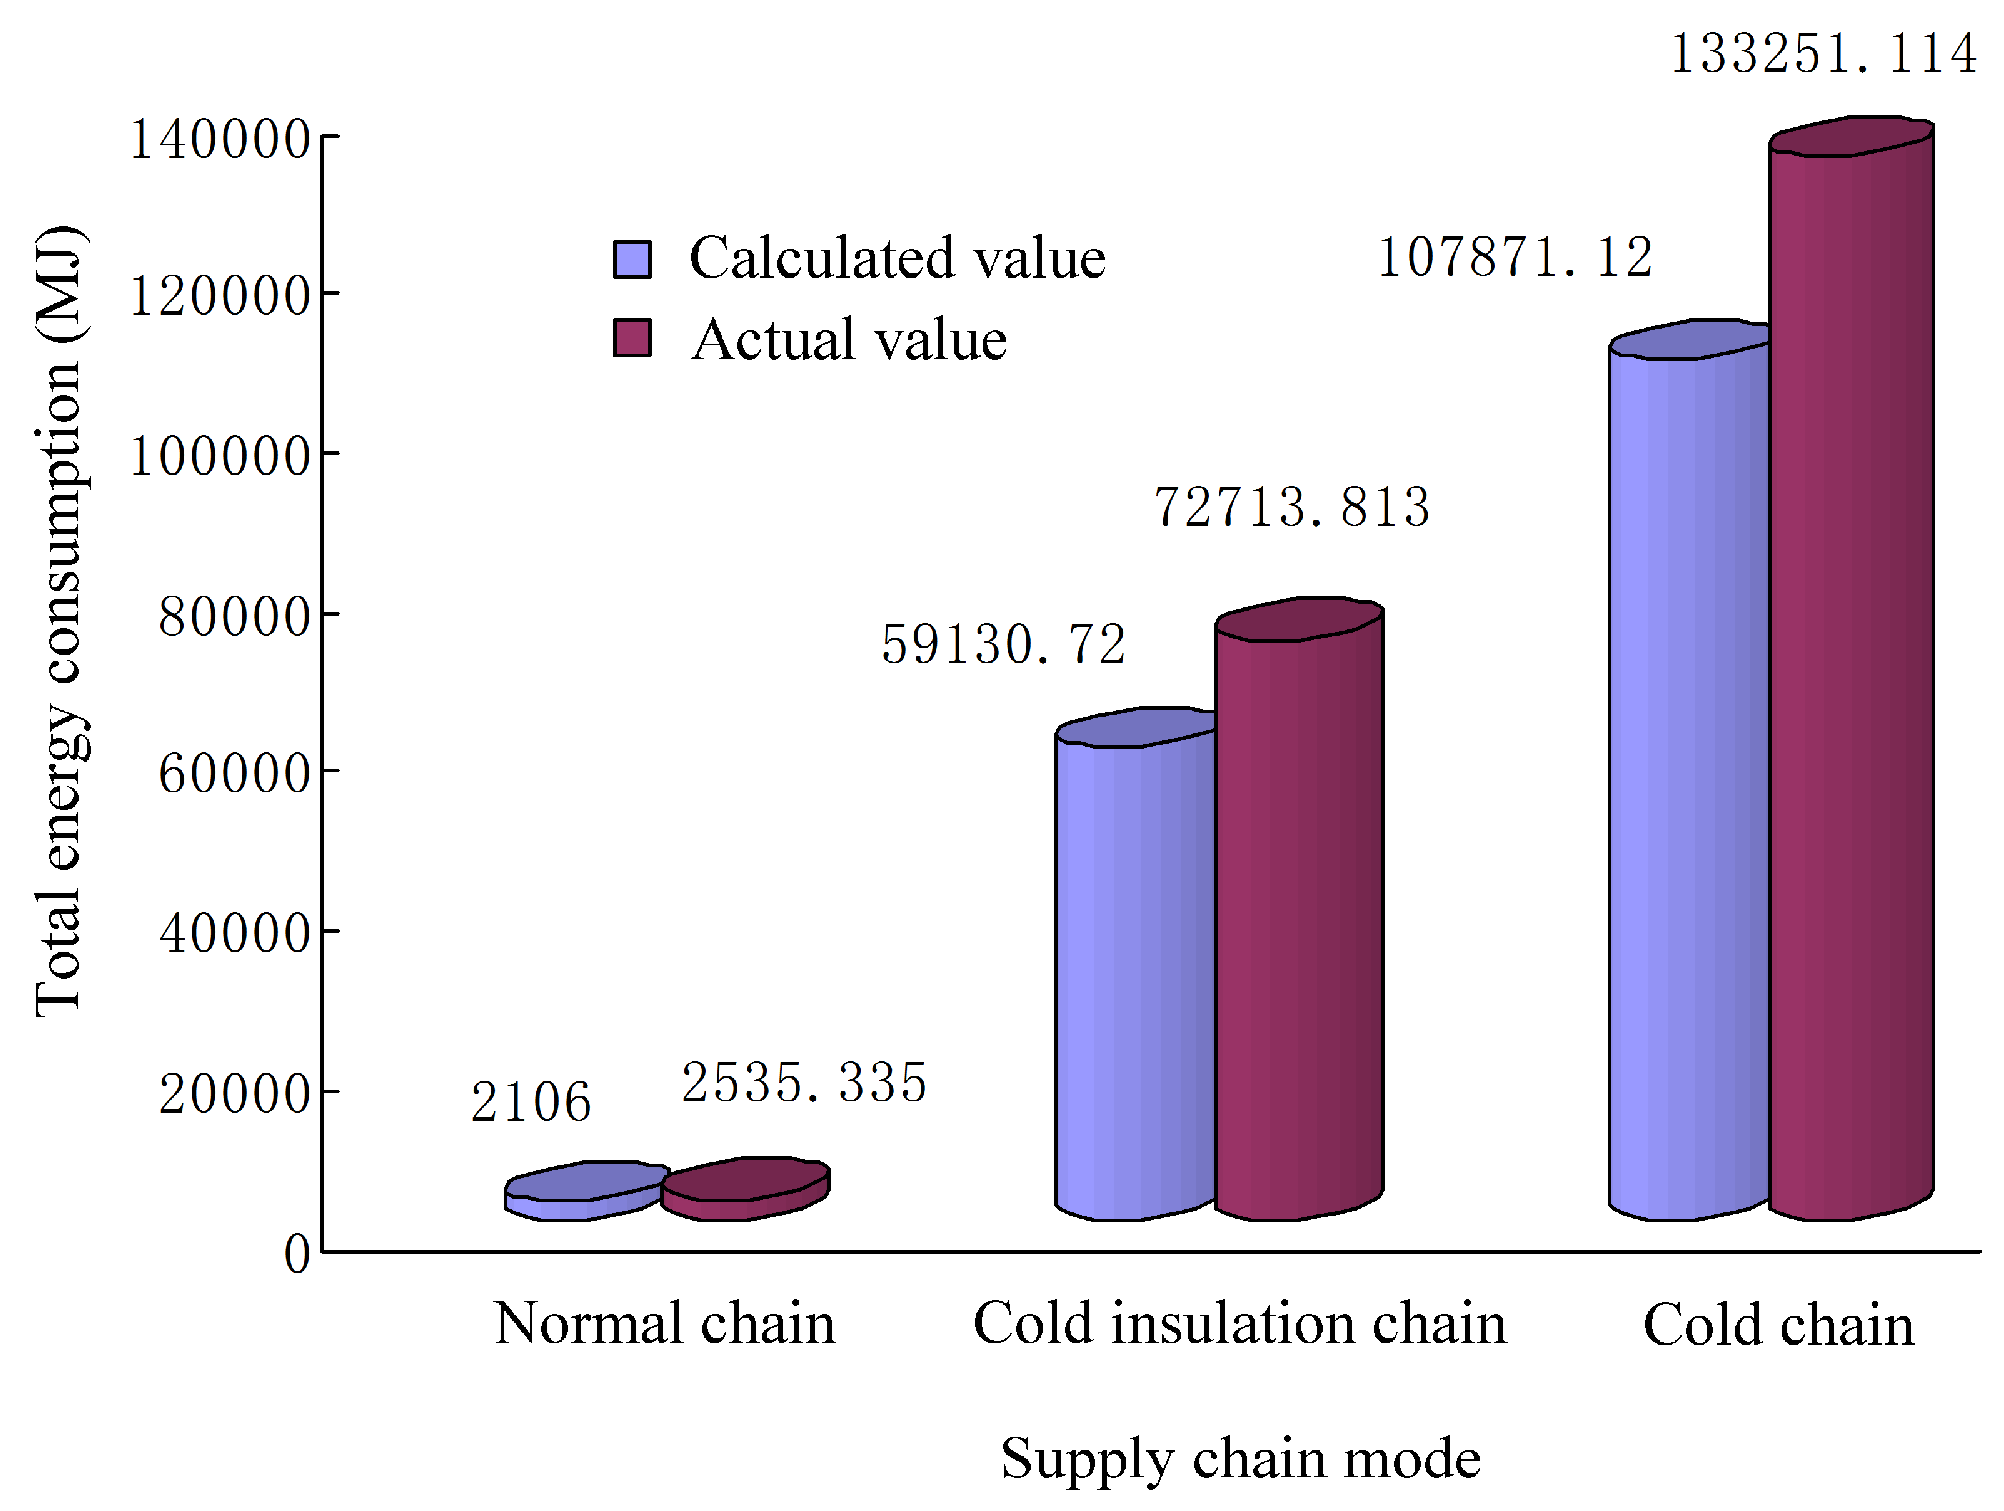
The different supply chain has the different process and cost to guarantee the quality and safety of the table grapes. The total energy consumption in the normal chain, cold insulation chain and cold chain is demonstrated in
Figure 6. The actual and calculated energy consumption in the cold chain was about 133,251.114 MJ and 107,871.12 MJ, and the actual and calculated energy consumption in the normal chain was about 2535.335 MJ and 2106 MJ.
3.5. Energy Conversation Potential Assessment in Table Grapes Supply Chain
The energy conservation potential in the normal chain, cold insulation chain and cold chain were assessed by combining with the energy consumption analysis. The energy factor in different supply chain was described in
Figure 7 and the energy consumption per unit energy factor in different supply chain was illustrated in
Figure 8.
As presented in
Figure 7 and
Figure 8, the energy factor in the normal chain was about 5.32 and the energy consumption per unit energy factor was about 0.944. The energy factor in the cold insulation chain was about 18.85 and the energy consumption per unit energy factor was about 0.985. The energy conversation potential in cold insulation chain was highest among the table grapes supply chain mode. The energy factor in the cold chain was about 37.78 and the energy consumption per unit energy factor was about 0.935. The energy conversation potential in cold chain was smallest.
4. Discussion
According to the energy consumption analysis of the table grapes supply chain, the energy consumption in the cold chain was highest because of the complex refrigeration process and long-distance transportation in the cold chain, and the energy consumption in the normal chain was lowest because of the simple and short distance transportation.
The different supply chain has the different process and cost to guarantee the quality and safety of the table grapes. The more the processes were in supply chain, the more devices were needed, thus making the more energy consumption. The cold chain should keep the table grapes be stored at a low temperature all the time by the refrigeration plants in the whole chain, while the cold insulation chain was just refrigeration storage in the pre-cooling and storage, and the normal chain was transported in the ambient environment.
According to the energy consumption analysis results in the table grapes supply chain, the energy consumption in actual supply chain were all higher than that the calculated value. The results may be due to that the external devices or operation energy consumption in supply chain. For example, the lighting, the loading and unloading operation energy consumption in pre-cooling and storage, the air conditioner used in summer day in the truck, and also the heavy traffic in the actual transportation [
36].
As presented in
Figure 7 and
Figure 8, the energy factor in the normal chain was lower than that in the cold insulation chain and cold chain, while the energy consumption per unit energy factor was higher than that in the cold chain and lower than that in the cold insulation chain. The reason may due to the simple process and short distance transportation in the normal chain. The energy conversation potential in normal chain was relatively small.
The energy factor in the cold insulation chain was lower than that in the cold chain and higher than that in normal chain, while the energy consumption per unit energy factor was highest. The energy conversation potential in cold insulation chain was highest. The reason may due to that there was also no any energy conservation measures were applied in the cold insulation chain, and also the old truck was used in the investigated ordinary and cold insulation transportation [
29,
30,
31].
The energy factor in the cold chain was highest, while the energy consumption per unit energy factor was lowest. The energy conversation potential in cold chain was smallest. The reason may due to the complex refrigeration process and long-distance transportation, and also the advanced refrigeration measures, such as the refrigeration plant and truck, were applied in cold chain.
However, the cold chain was still the optimal supply chain for the table grapes because of the characteristics of the longest storage shelf life and the lowest quality decay even though the cold chain has a smallest conservation potential according to the result of the energy conversation potential assessment. The energy consumption in the cold chain would also be further reduced by adopting the more advanced refrigeration and preservation technologies [
37,
38,
39].
The results show that the energy conservation potential assessment method could provide a unified method for evaluating the energy conservation potential in different supply chain mode of table grapes, increase the energy transparency in table grapes supply chain, and finally help the manager take the appropriate energy conservation measures to reduce the energy consumption in different supply chain mode.
5. Conclusions
This paper proposes an energy conservation potential assessment method for the supply chain management of table grapes in order to increase the energy consumption transparency and help the manager take the appropriate energy conservation measures to reduce the energy consumption. The energy consumption and conservation potential assessment in three kinds of the supply chain mode, which are the normal chain, the cold insulation chain and the cold chain, were realized by integrating the actual energy consumption investigated with the unified energy consumption per unit energy factor. The energy consumption comparison and the energy conservation potential in actual table grapes supply chain were comprehensively analyzed and assessed.
The different supply chain has the different process and cost to guarantee the quality and safety of the table grapes. The more the processes were in supply chain, the more devices were needed, thus making the more energy consumption. The energy consumption in the cold chain, whose actual value was about 133,251.114 MJ and calculated value was about 107,871.12 MJ, was highest, and the energy consumption in the normal chain, whose actual value was about 2535.335 MJ and calculated value was about 2106 MJ, was lowest. The total loss rate of the energy consumption in normal chain, cold insulation chain and cold chain was about 16.93%, 18.87% and 15.21%, respectively.
The energy conversation potential in cold insulation chain, which was about 0.985, was the highest and that in cold chain, which was about 0.935, was the smallest. However, the cold chain was still the optimal supply chain for the table grapes because of the characteristics of the longest storage shelf life and the lowest quality decay, and the cold chain energy consumption would be further reduced by adopting the more advanced refrigeration and preservation technologies.
In this study, the comprehensive analysis of the energy consumption comparison and the energy conservation potential in actual table grapes supply chain indicate that the proposed energy conservation potential assessment method could provide a unified method for evaluating the energy conservation potential in different supply chain mode of table grapes.
The proposed energy conservation potential assessment method could be extended for other supply chain application. It is also possible to integrate the others energy consumption and conservation potential assessment methods such as the life cycle energy consumption into the energy conservation potential for supply chain management.


