Article

Possible Impact of Long and Heavy Vehicles in the United Kingdom—A Commodity Level Approach

1
Transport Research Centre Verne, Tampere University of Technology, Tampere 33720, Finland
2
Centre for Sustainable Road Freight, Heriot-Watt University, Edinburgh EH14 4AS, UK
*
Author to whom correspondence should be addressed.
Sustainability 2018, 10(8), 2754; https://doi.org/10.3390/su10082754
Submission received: 14 June 2018 / Revised: 20 July 2018 / Accepted: 1 August 2018 / Published: 4 August 2018
(This article belongs to the Special Issue Sustainable Freight Transport)

Abstract

:
The potential effects of implementing longer and heavier vehicles (LHVs) in road freight transport have been studied in various countries, nationally and internationally, in Europe. These studies have focused on the implementation of LHVs on certain types of commodities and the experience from countries like Finland and Sweden, which have a long tradition of using LHVs, and in which LHVs used for all types of commodities have not been widely utilised. This study aimed to assess the impacts of long and heavy vehicles on various commodities in the United Kingdom based on the Finnish experiences in order to estimate the possible savings in road freight transport vehicle kilometres, costs, and CO2 emissions in the United Kingdom if LHVs would be introduced and used similarly to in Finland in the transport of various commodities. The study shows that the savings of introducing longer and heavier vehicles in the United Kingdom would be 1.5–2.6 billion vehicle kms, £0.7–1.5 billion in transport costs, and 0.35–0.72 Mt in CO2 emissions. These findings are well in line with previous findings in other countries. The results confirm that considerable savings in traffic volume and emissions can be achieved and the savings are very likely to outweigh possible effects of modal shift from rail to road.

1. Introduction

Road freight transport contributes significantly to global greenhouse gas emissions and its importance is likely to increase in the future as passenger vehicles may be electrified more easily and the energy sector increasingly utilises renewable energy sources in order to mitigate climate change. Hence, greenhouse gas emissions, particularly carbon dioxide (CO2) emissions, from road freight should also be reduced. Various possible measures to achieve emission reductions in road freight have been identified and analysed both nationally (e.g., [1]) and internationally (e.g., [2]). Measures can be broadly catergorised using the ASIF framework to avoiding journeys (A), modal shift (S), lowering transport energy intensity (I), and reducing carbon intensity of fuels (F) [2]. One of the most effective ways to avoid journeys and reduce energy intensity per unit of payload transported of road freight, resulting in reduced CO2 emissions, is to increase the size of road freight vehicles. Provided their payload capacity is fully utilized, larger vehicles are always significantly more fuel efficient per tonne of payload than the smaller vehicles they replace [3].

1.1. Long and Heavy Vehicles (LHVs)

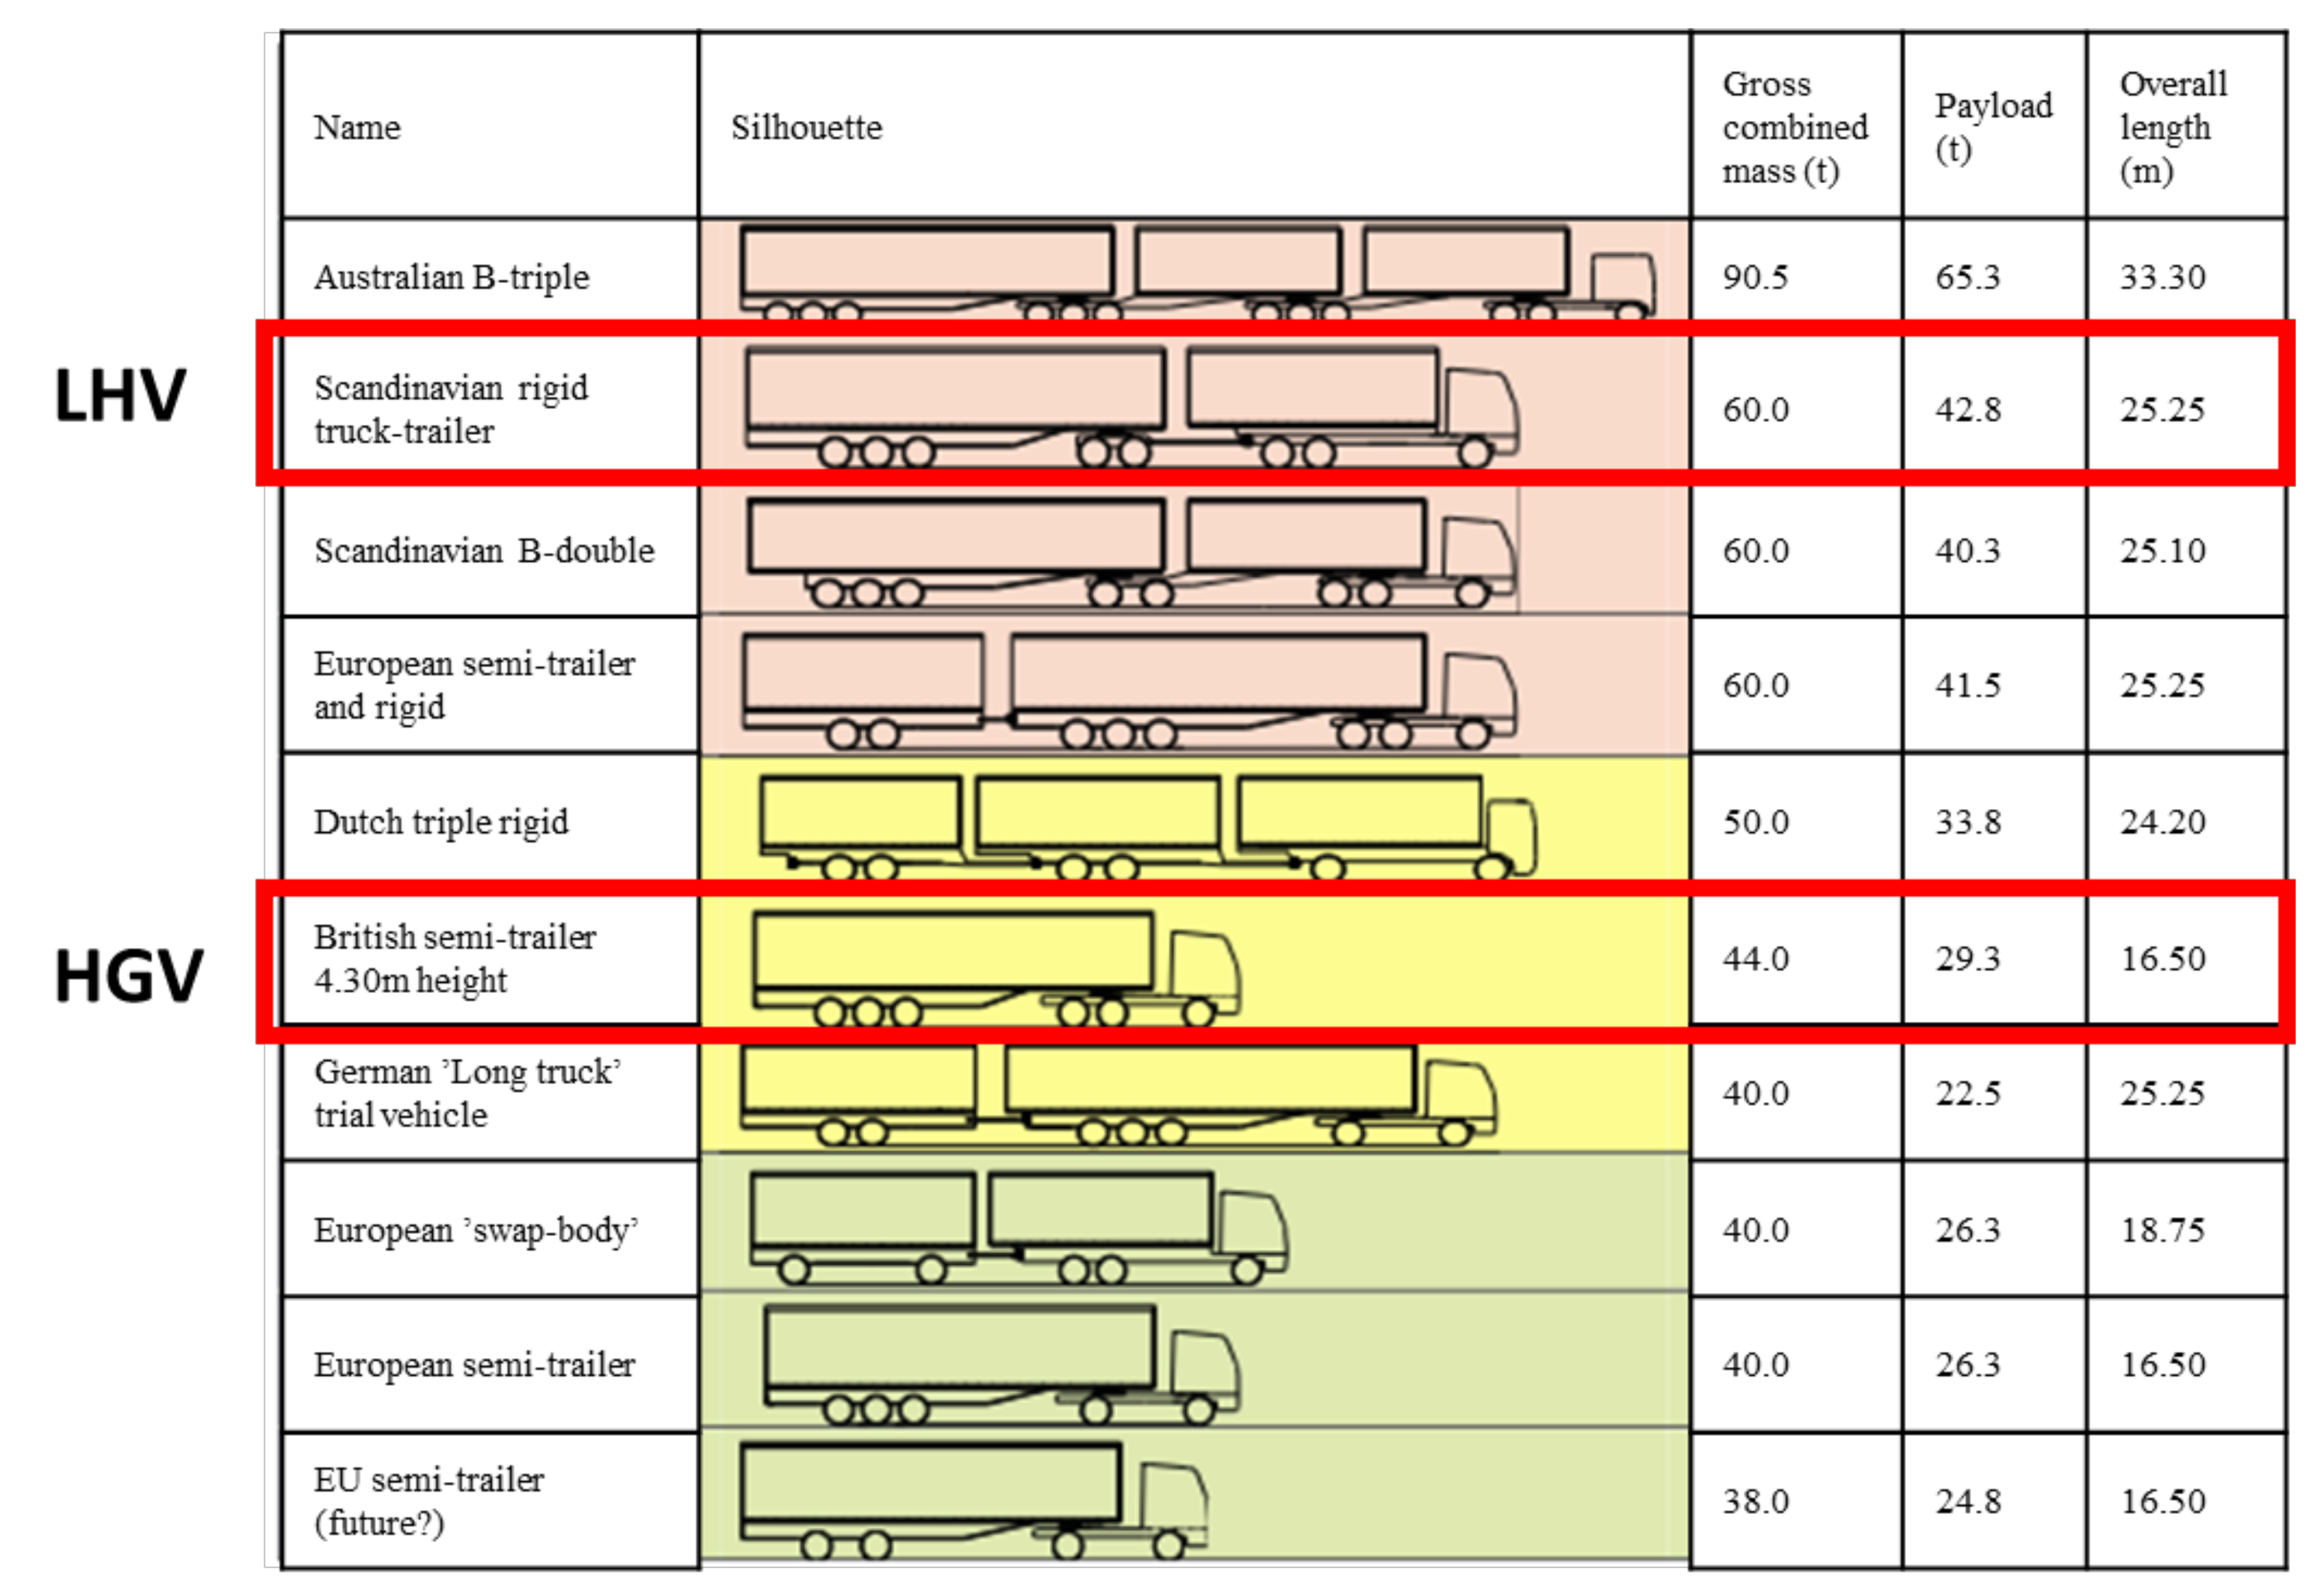
Lorries are used in various tractor-trailer combinations around the world from over 30-m long Australian B-triple vehicles with 90t gross vehicle weight (GVW) to European semitrailer combinations with 16.5 m length and 40t GVW (Figure 1). Also, the height of the vehicles varies from 4 m to 4.8 m of British double-deck semitrailers. Semitrailer vehicles are commonly, as well as in this study, referred to as heavy goods vehicles (HGVs), while the 25.25 m long vehicle combinations are commonly referred to as long and heavy vehicles (LHVs). LHVs may have various maximum gross vehicle weights and trailer combinations following the European modular system (EMS). In this study, LHVs mean the Scandinavian rigid truck–trailer combination with 60t GVW and HGVs mean the British semitrailer with 44t GVW and generally 16.5-m length, although there are currently also 18.75 m semitrailers on British roads due to the on-going ‘longer semitrailer trial’ (https://www.gov.uk/government/collections/longer-semi-trailer-trial).
High-capacity, multiply-articulated long and heavy vehicles (LHVs) are routinely used in Scandinavian countries, the Netherlands, Germany, as well as Australia, Canada, South Africa, and the USA because of their superior productivity and low CO2 emissions per tonne-km. Such vehicles typically have 20–30% lower fuel consumption and CO2 emissions per unit of freight transport than their conventional tractor–semitrailer counterparts [4].
Finland has vast experience of the use of LHVs. Vehicles of 25.25 m in length with a maximum gross vehicle weight (GVW) of 60 tonnes have been in use since 1993 and currently, 78% of tonne-kilometres are carried using LHVs [5]. These vehicles have typically been a combination of a three-axle rigid truck and a four-axle full trailer, but other combinations within the European modular system (EMS) have also been used. In October 2013, the maximum GVW was increased to 76 tonnes for nine-axle vehicles and 68 tonnes with eight-axle vehicles. This has caused a significant shift from seven-axle vehicles to eight- and nine-axle vehicles, and led to around 3.5% savings in truck vehicles kms and €100 million savings in transport costs in 2016 [6]. Given the long history of LHVs in Finland, it can provide valuable information on the actual utilization of LHVs in the freight transport sector, if those would also be allowed in the United Kingdom.

1.2. Possible Impacts of LHVs Based on Literature

Long and heavy vehicles have been a subject of strenuous political debate in Europe during the 21st century. Particularly during 2008 to 2010, several policy reports were published addressing the issue on both a national and European level [7,8,9]. “A Review of Megatrucks” [3] highlighted the key findings from eight of these studies and stated that “there is widespread agreement that LHVs would reduce operating costs of road freight and greenhouse gas emissions per tonne-km of goods transported”. Most research also agrees that vehicle mileage, transport costs, and emissions of road freight transport will be reduced on company level and also on national aggregate level if LHVs are introduced, or that these would increase if the LHVs currently in operation in countries such as Finland, Sweden, Canada, and Australia would be replaced with standard heavy goods vehicles [3,10,11,12,13].
Some desk study reports argue that LHVs would result in major modal shift from rail to road, which would outweigh the efficiency gains within road freight transport and lead to an increase in CO2 emissions [8,9]. Opposing evidence to these desk studies exist and Steer et al. [3] conclude that “empirical evidence is difficult to find with regards to many of the primary concerns regarding LHVs… where empirical evidence is available, it tends to show… lower modal shift”. McKinnon [14] presented evidence supporting that of Steer et al. [3] from the United Kingdom when the maximum weight of HGVs was raised to 44 tonnes. It was estimated that increasing maximum weight of HGVs to 44 tonnes would reduce rail freight tonne-kms by 10%. However, the market share of rail freight remained fairly stable at 11% [14].
More recent research from Spain did not consider modal shift because “the market share of domestic freight rail transportation in Spain is so low that any transfer would be negligible” [15]. In a German survey, “77% of the respondents did not foresee a shift of the existing freight traffic from rail to road”, while 55% expected that the road freight transport market would see higher growth than expected if LHVs would be adopted [11]. A study in Belgium concluded that “the impact of LHVs on the geographic market area of intermodal terminals can be substantial if road transport prices would decrease by up to 15 or 25%”, but “it would be necessary to study the goods flows that actually qualify for a reverse modal shift to LHVs, not only based on price, but also on other logistics requirements” [10]. Overall, the evidence on modal shift remains inconclusive. Hence, a sensitivity analysis taking into account possible modal shift is included in this study.
In addition to possible modal shift, worries about LHVs’ effect on infrastructure and safety have been raised. Steer et al. [3] conclude that LHVs may induce additional capital and maintenance costs for infrastructure, but these can only be assessed nationally. Ortega et al. [15] estimated the required investments in Spain from 150 to 1000 million euros, depending on the extent of road network on which LHVs would be allowed. Ericson et al. [16] estimated that road wear costs would decrease by €14–20 million if Sweden would give up LHVs and use the HGVs instead. Generally, the road wear of pavement decreases when moving from HGVs to LHVs [4], but there might be negative effects on the substructure of the road [17] and increased investment needed in road bridges [18].
Regarding the safety effects of LHVs, Glaeser and Ritzinger [4] show that LHVs have worse performance in terms of ratio of amplification of lateral acceleration of the tractor unit compared with trailer and total swept width is larger, which indicate that LHVs are more difficult to manoeuvre and thus may have greater risk per vehicle. However, Steer et al. [3] conclude that there is no evidence of increased safety risk and reduction in vehicle-kms may even outweigh increased risk per vehicle. Leach et al. [13] also see no significant impact in the United Kingdom and Ortega et al. [15] say that sensitivity costs of accidents are negligible in Spain if LHVs are introduced. During the ongoing trials with longer semitrailers (trailer length 15.65 m instead of 13.6 m) in the United Kingdom, the trial vehicles have been involved in 70% fewer personal injury collisions than average articulated HGV [19], but this could be because better than average drivers have likely been selected to the trial and trial vehicles may not have been used similarly to average HGVs.
The effects of LHVs have been studied on company level [11,12]; on sectoral level, typically focusing on intermodal transport sector [10,13,20]; and on national level [14,15], reports reviewed by the authors of [3], while international studies have been limited to technical comparison of various types of LHVs [4] and an overall study across Europe [7]. Ortega et al. [15] highlight that there is a lack of sensitivity analysis, which would identify the influence of the kind and amount of freight that would use LHVs and the percentage of empty running. Meers et al. [10] also conclude that accounting for product characteristics and the corresponding transport quality requirements would enable estimations in greater detail.
In order to fill these research gaps, the purpose of this study is to assess the impacts of long and heavy vehicles on various commodities in the United Kindom based on the Finnish experiences. The two countries are quite different in terms of the importance of various sectors on economy and freight transport needs, hence it is necessary to evaluate the use of LHVs on the greatest level of detail available, that is, on commodity level. Each commodity can be seen to have similar logistics practices and types of goods carried are similar between countries. This enables conclusions on the suitability and uptake rate of LHVs to be drawn in the United Kingdom based on Finnish experiences. Specifically, the research question to be answered in this study is the following: What are the possible savings in road freight transport vehicle kilometres, costs, and CO2 emissions in the United Kingdom, if LHVs were introduced and used similarly to Finland in the transport of various commodities?

2. Materials and Methods

In order to answer the research question, continuous road freight transport surveys in the United Kingdom and Finland were used. Finland was chosen as the country of reference because it is one of the few countries that use LHVs, in particular 60 t and 25.25 m LHVs, and it has similar data available as in the United Kingdom. Another alternative could have been Sweden, but the researchers did not have access to the Swedish dataset. In the United Kingdom, the Continuing Survey of Road Goods Transport, Great Britain (CSRGT GB) is a survey that reports the operations of approximately 7000 trucks. In Finland, the Goods Transport by Road Survey (GTRS) includes approximately 2500 trucks annually. Both surveys are conducted in a similar way following the European guidelines [21].
In order to estimate the maximum benefits of using 60 t and 25.25 m vehicles in the United Kingdom, data on the tonne-kms by commodity and type and weight of vehicle were gathered from UK Department for Transport (DfT) [22]. Vehicle kms by commodity and type and weight of vehicle are not publicly available, so a request for such data from 2016 was made and fulfilled by the DfT. An assumption was made that the 60 t and 25.25 m vehicles would only affect the haulage currently carried out with over 33 t articulated vehicles. Average load on laden trips of over 33 t artics for each commodity in the United Kingdom was then calculated by dividing the tonne-kms by vehicle kms.
For Finland, the data used in this study consisted of the raw data from the GTRS from 2012. Data from 2016 was available, but because Finland allowed GVW 76 t vehicles in October 2013, it was decided that the the 2012 data would be used as reference with the U.K. data to estimate the potential of 60 t and 25.25 m LHVs. If 2016 data would have been used, the average loads by commodity would have been unrealistically high for some commodities, because allowing 76 t vehicles has resulted in significant increase in average loads [6]. The raw data included each trip and vehicle reported in the survey, so data could be analysed flexibly. The Finnish raw data was processed to produce tonne-kms and vehicle kms with the same commodity and vehicles type and weight classifications as the U.K. data. Hence, the average load on laden trips of over 33 t artics for each commodity in Finland in 2012 was calculated by dividing the tonne-kms by vehicle kms. Maximum potential of LHVs in the United Kingdom was then calculated by dividing the U.K. tonne-kms by the Finnish average load by commodity. This resulted in alternative vehicle kms and the potential vehicle kms saved by LHVs were then calculated by subtracting the new vehicle kms from original U.K. vehicle kms.
LHVs effect on empty running could not be similarly calculated, because there obviously is not a change in average load on empty runs. Hence, the share of empty running of total mileage with over 33 t artics in the United Kingdom (24%) was assumed to remain the same if LHVs would be implemented and new empty mileage was calculated based on the relative change in the laden mileage of all commodities.
The effects on transport costs were then calculated using the average per kilometre vehicle operating costs by Road Haulage Association (RHA) [23] as a baseline for current 44 t and 16.5 m HGVs and increasing those using the cost differences estimated by Vierth et al [24] for various types of commodities. Vierth et al. [24] present the total transport costs in SEK/10km and the shares of three cost components (fuel, personnel, and other) for five types of transport (part load, forest, long-haul distribution, tanker and bulk, and construction). The differences in total cost and cost components are due to differences in the distance travelled relative to working time (km/h), annual mileage per vehicle, and annual working hours per vehicle. The transport costs used in this study (Table 1) are calculated using the RHA [23] figures for 44 t tractor–semitrailer as a baseline for the long-haul type of transport.
The effect on fuel consumption and CO2 emissions are calculated based on the fuel consumption for empty and full load HGVs and LHVs presented in Table 1 based on the unit emissions database by VTT Technological Research Centre of Finland [25]. VTT’s data actually contains HGV fuel consumption for 40 t GVW, but the full load consumption for 44 t semitrailer was extrapolated assuming linear increase in consumption between 40t and 44t. The VTT’s database was chosen because it has long tradition in providing fuel consumption data for both HGVs and LHVs based on both their own measurements and long term collaboration with other laboratories under the European Research on Mobile Emission Sources (ERMES) group and the emissions reported in the Handbook Emission Factors for Road Transport (HBEFA). There are other sources for fuel consumption data available, but most do not include fuel consumption data for LHVs. Average fuel consumption for each commodity is calculated using the average load for each commodity and assuming a linear relationship between the empty and full load consumption. As can be seen in Table 1, the LHVs have higher fuel consumption empty because of higher vehicle own weight (20 t vs. 15 t) and higher fuel consumption fully laden, because of higher gross vehicle weight (60 t vs. 44 t) [25].

3. Results

3.1. Freight Transport Profile in the United Kingdom and Finland

United Kingdom and Finland are very different countries in terms of population, the United Kingdom having 65.6 million people and Finland 5.5 million. The area is 242,000 km2 for the United Kingdom and 338,000 km2 for Finland, resulting in highly different population density; 271 versus 16 inhabitants/km2. Also, in terms of economic structure, the countries differ, as agriculture, forestry, fishing, and industry represent 24% of Finnish gross value added (GVA), but only 14% in the United Kingdom, whereas in the United Kingdom the wholesale and retail, financial and scientific sectors constitute a larger share of total GVA than in Finland (Table 2).
The differences in economical, geographical, and demographical structures also affect the freight transport sector. The freight transport intensity, that is, the ratio of freight haulage in tkm to GVA in €, in Finland is more than twice that of United Kingdom, with 0.18 tkm/€ and 0.08 tkm/€, respectively.
The high transport intensity in Finland is largely because of the large forest industry sector in Finland. This can be seen from the breakdown of road freight transport by commodity (Figure 2). Forestry and logging is the largest commodity in Finland and constitutes about one-fifth of road tonne-kms in Finland. While the division to 20 NST2007 commodities gives valuable information, it is also necessary to further disaggregate the agricultural products into products of forestry and logging and the other food related agricultural products. Otherwise, the average load of this commodity would be very high in Finland and would overestimate in the United Kingdom the potential of LHVs in this commodity. In the United Kingdom, food products account for a quarter of tonne-kms. Mining and quarrying, which is mainly construction related soil, gravel, and sand transport are a large commodity in both countries, as are grouped goods, which are usually various types of palletized goods.
In terms of the types of vehicles used in road haulage, both countries have vast majority of tonne-kms produced with the heaviest vehicles, that is, 72% of tonne-kms with articulated vehicles over 33 t in the United Kingdom and 82% of tonne-kms with artics over 44 t in Finland. The share of heaviest vehicles is especially large for commodities such as coal, wood products, and chemical products. Rigid vehicles have a significant share in some commodities, such as mining and quarrying, textiles, transport equipment, furniture and household, and office removals.
It can be seen from Figure 2, that vehicles with GVW of over 44 t (mostly 60 t) carry the vast majority of tonne-kms in Finland. These vehicles may carry up to 46% more payload (42.8 t vs. 29.3 t, [4]) than the British 44 t semitrailers. However, payload is usually restricted by other limitations than weight, that is, volume or cargo area. Hence, the maximum payload is actually rarely used for most commodities [28] and an increase in maximum payload cannot be used as such to estimate the potential for vehicle km savings from using LHVs. A change from 44 t and 16.5 m semitrailers to 60 t and 25.25 m vehicles would also increase the payload area and volume by about 46% (140 m3 vs. 96 m3 and 52 pallets vs. 36 pallets). Hence, the 46% increase in transport efficiency represents a theoretical maximum for the potential benefits of fully laden LHVs compared with fully laden HGVs. However, greater benefits may be possible if the use of LHVs also changes the logistics practices so that the utilization rate of vehicles increase. Such changes cannot be estimated and this must be acknowledged as a limitation of this study. This limitation could be addressed with more disaggregated commodity group data, but such data are not available for these countries and annual variation would also increase on a more disaggregate level.
There are six commodities in Table 3, in which the average load on laden trips are currently more than 46% greater in Finland than in the United Kingdom, namely forestry and logging, coal, wood products, chemical products, mail and household, and office removals. Although it is possible that the average load in the United Kingdom could increase to the current Finnish levels after the introduction of LHVs, this is considered unlikely, because it is more likely that the difference is due to differences in product mix, which would not change if LHVs would be introduced in the United Kingdom. Hence, the maximum increase in average payload on laden trips due to usage of LHVs has been limited to 46%. There are also two commodities, textiles and furniture, in which the current average load in Finland is lower than the current average load in the United Kingdom. These commodities have great annual variation in the Finnish data, so it is difficult to estimate the likely effect of LHVs in the United Kingdom. Hence, the average load is assumed to remain the same in the United Kingdom after the introduction of the LHVs. The resulting average payloads for calculating the benefits of LHVs are presented in the last column of Table 3.

3.2. Maximum Potential of LHVs on the U.K. Road Freight Transport

Calculated based on the estimated average load by commodity on laden trips if LHVs would be used in the United Kingdom, Table 4 presents the maximum decrease of vehicle kms of over 33 t artics in the United Kingdom. The savings in vehicle kms range from 0% to 32% of the current vehicle kms. The overall total saving in vehicle kms is 2.1 billion kms, which is 21% of current mileage with over 33 t artics and 11% of current total lorry mileage. Food products and empty running produce majority of the savings with 466 million kms and 510 million kms saved in these commodity groups, respectively. Wood products, chemical products, waste, mail, and grouped goods also provide estimated savings of more than 100 million kms each.
The commodity with the highest relative savings from current total vehicle kms are forestry and logging, coal, wood products, chemical products, and other goods. All of these are high density commodities, which currently have high percentage of vehicle kms driven with over 33 t lorries, and thus benefit from the extra weight capacity. However, also some commodities constrained by cargo area and volume, such as mail, grouped goods, and food products show savings of over 10% of current total lorry vehicle kilometres.
Table 5 presents the changes in fuel consumption. Total fuel savings are 178 million litres, which is 5% of the current fuel consumption of over 33 t artics in the United Kingdom. In terms of CO2 emissions, the decrease is 0.5 Mt, which is 2.4% of total truck CO2 emissions in the United Kingdom. Fuel consumption in terms of l/100 km increases because of increased payload and because LHVs have higher own weight and higher aerodynamic drag than HGVs. However, the decrease in vehicle fuel consumption due to decrease in vehicle kms is higher than the increase in fuel consumption per kilometre for all but two (agricultural products without forestry, empty containers and packaging) commodities. The negative fuel savings in these two commodities indicate that the average load using LHVs, which was based on the Finnish average load, does not increase the payload enough to decrease the mileage to outweigh the increase in fuel consumption per km. This is most likely due to national differences in the types of goods carried within the commodity group, but also because of annual variation in average load. In the following analysis, on transport costs, the same commodities show negative cost savings with two more commodities. Hence, it is necessary to analyse the issue further by taking into account the increase in cargo space capacity in addition to weight capacity.
Table 6 presents the transport cost savings if the average load for each commodity would increase with the implementation of LHVs. Total savings amount to £983 million annually, with food products and waste with saving of more than £150 million each. There are also four commodities, namely, agricultural products without forestry, metal products, empty containers and packaging, and unidentifiable goods, for which the cost saving is negative. For these commodities, the average load on laden trips is only slightly higher in Finland than in the United Kingdom, indicating that these commodities are constrained by cargo area or volume rather than by weight. For these commodities, the transport costs would increase because the decrease in vehicle kms is smaller than the increase in transport costs per kilometre if the cargo space would not be efficiently used. As it was discussed earlier with textiles and furniture, the increase in payload might be greater in the United Kingdom because of the additional area and volume capacity of LHVs than the comparison with Finnish average loads shows. Hence, it is justifiable to analyse the potential savings of these commodities if the average load in these commodities would increase by 46%, that is, by the theoretical maximum increase. This analysis gives an upper estimate to the potential savings.
It was seen in Table 6 that there are six commodities for which the Finnish average load was lower or only slightly higher than the current average load in the United Kingdom, which resulted in negative transport cost savings for these commodities. Hence, an additional analysis (Table 7) is made in which the average load for these commodities is increased by 46% to reflect the change in cargo area and volume, which are likely constraints for these commodities instead of weight.
The additional analysis gives an upper estimate for the potential savings (Table 8). It could be argued that the upper estimate should be calculated by simply increasing the average load by 46% for all commodities. However, such an estimate is likely to unrealistic, because it is unlikely that all commodities would implement LHVs to the full as there are restrictions due to physical infrastructure and logistics practices. Hence, it can be concluded that implementing LHVs in the United Kingdom could reduce lorry vehicle kilometres by 2.1–2.6 billion km, which is 11–13% of current lorry mileage. This reduction would save 178–272 million litres of diesel and reduce CO2 emissions by 0.5–0.7 Mt. The transport costs of over 33 t articulated lorries could decrease by £1.0–1.5 billion, which is 9–14% of current transport costs. It might also be argued that the effects of LHVs may be even greater and estimated assuming that the average load would increase by 46% for all commodities. However, this would give too high estimate on the effects of LHVs because it is unlikely that LHVs could be used on all journeys currently made with over 33 t articulated vehicle. Infrastructure may not enable use of LHVs everywhere and LHVs may also cause a modal shift from rail to road, which has an effect on the lower estimate of LHV benefits.

3.3. Effects of Infrastructure and Modal Shift on the Lower Estimate of LHV Benefits

The estimated benefits presented in the previous section show the effects, which are internal in the road freight sector, but do not take into account possible modal shift or effects on road infrastructure. In order to estimate the net economic benefits on a national scale, two additional major factors must be taken into account, namely road infrastructure improvement costs and modal shift from rail to road. TRL [9] estimated significantly lower effects of LHVs in the United Kingdom than the estimates presented in the previous section. TRL estimated 0.4–1.3% reduction in vehicle kms, 1.4–3.6% reduction in transport costs and 0.5–1.4% increase in CO2 emissions. The differences are due to significantly lower estimate on the potential use of LHVs and shift from rail to road. TRL [9] estimates that the take up rate of LHVs would be 5% as a low estimate and 10% as a high estimate, that is, 5–10% of articulated vehicle’s tkm would be carried by LHVs. The low estimate was primarily due to restricting the use of LHVs on only certain types of commodities, which is not justified based on the Finnish example where all types of commodities are mainly transported using LHVs (Figure 2). Of course the situation in Finland is due to long term development, but in the long term, LHVs are likely to take over transport from HGVs in the United Kingdom too, simply because of the indisputably lower transport costs per unit transported.
TRL [9] also estimates the effects of possible route restrictions on LHV and shows that if LHVs would be allowed only on motorways and dual carriageways, the reduction in vehicle km would be 20% lower than in if LHVs would be allowed on all roads. Road infrastructure, especially some roundabouts in urban areas and bridges in rural areas, as well as docking areas in distribution centres, may not be able to accommodate LHVs because of the larger turning circle and GVW of LHVs. Hence, it is justified to take the estimate by TRL [9] to calculate a new lower estimate on the effect of LHVs in the United Kingdom. Applying the suggested 20% decrease in the lower estimate of the vehicle km savings result in a new estimate of 1.7 billion vkm (8.8% of total lorry vkm). In terms of fuel, CO2, and cost savings, the savings are also reduced to 142 million l, 0.38 Mt, and £786 million, respectively.
Regarding the modal shift, ORR [29] reported that rail freight had 10% share (about 17 billion tkm) of domestic freight transport in the United Kingdom and 1.7 billion lorry kilometres would be required to transport the amount of freight moved by rail in 2015–2016. Finland (27%) and Sweden (29%) currently have considerable higher shares of rail freight of total tkms than United Kingdom [26]. However, it should be noted that majority of the freight transport on rail are due to extensive forest industry in these countries. In Finland, forestry and products of paper industry represent about 48% of total rail tkms [30], whereas in the United Kingdom, 40% of rail tkms are intermodal freight [29]. According to TRL [9], 13% shift from total rail haulage to road is a mid-range estimate, which would be about 2.2 billion tkm. Supposing this would shift from rail to road, using LHVs with an average load of 20 t and the share of empty running of 33% of total mileage (which is a high estimate for empty running, as the average for over 33 t artics in the United Kingdom is 24%), the resulting increase in road freight would be approximately 0.15 billion vehicle kms. The resulting lower estimate of the net change in lorry vkm would be a decrease of 1.5 billion km (8% of total lorry vkm) and resulting fuel, CO2, and cost savings can be seen in Table 9.
As can be seen from Table 8 and Table 9, the upper estimate was not changed as a result of infrastructure and modal shift. Regarding the modal shift, the upper limit does not take any change into account, reflecting the finding by Steer et al. [3] that empirical evidence on modal split shows lower effects than desk studies anticipate. Regarding infrastructure, implementing LHVs could also change the structure and operational practices of freight transport networks so that average payload increases more than estimated here when they are mostly used on trunk routes on motorways and dual carriageways between distribution centres, unlike HGVs currently are. However, it should be noted that there are currently about 250 ‘substandard’ bridges on motorways and major A-roads and more than 3000 such bridges on council-maintained roads [31]. Some of these bridges may not be fit to carry even the current heaviest HGVs. Hence, it is likely that significant investments in the magnitude of hundreds of millions of pounds would be required to improve the bridges to allow 60 t GVW on major roads.

4. Discussion

The results of this study estimated that the savings of longer and heavier vehicles would be 1.5–2.6 billion vehicle kms (8–13% of total lorry mileage), £0.7–1.5 billion in transport costs, and 0.35–0.72 Mt in CO2 emissions (1.8–3.7% of total lorry emissions). These findings are well in line with some estimates of other studies. McKinnon [14] reported that the previous increase in maximum weight in the United Kingdom, from 40 t to 44 t in 2001, saved 0.13 billion vehicle kms, £0.11 billion in transport costs, and 0.13 Mt in CO2 emissions in 2003. As this was a 10% increase in payload weight and LHVs would increase the payload weight by 46%, as well as an increase in the cargo area and volume, the results are roughly comparable. Leach et al. [13] estimated that allowing longer (25.25 m) vehicles without increasing the maximum weight could have an effect on 15% of current articulated vehicle mileage and lead to transport cost savings of about £0.2 billion, with CO2 emission reductions of 0.1–0.2 Mt, depending on the effects on rail freight transport. As Leach et al. [13] estimated that longer vehicles could affect 15% of articulated vehicle kms, and this analysis took into account 94% of articulated vehicle kms, the results are highly comparable.
Arki [32] reported that allowing LHVs in the whole of Europe would decrease the vehicle kms by 13%, transport costs by 6.8%, and CO2 emissions by 3.6%. These figures are very similar with the results of this study, although the reduction of CO2 emissions is lower than in this analysis. This could be partly due to the fact that LHVs are already in operation in some European countries. Vierth et al. [24] studied the opposite situation, that is, abandoning LHVs and using HGVs instead in Sweden, and found that the amount of vehicle kms would increase by 24%, transport costs by 7%, and CO2 emissions by 6% if only HGVs were used, and there would be no shift from road to rail. Again, these results are well in line with the estimates of this study.

5. Conclusions

The potential effects of implementing longer and heavier vehicles (LHVs) in road freight transport have been studied in various countries nationally and internationally in Europe. These studies have focused on the implementation of LHVs on certain types of commodities and the experiences from countries like Finland and Sweden, which have a long tradition in using LHVs and in which LHVs used for all types of commodities have not been widely utilised. This study aimed to assess the impacts of long and heavy vehicles on various commodities in the United Kingdom based on the Finnish experiences in order to estimate the possible savings in road freight transport vehicle kilometres, costs, and CO2 emissions in the United Kingdom if LHVs would be introduced and used similarly to Finland in the transport of various commodities.
The international commodity level approach induced some challenges to the analysis. Firstly, some commodities have very limited amount of data and there is large annual variation, which might lead to slightly different results if other years would have been chose. Hence, it is recommended that data from several years should be used in future commodity level studies. Secondly, international comparison even at the commodity level might not be sufficiently detailed to make assumptions on the utilisation of LHVs, and thus the changes in average loads moving from HGVs to LHVs. Even within the same commodity type, very different goods may be transported, as illustrated by the case of agricultural products and forestry in this study. Hence, international comparisons should aim to utilise the most disaggregated data available. However, there are variations between countries in the level of disaggregation, so the 20 commodity types used in NST2007 might remain the deepest reliable level of disaggregation, as European countries deliver this data annually [21].
The study shows that the savings of introducing longer and heavier vehicles in the United Kingdom would be 1.5–2.6 billion vehicle kms, £0.7–1.5 billion in transport costs, and 0.35–0.72 Mt in CO2 emissions. These findings are well in line with previous findings in other countries. The results confirm that considerable savings in traffic volume and emissions can be achieved and the savings are very likely to outweigh possible effects of modal shift from rail to road. Previous research also somewhat agrees that LHVs are unlikely to cause negative effects on modal shift or transport safety. Hence, LHVs are likely to provide a viable solution in the United Kingdom to decrease greenhouse gas emissions from transport in order to mitigate climate change, although the effect on greenhouse gases is very limited.
However, in order to gain the maximum benefits of LHVs, investment requirements in infrastructure are likely to emerge. Hence, further research on the state of road infrastructure, especially regarding weight-restricted bridges and manoeuvrability issues, would be required in order to estimate the investment costs and compare them against the savings projected in this study. Alternatively, LHVs can be allowed only on certain types of roads to avoid infrastructure investments. Further research that takes into account routing and likely use of various road types by LHVs should be carried out to find the right balance between the LHV road network and investment costs. Such research can build on the recent study by Palmer et al. [33], which focused on the fast moving consumer goods (FMCG) sector.

Author Contributions

Conceptualization, H.L. and P.G.; Methodology, H.L.; Formal Analysis, H.L.; Data Curation, H.L. and P.D.; Writing—Original Draft Preparation, H.L.; Writing—Review & Editing, A.K.; Visualization, H.L.; Supervision, P.G.; Project Administration, H.L.; Funding Acquisition, H.L.

Funding

This work was supported by the Kone Foundation (grant number b4b919).

Conflicts of Interest

The authors declare no conflict of interest. The funders had no role in the design of the study; in the collection, analyses, or interpretation of data; in the writing of the manuscript; and in the decision to publish the results.

References

  1. Liimatainen, H.; Kallionpää, E.; Pöllänen, M.; Stenholm, P.; Tapio, P.; McKinnon, A. Decarbonizing road freight in the future—Detailed scenarios of the carbon emissions of Finnish road freight transport in 2030 using a Delphi method approach. Technol. Forecast. Soc. Chang. 2014, 81, 177–191. [Google Scholar] [CrossRef]
  2. Sims, R.; Schaeffer, R.; Creutzig, F.; Cruz-Núñez, X.; D’Agosto, M.; Dimitriu, D.; Figueroa Meza, M.J.; Fulton, L.; Kobayashi, S.; Lah, O.; et al. Transport. In Climate Change 2014: Mitigation of Climate Change. Contribution of Working Group III to the Fifth Assessment Report of the Intergovernmental Panel on Climate Change; Edenhofer, O., Pichs-Madruga, R., Sokona, Y., Farahani, E., Kadner, S., Seyboth, K., Adler, A., Baum, I., Brunner, S., Eickemeier, P., et al., Eds.; Cambridge University Press: Cambridge, UK; New York, NY, USA, 2014. [Google Scholar]
  3. Steer, J.; Dionori, F.; Casullo, L.; Vollath, C.; Frisoni, R.; Carippo, F.; Ranghetti, D. A Review of Megatrucks—Major Issues and Case Studies. Available online: http://www.europarl.europa.eu/thinktank/en/document.html?reference=IPOL-TRAN_ET(2013)513971 (accessed on 31 July 2018).
  4. Glaeser, K.P.; Ritzinger, A. Coparison of the performance of heavy vehicles. Results of the OECD study: ‘Moving freight with better trucks’. Procedia—Soc. Behav. Sci. 2012, 48, 106–120. [Google Scholar] [CrossRef]
  5. Statistics Finland. Goods Transport by Road. Official Statistics of Finland: Helsinki, Finland, 28 April 2017. Available online: http://stat.fi/til/kttav/2016/kttav_2016_2017-04-28_en.pdf (accessed on 31 July 2018).
  6. Liimatainen, H.; Nykänen, L.; Pöllänen, M. Impacts of increasing maximum truck weight—Case Finland. C. Stud. Transp. Policy 2018. under review. [Google Scholar]
  7. Christidis, P.; Leduc, G. Longer and Heavier Vehicles for Freight Transport. European Commission Joint Research Centre Institute for Prospective Technological Studies. Available online: https://ec.europa.eu/jrc/en/publication/eur-scientific-and-technical-research-reports/longer-and-heavier-vehicles-freight-transport (accessed on 31 July 2018).
  8. Fraunhofer ISI, TRT, NESTEAR. Long-Term Climate Impacts of the Introduction of Mega-Trucks. Study for the Community of European Railway and Infrastructure Companies (CER): Karlsruhe, Germany, 2009. Available online: http://www.cer.be/sites/default/files/publication/090512_cer_study_megatrucks.pdf (accessed on 31 July 2018).
  9. TRL. Longer and/or Longer and Heavier Goods Vehicles (LHVs)—A Study of the Likely Effects if Permitted in the UK: Final Report. DfT: London, UK, 2008. Available online: https://www.google.com/url?sa=t&rct=j&q=&esrc=s&source=web&cd=1&ved=2ahUKEwiM7I-4tcvcAhWCZt4KHesBywQFjAAegQIBBAC&url=https%3A%2F%2Ftrl.co.uk%2Fsites%2Fdefault%2Ffiles%2FPPR285%25283%2529.pdf&usg=AOvVaw0nuLBY6YYLZkXnbqfuKUd- (accessed on 31 July 2018).
  10. Meers, D.; van Lier, T.; Macharis, C. Longer and heavier vehicles in Belgium: A threat for the intermodal sector? Transp. Res. Part D 2016, 61, 459–470. [Google Scholar] [CrossRef]
  11. Sanchez Rodrigues, V.; Piecyk, M.; Mason, R.; Boenders, T. The longer and heavier vehicle debate: A review of empirical evidence from Germany. Transp. Res. Part D 2015, 40, 114–131. [Google Scholar] [CrossRef] [Green Version]
  12. Liljestrand, K. Improvement actions for reducing transport’s impact on climate: A shipper’s perspective. Transp. Res. Part D 2016, 48, 393–407. [Google Scholar] [CrossRef]
  13. Leach, D.; Savage, C.; Maden, W. High-capacity vehicles: An investigation of their potential environmental, economic and practical impact if introduced to UK roads. Int. J. Logist. Res. Appl. 2013, 16, 461–481. [Google Scholar] [CrossRef]
  14. McKinnon, A. The economic and environmental benefits of increasing maximum truck weight: The British experience. Transp. Res. Part D 2005, 10, 77–95. [Google Scholar] [CrossRef]
  15. Ortega, A.; Vassallo, J.; Guzman, A.; Perez-Martinez, P. Are longer and heavier vehicles (LHVs) beneficial for society? A cost benefit analysis to evaluate their potential implementation in Spain. Transp. Rev. 2014, 34, 150–168. [Google Scholar] [CrossRef]
  16. Ericson, J.; Lindberg, G.; Mellin, A.; Vierth, I. Co-modality—The Socio-economic Effects of Longer and/or Heavier Vehicles for Land-based Freight Transport. In Proceedings of the 12th WCTR, Lisbon, Potugal, 11–15 July 2010. [Google Scholar]
  17. Varin, P.; Saarenketo, T. Effect of Axle and Tyre Configurations on Pavement Durability—A Prestudy. ROADEX Network Report. Available online: http://www.roadex.org/wp-content/uploads/2014/01/ROADEX_Axle_Tyre_Prestudy_15102014-Final.pdf (accessed on 31 July 2018).
  18. Vierth, I.; Haraldsson, M. Socio-economic Effects of Longer and/or Heavier Road Transport Vehicles—The Swedish case. In Proceedings of the Setting Future Standards: International Symposium on Heavy Vehicle Transport Technology—HVTT12, Stockholm, Sweden, 16–19 September 2012. [Google Scholar]
  19. Risk Solutions. The GB Longer Semi-Trailer Trial. 2016 Annual Report Summary. 2017. Available online: https://www.gov.uk/government/uploads/system/uploads/attachment_data/file/646226/longer-semi-trailer-trial-annual-report-2016-summary.pdf (accessed on 31 July 2018).
  20. Bergqvist, R.; Behrends, S. Assessing the effects of longer vehicles: The case of pre- and post-haulage in intermodal transport chains. Transp. Rev. 2011, 31, 591–602. [Google Scholar] [CrossRef]
  21. Regulation (EU) no 70/2012 on Statistical Returns in Respect of the Carriage of Goods by Road. Available online: http://eur-lex.europa.eu/legal-content/EN/TXT/PDF/?uri=CELEX:32012R0070&from=EN (accessed on 31 July 2018).
  22. DfT. Road Freight: Domestic and International Statistics. 2017. Available online: https://www.gov.uk/government/collections/road-freight-domestic-and-international-statistics (accessed on 31 July 2018).
  23. RHA. Cost Table; Road Haulage Association: Peterborough, UK, 2013. [Google Scholar]
  24. Vierth, I.; Berell, H.; McDaniel, J.; Haraldsson, M.; Hammarström, U.; Yahya, M.-R.; Lindberg, G.; Carlsson, A.; Ögren, M.; Björketun, U. The Effects of Long and Heavy Trucks on the Transport System. VTI rapport 605A. Available online: https://www.diva-portal.org/smash/get/diva2:675341/FULLTEXT02.pdf (accessed on 31 July 2018).
  25. VTT. LIPASTO—Transport Emissions Database. VTT Technological Research Centre of Finland, 2017. Available online: http://lipasto.vtt.fi/en/index.htm (accessed on 31 July 2018).
  26. Eurostat. Eurostat Database. 2017. Available online: http://ec.europa.eu/eurostat/data/database (accessed on 31 July 2018).
  27. National Statistics. Final UK Greenhouse Gas Emissions National Statistics: 1990–2015. 2017. Available online: https://www.gov.uk/government/statistics/final-uk-greenhouse-gas-emissions-national-statistics-1990-2015 (accessed on 31 July 2018).
  28. Nykänen, L.; Liimatainen, H. Possible impacts of increasing maximum truck weight: Finland case study. In Towards Innovative Freight and Logistics: Research for Innovative Transports Set; Blanquart, C., Clausen, U., Jacob, B., Eds.; Wiley-ISTE: London, UK, 2016; Volume 2, pp. 121–133. [Google Scholar]
  29. ORR. Freight Rail Usage. 2016-17 Q4 Statisticla Release. Office of Rail and Road, 2017. Available online: http://orr.gov.uk/__data/assets/pdf_file/0007/24892/freight-rail-usage-2016-17-quarter-4.pdf (accessed on 31 July 2018).
  30. FTA. The Finnish Railway Statistics 2016. Statistics from the Finnish Transport Agency, 2017. Available online: https://julkaisut.liikennevirasto.fi/pdf8/lti_2017-09_rautatietilasto_2016_web.pdf (accessed on 31 July 2018).
  31. RAC Foundation. Substandard Road Bridges. 2017. Available online: https://www.racfoundation.org/research/economy/substandard-road-bridges-foi-2017 (accessed on 31 July 2018).
  32. Arki, H. European Study on Heavy Goods Vehicles’ Weights and Dimensions. In Proceedings of the European Transport Conference 2009, Noordwijkerhout, The Netherlands, 5–7 October 2009. [Google Scholar]
  33. Palmer, A.; Mortimer, P.; Greening, P.; Piecyk, M.; Dadhich, P. A cost and CO2 comparison using trains and higher capacity trucks when UK FMCG companies collaborate. Transp. Res. Part D 2018, 58, 94–107. [Google Scholar] [CrossRef]
Figure 1. Some major vehicle combinations (background table from the literature [4], highlights and heavy goods vehicles (HGV) and longer and heavier vehicles (LHV) texts added).
Sustainability 10 02754 g001
Figure 2. Tonne-kms (in million tkm) by commodity and type and weight of vehicle in Great Britain and Finland.
Sustainability 10 02754 g002
Table 1. Transport costs and fuel consumption. RHA—Road Haulage Association; HGVs—heavy goods vehicles; LHVs—long and heavy vehicles.
Type of TransportPart LoadLong-HaulTanker and BulkConstructionForestry
RHA [23]Driver costs (£/year)32,400
Fixed costs (£/year)48,020
Vierth et al. [24]Distance travelled relative to working time (km/h)51.144.633.33045.6
Annual working time (h/year)27004032360023523850
HGVs (16.5 m, 44 t)Driver cost (£/km)0.230.180.270.460.18
Fixed costs (£/km)0.350.270.400.680.27
Other vehicle costs (£/km)0.120.120.120.120.12
Fuel cost (£/km)0.400.400.460.490.53
Total (£/km)1.100.971.251.751.11
Fuel consumption (l/100 km)26.6–43.0 (empty-full load, [25])
LHVs (25.25 m, 60 t)Driver cost (£/km)0.230.180.270.460.18
Fixed costs (£/km)0.440.350.460.710.36
Other vehicle costs (£/km)0.120.120.120.120.12
Fuel cost (£/km)0.510.490.510.560.58
Total (£/km)1.301.141.371.851.25
Fuel consumption (l/100 km)33.7–51.1 (empty-full load, [25])
Table 2. Sectoral gross value added and domestic freight transport in the United Kingdom and Finland in 2015 [25,26,27].
Gross Value Added in 2015FinlandUnited Kingdom
Million €%Million €%
Total180,785100%2,299,669100%
Agriculture, forestry, and fishing45913%14,9811%
Industry (except construction)37,34121%304,78813%
Construction11,5526%141,5196%
Wholesale and retail trade, transport, accommodation and food service activities28,77016%425,46719%
Information and communication10,3036%149,2346%
Financial and insurance activities52043%166,6987%
Real estate activities22,81413%297,95113%
Professional, scientific, and technical activities; administrative and support service activities15,1248%282,93412%
Public administration, defence, education, human health and social work activities39,44922%425,32818%
Arts, entertainment and recreation; other service activities; activities of household and extra-territorial organizations and bodies56373%90,7694%
Domestic freight transport in 2015FinlandUnited Kingdom
RoadRailRoadRail
Freight transport by mode (million tonne-km)24,4888468158,92421,990
Total freight transport (million tonne-km)32,956180,914
Transport intensity (tkm/€)0.180.08
CO2 emissions (Mt)2.90.0619.60.57
CO2 intensity (t/tkm)0.1180.0070.1210.026
Table 3. Current average loads by commodity on laden trips of over 33 t artics in the United Kingdom and Finland with estimated average loads in the United Kingdom if LHVs would be used.
Commodity and NST2007 NumberU.K. Artics Over 33 t Haulage (Million tkm)U.K. Artics Over 33 t Mileage (Million km)U.K. Artics Over 33 t Avg. Load (t)FIN Artics Over 33 t Avg. Load (t)Average Load Increase If Finnish Avg. Load Would Be AchievedEstimated U.K. Artics Avg. load Using LHVs (t)
01 Agricultural products without forestry822241120.020.53%20.5
Forestry and logging198514513.737.9177%20.0
02 Coal4711924.839.760%36.2
03 Mining and quarrying691726825.835.337%35.3
04 Food products35,970217816.521.027%21.0
05 Textiles9208510.88.4−23%10.8
06 Wood products616236716.827.966%24.5
07 Coke and petroleum products435417624.729.419%29.4
08 Chemical products554536015.426.371%22.5
09 Glass, other non-metallic mineral products609228621.326.926%26.9
10 Metal products425623218.321.417%21.4
11 Machinery and equipment254120912.216.737%16.7
12 Transport equipment199114313.919.540%19.5
13 Furniture148414210.57.9−24%10.5
14 Waste812842918.926.138%26.1
15 Mail462237312.418.650%18.1
16 Empty containers, packaging32124057.99.014%9.0
17 Household and office removals11699612.218.350%17.8
18 Grouped goods13,42089914.919.128%19.1
19 Unidentifiable goods485827018.020.715%20.7
20 Other goods1981216.5 24.1
Empty 2399
All commodities122,515990416.325.4
Table 4. Decrease in vehicle kms in the United Kingdom if LHVs would be used.
Commodity and NST2007 NumberTotal Current U.K. Mileage, All Vehicles (Million km)U.K. Artics Over 33 t Mileage (Million km)U.K. Artics Over 33 t Mileage With LHVs (Million km)Decrease in U.K. Artics Over 33 t Mileage (Million km)Decrease as % of Artics Over 33 t U.K. vkmDecrease as % of Total U.K. vkm
01 Agricultural products without forestry706411401102%1%
Forestry and logging145145994632%32%
02 Coal241913632%25%
03 Mining and quarrying8062681967227%9%
04 Food products33982178171246621%14%
05 Textiles4278585000
06 Wood products60536725111632%19%
07 Coke and petroleum products3511761482816%8%
08 Chemical products64736024711332%18%
09 Glass, other non-metallic mineral products6392862266021%9%
10 Metal products5262321993314%6%
11 Machinery and equipment5932091535627%10%
12 Transport equipment5621431024129%7%
13 Furniture503142142000
14 Waste128642931211727%9%
15 Mail78637325511832%15%
16 Empty containers, packaging6584053564912%7%
17 Household and office removals42996663032%7%
18 Grouped goods176489970419522%11%
19 Unidentifiable goods3862702343613%9%
20 Other goods18128432%21%
Empty39742399188951021%13%
All commodities19,23399047797210721%11%
Table 5. Fuel and CO2 savings.
Commodity and NST2007 NumberHGV Fuel Consumption (l/100 km)Current Fuel Consumption (million l)LHV Fuel Consumption (l/100 km)Fuel Consumption with LHVs (Million l)Fuel Saving (Million l)Fuel Saving as % of CurrentCO2 Saving (Mt)
01 Agricultural products without forestry37.915642.6171−15−10 %−0.04
Forestry and logging34.35042.442815 %0.02
02 Coal40.6849.46117 %0.00
03 Mining and quarrying41.211049.1961413 %0.04
04 Food products35.978242.8733496 %0.13
05 Textiles32.72838.429000
06 Wood products36.113244.41122116 %0.06
07 Coke and petroleum products40.67146.56923 %0.01
08 Chemical products35.312743.51072016 %0.05
09 Glass, other non-metallic mineral products38.611045.410387 %0.02
10 Metal products36.98643.08500 %0.00
11 Machinery and equipment33.57040.962711 %0.02
12 Transport equipment34.54942.243613 %0.02
13 Furniture32.54638.248000
14 Waste37.316045.01402012 %0.05
15 Mail33.612541.61061915 %0.05
16 Empty containers, packaging31.112637.6134−8−7 %−0.02
17 Household and office removals33.53241.427515 %0.01
18 Grouped goods35.031542.0295196 %0.05
19 Unidentifiable goods36.79942.7100−1−1 %−0.00
20 Other goods35.9444.24116 %0.00
Empty26.663833.763720 %0.00
All commodities 3325 31511785 %0.47
Table 6. Transport cost savings.
Commodity and NST2007 NumberHGV Transport Costs (£/km)Current Transport Costs (M£)LHV Transport Costs (£/km)Transport Costs with LHVs (M£)Cost Saving (M£)Cost Savings as % of Current
01 Agricultural products without forestry0.973971.14457−60−15%
Forestry and logging1.111611.251243723%
02 Coal1.25241.3718625%
03 Mining and quarrying1.754681.8536310522%
04 Food products0.9721041.1419501547%
05 Textiles1.10941.309400
06 Wood products0.973551.142866819%
07 Coke and petroleum products1.252201.37203178%
08 Chemical products1.254501.3733711325%
09 Glass, other non-metallic mineral products0.972761.14258197%
10 Metal products0.972241.14226-2−1%
11 Machinery and equipment1.102301.301993214%
12 Transport equipment1.101571.301332416%
13 Furniture1.101561.3015600
14 Waste1.757491.8557817223%
15 Mail0.973601.142916919%
16 Empty containers, packaging1.104461.30464−18−4%
17 Household and office removals1.101061.30862019%
18 Grouped goods0.978691.14802678%
19 Unidentifiable goods0.972611.14267−6−2%
20 Other goods0.97121.141200
Empty0.9723181.1421521667%
All commodities 10,437 94559839%
Table 7. Savings in vehicle kms, transport costs and fuel using LHVs based on increased cargo space.
Commodity and NST2007 NumberDecrease in vkm Using LHVs Based on Weight (Million km)Decrease in vkm Using LHVs Based on Cargo Space (Million km)Cost Savings Using LHVs Based on Weight (M£)Cost Savings Using LHVs Based on Cargo Space (M£)Fuel Savings Using LHVs Based on Weight (Million l)Fuel Savings Using LHVs Based on Cargo Space (Million l)
01 Agricultural products without forestry10129−6076−435
05 Textiles0270000
10 Metal products3373−243617
13 Furniture0450000
16 Empty containers, packaging49128−1885−422
19 Unidentifiable goods3685−650620
Additional savings based on cargo space 359 340 94
Table 8. Range of estimated savings in the United Kingdom using LHVs.
Decrease in UK artics over 33 t vkmDecrease as % of artics over 33 t UK vkmDecrease as % of total UK vkm
Lower estimate210721%11%
Upper estimate258126%13%
Fuel saving (Ml)Fuel savings as % of current over 33 t artics fuel useCO2 saving (Mt)
Lower estimate1785%0.47
Upper estimate2728%0.72
Cost saving (M£)Cost savings as % of current over 33 t artics costs
Lower estimate9839%
Upper estimate145414%
Table 9. Range of estimated savings in the United Kingdom using LHVs when taking infrastructure and modal shift into account.
Decrease in U.K. artics over 33 t vkmDecrease as % of artics over 33 t U.K. vkmDecrease as % of total U.K. vkm
Lower estimate1 53515%8%
Upper estimate2 58126%13%
Fuel saving (Ml)Fuel savings as % of current over 33 t artics fuel useCO2 saving (Mt)
Lower estimate1294%0.35
Upper estimate2728% 0.72
Cost saving (M£)Cost savings as % of current over 33 t artics costs
Lower estimate7167%
Upper estimate1 45414%

