What Drove Changes in the Embodied Energy Consumption of Guangdong’s Exports from 2007–2012?


Abstract
1. Introduction
2. Method and Data Preparation
2.1. Embodied Energy Accounting Method
2.2. Decomposition Method
2.3. Data Preparation
3. Guangdong’s Trade and Energy Consumption
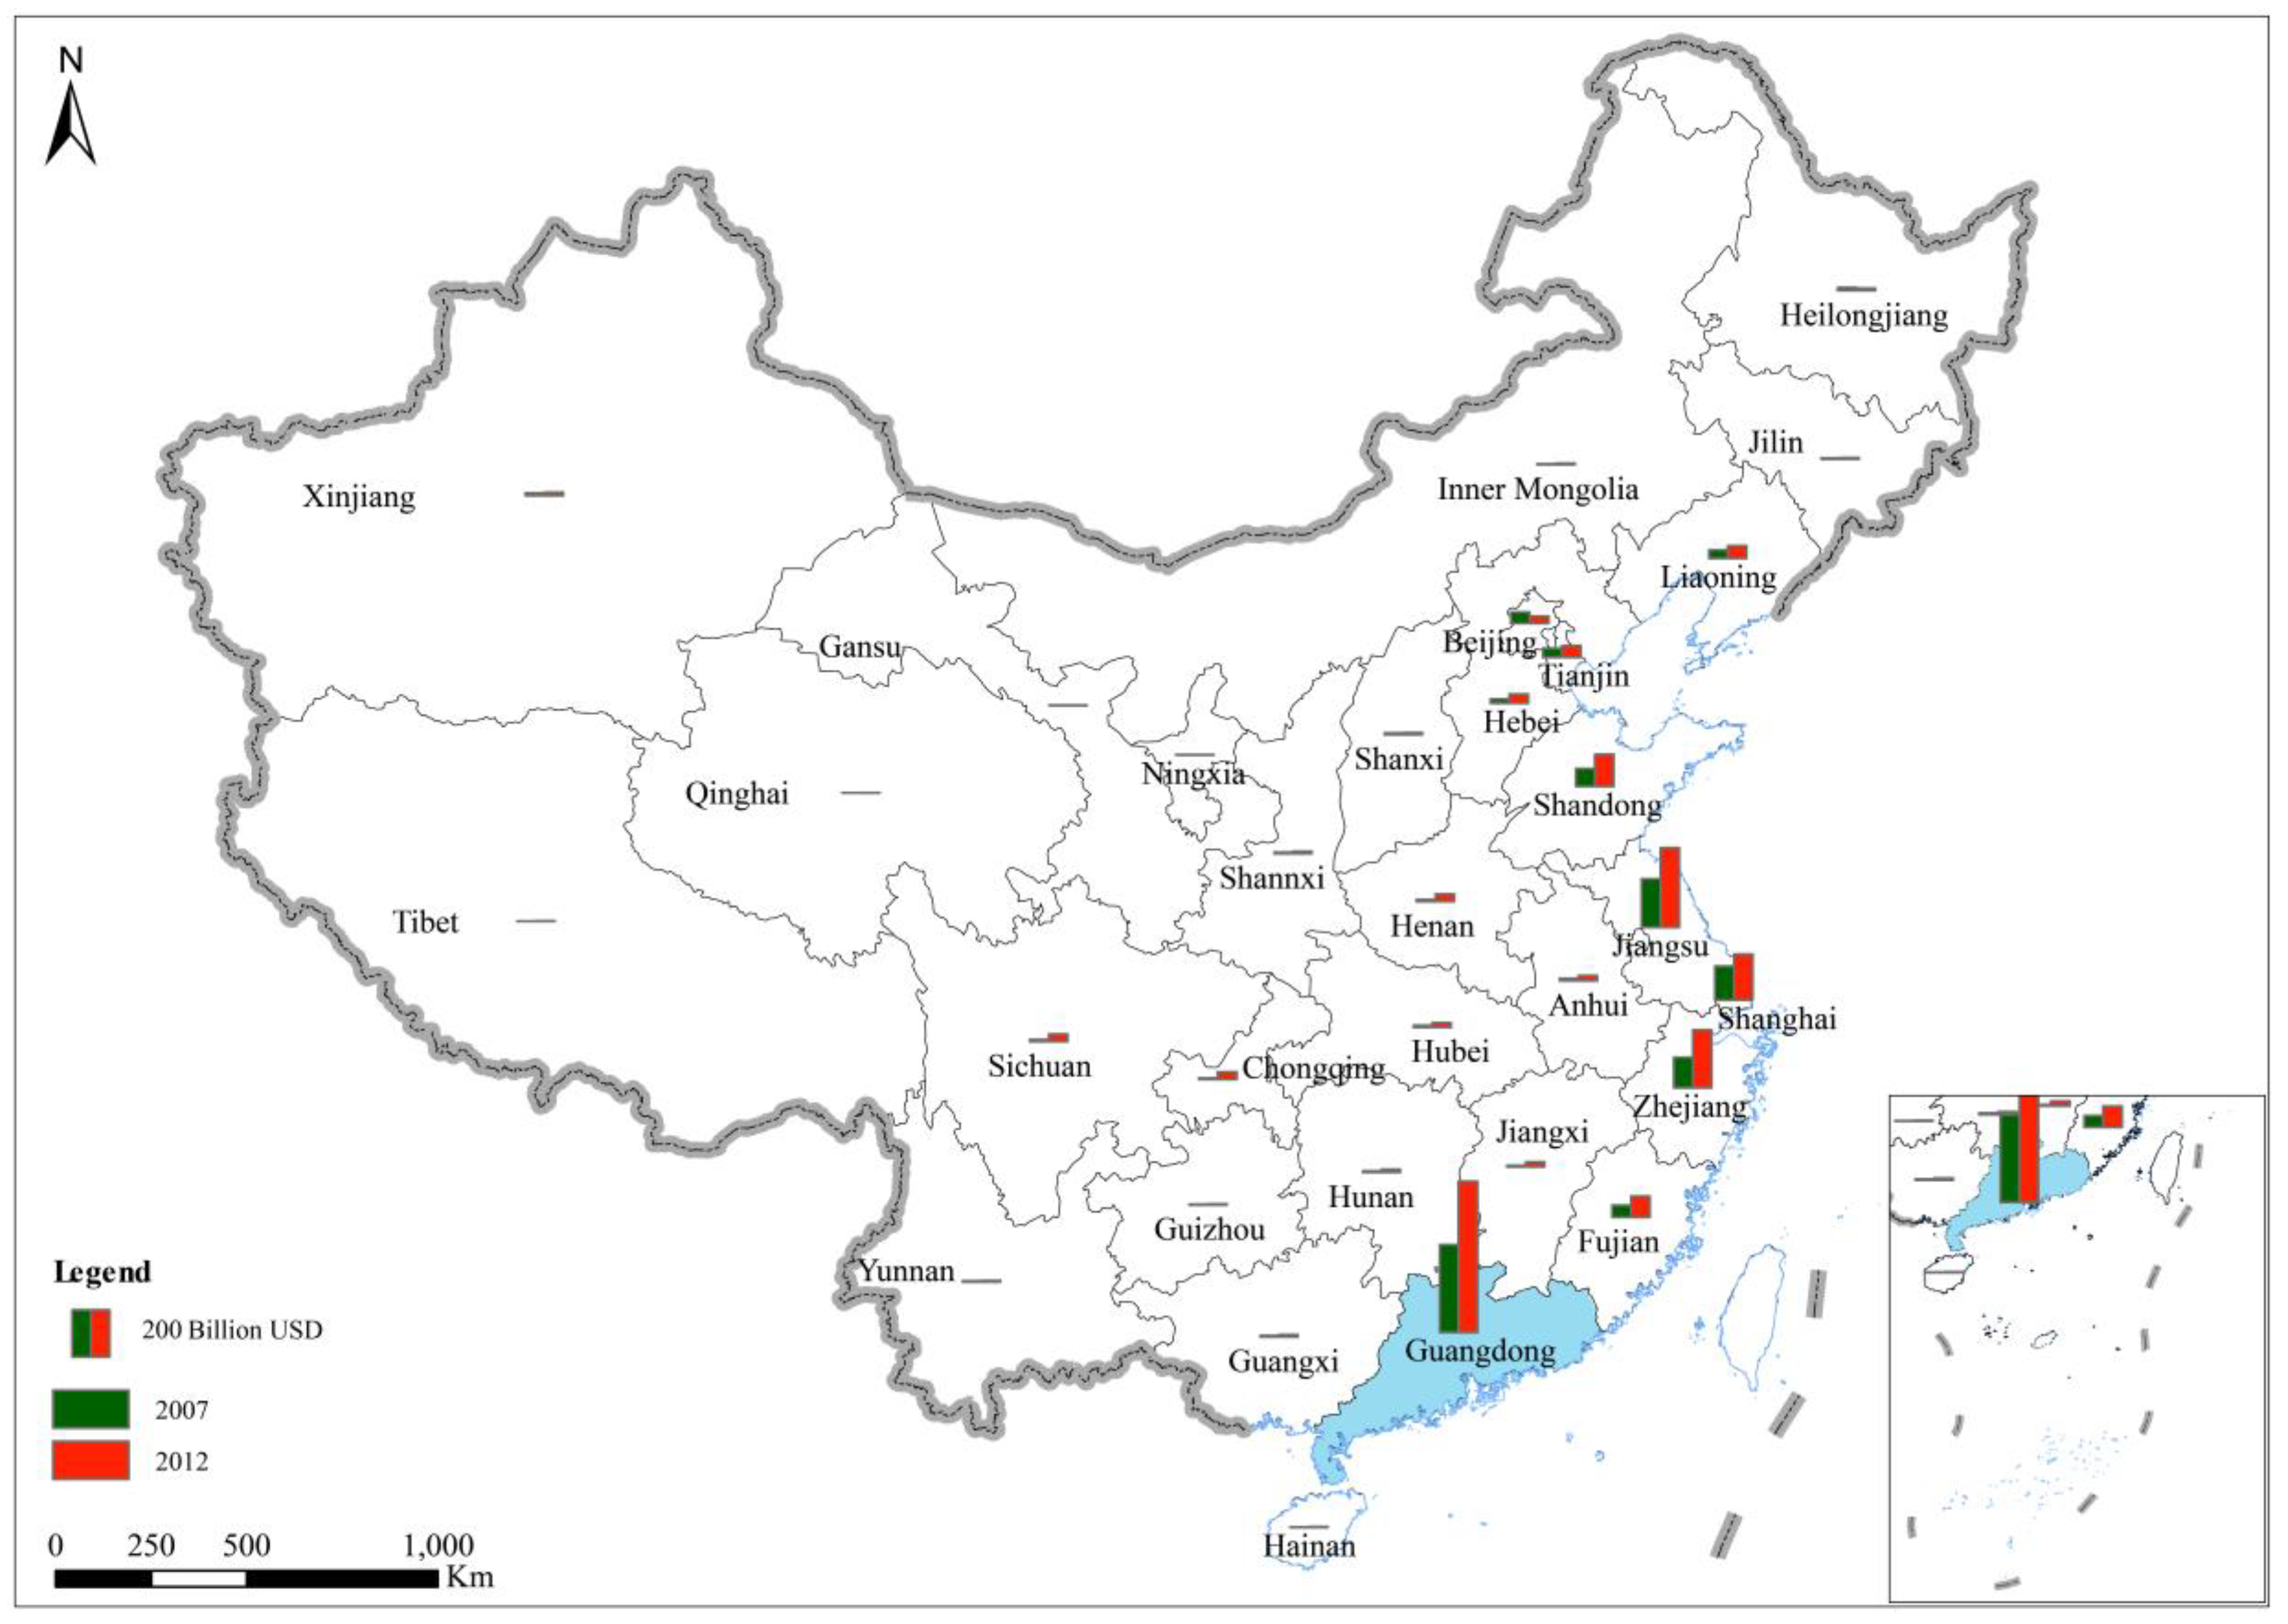
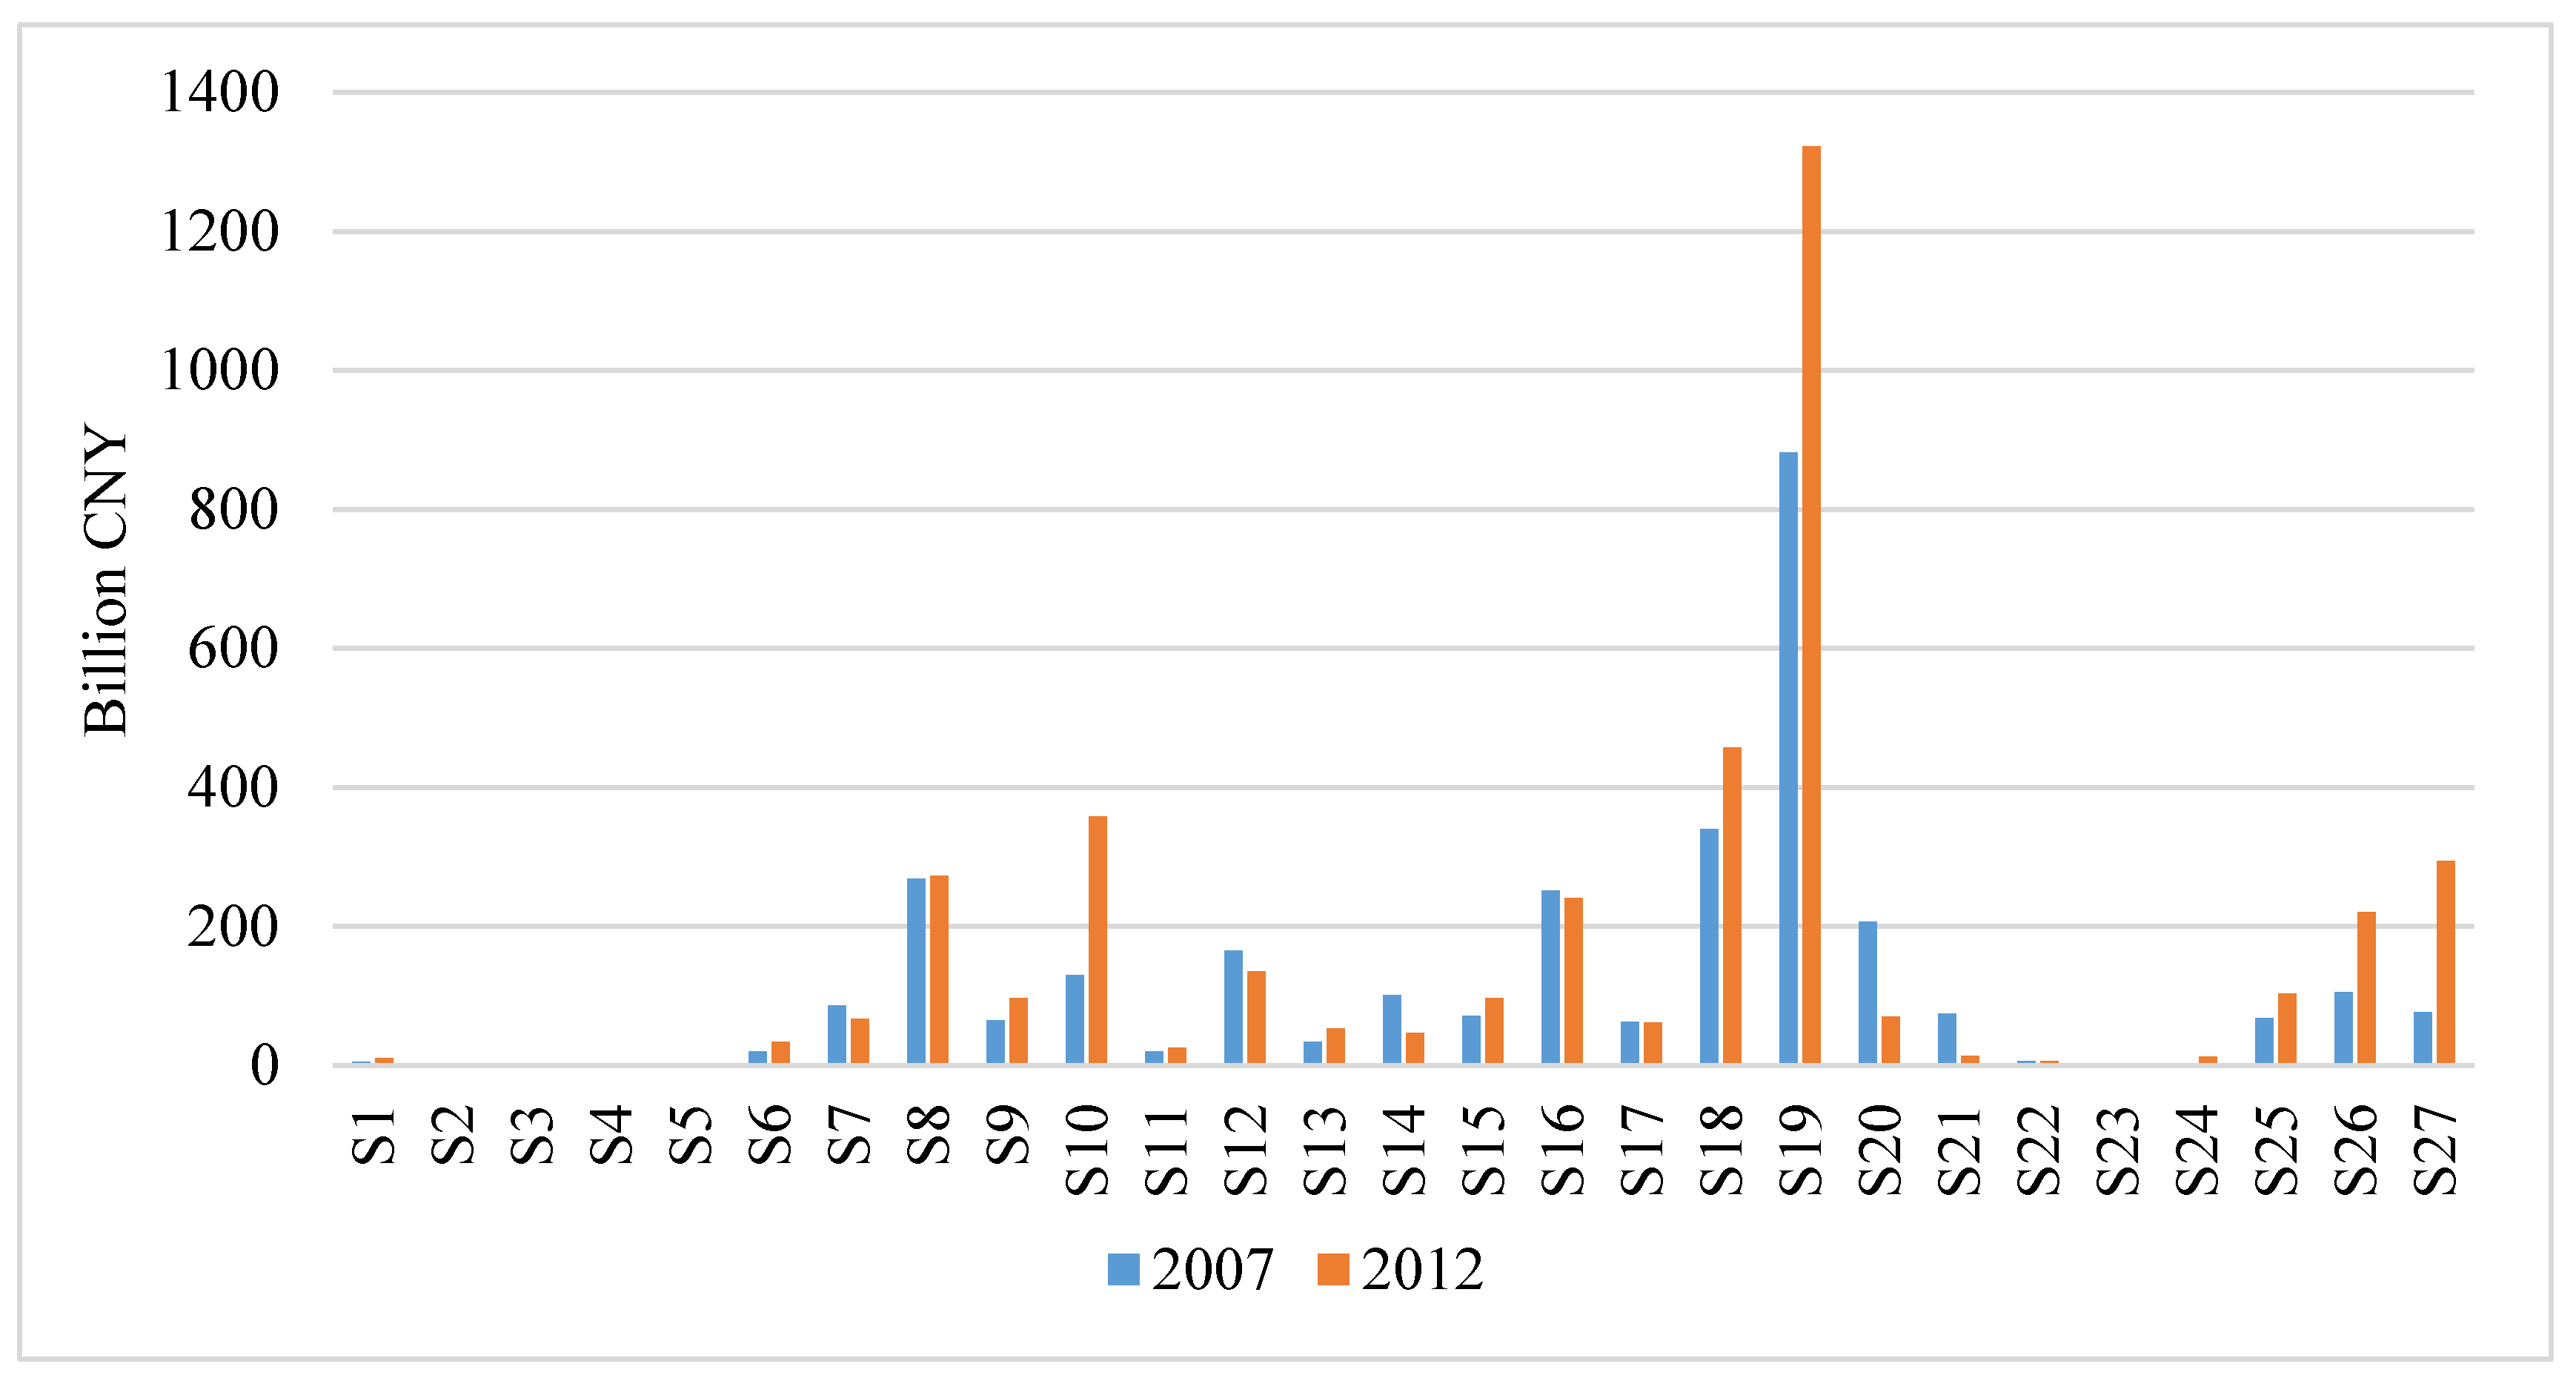
3.1. Guangdong’s Exports in 2007 and 2012
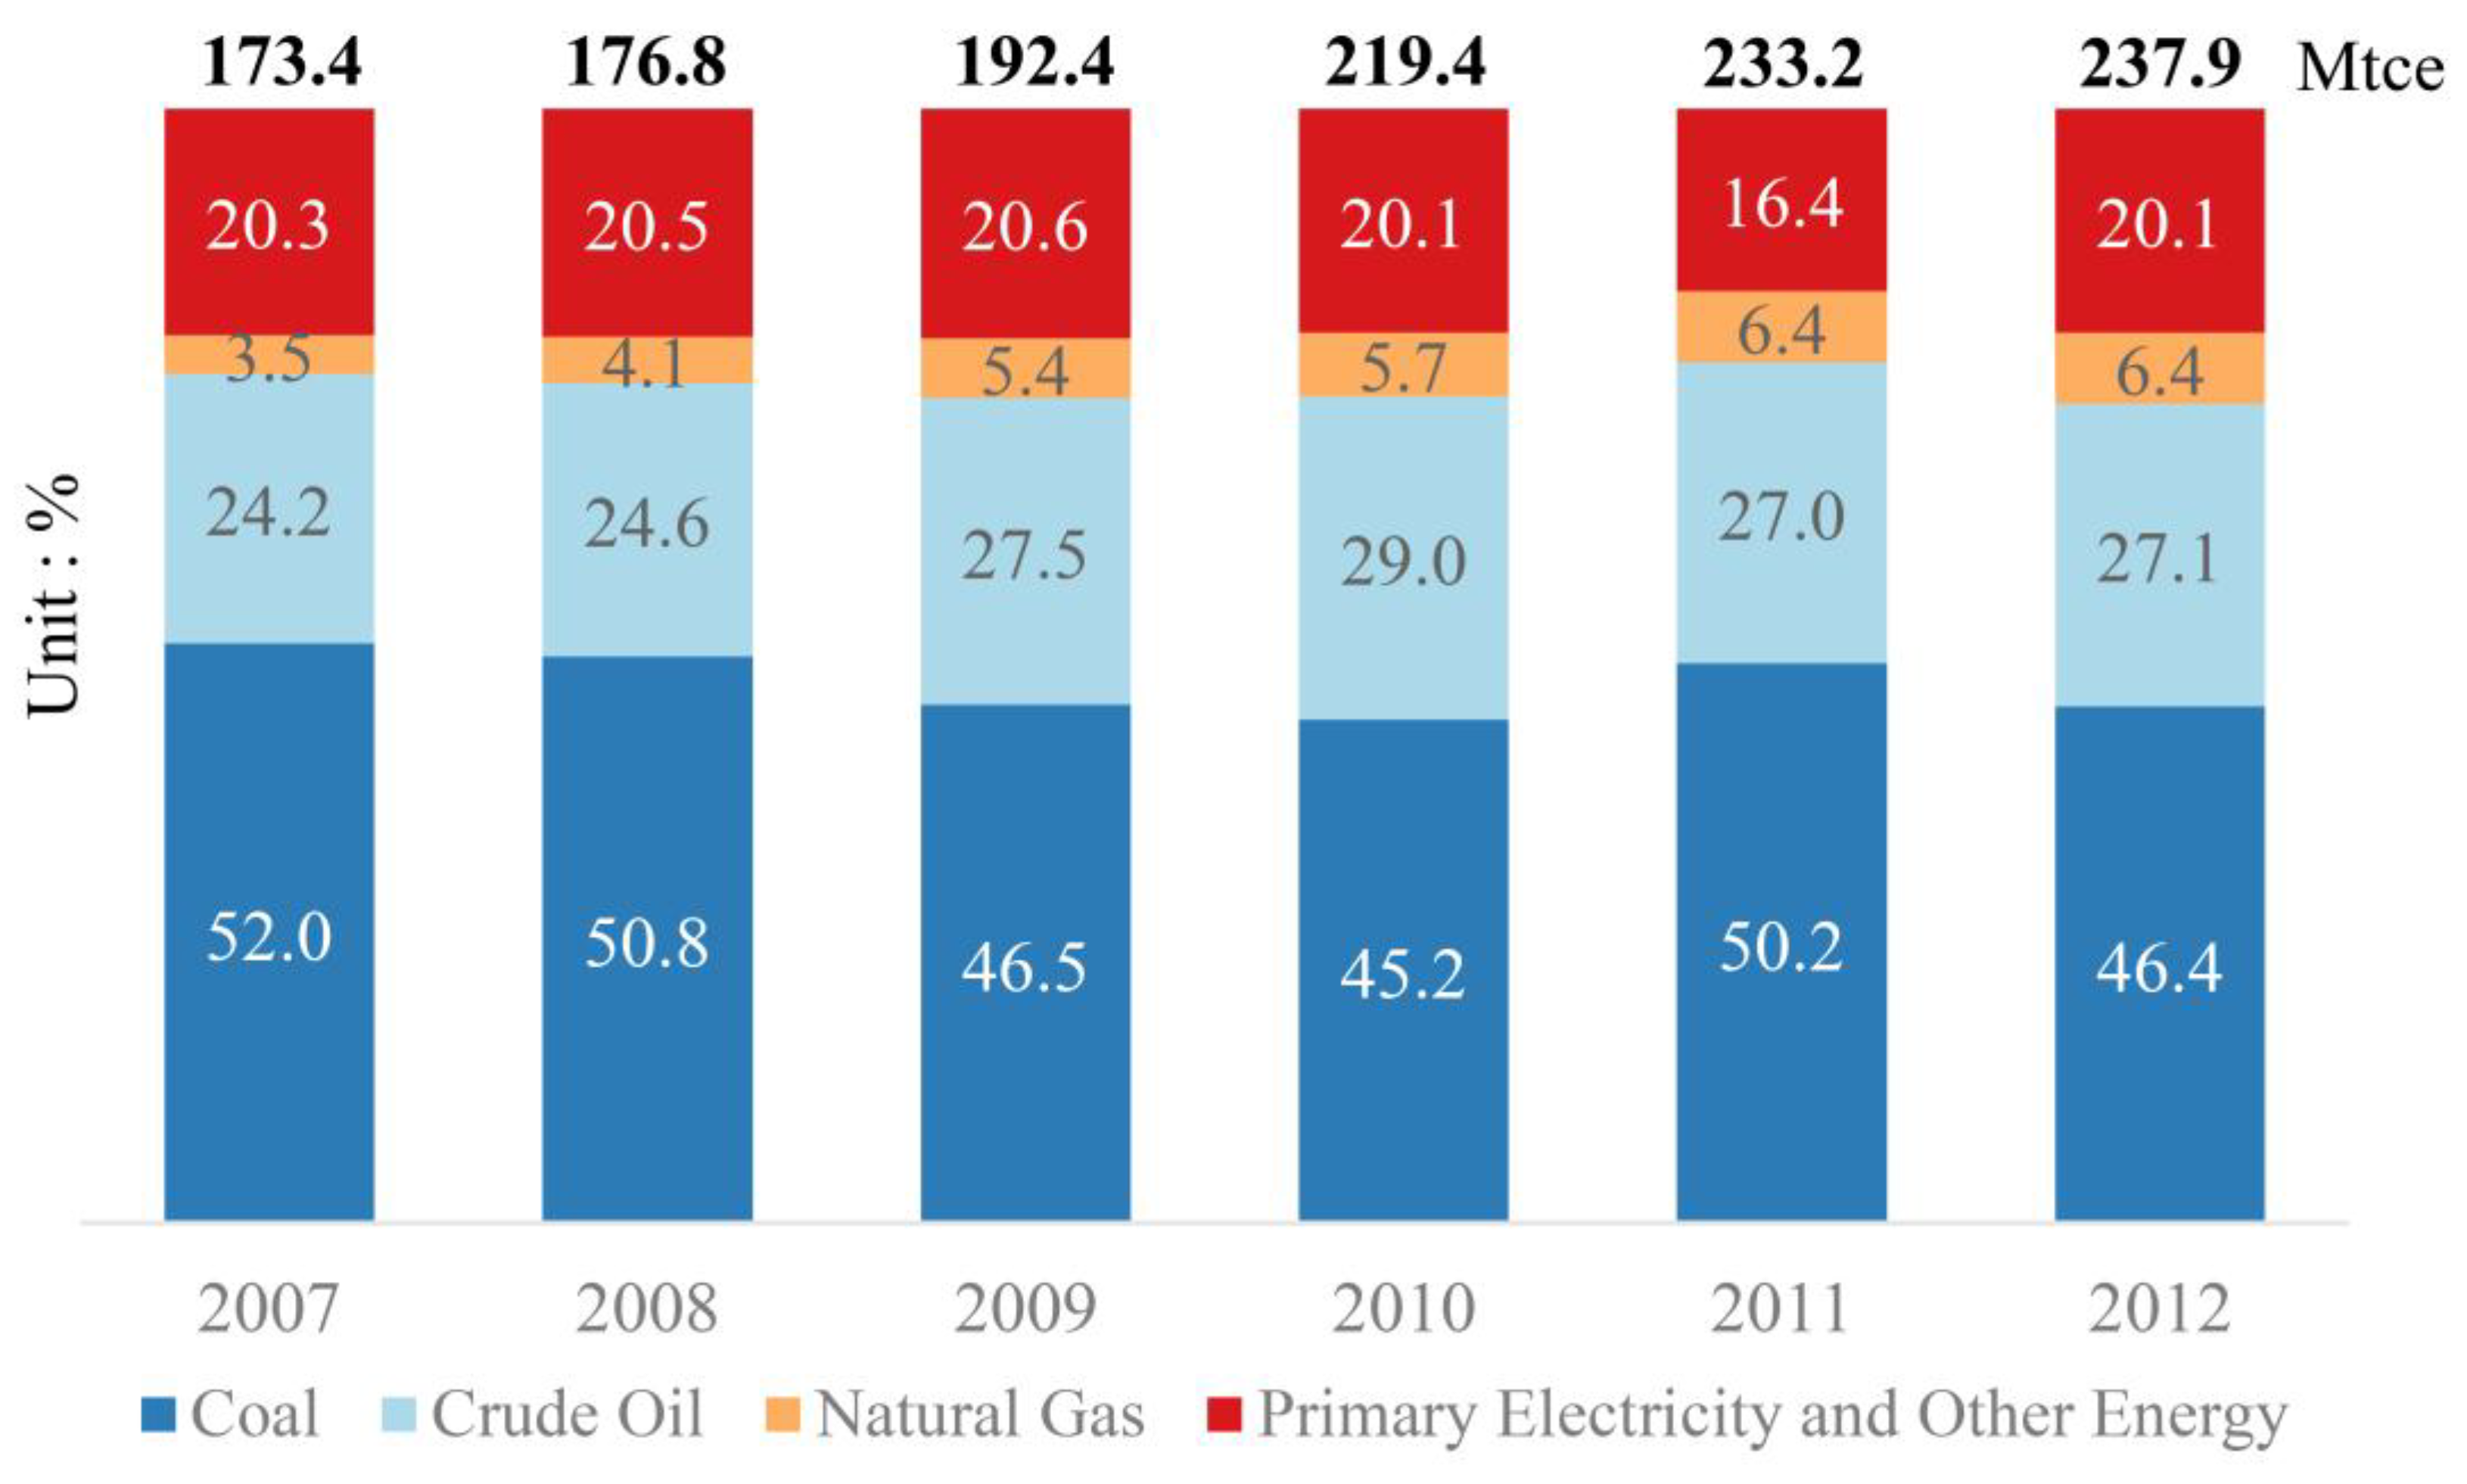
3.2. Trend of Guangdong’s Energy Consumption
4. Results
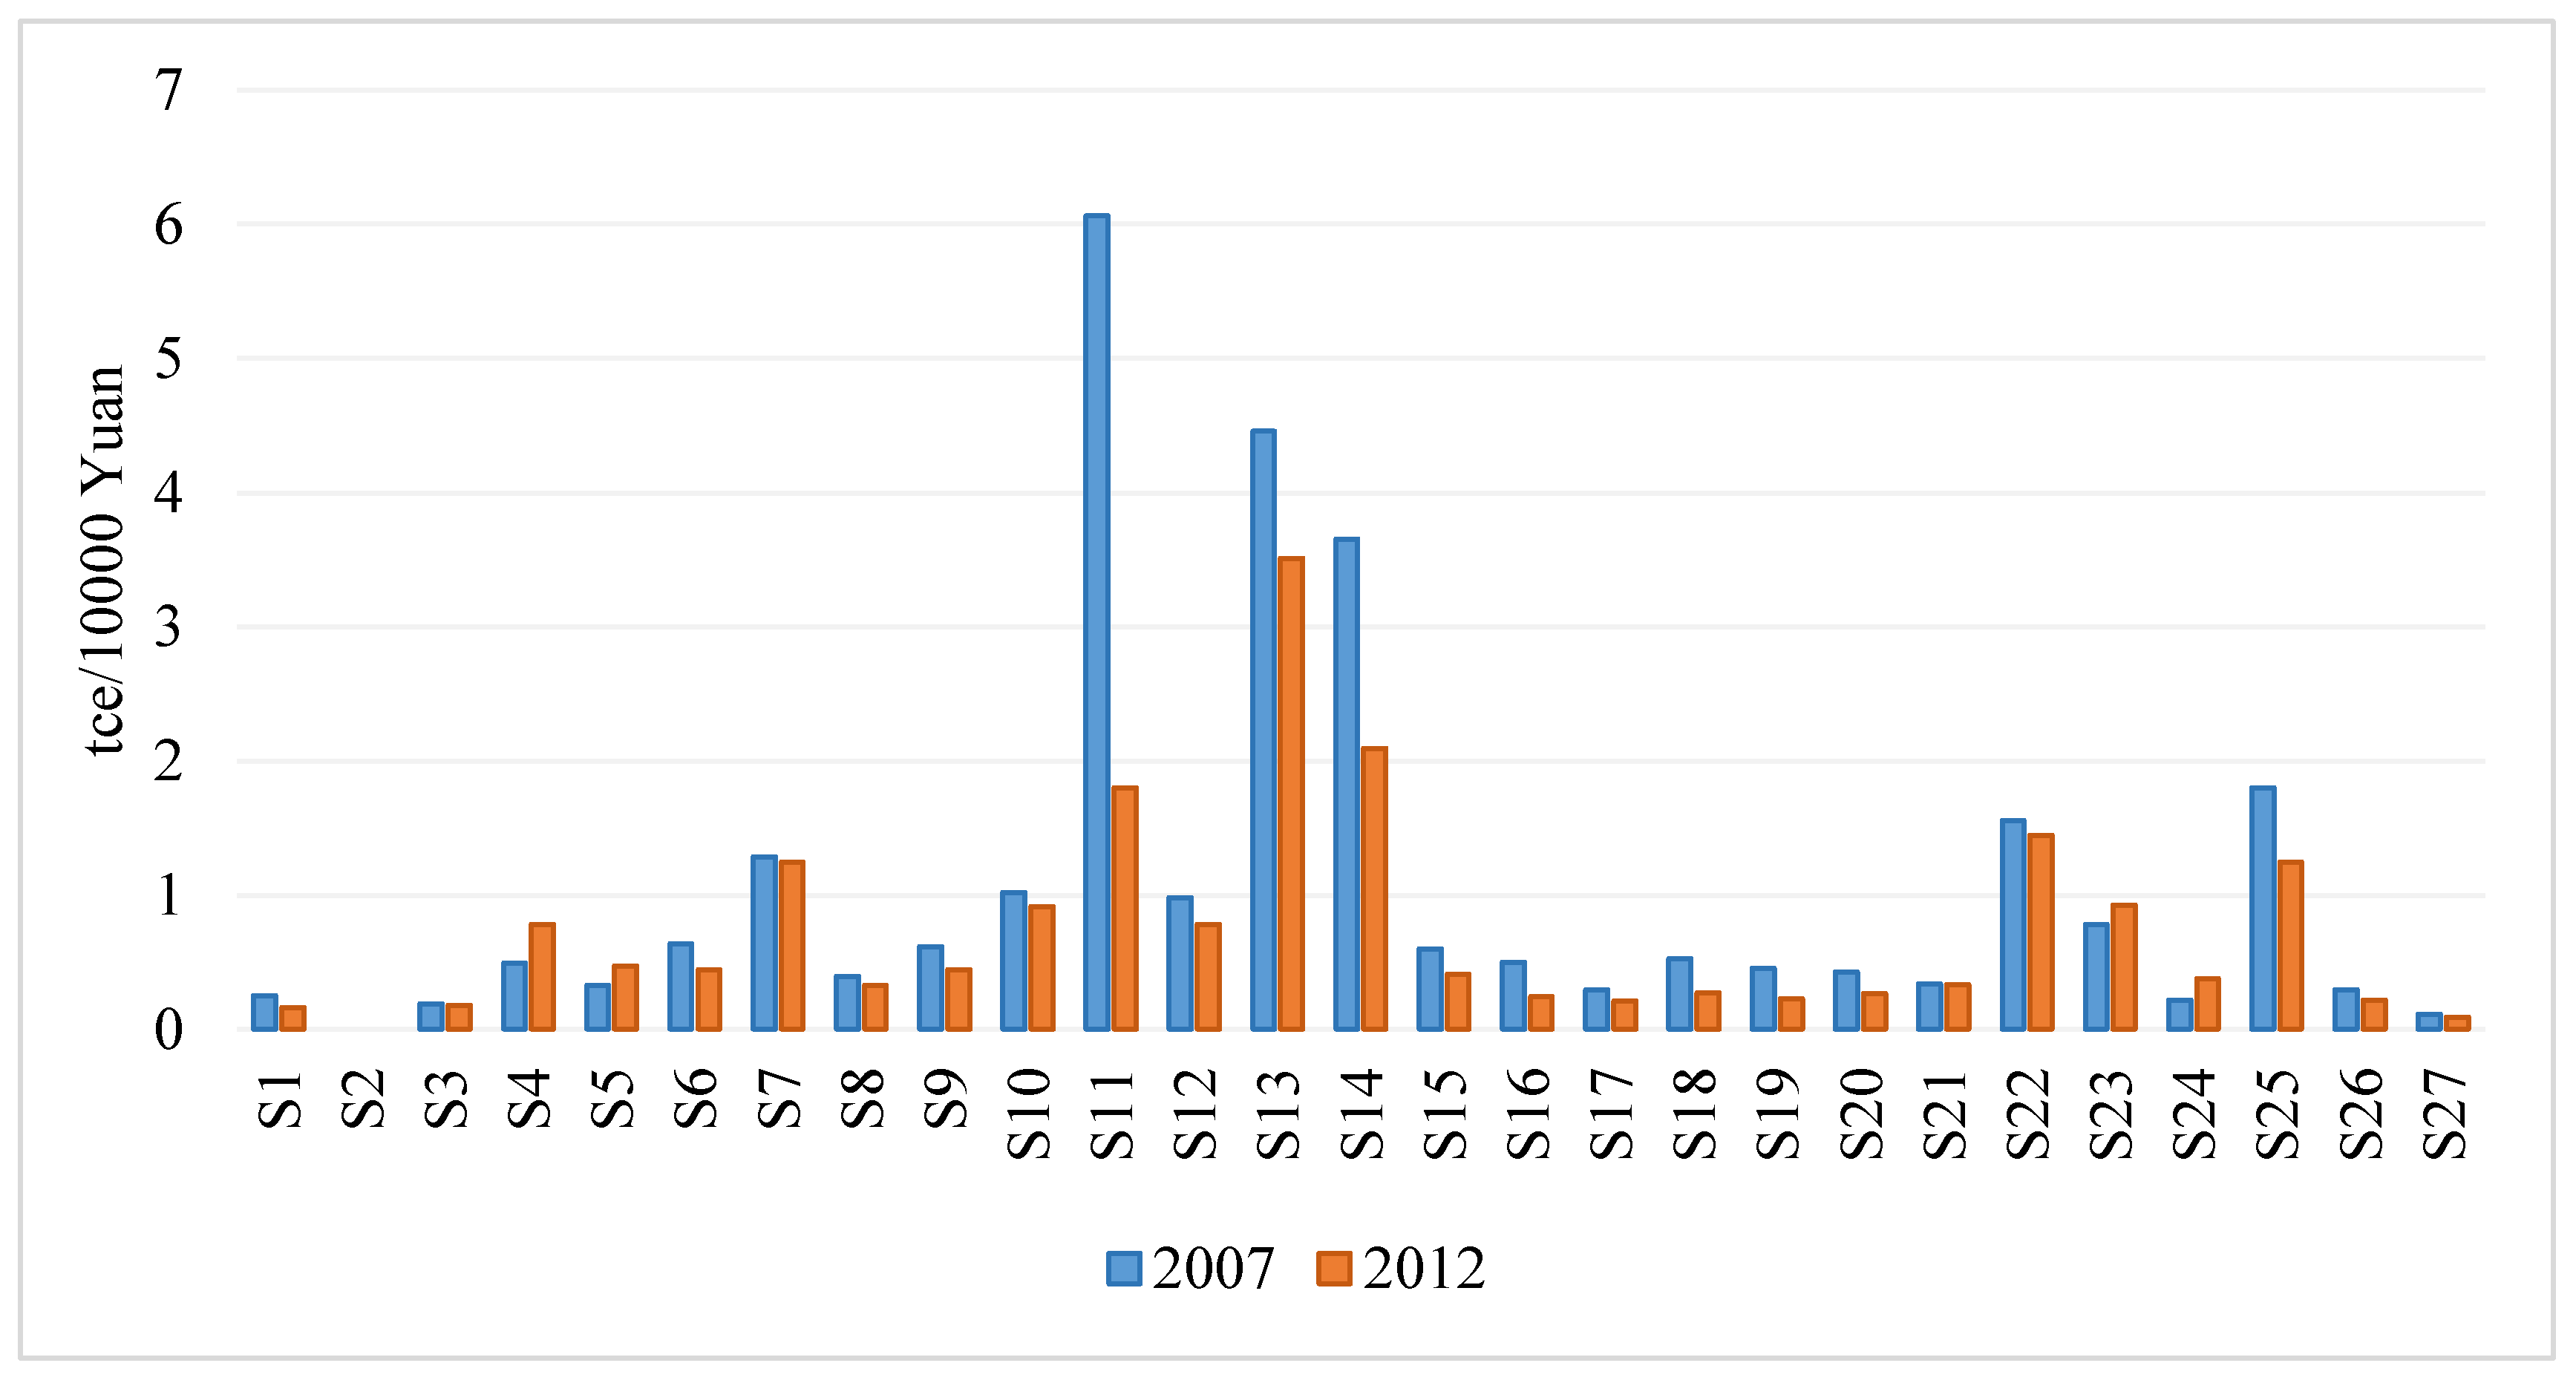
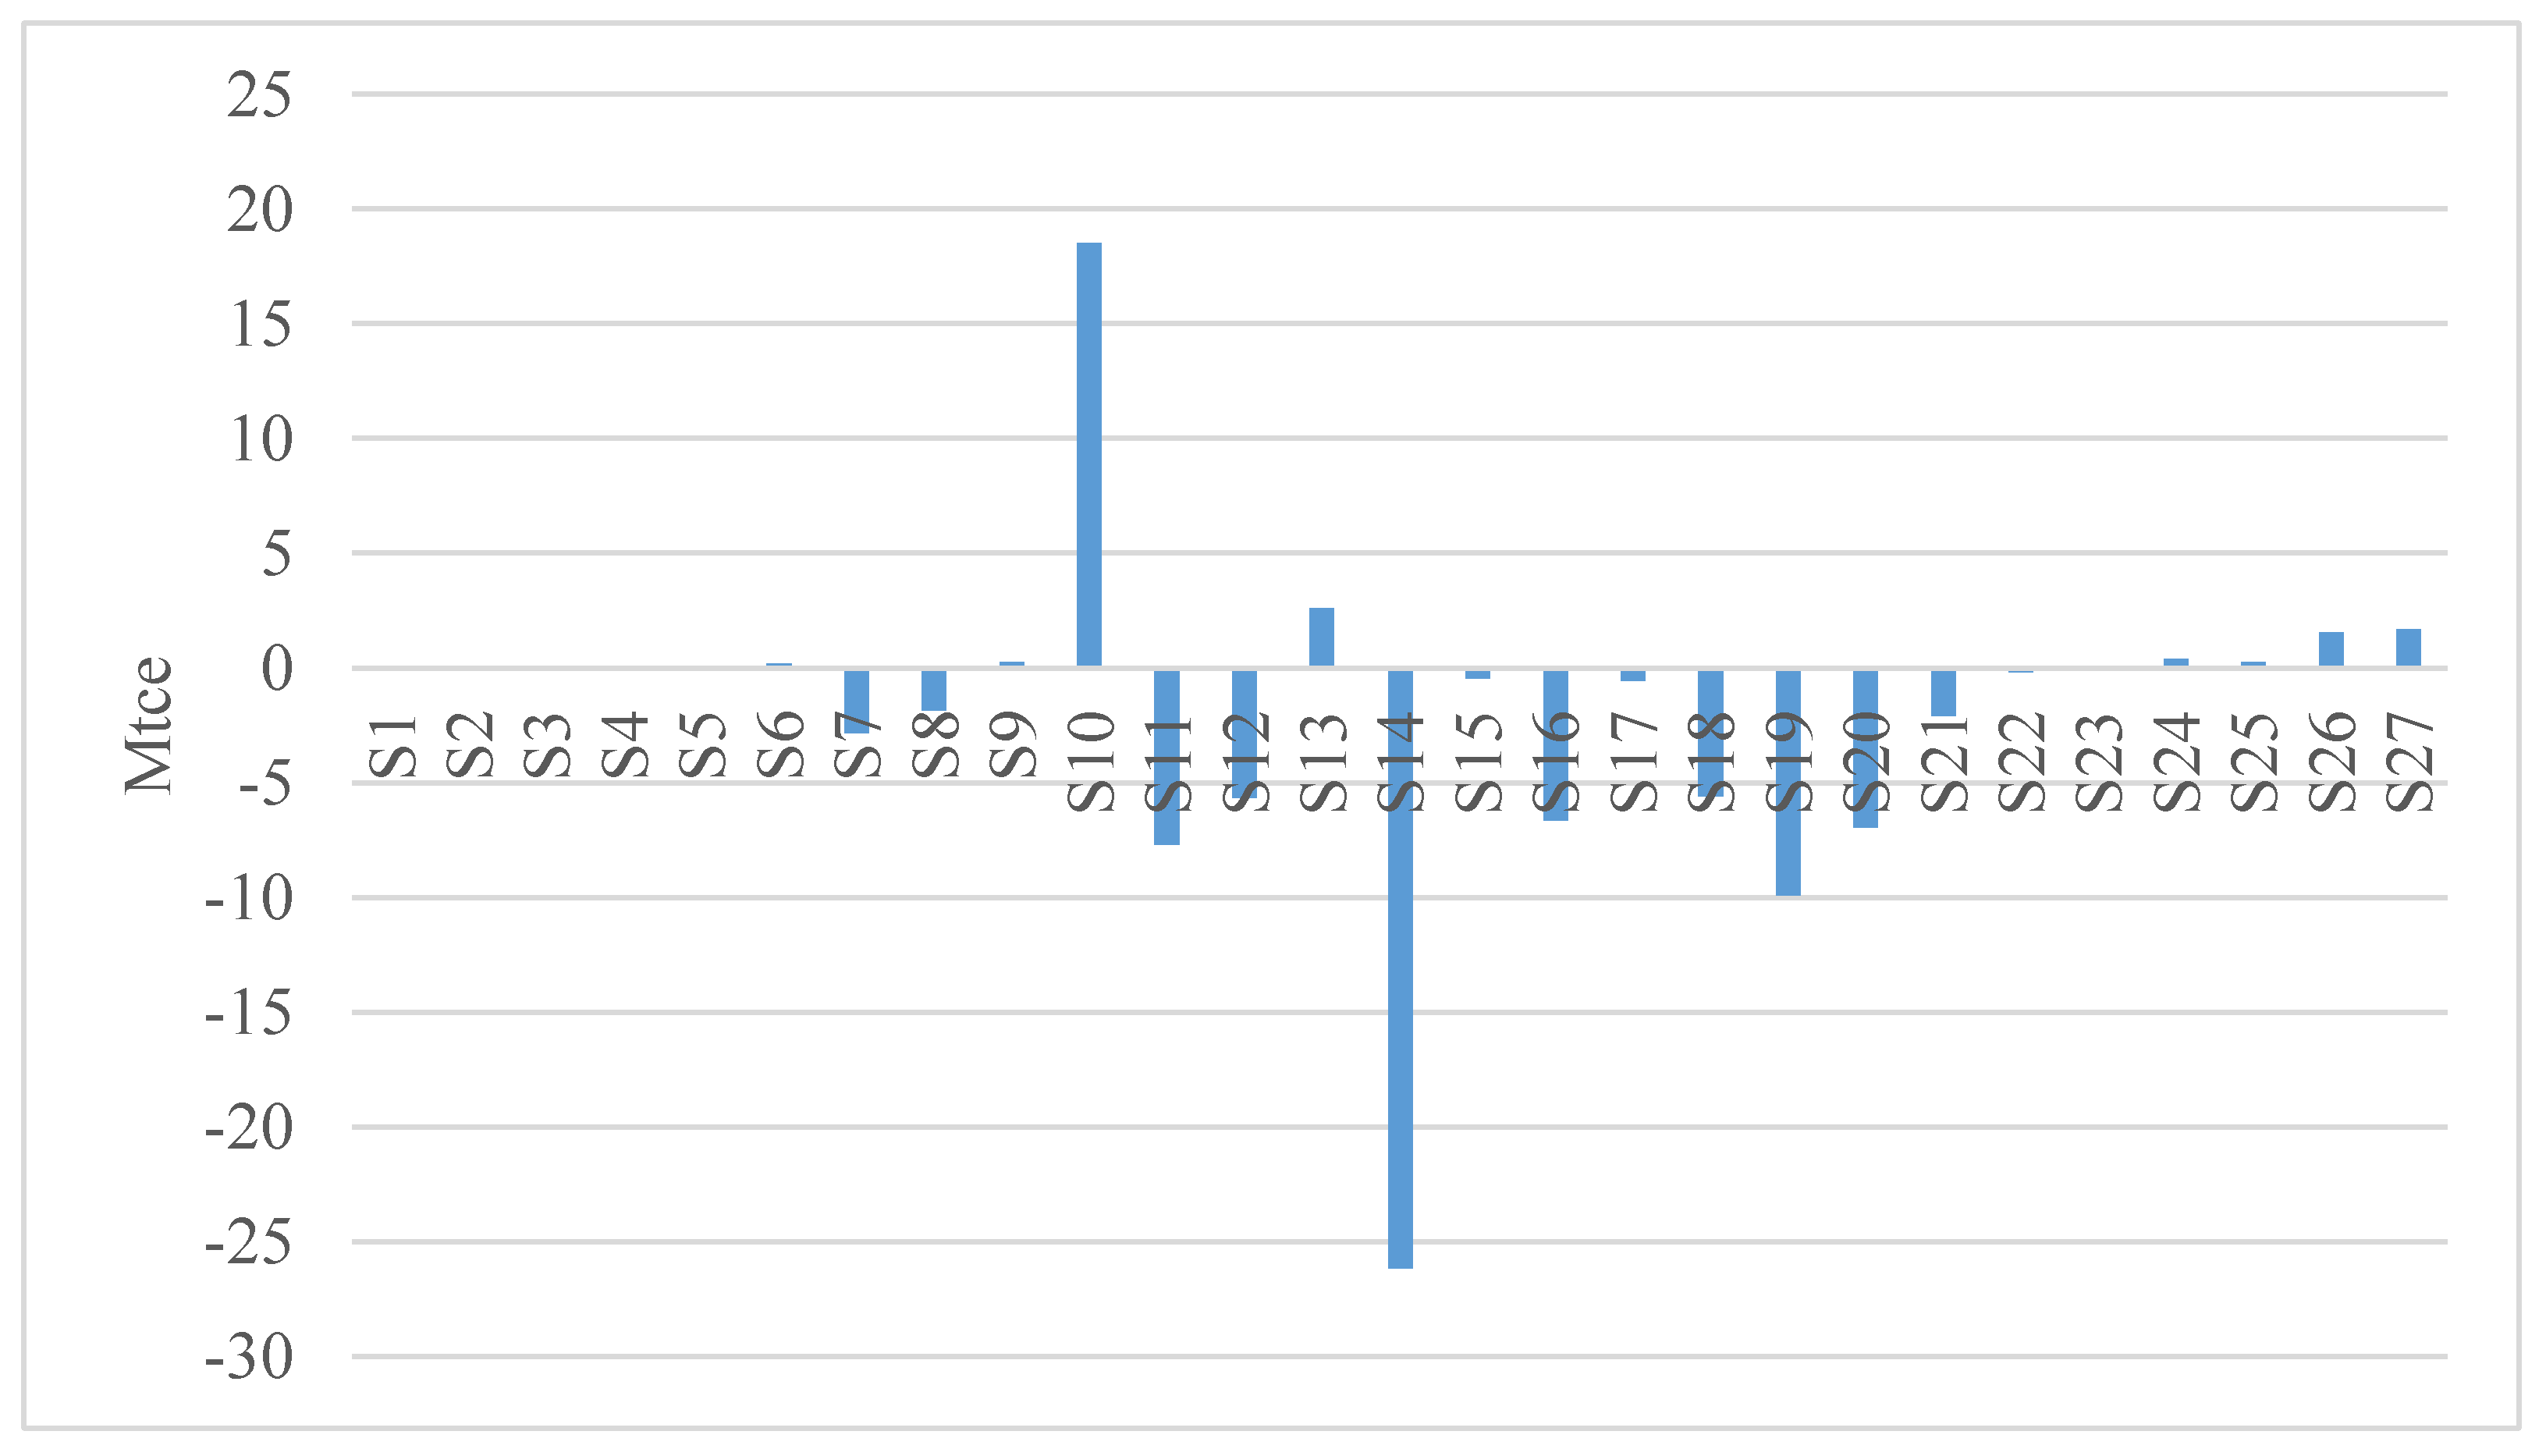
4.1. Energy Consumption Change in Each Sector from 2007–2012
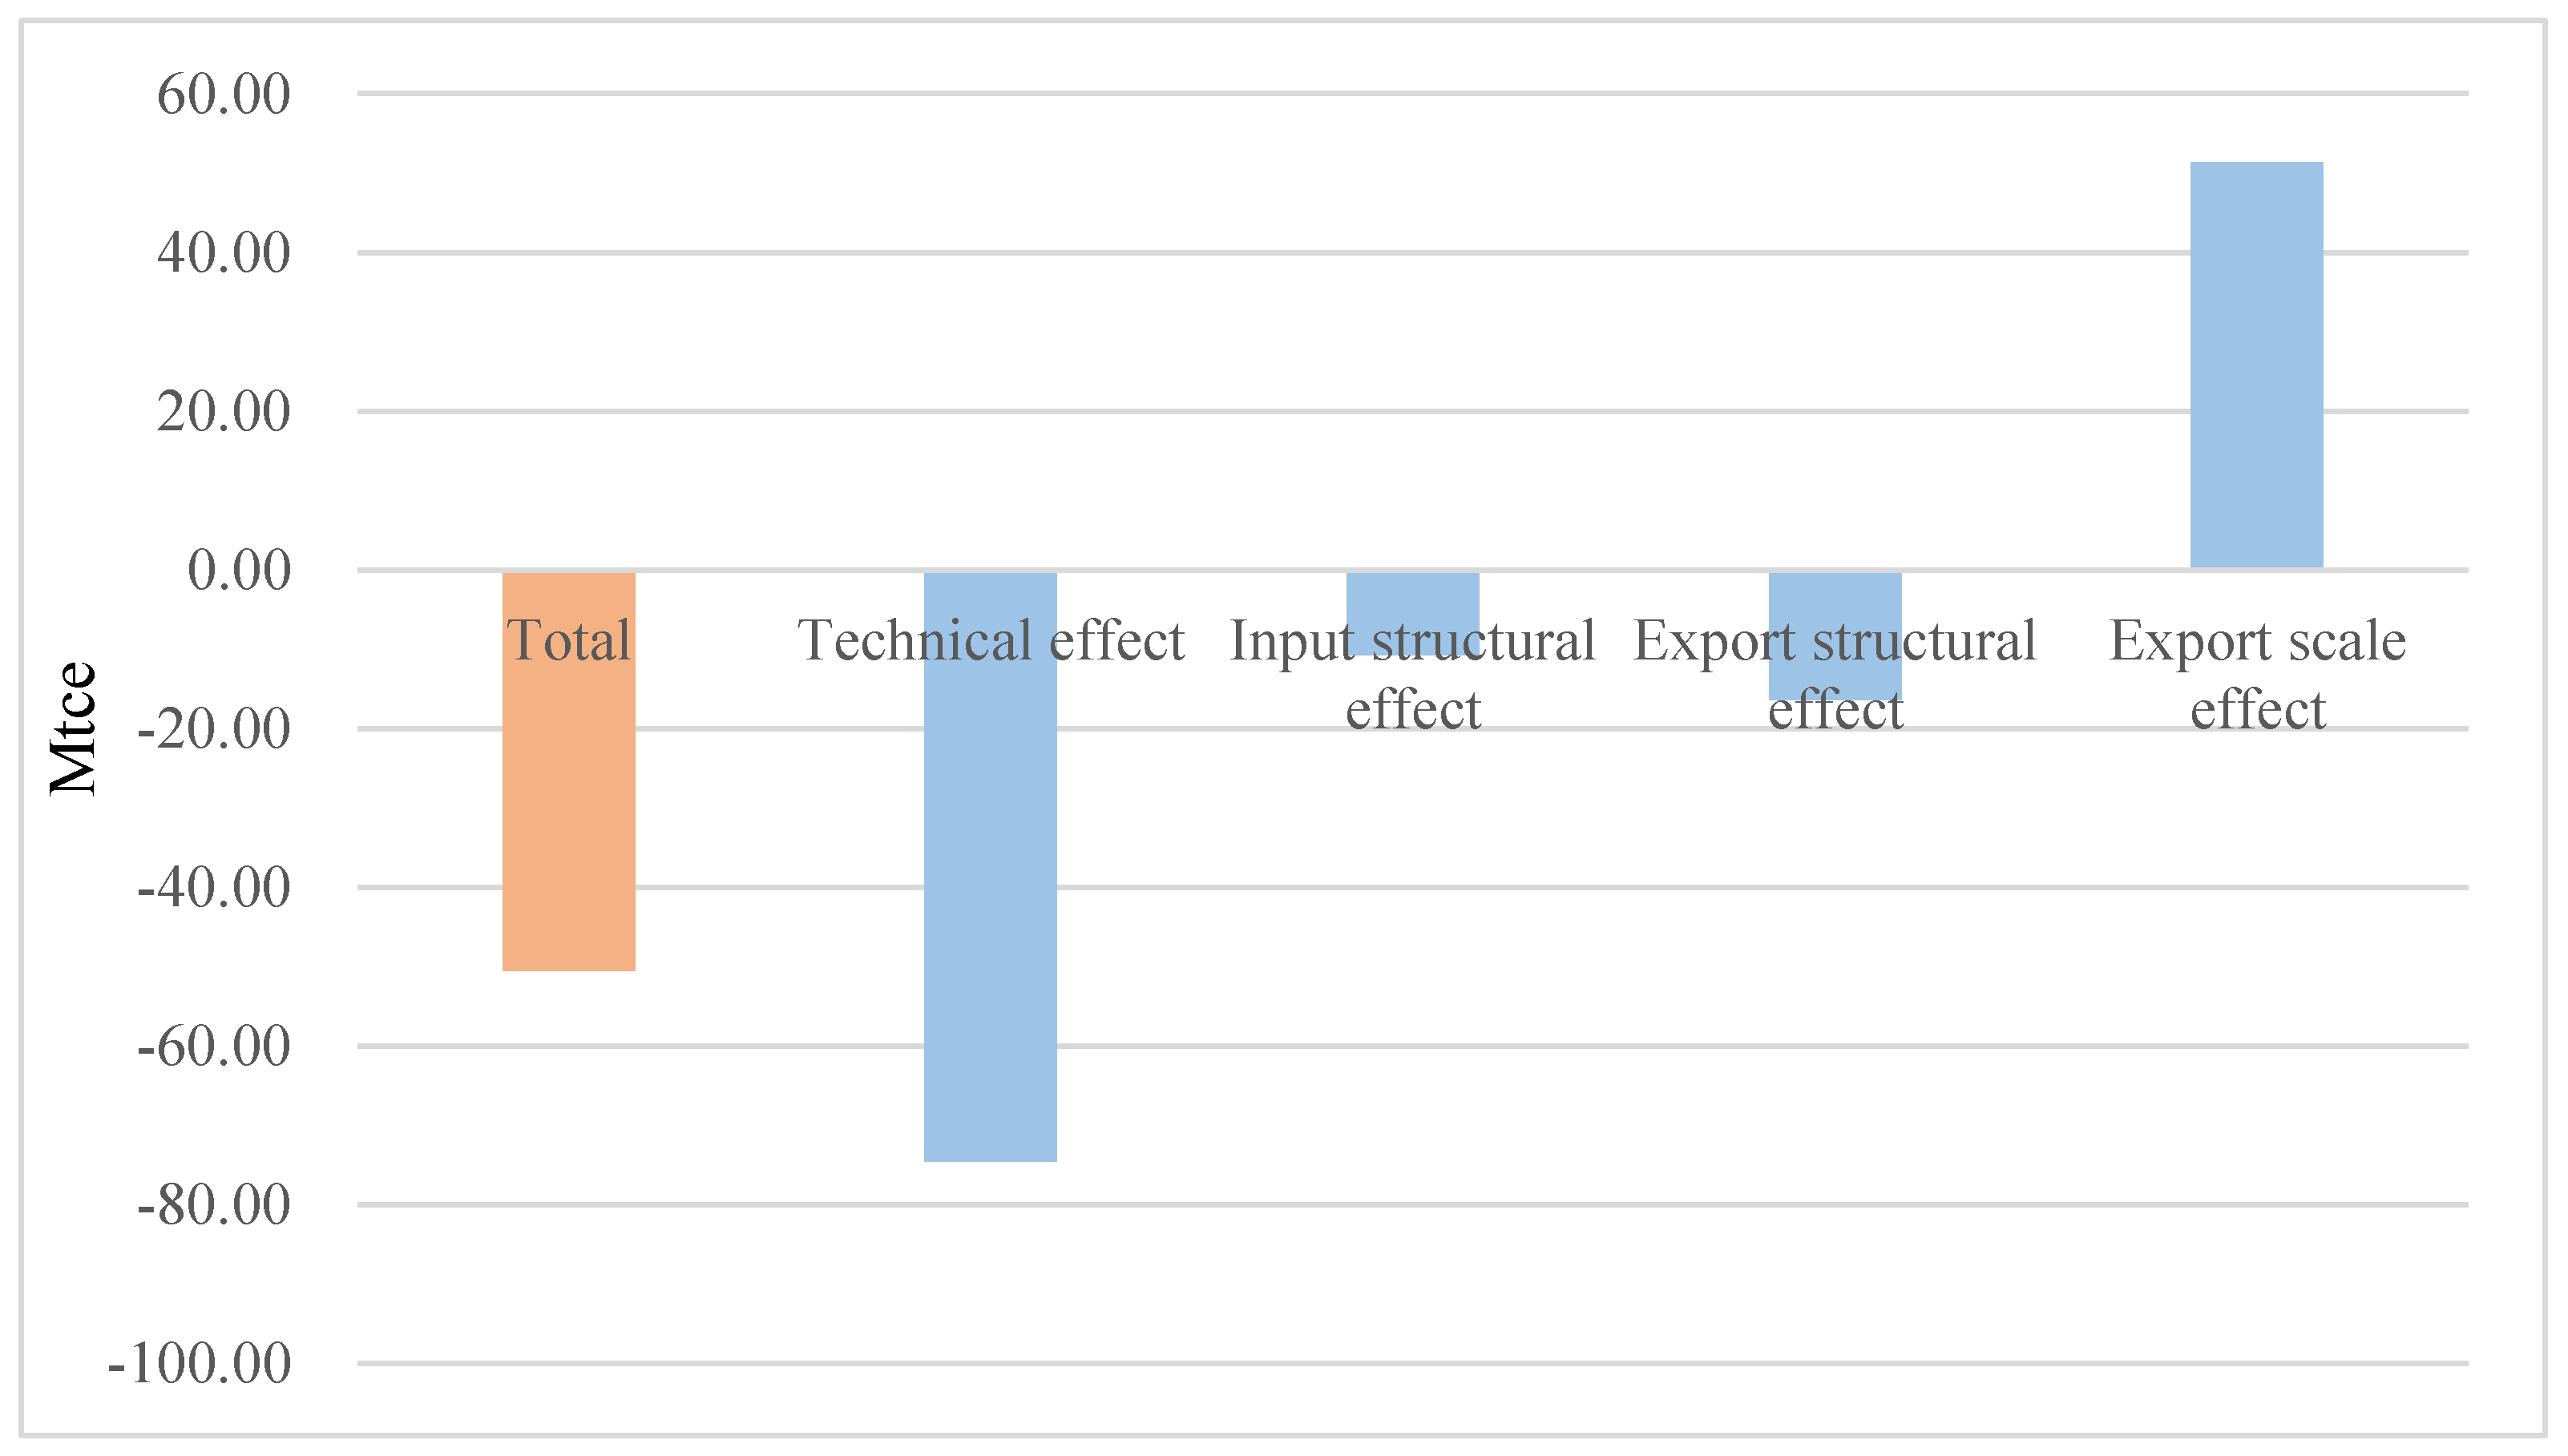
4.2. Contributors to Change in Energy Consumption Embodied in Guangdong’s Exports
4.3. Contributors to Change in Embodied Energy Consumption in Each Sector
5. Conclusions and Policy Implications
- (1)
- From 2007 to 2012, despite the global financial crisis, growth in exports from Guangdong remained fast. Changes to the export structure in Guangdong are reflected in low energy intensity industry experiencing faster growth in exports than high energy intensity industry.
- (2)
- The growth rate of embodied energy consumption in Guangdong’s exports is slowing, with average annual growth from 2007 to 2016 of 5.1%. The energy structure is also becoming cleaner. Through technical change, the energy intensity of most industries has decreased sharply, especially for high energy intensity industries such as metal smelting and rolling.
- (3)
- Though Guangdong’s exports grew significantly, the energy consumption embodied therein decreased by 23% from 2007 to 2012, representing a drop of 50.51 Mtce. The most important driver was technical change, which contributed 146% of the reduction in total embodied energy consumption.
- (4)
- In terms of sector-level changes, the largest increase in energy consumption embodied in exports from 2007 to 2012 was in metal smelting and rolling. The most prominent change driver differed across sectors. For low value-added industries, such as metal smelting and rolling, the main contributor was export structure change, while for high value-added industries, such as communications, computers, and other electronic equipment, the main contributor was technical change.
Author Contributions
Funding
Acknowledgments
Conflicts of Interest
References
- BP (British Petroleum). BP Energy Outlook 2017; BP: London, UK, 2017. [Google Scholar]
- National Bureau of Energy. Circular on Measures to Control the Export of Some Products with High Energy Consumption, High Pollution and Resources. Available online: http://www.nea.gov.cn/2011-08/18/c_131057624.htm (accessed on 12 June 2018). (In Chinese)
- Fenghuang Net. Why Guangdong GDP Can Stay in the First Place for 29 Years in a Row? Available online: http://finance.ifeng.com/a/20180205/15969420_0.shtml (accessed on 12 June 2018). (In Chinese).
- Zhu, Q.; Peng, X.; Wu, K. Factors Decomposition and Empirical Analysis of Variations in Energy Carbon Emission in China. Resour. Sci. 2009, 31, 2072–2079. (In Chinese) [Google Scholar]
- Copeland, B.R.; Taylor, M.S. North-South trade and the environment. Q. J. Econ. 1994, 109, 755–787. [Google Scholar] [CrossRef]
- Xie, J.; Zhang, P. Embodied Energy in International Trade of China: Calculation and Decomposition. Economics 2014, 4, 1365–1392. (In Chinese) [Google Scholar]
- Wyckoff, A.W.; Roop, J.M. The embodiment of carbon in imports of manufactured products: Implications for international agreements on greenhouse gas emissions. Energy Policy 1994, 22, 187–194. [Google Scholar] [CrossRef]
- Wiedmann, T. A first empirical comparison of energy footprints embodied in trade—MRIO versus PLUM. Ecol. Econ. 2009, 68, 1975–1990. [Google Scholar] [CrossRef]
- National Bureau of Statistics. China Energy Statistical Yearbook 2015; China Statistical Press: Beijing, China, 2015.
- Hong, L.; Dong, Z.P.; He, C.; Gang, W. Evaluating the effects of embodied energy in international trade on ecological footprint in China. Ecol. Econ. 2007, 62, 136–148. [Google Scholar] [CrossRef]
- Mi, Z.; Meng, J.; Green, F.; Coffman, D.M.; Guan, D. China’s “Exported Carbon” Peak: Patterns, Drivers, and Implications. Geophys. Res. Lett. 2018, 45, 4309–4318. [Google Scholar] [CrossRef]
- Zhang, Y. Structural decomposition analysis of sources of decarbonizing economic development in China; 1992–2006. Ecol. Econ. 2009, 68, 2399–2405. [Google Scholar] [CrossRef]
- Wachsmann, U.; Wood, R.; Lenzen, M.; Schaeffer, R. Structural decomposition of energy use in Brazil from 1970 to 1996. Appl. Energy 2009, 86, 578–587. [Google Scholar] [CrossRef]
- Weber, C.L. Measuring structural change and energy use: Decomposition of the US economy from 1997 to 2002. Energy Policy 2009, 37, 1561–1570. [Google Scholar] [CrossRef]
- Kim, J.; Heo, E. Sources of structural change in energy use: A decomposition analysis for Korea. Energy Source Part B 2016, 11, 309–313. [Google Scholar] [CrossRef]
- Cellura, M.; Longo, S.; Mistretta, M. Application of the Structural Decomposition Analysis to assess the indirect energy consumption and air emission changes related to Italian households consumption. Renew. Sustain. Energy Rev. 2012, 16, 1135–1145. [Google Scholar] [CrossRef]
- Xia, Y.; Yang, C.; Chen, X. Analysis on determining factors of energy intensity in China based on comparable price input-output table. Syst. Eng. Theory Pract. 2009, 10, 4. (In Chinese) [Google Scholar]
- Li, F.; Song, Z.; Liu, W. China’s energy consumption under the global economic crisis: Decomposition and sectoral analysis. Energy Policy 2014, 64, 193–202. [Google Scholar] [CrossRef]
- Zhang, H.; Lahr, M.L. China’s energy consumption change from 1987 to 2007: A multi-regional structural decomposition analysis. Energy Policy 2014, 67, 682–693. [Google Scholar] [CrossRef]
- Zeng, L.; Xu, M.; Liang, S.; Zeng, S.; Zhang, T. Revisiting drivers of energy intensity in China during 1997–2007: A structural decomposition analysis. Energy Policy 2014, 67, 640–647. [Google Scholar] [CrossRef]
- Zhao, X.; Ma, C.; Hong, D. Why did China’s energy intensity increase during 1998–2006: Decomposition and policy analysis. Energy Policy 2010, 38, 1379–1388. [Google Scholar] [CrossRef]
- Lin, X.; Polenske, K.R. Input-output anatomy of China’s energy use changes in the 1980s. Econ. Syst. Res. 1995, 7, 67–84. [Google Scholar] [CrossRef]
- Song, P.; Ji, J.; Ma, X. Structural decomposition analysis on the growth of carbon emission from energy consumption in Guangdong. Res. Sci. 2012, 34, 551–558. (In Chinese) [Google Scholar]
- Gasim, A.A. The embodied energy in trade: What role does specialization play? Energy Policy 2015, 86, 186–197. [Google Scholar] [CrossRef]
- Xu, S.; Zhang, W.; Li, Q.; Zhao, B.; Wang, S.; Long, R. Decomposition Analysis of the Factors that Influence Energy Related Air Pollutant Emission Changes in China Using the SDA Method. Sustainability 2017, 9, 1742. [Google Scholar] [CrossRef]
- Li, G.; Wang, S. Regional Factor Decompositions in China’s Energy Intensity Change: Base on LMDI Technique. J. Financ. Econ. 2008, 34, 52–62. (In Chinese) [Google Scholar]
- Zhang, M.; Mu, H.; Ning, Y.; Song, Y. Decomposition of energy-related CO2 emission over 1991–2006 in China. Ecol. Econ. 2009, 68, 2122–2128. [Google Scholar] [CrossRef]
- Wang, W.W.; Zhang, M.; Zhou, M. Using LMDI method to analyze transport sector CO2 emissions in China. Energy 2011, 36, 5909–5915. [Google Scholar] [CrossRef]
- Nie, H.; Kemp, R. Index decomposition analysis of residential energy consumption in China: 2002–2010. Appl. Energy 2014, 121, 10–19. [Google Scholar] [CrossRef]
- Fernández González, P.; Landajo, M.; Presno, M.J. Multilevel LMDI decomposition of changes in aggregate energy consumption. A cross country analysis in the EU-27. Energy Policy 2014, 68, 576–584. [Google Scholar] [CrossRef]
- Zhao, M.; Tan, L.; Zhang, W.; Ji, M.; Liu, Y.; Yu, L. Decomposing the influencing factors of industrial carbon emissions in Shanghai using the LMDI method. Energy 2010, 35, 2505–2510. [Google Scholar] [CrossRef]
- Yang, J.; Chen, B. Using LMDI method to analyze the change of industrial CO2 emission from energy use in Chongqing. Front. Earth Sci. 2011, 5, 103–109. [Google Scholar] [CrossRef]
- Song, J. Factor Decomposition of Carbon Emissions from Energy Consumption of Shandong Province Based on LMDI. Res. Sci. 2012, 34, 35–41. [Google Scholar]
- Zhang, J.; Zhang, Y.; Yang, Z.; Fath, B.D.; Li, S. Estimation of energy-related carbon emissions in Beijing and factor decomposition analysis. Ecol. Model. 2013, 252, 258–265. [Google Scholar] [CrossRef]
- Wang, Z.; Zhao, L.; Mao, G.; Wu, B. Factor Decomposition Analysis of Energy-Related CO2 Emissions in Tianjin, China. Sustainability 2015, 7, 9973–9988. [Google Scholar] [CrossRef]
- Zhang, W.; Li, K.; Zhou, D.; Zhang, W.; Gao, H. Decomposition of intensity of energy-related CO2 emission in Chinese provinces using the LMDI method. Energy Policy 2016, 92, 369–381. [Google Scholar] [CrossRef]
- Zou, J.; Liu, W.; Tang, Z. Analysis of Factors Contributing to Changes in Energy Consumption in Tangshan City between 2007 and 2012. Sustainability 2017, 9, 452. [Google Scholar] [CrossRef]
- Choi, K.; Oh, W. Extended Divisia index decomposition of changes in energy intensity: A case of Korean manufacturing industry. Energy Policy 2014, 65, 275–283. [Google Scholar] [CrossRef]
- Zhang, M.; Li, H.; Zhou, M.; Mu, H. Decomposition analysis of energy consumption in Chinese transportation sector. Appl. Energy 2011, 88, 2279–2285. [Google Scholar] [CrossRef]
- Ying, H.; Ping, M.; Lu, L. A new decomposition method of influential factors on energy consumption intensity. J. Quant. Technol. Econ. 2010, 4, 137–147. [Google Scholar]
- Hoekstra, R.; Van den Bergh, J.C. Comparing structural decomposition analysis and index. Energy Econ. 2003, 25, 39–64. [Google Scholar] [CrossRef]
- Cansino, J.M.; Sánchez-Braza, A.; Rodríguez-Arévalo, M.L. Driving forces of Spain’s CO2 emissions: A LMDI decomposition approach. Renew. Sustain. Energy Rev. 2015, 48, 749–759. [Google Scholar] [CrossRef]
- Su, B.; Thomson, E. China’s carbon emissions embodied in (normal and processing) exports and their driving forces, 2006–2012. Energy Econ. 2016, 59, 414–422. [Google Scholar] [CrossRef]
- Liu, Z.; Geng, Y.; Lindner, S.; Zhao, H.; Fujita, T.; Guan, D. Embodied energy use in China’s industrial sectors. Energy Policy 2012, 49, 751–758. [Google Scholar] [CrossRef]
- Leontief, W. Environmental repercussions and the economic structure: An input-output approach. Rev. Econ. Stat. 1970, 52, 262–271. [Google Scholar] [CrossRef]
- Leontief, W.W. Quantitative input and output relations in the economic systems of the United States. Rev. Econ. Stat. 1936, 18, 105–125. [Google Scholar] [CrossRef]
- Ang, B.W. Decomposition analysis for policymaking in energy: which is the preferred method? Energy Policy 2004, 32, 1131–1139. [Google Scholar] [CrossRef]
- Ang, B.W. The LMDI approach to decomposition analysis: A practical guide. Energy Policy 2005, 33, 867–871. [Google Scholar] [CrossRef]
- Ang, B.W.; Liu, N. Handling zero values in the logarithmic mean Divisia index decomposition approach. Energy Policy 2007, 35, 238–246. [Google Scholar] [CrossRef]
- National Economic Accounting Department of National Bureau of Statistics. Chinese Regional Input-Output Tables 2007; China Statistical Publishing House: Beijing, China, 2011. (In Chinese)
- National Economic Accounting Department of National Bureau of Statistics. Chinese Regional Input-Output Tables 2012; China Statistical Publishing House: Beijing, China, 2016. (In Chinese)
- Bureau of Statistics of Guangdong. 2008 Guangdong Statistical Yearbook; China Statistical Publishing House: Beijing, China, 2008. (In Chinese)
- Bureau of Statistics of Guangdong. 2013 Guangdong Statistical Yearbook; China Statistical Publishing House: Beijing, China, 2013. (In Chinese)


| Sector Code | Sector Description |
|---|---|
| S1 | Agriculture |
| S2 | Coal mining |
| S3 | Oil and gas mining |
| S4 | Metal mining |
| S5 | Nonmetal mining |
| S6 | Tobacco, food, and beverages |
| S7 | Textiles |
| S8 | Wearing apparel, dressing, and fur dyeing |
| S9 | Wood and wood products |
| S10 | Paper and products for culture, education, and sports |
| S11 | Refined petroleum products, coking products, and nuclear fuel products |
| S12 | Chemicals and chemical products |
| S13 | Nonmetallic mineral products |
| S14 | Metal smelting and rolling |
| S15 | Manufacture of fabricated metal products |
| S16 | Common and special equipment |
| S17 | Transport equipment |
| S18 | Electrical machinery and apparatuses |
| S19 | Communications, computers, and other electronic equipment and apparatuses |
| S20 | Instruments, meters, and cultural and office machinery |
| S21 | Other industrial activities |
| S22 | Production and distribution of electricity and heat |
| S23 | Steam and water supply |
| S24 | Construction |
| S25 | Transportation, warehouse, and post |
| S26 | Wholesale, retail, accommodation, eating, and drinking services |
| S27 | Other service activities |
| Sector | Technical Effect (Δd) | Input Structural Effect (ΔC) | Export Structural Effect (Δs) | Export Scale Effect (Δy) | Total Energy Consumption Change |
|---|---|---|---|---|---|
| S1 | −0.06 | 0.00 | 0.08 | 0.04 | 0.06 |
| S2 | 0.00 | 0.00 | 0.00 | 0.00 | 0.00 |
| S3 | 0.00 | 0.00 | 0.02 | 0.00 | 0.02 |
| S4 | 0.00 | 0.00 | 0.00 | 0.00 | 0.00 |
| S5 | 0.02 | 0.00 | 0.03 | 0.02 | 0.08 |
| S6 | −0.44 | −0.05 | 0.35 | 0.38 | 0.23 |
| S7 | −0.78 | 0.29 | −4.85 | 2.52 | −2.82 |
| S8 | −2.79 | 0.82 | −2.48 | 2.62 | −1.82 |
| S9 | −1.15 | −0.24 | 0.55 | 1.11 | 0.26 |
| S10 | −2.81 | 0.20 | 15.44 | 5.69 | 18.52 |
| S11 | −7.22 | −2.00 | −0.53 | 2.08 | −7.67 |
| S12 | −3.00 | −0.07 | −6.09 | 3.52 | −5.65 |
| S13 | −3.44 | −0.51 | 2.46 | 4.13 | 2.63 |
| S14 | −9.56 | −1.63 | −20.26 | 5.29 | −26.16 |
| S15 | −1.43 | −0.19 | 0.12 | 1.08 | −0.42 |
| S16 | −6.07 | −0.16 | −2.74 | 2.36 | −6.61 |
| S17 | −0.33 | −0.17 | −0.46 | 0.42 | −0.55 |
| S18 | −8.45 | −1.43 | 0.34 | 3.98 | −5.56 |
| S19 | −18.88 | −4.95 | 4.50 | 9.44 | −9.89 |
| S20 | −1.36 | −0.80 | −5.98 | 1.21 | −6.94 |
| S21 | −0.17 | 0.13 | −2.35 | 0.32 | −2.07 |
| S22 | 0.01 | −0.26 | −0.10 | 0.18 | −0.17 |
| S23 | 0.00 | 0.00 | 0.00 | 0.00 | 0.00 |
| S24 | 0.00 | 0.00 | 0.42 | 0.00 | 0.43 |
| S25 | −4.88 | 0.09 | 1.68 | 3.39 | 0.28 |
| S26 | −1.41 | 0.17 | 1.77 | 1.05 | 1.59 |
| S27 | −0.41 | 0.04 | 1.66 | 0.43 | 1.73 |
| Sector | Technical Effect (Δd) | Input Structural Effect (ΔC) | Export Structural Effect (Δs) | Export Scale Effect (Δy) | Total Embodied Energy Consumption Change | Total Energy Consumption Embodied in Exports in 2007 (Mtce) |
|---|---|---|---|---|---|---|
| S1 | −50 | −3 | 70 | 34 | 51 | 0.11 |
| S2 | 0 | 0 | 0 | 0 | 0 | 0.00 |
| S3 | 0 | 0 | 0 | 0 | 0 | 0.00 |
| S4 | 49 | 3 | −37 | 34 | 48 | 0.01 |
| S5 | 59 | 2 | 84 | 50 | 195 | 0.04 |
| S6 | −35 | −4 | 27 | 30 | 18 | 1.26 |
| S7 | −7 | 3 | −45 | 24 | −26 | 10.67 |
| S8 | −27 | 8 | −24 | 25 | −17 | 10.49 |
| S9 | −29 | −6 | 14 | 28 | 7 | 3.91 |
| S10 | −22 | 2 | 121 | 44 | 145 | 12.80 |
| S11 | −60 | −17 | −4 | 17 | −64 | 12.06 |
| S12 | −19 | 0 | −38 | 22 | −36 | 15.83 |
| S13 | −25 | −4 | 18 | 30 | 19 | 13.74 |
| S14 | −27 | −5 | −58 | 15 | −74 | 35.21 |
| S15 | −34 | −5 | 3 | 26 | −10 | 4.16 |
| S16 | −49 | −1 | −22 | 19 | −54 | 12.30 |
| S17 | −19 | −10 | −25 | 23 | −30 | 1.81 |
| S18 | −48 | −8 | 2 | 23 | −32 | 17.45 |
| S19 | −48 | −13 | 11 | 24 | −25 | 39.56 |
| S20 | −16 | −9 | −68 | 14 | −79 | 8.75 |
| S21 | −7 | 5 | −94 | 13 | −83 | 2.50 |
| S22 | 1 | −34 | −13 | 24 | −22 | 0.76 |
| S23 | 0 | 0 | 0 | 0 | 0 | 0.00 |
| S24 | 0 | 0 | 0 | 0 | 0 | 0.00 |
| S25 | −40 | 1 | 14 | 28 | 2 | 12.21 |
| S26 | −45 | 6 | 57 | 34 | 51 | 3.09 |
| S27 | −48 | 5 | 195 | 50 | 203 | 0.85 |
© 2018 by the authors. Licensee MDPI, Basel, Switzerland. This article is an open access article distributed under the terms and conditions of the Creative Commons Attribution (CC BY) license (http://creativecommons.org/licenses/by/4.0/).
Share and Cite
Tang, Z.; Zou, J.; Wu, S. What Drove Changes in the Embodied Energy Consumption of Guangdong’s Exports from 2007–2012? Sustainability 2018, 10, 2755. https://doi.org/10.3390/su10082755
Tang Z, Zou J, Wu S. What Drove Changes in the Embodied Energy Consumption of Guangdong’s Exports from 2007–2012? Sustainability. 2018; 10(8):2755. https://doi.org/10.3390/su10082755
Chicago/Turabian StyleTang, Zhipeng, Jialing Zou, and Shuang Wu. 2018. "What Drove Changes in the Embodied Energy Consumption of Guangdong’s Exports from 2007–2012?" Sustainability 10, no. 8: 2755. https://doi.org/10.3390/su10082755
APA StyleTang, Z., Zou, J., & Wu, S. (2018). What Drove Changes in the Embodied Energy Consumption of Guangdong’s Exports from 2007–2012? Sustainability, 10(8), 2755. https://doi.org/10.3390/su10082755