Abstract
Sustainable urban freight management is a growing challenge for local authorities due to social pressures and increasingly more stringent environmental protection requirements. Freight and its adverse impacts, which include emissions and noise, considerably influence the urban environment. This calls for a reliable assessment of what can be done to improve urban freight and meet stakeholders’ requirements. While changes in a transport system can be simulated using models, urban freight models are quite rare compared to the tools available for analysing private and public transport. Therefore, this article looks at ways to extend Gdynia’s existing mesoscopic transport model by adding data from delivery surveys and examines the city’s capacity for reducing CO2 emissions through the designation of dedicated delivery places. The results suggest that extending the existing model by including freight-specific data can be justified when basic regulatory measures are to be used to improve freight transport. There are, however, serious limitations when an exact representation of the urban supply chain structure is needed, an element which is required for modelling advanced measures.
1. Introduction
Sustainable urban freight management is a serious challenge for decision-makers due to the increasingly more stringent environmental protection requirements. It involves being able to select the right solutions to reduce the adverse impact of freight activity on the environment and, most of all, to having a reliable quantitative evaluation of the results of the applied measures. This requires an analysis of how urban supply chains operate as a separate component of a city’s transport system and the ability to verify their impact on this system in accordance with the adopted criteria. Despite the considerable interest in sustainable urban mobility, there are issues with selecting solutions that improve freight transport from the point of view of its environmental parameters [1,2]—particularly in the development of analytical methods and in multiple practical measures.
For cities, there are many challenges resulting from the complex definition of a sustainable urban freight system. Also, they must ensure access to all types of freight transport while at the same time reducing emissions of air pollutants and noise and maintaining the economic efficiency of this type of business [3]. It is difficult to take all of these assumptions into account because of the system’s entity-related complexity [4], which is manifest in the simultaneous presence of many groups of participants and in the many ways transport activity is organised. In an urban environment, this results in a complex structure of relationships between the entities involved [5]. For example, in the public space, which is defined as an area of interest for city authorities, inhabitants and businesses, there are environmental issues associated with transport emissions. These complexities are also visible in the relationships between the city and the transport sector, often expressed in, for example, new environmental standards introduced for freight vehicles.
Despite the use of different analytical methods, it is clear that emission levels in freight transport are proportionately higher than its share of total transport activity in cities. It is estimated that, in Paris for example, freight emissions constitute 26% of CO2 emissions with regards to vehicle-km [6] and from 15% to 26% of CO2 emissions in Bordeaux, Dijon and Marseilles. In the same time, share of freight movements in vehicle-km in total transport was 13%, 13% and 19% respectively, [7]. In light of UK research, delivery vehicles (<3.5 t), which make up the majority of the fleet used in urban deliveries, are responsible for 14.5% of CO2 emissions while constituting only 6.6% of total miles travelled [8]. There are various scenarios for what total CO2 emissions will look like; they include, for example, technological changes or the structure of supply chains [9]. The entity-related complexity of urban freight transport is also accompanied by the presence of many possible instruments to influence this system [10,11]—which requires a qualitative assessment of possible results.
At the same time, cities have limited options for analysing the situation in practical terms and to respond to the need to limit transport emission levels. This pertains mainly to the analytical tools available to model transport, especially freight transport in cities and to the ability to provide them with the right inputs to include the environmental consequences of possible activities. To date, no universal freight transport modelling principles, which include the internal complexity of this phenomenon have been developed for cities. There are a number of models with various structures and levels of detail, most of which remain in the sphere of theoretical scientific analyses [12]. Among these, only a few are aimed at analysing the emission levels of CO2 and other substances [13] in detail.
Two issues must be considered when searching for ways to model urban freight with a focus on environmental impacts. First, is how functional the available models are. Second, can the real requirements of the city, which is the actual user of the models, be realistically met. This includes the experience of urban freight management, availability of urban freight data and the city’s transport policy and its goals. The earliest methods for tackling urban freight include classical four step models [14]. The main modelling unit is freight vehicle trips between origin and destination. Such models were first used in the 1970s [15,16] and by analogy to models of transport of people, these models estimate the number of trips generated by each zone, producing an O-D matrix [17]. The main data collection method was cordon line surveys. These surveys were specific to each city which limits their transferability and provides no information on the mode of how each trip is organised logistically. Another limitation of trip models is that they do not take into account the relation between trips of the same round and fail in the trip chain simulation [18] While models based on truck trips provide the basic functionality in terms of simulating the current scenario, they are not reliable when applied to forecasting [19]. As regards modelling of freight environmental impacts, these models come with a basic limitation. It is not possible to include in detail the factors that determine demand for freight. This includes how participants of a transport process influence its structure, e.g., by organising deliveries in a certain way. Even if a city has very limited requirements towards freight modelling, trip-based models are not a practical option.
To overcome problems with trip chain simulation, several models were developed [20,21]. Single trips can be combined into a tour using the savings function. This approach is implemented in the WIVER [22,23] software which was applied in several cities in Germany [18]. Despite their enhanced functionality this type of model has significant limitations as regards the practical requirements for implementation. Unlike simple cordon-line surveys they require extensive surveys of transport companies and logistics operators. Due to a fragmented private sector, this typically exceeds the capabilities of most local authorities. On the other hand, trip chain models can include a direct link between a receiver type and how a mode of transport is organised, which allows for better analysis of the environmental characteristics of the freight movements.
A prevalent approach in urban freight transport looks at the quantity of goods to be transported as the primary object of modelling. These models are known as commodity based [24,25,26,27]. They have a more complex structure and include three sub-models that give an estimate of vehicle O-D matrices. They are: the attraction model which provides commodity/quantity flows by each zone, the acquisition model which defines the zone from which the commodity flows originate and the quantity-to-vehicle model which converts commodity/quantity O-D and converts it into vehicles. While commodity based models are considered to be well evolved, few authors have proposed a complete modelling framework [19]. The transferability of selected models has been researched [28] but it has been proved that there are significant differences in the structure of goods distribution patterns making direct transfer of models difficult. These models provide more flexibility in terms of modelling environmental factors related to urban freight activity. It is because they directly link the type of receiver with the nature of generated transport activity, providing an opportunity to investigate how different measures may influence e.g., the utilisation level of different types of vehicles [29]. They also have high requirements in terms of data provision, including interviews with retailers and drivers and traffic counts of commercial and private vehicles [30]. These types of models use sophisticated mathematical methods to transfer commodity flows into vehicle flows, which increases their complexity and introduces another level of approximation.
In the last category of models under consideration, i.e., delivery-based models, a similar method of data provision is used. This approach focuses on deliveries which allows a direct link between generators and transport service providers. Movement of a vehicle may also be considered through road occupancy which ensures the measurability of modelling results and the possibility of merging them with other type of traffic flows [14,31]. The main example of this class of models is Freturb, developed in France [22,32]. It is the only functional urban freight transport model with a dedicated environmental assessment module available to local authorities [7]. However, this module cannot be used as a standalone solution as it is feeds on data from other modules of the Freturb model.
From the perspective of local authorities managing a city’s transportation system, there is a gap between model functionality and the environmental impact of urban freight. This is partly due to the inconsistency in how urban freight and passenger transport models are developed. Despite a large number of studies on urban freight simulation, the proposed approaches have not yet been fully validated and have often failed to provide the expected results [33]. At the same time, a number of cities have developed advanced passenger transport models that fulfil the need to manage this type of flow. Some cities have also surveyed urban freight activity in order to understand the underlying problems and develop local solutions [34,35], validate demand reduction measures such as consolidation centres [36], or to assess the environmental impact of inner city deliveries [37].
The identified gap may be addressed by an investigation into whether the urban transport models already in use can be populated with inputs specific for urban freight transport in order to improve their usability in analysing environmental impacts, especially CO2 emissions. Development of the classical four step models have resulted in a comprehensive solution that integrates different levels of detail in transport system analysis. They are supported by the availability of dedicated software which makes adaptation to the new challenges more feasible. The multi-layer structure of modern transport models developed in cities opens new areas of research on how urban freight transport could be included in transport planning practices with regards to specific issues such as emission reduction. It must be stressed that the intention is not to substitute dedicated urban freight models, but to provide local authorities with the possibility of addressing selected issues related to urban freight without setting up a complex freight modelling framework.
To achieve this goal, the main objective of this research was to assess the possibility of reducing CO2 emissions by introducing dedicated delivery places in downtown Gdynia based on data about the structure of deliveries in downtown Gdynia obtained during the URBACT Freight TAILS project. The source data were used to feed a mesoscopic transport model for the City of Gdynia developed within the CIVITAS DYN@MO project and to evaluate how the expected reduction in the inconvenience caused by freight vehicles stopping on the road can have a positive effect on traffic conditions in the analysed streets and on the related reduction in CO2 emissions.
2. Materials and Methods
2.1. Method Applied to Estimate Urban Emissions
The implementation of measures regarding an internally complex urban freight transport system requires an analysis of any possible effects that its individual constituents may have. An assessment of how the planned measures will influence the current condition of a transport system is meant to verify the possibility of sustainable urban development in economic, social and environmental terms [38].
An analysis of the emissions of air pollutants and green-house gases (GHG) is one of the most frequently used assessment indicators for urban transport sustainability [39]. From the point of view of assessing urban freight transport’s impact on the environment, choosing such indicators makes it possible to include its most important features and related negative impacts [40]. At the same time, it ensures that requirements for their most important features are met, including target relevance, validity, measurability and sensitivity [41]. Due to their high practical significance, a number of models used to evaluate urban traffic related emissions have been designed. They can be classified into the following categories: average speed models, traffic situation models, traffic variable models, cycle variable models and modal models [42].
Emissions of harmful pollution from road traffic are becoming an increasingly challenging problem for engineers, planners and politicians and, above all, for urban residents. Assessing emissions is also an extremely complicated process, both in terms of actual emissions (e.g., fluctuations between vehicles) and their final dissipation. According to [16] in order to estimate emission levels, emission models have to be combined with vehicle flow estimations, either macro- or microscopic, depending on the characteristics of the emission model. Transport models help to show the movement of persons and goods in the transport network in a designated area with specific socio-economic characteristics and land use [43,44]. Models provide a tool that helps to illustrate the behaviour of the urban transport system and its users over time. They take into account changes in supply and demand in transport, both current and those included in forecasts. In the second half of the last century, extensive research on mathematical modelling of trips and vehicle flows was carried out [45], developing a series of software packages that help to build transport system models for an area or a road and to forecast traffic.
Models may differ in the scope they cover. Gdynia has developed an integrated multi-level model (MST) based on the London model [46,47,48]. Gdynia chose a three-tier structure with macro, meso and microscopic layers. While the scale of cities varies considerably, the overall concept of developing and using models is similar. The actual method of modelling and the way of using different levels depends on the approach to a given transport issue. The multi-level model supports a flexible approach to the analytical process. Land use models and planning of public and private transport networks are dominated by macroscopic modelling. Where more detail is needed, meso and microscopic models are necessary because they help to simulate road traffic along with its profiles, platoon dispersion, averaged traffic parameters such as queues and delays, saturation flow, etc., (mesoscopic models) and behaviour and interactions between individual road users (microscopic models). The macro and mesoscopic approach makes it possible to estimate typical transport network indicators (total travel time of vehicles in the network, vehicle kilometres or passenger kilometres, average speed, traffic assignment in the network and traffic volumes resulting from the assignment). Microscopic traffic simulators aim to realistically emulate the flow of individual vehicles in the road network. They are capable of replicating complex dynamic traffic systems that are difficult or impossible to simulate using traditional mathematical models.
Thanks to its multi-level structure, the model in Gdynia supports strategic, tactical and operational analyses. Because the multi-level model is hierarchical, specific models can feed data to one another which ensures transparency of the outcomes, regardless of the level of modelling [49]. In the case of the analysis of the impact of delivery vehicles on the obstruction of the flow of vehicles in the road lanes and the impact of these limitations on the environment, a mesoscopic model was used. The tool used in the analysis was the SATURN tool package. The macroscopic model supported with the PTV VISUM software package was the basis for analysing changes in transport demand, modal split and modal shift of road users changing e.g., from a car to public transport as a result of improvements. The macroscopic model was also the basis for early analysis of traffic distribution and trips by public transport vehicles and by car. The trip matrices estimated in the macroscopic model form the basis for traffic distribution in the mesoscopic model (distribution adapted to the details of traffic organization).
The mesoscopic model helps to identify critical elements of the transport network, such as junction entry queues, including blocking back, which is blocking of previous intersections of streets by queues of vehicles. It also reflects the influence of traffic organization elements, such as types of intersections, the organization of traffic at intersections and traffic control, and takes into account queues at intersections or blocking back and the resulting delays. Analyses include the impact of changes or disturbances in the organization of traffic on the entire transport network or a selected area of the city (in the case of the analyses developed for the purpose of this paper, the downtown of Gdynia was selected). The multi-level transport model is applied on three levels which provides modelling options for various degrees of detail, currently mostly for private vehicles and public transport. The current structure of the model may be improved by providing additional data which makes analysis of freight traffic in Gdynia possible, taking into account operational factors of freight vehicles such as [50]:
- Delivery time and location availability (particularly in the city centre)
- Delivery access in terms of vehicle carriage capacity
- Indication of parking options for delivery vehicles in the city centre
- Option for permanent or temporary closing of specified street sections to traffic/parking of delivery vehicles
- Developing an information system for organisers of delivery traffic.
However, the analyses presented in the paper do not include complex freight transport modelling. They only look at the impact of delivery vehicles on traffic conditions and the accompanying increase in exhaust emissions on the basis of the selected indicators listed above.
In forecasting emissions, exogenous data influencing the dispersion of emissions such as meteorological data were not taken into account. The results presented in this article relate to data on quantitative emissions for vehicles in a transport network. The SATURN package contains internal procedures for the estimation and display of standard pollutants: carbon monoxide, carbon dioxide, hydrocarbons, nitrogen oxides. In the emission assessment procedure, a linear model for all types of pollutants with explanatory variables of cruise travel time on the link, time spent “idling” in queues at junctions, distance, number of primary and secondary stops per vehicle and vehicle volume was used. Emissions were calculated for each connection in the transport network and summed up for the whole city area and separately for the Gdynia city centre area. This example applies to “traffic variable” models in which emission factors are defined by traffic variables, such as average speed, traffic density or queue length. TEE model (Traffic Emissions and Energetics) [51] or the Matzoros model [52] are examples of this category. The results of the analyses are presented in Section 3.
2.2. Case Selection
The choice of dedicated delivery places as the subject of analysis was determined by a number of factors. They are one of the more common solutions used to facilitate the utilisation of urban transport infrastructure [53]. In combination with temporary regulations on the access to selected urban areas, they are often a city’s first step in managing freight transport. This was also the case in Gdynita, where delivery places were introduced as a result of freight movements being included for the first time in a strategic document known as the 2016–2025 Sustainable Urban Mobility Plan [54].
The evaluation of the environmental aspects of an urban freight transport system focuses on three main areas [55]; an economic evaluation, social assessments and environmental assessment. Environmental assessment is usually based on expressing distance by means of the emissions of selected substances, usually CO2, NOx, and Pm10, using direct emission models expressed as a function of vehicle type and its velocity [7,56,57,58]. There have also been attempts to assess emissions as a function of vehicle speed and acceleration using GPS data [59]. Therefore, reference to basic parameters of vehicle movement in a road network, such as speed, is confirmed in the research performed to date and in the capabilities of the available analytical instruments.
An incorrectly designed delivery place location may have an adverse effect on traffic structure and on the safety of users, including pedestrians [60,61]. Therefore, there have been attempts to provide methods for designating delivery areas to better utilise their potential as a constituent of an urban transport system [62,63,64]. However, their applicability is limited by the local context of available data and by the use of specific modelling techniques which may be difficult to duplicate in other cities. An introduction of advanced systems to increase the utilisation efficiency of delivery areas by their users has also been considered. They include delivery area booking systems [65,66] which make use of information technologies and mobile communication devices. These provide potentially significant options for increasing the operational efficiency of transport, also in the context of reducing total transport and the related CO2 emissions. The influence of deliveries made directly on the roadway, without the application of delivery areas, on traffic parameters has also been studied [67].
Therefore, for many cities, an analysis of how dedicated delivery places operate may be the first stage in competence building for active freight transport management. Efforts should be made to find ways to include this matter in the practice of urban transport system planning, using extended available solutions to include aspects specific to freight transport.
2.3. Delivery Survey in Gdynia
A study of the delivery structure in Gdynia was performed in Q2, 2017 and included three downtown streets (Starowiejska, Świętojańska and Abrahama). In this way, the analysis covered Gdynia’s most important high streets. The study was performed by means of a direct business survey and a day-long visual observation of freight vehicles activity. A previous French study was adapted to identify the principles for the study and to select the dedicated delivery areas [68]. In the area under analysis, 506 active businesses were identified on the ground floor of buildings. In total, 12 categories of receivers were used in the survey: services, convenient goods and groceries—independent retailer, convenient goods and groceries—chain retailer, clothing, restaurants and bars, hotels, electronic appliances, decoration and furniture, pharmacies, banks and financial services, other retailers and services, and public services. This classification reflects the retail and service character of the area under analysis. The survey had 337 participating businesses, which constituted 66% of the total number. Therefore, it is possible to reliably generalise the results for the whole area under consideration. The structure of the survey and its key results are presented in Table 1.

Table 1.
Overview of the delivery survey in Gdynia.
Receiver surveys made it possible to collect key information to characterise freight movements [69] in the area under analysis, especially because it was the first study dedicated to this subject in Gdynia. They were modelled on the French experience with the Freturb model. Due to the method of use (designation of dedicated delivery areas), they did not cover delivery driver behaviours included therein [70]. Despite certain limitations [71,72], sometimes resulting from low interest in the transport-related aspect of delivery organisation on the part of receivers, the surveys have significant potential as a component of a data collection and processing system, for the purposes of urban freight transport planning [71].
Based on the collected information, a recommended number of delivery places was calculated for the three streets under analysis. Their planned distribution and number were identified in consultation with the businesses in each street. The final number of physically feasible spaces was limited by infrastructure-related factors and by the availability of general-use parking spaces. Therefore, the aim of the consultations was to identify a location where deliveries could be made using an internal courtyard or access from parallel streets. In this way, the initial number of 49 recommended delivery areas was reduced to 29, out of which 11 were selected for pilot implementation. This was preceded by extensive consultation with the Municipal Police to establish practical enforcement rules. As local and national traffic regulations do not refer directly to delivery spaces, a mix of existing regulations regarding public parking spaces, parking time limits and respective signage and markings has been adopted. Moreover, the Municipal Police suggested the use of CCTV cameras at selected spots to monitor delivery spaces. In further analysis, the pilot project (11 areas) is treated as Variant 1 (V1), while the 29 target areas are treated as Variant 2 (V2).
3. Results
The application of MST on a larger scale as part of the SUMP (Sustainable Urban Mobility Planning) process was carried out in Gdynia, which was the first city in Poland to develop and implement a multi-level model for the needs of the SUMP process.
The model covers all of Gdynia which is divided into 173 transport zones. Each is described with trip-generating variables such as, population, jobs, places of education, size of buildings divided by function and others. Gdynia’s street network is represented in its entirety with links categorised based on technical class, cross-section, capacity and free-flow speed. The whole transport network is made up of more than 5500 links and more than 2100 nodes. To calculate the demand for trips and residents’ transport behaviour in the 4-step model, functions were used that were calibrated on the basis of comprehensive traffic surveys conducted in the city of Gdańsk in 2009, and a 2013 survey of resident preferences and transport behaviour.
The macroscopic model is the basis for analysing changes in transport demand (new land use rules, new socio-economic and demographic data), modal split and modal shift with road users changing between public transport and the car users, O-D matrices as a result of changes in traffic organisation and control or other measures including development of transport network. The macroscopic model is also the basis for early analysis of traffic distribution and trips by public transport and car users. Four classes of car users have been considered: passenger cars, vans, heavy vehicles without trailers and heavy vehicles with trailers. O-D trip matrices calculated in the macroscopic model are the basis for traffic distribution in the mesoscopic model, where distribution is adjusted for details of traffic organisation.
The mesoscopic model helps to identify the critical elements of the transport network such as junction entry queues including blocking back (blocking of previous intersections of streets by queues of vehicles). It also helps to analyse ways to improve traffic efficiency, such as lanes at junction entry, corrections to signalization programmes, use of different junction types, adding traffic signals, etc., which may improve traffic conditions. The analyses look at the effects a measure has on the city’s entire transport network.
For the assignment of traffic in a street network a stochastic method of load balancing (Stochastic User Equilibrium Assignment) was used, which includes the dependence of travel time on the size of the traffic flow. Iterative algorithms have been applied here. In this method, total traffic flow on the “source-to-target” is divided among a number of routes. The basic assumption of this method is that traffic arranges itself on congested networks such that the routes chosen by individual drivers are those with the minimum perceived cost; routes with perceived costs in excess of the minima are not used. A stochastic model is set up by assuming that the cost (travel time have been considered as the cost of trip) as defined by the model is the average cost but that there is a distribution about the average as perceived by individuals. The perceived cost of a route may therefore be simulated by selecting a cost at random from the perceived distribution of costs on each link. Algorithms designed to reflect the resulting flows are referred to as Burrell assignment models. This is how key network performance indicators can be obtained.
The model has been calibrated taking into account the stationary configuration of flows (traffic volumes on individual sections of streets and at junctions for turning flows for the state of the network without delivery vehicles blocking traffic lanes). Values of the parameters for the choice of link cost distributions (KOB and SUET), cumulative density function (KOB) and the generation of random numbers (KORN for initial seed value) were applied to calibrate the modelled flow to observed flow. The normal distribution of link cost has been chosen with a value of KOB = 2 and value of SUET = 0.2 with KORN = 1 for random numbers.
Models were validated with the use of a control group of traffic volume values (volumes from a random typical day for the period of morning and afternoon peak hours without delivery vehicles blocking traffic lanes). A regression analysis and correlation between the values of traffic volumes (modelled and observed) were developed. It has been estimated that a strong linear correlation should occur between this value with the angular coefficient of the regression function which equals 1.00, and the free expression of the function equal to 0.00. The calculations for the measurement points (individual street sections and turns at intersections) found that for the model, the coefficient of determination R2 (for the function Y = X) accepted values range from 0.78 (peak morning) to 0.83 (peak afternoon). Due to the large number of field measurements of volume used in the model of the city, it turned out to be extremely difficult to calibrate the model to achieve a satisfactory convergence of all measuring points. However, the results indicate that in this example about 85% of the volume is explained by the model. For each of the models statistical analyses were also performed, allowing a more accurate comparison of the measured intensity values obtained from the model. For this purpose, an analytical method was used, which is a form of statistics χ2 (GEH) that takes into account both the relative and absolute error. The results of the analyses of statistics for GEH, which analyses the model of the network of Gdynia, are presented in Table 2 for the afternoon peak hour.
Table 2.
Statistical results of compliance of the volumes observed and obtained from the city model for the afternoon rush hour.
Based on the delivery survey described in Section 2.3, analyses were performed using the mesoscopic model described in Section 2.1 and in this section. Simulations were carried out for three variants of designating dedicated delivery places on Starowiejska and Świętojańska Streets, as shown in Figure 1. Variant 0 (V0—base variant) represents the current situation, in which delivery vehicles randomly block traffic lanes in places identified in delivery surveys. The pilot project (11 areas) will be treated as Variant 1 (V1), while the 29 areas represent a full-scale implementation as Variant 2 (V2). When street lanes are blocked by delivery vehicles, traffic is disrupted by periodic and random queues of vehicles at the delivery points, increase in the number of vehicle stops, change of route, and dangerous manoeuvres of vehicles. This contributes to an increase in exhaust emissions. The implementation of dedicated delivery places in locations that do not block traffic lanes have been included in Variant 1 (with fewer delivery points) and Variant 2 (greater range of improvements), respectively. Analyses using the mesoscopic model were carried out for the morning and afternoon peak hours, for a one-hour period during each peak.
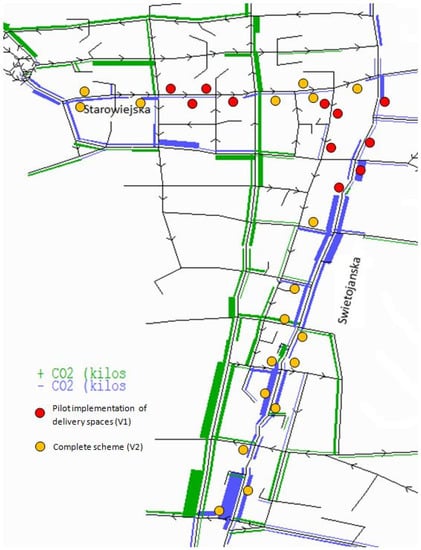
Figure 1.
Change in CO2 emissions in variant 2 compared to the baseline in Gdynia centre.
In the base variant, lanes are simultaneously blocked in 4–5 places identified in the surveys of Gdynia centre (Starowiejska and Świętojańska Streets); this lasts for 15 min in the afternoon peak hour and 15 min in the morning peak hour in 1–2 places simultaneously within 15 min period. The modelling includes places that effectively contribute to the development of traffic disruptions. Within an hour, the total time of blocking the lane in various places is 60 min in the morning peak hour and 180 min in the afternoon peak hour. Throughout the day, the scale of blocking lanes is much greater but traffic disruptions are not as severe as in peak hours because there is less traffic. The survey results indicate that if the proposed measures are implemented, dedicated delivery locations will help to reduce the time of blocking lanes by 40% in Variant 1 and by 100% in Variant 2.
The size of the traffic disruptions depends on the place of blocking the lane in the road network. In the modelling process of the base variant, the existing situation was accurately mapped for temporary location of delivery vehicles blocking traffic lanes. Delivery vehicles may block the lane in two ways. In the first case, the lane is fully closed, without the possibility of bypassing the delivery vehicle blocking the lane. In this case, it was assumed that there is no possibility of passing during the blocking of the lane and the capacity of the street section is reduced to 0 vehicles during 15 min period of simulation. Other vehicles change their route as a result of closing the street section. In the second case, it is possible to bypass the delivery vehicle by using the traffic lane in the opposite direction (the capacity is dependent on the traffic volume and speed in the opposite direction, which determines the possibility of bypassing the delivery vehicle blocking the lane). The observations carried out in the field study showed that at a rate of 300–500 vehicles/hour on the opposite direction lane the capacity of the blocked lane is equal to 10–15 vehicles/15 min. The model assumed a capacity of 15 vehicles/15 min (omitting the delivery vehicle in traffic gaps from the opposite direction). The mesoscopic approach does not take into account the delays of vehicles from the opposite direction that let vehicles move to bypass the delivery vehicle, which is a simplification and affects the accuracy of the results. While the simulation element in SATURN does not exactly model the exact progression of each vehicle when they move down the link, it is possible to deduce certain properties of their progression. The distinction between the two forms of stop (primary and secondary) is essentially as follows. Imagine a small arm at the intersection with the “stop” sign at the end. Every vehicle approaching this intersection must come to a complete stand still either at the stop line (if there is no queue) or behind the last vehicle in the queue; this is a primary stop. If there is a queue and vehicles leave from the beginning of the queue, the vehicles go forward, accelerating and then slowing down to a stationary position; these are secondary stops. This two-way split does not exactly represent all possible vehicle movements in a queue but it is probably sufficient for estimating secondary parameters such as fuel consumption or emissions and for providing a very broad description of the state of a junction or any other place in the street network (e.g., a bottleneck). The rules for estimating primary and secondary stops are, like their definitions, somewhat arbitrary (mesoscopic approach). Thus, for minor arms at priority junctions all arriving traffic must make a primary stop if its turn is over capacity or if the queue per lane is greater than 2 vehicles. If the queue per lane is (in the limit) zero the probability of a primary stop is equal to the calculated probability of there being no gap. For queues per lane of between 0 and 2 vehicles, a linear relationship is assumed. Secondary stops are calculated by assuming that all primary stops make a further number of secondary stops equal to the queue length per lane divided by the number of vehicles that can depart from the stop line in a platoon once a gap occurs (assumed equal to one over the probability of a gap). For major priority arms, secondary stops are ignored and a primary stop only occurs if the arm is over capacity or if, at the moment of arrival, the expected queue length per lane is greater than 1 vehicle.
In order to obtain more reliable results in the process of stochastic traffic assignment in the network, a quasi-dynamic model was used in which over-capacity queues are passed between time periods. Thus, the model takes into account the dynamics of changes in blocking lanes in particular places (15 min periods were assumed) and traffic parameters changes spread over time periods. Sample calculations of some indicator values at 15 min intervals for the afternoon peak hour are shown in Figure 2.
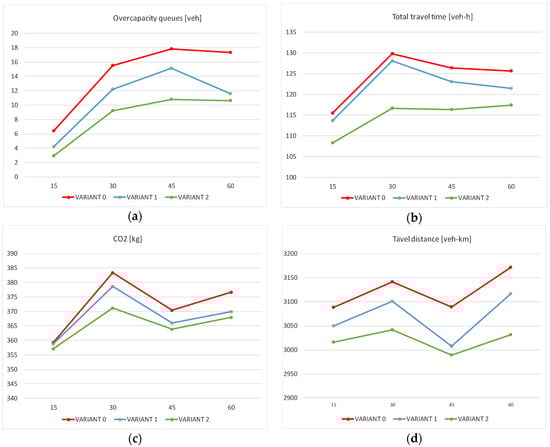
Figure 2.
Selected indicator values for afternoon peak hour in the area of Gdynia centre. (a) overcapacity queues; (b) total travel time; (c) CO2 emission; (d) travel distance (veh-km travelled).
Fluctuations of indicators observed in particular 15-min periods are a result of a different number of blocked lanes in these periods and their different location. In the case of lanes blocked along Świętojańska Street we can observe a greater deterioration of transport network indicators because of higher traffic volumes than along Starowiejska Street. In some more congested periods, drivers change their route by selecting nearby alternative routes, which contributes to an increase in distance travelled by vehicles and results in improved traffic conditions in the road network of the city centre (reduction in dynamics of growth of queue lengths, delays, travel time). The most stable traffic conditions can be observed in the case of implementing Variant 2 improvements (no cases of blocking traffic lanes by commercial vehicles).
The value of carbon dioxide depends on the travel time of all vehicles in the road network taking into account time spent in queues at junctions, travelled distance, number of primary and secondary stops per vehicle and vehicle volume at particular sections of network. If the above parameters deteriorate, there is an increase in exhaust emissions and fuel consumption. Examples of cumulative values of some indicators for a one-hour period are presented in Table 3. The equations for calculating emissions and default parameter values for the pollutants are presented below. The model still requires calibration according to the structure of the vehicle fleet in Gdynia. Therefore, the results are estimates, but prove the practical potential of the selected approach with regards to emission estimation.
Table 3.
Example of simulation results from the mesoscopic model for variants of dedicated delivery spots—effect for the area of the city centre, morning and afternoon peak hour.
The basic equation for the emission of CO2 (EiCO2) from a link is:
- EiCO2—emission of CO2 at link i
- d—link distance
- tq—time spent idling in queues at junctions
- s1—number of primary stops per vehicle
- s2—number of secondary stops per vehicle
- V—vehicle volume at link i
The basic equation for the emission of NOx(EiNOx) from a link is:
- EiNOx—emission of NOx at link i
- tc—average cruise travel time on the link
- tq—time spent idling in queues at junctions
- s1—number of primary stops per vehicle
- s2—number of secondary stops per vehicle
- V—vehicle volume at link i
More vehicles in the network and higher traffic volumes occur during the afternoon peak hour than during the morning peak. The effects of planned changes are more visible for the period in which the transport network is more congested. Analyses have shown a positive effect with exhaust emissions reduced both in the morning and afternoon peak periods, primarily in the case of Variant 2. Taking into account that only two peak hours were analysed, accumulated gains in the long term could be significant.
Figure 1 shows changes in CO2 emissions in individual sections of the transport system network in the centre of Gdynia. If implemented, the delivery vehicle scheme with dedicated parking spaces will contribute to reducing emissions primarily on the streets covered by the project.
4. Discussion
The aim of this paper was to verify whether the mesoscopic urban transport model already in use in Gdynia can be populated with inputs specific to urban freight transport in order to improve the ability to assess the environmental impact of freight transport. The analysis was executed by feeding the model with delivery data from downtown Gdynia’s to assess whether dedicated delivery areas could be a way to reduce CO2 emissions there. The objective was to evaluate how the expected reduction in the inconvenience caused by freight vehicles stopping on the road can have a positive effect on traffic conditions in the analysed streets and on the related reduction in CO2 emissions.
The transport model proved to be useful in understanding the issue of dedicated delivery places. It was able to capture changes in CO2 and NOx emissions. Dedicated delivery places were implemented primarily for their effect on access to selected downtown streets and the nuisance caused by delivery vehicles when they stop, e.g., on the pavement. If, however, they can also help to reduce emissions, the scheme can be rolled out in as a comprehensive measure in all of the downtown area. As a result, the benefits would can be more evident.
In studying dedicated delivery places, use was made of the model’s capacity to represent road traffic parameters and the potential effects on traffic in the area under analysis. Delivery places are a relatively simple regulatory solution which local authorities can use as a point of departure to more advanced urban freight management measures. Whether it is this scheme or other regulatory tools, such as time windows for accessing selected areas, standard transport models developed with a sufficient level of detail are able to assess the effects of measures being proposed with an acceptable level of detail.
If the effects on urban freight-related emissions are to be substantial, more needs to be done. Rather than focus on infrastructure only, the measures must be related to the structure of supply chains in urban areas. To that end, the structure of the model must account for a much broader scope of parameters to identify freight vehicle activity and the characteristics of demand for delivery and the variety of receivers using the service. They would meet the analytical complexity requirements of available urban freight optimisation solutions. Due to these challenges, the transport model used in this analysis has a major functionality deficit when compared to dedicated freight transport models such as France’s Freturb [14,31] and Germany’s Viver [22,23], as presented in Table 4.
Table 4.
Comparison of selected transport models’ functionality for urban freight analysis.
As it can be noticed, even comprehensive models designed to analyse freight offer varying functionalities which translates into how well we can study the effects of selected solutions on emission levels. While the existing models based on a four-stage approach could theoretically be extended to cover the specificity of a study problem, the costs and workload of doing that remain an issue. In addition, it is likely that modified models will be difficult to calibrate due to lack of data which the majority of cities do not collect as a standard transport management practice. Regardless of the approach, the process of introducing a model is anything but simple because of the complexity and scarcity of established practices to use as a point of reference.
While the development of more comprehensive freight transport models based on data obtained from carriers is justified, it is extremely difficult due to the reluctance of carriers to share information. Reliable statistics on shipments create the opportunity to develop better quality models for freight transport demand, and on this basis, to estimate the trip matrix of freight vehicles (this approach is justified in modelling heavy traffic—through freight traffic, industry and sea port activities), when shipment dynamics are difficult to research (although this depends on the frequency of data provided by carriers, industry and seaport operators). The implementation of a reliable model also requires a regular and comprehensive study of traffic, including heavy goods vehicles and businesses (the present legislation does not make such studies mandatory, and the high costs discourage cities from conducting them). Such research should be carried out every 5 years and would provide valuable input and validation data for freight transport models. In the case of commercial distribution, commercial services, e-commerce and express courier municipal services (waste disposal/maintenance of roads) it is important to apply the approach based on cruise route modelling (rounds/travel chains). This allows the model to include fixed routes.
The next steps will focus on verifying whether the existing transport model could meet the requirements of urban freight management set by the Sustainable Urban Mobility Plan in Gdynia. This would include detailed parametrisation of the objectives to identify the data requirements for their analysis and how they could be met by the existing modelling framework. Also the most promising areas of MST implementation would be marked, as well as demand for additional data. Also, the relation between policy objectives and potential measures will be under investigation in terms of the model functionality to find the limits of the existing model application. These limits in terms of the relation between required inputs and possible outcomes frame the potential of MST for urban freight modelling and define where the implementation of dedicated urban freight model should begin. Another issue which should be considered is how to utilise existing systems such as Weigh-in-Motion [73] to improve data availability.
Understanding urban freight should be a consistent and gradual process and one that must be conducted in order to identify the scale of the challenges and equip decision-makers with the knowledge they need for planning. Even if no decisions are taken to introduce advanced analytical tools, the search for the right solutions can still continue so that they match the available resources and for private sector partner engagement.
Author Contributions
D.K. designed the methodology of the presented paper and its conceptualisation, conducted all calculations regarding delivery structure in the downtown of Gdynia and elaborated the number of dedicated delivery bays and their location. J.O. fine-tuned the modelling methodology and conducted all necessary calculation and visualisation of the transport model, as well as analysed results. D.K. wrote Section 1, Section 2.2 and Section 2.3 and co-authored the conclusions. J.O. wrote Section 2.1 and Section 3 and co-authored the conclusions.
Funding
This research received no external funding.
Acknowledgments
The study is based on the results of the URBACT Freight TAILS project implemented from 2016 to 2018. The transport model developed within the CIVTAS DYN@AMO project implemented under CIVITAS II PLUS was also used for traffic modelling purposes. No funding was obtained in the project to cover the costs of Open Access publication.
Conflicts of Interest
The authors declare no conflict of interest. The founding sponsors had no role in the design of the study; in the collection, analyses, or interpretation of data; in the writing of the manuscript, and in the decision to publish the results.
References
- Wefering, F.; Rupprecht, S.; Bührmann, S.; Böhler-Baedeker, S. Guidelines. Developing and Implementing a Sustainable Urban Mobility Plan; Rupprecht Consult: Köln, Germany, 2014. [Google Scholar]
- Hickman, R.; Hall, P.; Banister, D. Planning more for sustainable mobility. J. Transp. Geogr. 2013, 33, 210–219. [Google Scholar] [CrossRef]
- Behrends, S.; Lindholm, M.; Woxenius, J. The Impact of Urban Freight Transport: A Definition of Sustainability from an Actor’s Perspective. Transp. Plan. Technol. 2008, 31, 693–713. [Google Scholar] [CrossRef]
- Dablanc, L. Goods transport in large European cities: Difficult to organize, difficult to modernize. Transp. Res. Part A Policy Pract. 2007, 41, 280–285. [Google Scholar] [CrossRef]
- Macharis, C.; Verlinde, S. Sharing Urban Space: A story of Stakeholder Support. In Urban Freight for Livable Cities. How to Deal with Collaboration and Trade-Offs; Wolmar, C., Ed.; The Volvo Research and Educational Foundations, VREF: Nairobi, Kenya, 2012. [Google Scholar]
- Dablanc, L.; Lozano, A. Commercial Goods Transport in Paris; United Nations Habitat: Nairobi, Kenya, 2013. [Google Scholar]
- Segalou, E.; Ambrosini, C.; Routhier, J.-L. The environmental assessment of urban goods movement. In Logistics Systems for Sustainable Cities; Emerald Group Publishing Limited: Beck Lane, UK, 2004; pp. 15–207. [Google Scholar]
- Mckinnon, A. CO2 Emissions from Freight Transport: An Analysis of UK Data. In Logistic Research Network 2007; The Chartered Institute of Logistics and Transport: Corby, UK, 2007. [Google Scholar]
- Piecyk, M.I.; McKinnon, A.C. Forecasting the carbon footprint of road freight transport in 2020. Int. J. Prod. Econ. 2010, 128, 31–42. [Google Scholar] [CrossRef]
- Russo, F.; Comi, A. A classification of city logistics measures and connected impacts. Procedia Soc. Behav. Sci. 2010, 2, 6355–6365. [Google Scholar] [CrossRef]
- Allen, J.; Anderson, S.; Browne, M.; Jones, P. A Framework for Considering Policies to Encourage Sustainable Urban Freight Traffic and Goods/Service Flows. Report 1; University of Westminster: London, UK, 2000. [Google Scholar]
- Comi, A.; Donnelly, R.; Russo, F. Urban Freight Models; Elsevier Inc.: New York, NY, USA, 2013. [Google Scholar]
- Anand, N.; van Duin, R.; Quak, H.; Tavasszy, L. Relevance of City Logistics Modelling Efforts: A Review. Transp. Rev. 2015, 35, 701–719. [Google Scholar] [CrossRef]
- Bonnafous, A.; Gonzalez-Feliu, J.; Routhier, J.-L. An alternative UGM paradigm to O-D matrices: The Freturb model. In Proceedings of the 13th World Conference on Transport Research (13th WCTR), Rio de Janeiro, Brazil, 15–18 July 2013. [Google Scholar]
- Slavin, H. Demand for urban goods vehicle trips. Transp. Res. Rec. 1976, 591, 32–37. [Google Scholar]
- Ogden, K.W. Modelling Urban Freight Generation; Traffic Engineering Control; Hemming Group, Limited: London, UK, 1977; Volume 18. [Google Scholar]
- Gentile, G.; Vigo, D. Movement generation and trip distribution for freight demand modelling applied to city logistics. Eur. Transp. Trasp. Eur. 2013, 54, 1–27. [Google Scholar]
- Gonzalez-Feliu, J.; Routhier, J.-L. Modeling Urban Goods Movement: How to be Oriented with so Many Approaches? Procedia Soc. Behav. Sci. 2012, 39, 89–100. [Google Scholar] [CrossRef]
- Comi, A.; Site, P.D.; Filippi, F.; Nuzzolo, A. Urban freight transport demand modelling: A state of the art. Eur. Transp. Trasp. Eur. 2012, 51, 1–17. [Google Scholar]
- Sonntag, H. A computer model of urban commercial traffic—Analysis, basic concept and application. Transp. Policy Decis. Mak. 1985, 3, 171–180. [Google Scholar]
- Janssen, T.; Vollmer, R. Development of a urban commercial transport model for smaller areas. In Proceedings of the German Society for Geography Annual Meeting, Berlin, Germany, 2005. [Google Scholar]
- Ambrosini, C.; Meimbresse, B.; Routhier, J.-L.; Sonntag, H. Urban freight policy-oriented modelling in Europe. Innov. City Logist. 2008, 2, 197–201. [Google Scholar]
- Sonntag, H.; Meimbresse, B. Modelling urban commercial traffic with model WIVER. In L’intégration Des Marchandises Dans le Système Des Déplacements Urbains; Patier, D., Ed.; Laboratoire d’Economie des Transports: Lyon, France, 2001; pp. 93–106. [Google Scholar]
- Boerkamps, J.; van Binsbergen, A. GoodTrip—A new approach for modelling and evaluation of urban goods distribution. In City Logistics I; Taniguchi, E., Thompson, R.G., Eds.; Institute for City Logistics: Kyoto, Japan, 1999; pp. 175–196. [Google Scholar]
- Wisetjindawat, W.; Kazushi, S.; Matsumoto, S. Supply chain simulation for modeling the interactions in freight movement. J. East. Asia Soc. Transp. Stud. 2005, 6, 2991–3004. [Google Scholar]
- Wisetjindawat, W.; Sano, K. A Behavioral Modeling in Micro-Simulation for Urban. J. East. Asia Soc. Transp. Stud. 2003, 5, 2193–2208. [Google Scholar]
- Russo, F.; Comi, A. A model system for the ex-ante assessment of city logistics measures. Res. Transp. Econ. 2011, 31, 81–87. [Google Scholar] [CrossRef]
- Ibeas, A.; Moura, J.L.; Nuzzolo, A.; Comi, A. Urban Freight Transport Demand: Transferability of Survey Results Analysis and Models. Procedia Soc. Behav. Sci. 2012, 54, 1068–1079. [Google Scholar] [CrossRef]
- Russo, F.; Comi, A. Urban freight transport planning towards green goals: Synthetic environmental evidence from tested results. Sustainability 2016, 8, 381. [Google Scholar] [CrossRef]
- Nuzzolo, A.; Comi, A. Urban freight transport policies in Rome: lessons learned and the road ahead. J. Urban. Int. Res. Placemak. Urban Sustain. 2014, 8, 1–15. [Google Scholar] [CrossRef]
- Routhier, J.; Toilier, F. FRETURB V3, A Policy Oriented Software of Modelling Urban Goods Movement. In Proceedings of the 11th Word Conference on Transport Research, Berkeley, CA, USA, 24–28 June 2007; p. 23. [Google Scholar]
- Toilier, F.; Alligier, L.; Patier, D.; Routhier, J. Vers un Modèle global de la Simulation de la Logistique Urbaine: FRETURB; Version 2 Rapport Final; Laboratoire d’ Economie des Transport: Lyon, France, 2005. [Google Scholar]
- Nuzzolo, A.; Coppola, P.; Comi, A. Freight Transport Modeling: Review and Future Challenges. Int. J. Transp. Econ. 2013, 40, 183–206. [Google Scholar]
- Cherrett, T.; Allen, J.; McLeod, F.; Maynard, S.; Hickford, A.; Browne, M. Understanding urban freight activity—Key issues for freight planning. J. Transp. Geogr. 2012, 24, 22–32. [Google Scholar] [CrossRef]
- Browne, M.; Allen, J.; Steele, S.; Cherrett, T.; McLeod, F. Analysing the results of UK urban freight studies. Procedia Soc. Behav. Sci. 2010, 2, 5956–5966. [Google Scholar] [CrossRef]
- City Ports. City Ports Project Interim Report; City Ports: Bologna, Italy, 2005. [Google Scholar]
- Kijewska, K.; Iwan, S. Analysis of the Functioning of Urban Deliveries in the City Centre and Its Environmental Impact Based on Szczecin Example. Transp. Res. Procedia 2016, 2015, 739–749. [Google Scholar] [CrossRef]
- Muñuzuri, J.; Cortés, P.; Onieva, L.; Guadix, J. Application of supply chain considerations to estimate urban freight emissions. Ecol. Indic. 2018, 86, 35–44. [Google Scholar] [CrossRef]
- Haghshenas, H.; Vaziri, M. Urban sustainable transportation indicators for global comparison. Ecol. Indic. 2012, 15, 115–121. [Google Scholar] [CrossRef]
- Browne, M.; Allen, J.; Nemoto, T.; Patier, D.; Visser, J. Reducing Social and Environmental Impacts of Urban Freight Transport: A Review of Some Major Cities. Procedia Soc. Behav. Sci. 2012, 39, 19–33. [Google Scholar] [CrossRef]
- Joumard, R.; Gudmundsson, H.; Folkeson, L. Framework for Assessing Indicators of Environmental Impacts in the Transport Sector. Transp. Res. Rec. J. Transp. Res. Board 2011, 2242, 55–63. [Google Scholar] [CrossRef]
- Smit, R.; Ntziachristos, L.; Boulter, P. Validation of road vehicle and traffic emission models—A review and meta-analysis. Atmos. Environ. 2010, 44, 2943–2953. [Google Scholar] [CrossRef]
- The Use of Transport Models in Transport Planning and Project Appraisal, JASPERS Appraisal Guidance (Transport). Available online: http://kc-sump.eu/wordpress/wp-content/uploads/2015/04/Upotreba-Modela-u-prometnom-planiranju_JASPERS_kolovoz-2014.pdf (accessed on 7 April 2018).
- Sivakumar, A. Modelling Transport: A Synthesis of Transport Modelling Methodologies; Imperial College: London, UK, 2007. [Google Scholar]
- Travel Model Improvement Program—TMIP. Model Validation and Reasonableness Checking Manual; Federal Highway Administration: Washingdon, DC, USA, 1997.
- Smith, J.; Blewitt, R. Traffic Modelling Guidelines TfL Traffic Manager and Network Performance Best Practice; Transport for London: London, UK, 2010.
- Dimitriou, H.; Thompson, R. Strategic Planning for Regional Development in the UK; Routledge: Abingdon-on, UK, 2008. [Google Scholar]
- Bliemer, C.J.; Mulley, C.; Moutou, C. Handbook on Transport and Urban Planning in the Developed World; Edward Elgar Publishing: Cheltenham, UK, 2016. [Google Scholar]
- Okraszewska, R.; Romanowska, A.; Wołek, M.; Oskarbski, J.; Birr, K.; Jamroz, K. Integration of a Multilevel Transport System Model into Sustainable Urban Mobility Planning. Sustainability 2018, 10, 479. [Google Scholar] [CrossRef]
- Oskarbski, J.; Kaszubowski, D. Potential for ITS/ICT Solutions in Urban Freight Management. Transp. Res. Procedia 2016, 16, 433–448. [Google Scholar] [CrossRef]
- Negrenti, E. TEE: The ENEA traffic emissions and energetics model micro-scale applications. Sci. Total Environ. 1996, 189–190, 167–174. [Google Scholar] [CrossRef]
- Matzoros, A.; van Vliet, D. A model of air pollution from road traffic, based on the characteristics of interrupted flow and junction control: Part I—Model description. Transp. Res. Part A Policy Pract. 1992, 26, 315–330. [Google Scholar] [CrossRef]
- Muñuzuri, J.; Larrañeta, J.; Onieva, L.; Cortés, P. Solutions applicable by local administrations for urban logistics improvement. Cities 2005, 22, 15–28. [Google Scholar] [CrossRef]
- Kaszubowski, D. Recommendations for Urban Freight Policy Development in Gdynia. Transp. Res. Procedia 2016, 12, 886–899. [Google Scholar] [CrossRef]
- Gonzalez-Feliu, J. Sustainable Urban Logistics: Planning and Evaluation; Wiley: Hoboken, NJ, USA, 2018. [Google Scholar]
- Gonzalez-Feliu, J.; Ambrosini, C.; Pluvinet, P.; Toilier, F.; Routhier, J.L. A simulation framework for evaluating the impacts of urban goods transport in terms of road occupancy. J. Comput. Sci. 2012, 3, 206–215. [Google Scholar] [CrossRef]
- Fu, J.; Jenelius, E. Transport efficiency of off-peak urban goods deliveries: A Stockholm pilot study. Case Stud. Transp. Policy 2018, 6, 156–166. [Google Scholar] [CrossRef]
- Holguín-Veras, J.; Encarnación, T.; González-Calderón, C.A.; Winebrake, J.; Wang, C.; Kyle, S.; Herazo-Padilla, N.; Kalahasthi, L.; Adarme, W.; Cantillo, V.; et al. Direct impacts of off-hour deliveries on urban freight emissions. Transp. Res. Part D Transp. Environ. 2018, 61, 84–103. [Google Scholar] [CrossRef]
- Pluvinet, P.; Gonzalez-Feliu, J.; Ambrosini, C. GPS Data Analysis for Understanding Urban Goods Movement. Procedia Soc. Behav. Sci. 2012, 39, 450–462. [Google Scholar] [CrossRef]
- Aiura, N.; Taniguchi, E. Planning On-Street Loading-Unloading Spaces Considering the Behaviour of Pickup-Delivery Vehicles and Parking Enforcement. In Proceedings of the 4th International Conference City Logistics, Langkawi, Malaysia, 12–14 July 2005; Volume 6, pp. 107–116. [Google Scholar]
- Delaître, L.; Routhier, J.L. Mixing two French tools for delivery areas scheme decision making. Procedia Soc. Behav. Sci. 2010, 2, 6274–6285. [Google Scholar] [CrossRef]
- Gardrat, M.; Serouge, M. Modeling Delivery Spaces Schemes: Is the Space Properly used in Cities Regarding Delivery Practices? Transp. Res. Procedia 2016, 12, 436–449. [Google Scholar] [CrossRef]
- Alho, A.R.; Silva, J.D.E. Analyzing the relation between land-use/urban freight operations and the need for dedicated infrastructure/enforcement—Application to the city of Lisbon. Res. Transp. Bus. Manag. 2014, 11, 85–97. [Google Scholar] [CrossRef]
- Dezi, G.; Dondi, G.; Sangiorgi, C. Urban freight transport in Bologna: Planning commercial vehicle loading/unloading zones. Procedia Soc. Behav. Sci. 2010, 2, 5990–6001. [Google Scholar] [CrossRef]
- Gonzalez-Feliu, J.; Arndt, W.-H.; Beckmann, K.J.; Gies, J. The deployment of urban logistics solutions from research, development and pilot results. Lessons from the FREILOT Project. In Stadtischer Wirtschaftsverkehr—Commercial/Goods Transportation in Urban Areas—Transports Commerciaux/Marchandises en Ville. Dokumentation der Internationalen Konferenz 2012 in Berlin; Arndt, W., Beckmann, K., Gies, J., Gonzalez-Feliu, J., Eds.; Deutsches Institut fur Urbanistik: Berlin, Germany, 2013; pp. 104–121. [Google Scholar]
- Patier, D.; David, B.; Chalon, R.; Deslandres, V. A New Concept for Urban Logistics Delivery Area Booking. Procedia Soc. Behav. Sci. 2014, 125, 99–110. [Google Scholar] [CrossRef]
- Lopez, C.; Gonzalez-Feliu, J.; Chiabaut, N.; Leclerq, L. Assessing the impacts of goods deliveries’ double line parking on the overall traffic under realistic conditions. In Proceedings of the 6th International Conference Information Systems, Logistics, and Supply Chain, Bordeaux, France, 1–4 June 2016; pp. 1–7. [Google Scholar]
- Paris City Council. Technical Guide to Delivery Areas for the City of Paris; Paris City Council: Paris, Germany, 2005. [Google Scholar]
- Allen, J.; Browne, M.; Cherrett, T.; McLeod, F. Review of UK Urban Freight Studies; Green Logistics Project Work Module 9; University of Westminster and University of Southhampton: Westminster/Southampton, UK, 2008. [Google Scholar]
- Ambrosini, C.; Patier, D.; Routhier, J.L. Urban freight establishment and tour based surveys for policy oriented modelling. Procedia Soc. Behav. Sci. 2010, 2, 6013–6026. [Google Scholar] [CrossRef]
- Holguín-Veras, J.; Jaller, M. Comprehensive Freight Demand Data Collection Framework for Large Urban Areas. In Sustainable Urban Logistics: Concepts, Methods and Information Systems; Gonzalez-Feliu, J., Semet, F., Routhier, J.-L., Eds.; Springer: Berlin/Heidelberg, Germany, 2014; pp. 91–112. [Google Scholar]
- Allen, J.; Browne, M. Survey Forms Used in Urban Freight Studies. Transport Studies Group; University of Westminster: London, UK, 2008. [Google Scholar]
- Oskarbski, J.; Kaszubowski, D. Implementation of Weigh-in-Motion System in Freight Traffic Management in Urban Areas. Transp. Res. Procedia 2016, 16, 449–463. [Google Scholar] [CrossRef]
© 2018 by the authors. Licensee MDPI, Basel, Switzerland. This article is an open access article distributed under the terms and conditions of the Creative Commons Attribution (CC BY) license (http://creativecommons.org/licenses/by/4.0/).