A Knowledge Discovery Education Framework Targeting the Effective Budget Use and Opinion Explorations in Designing Specific High Cost Product


Abstract
1. Introduction
2. Literature Study
2.1. Educational Trainings for the R&D Institutions: State of the Art
2.2. The Problem Context of the Specific High Cost Product Design Decision Case
2.3. Criteria Set Establishment
3. Methodology
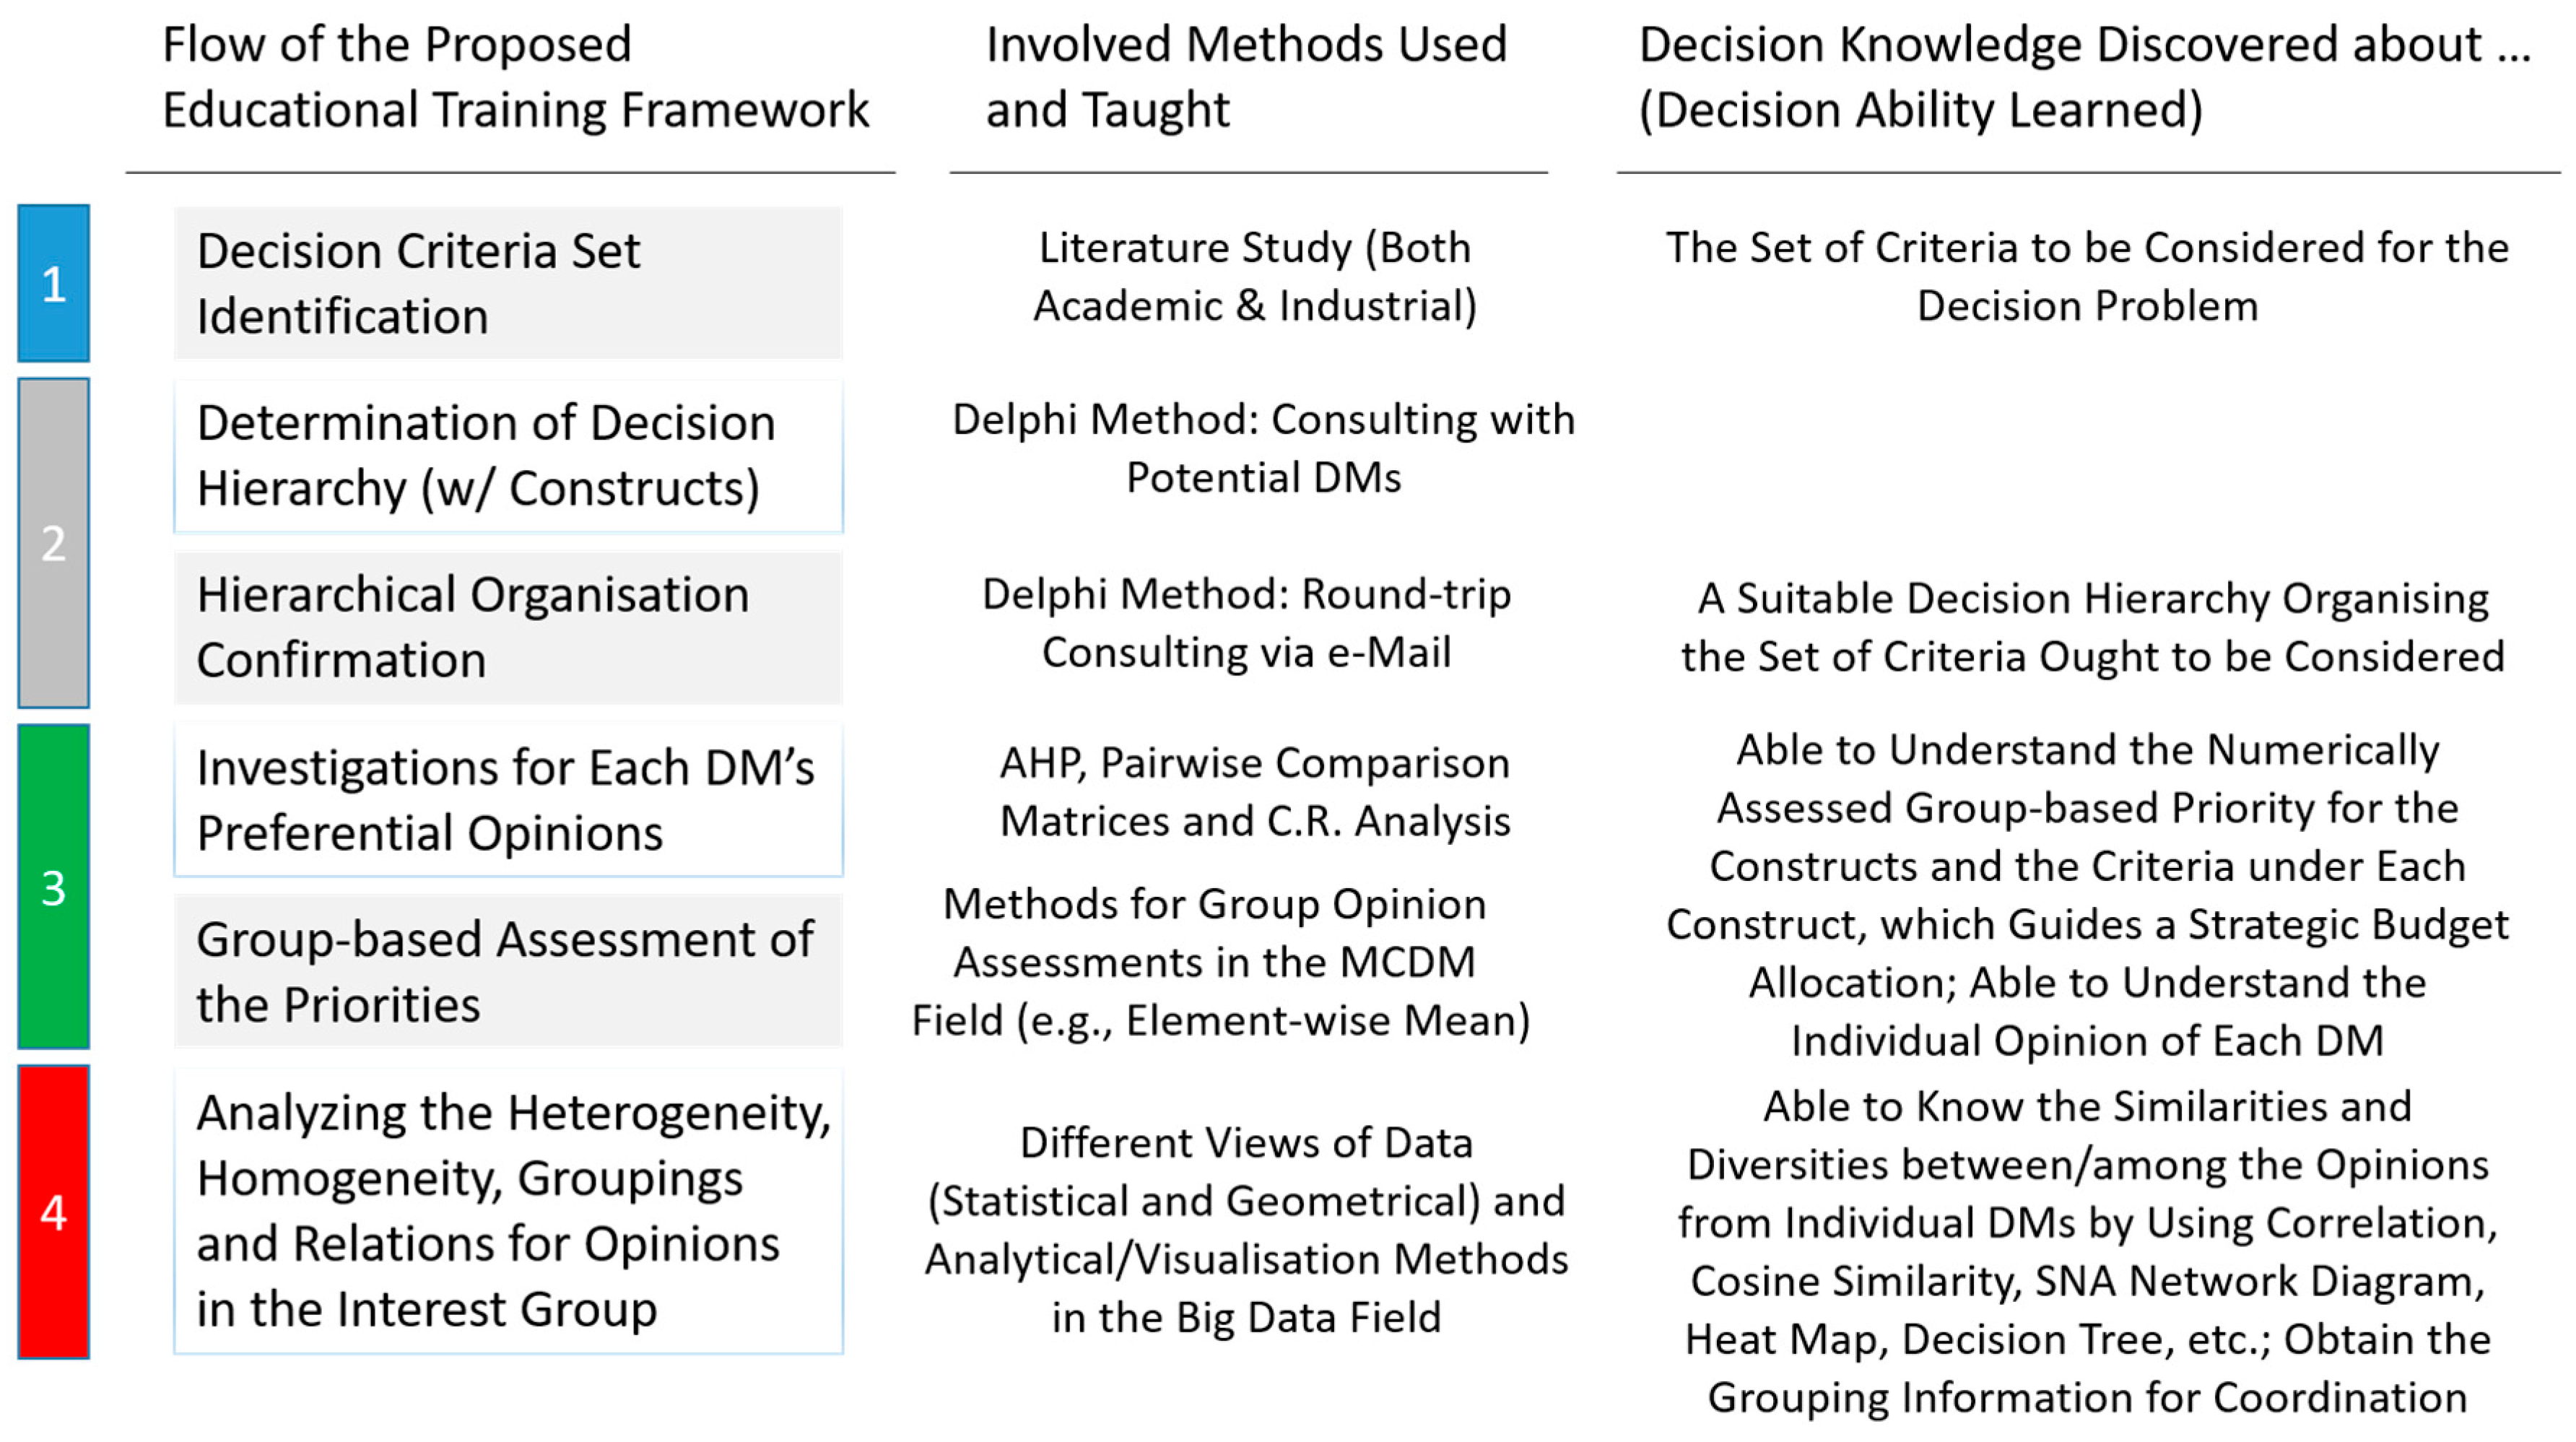
3.1. The Proposed Knowledge Discovery Education Framework: An Overview
3.2. Methods Used for Phases I and II
3.3. The AHP Method Suggested for Phase III’s Main Knowledge Discovery Work
4. Courses Discovering the Knowledge for Budgeting
4.1. For the Survey Works
4.1.1. The Opinion Group
4.1.2. The Phase II Works Using the Delphi Method
4.1.3. The Survey Works of AHP
4.2. For the Analytical Steps Based on AHP
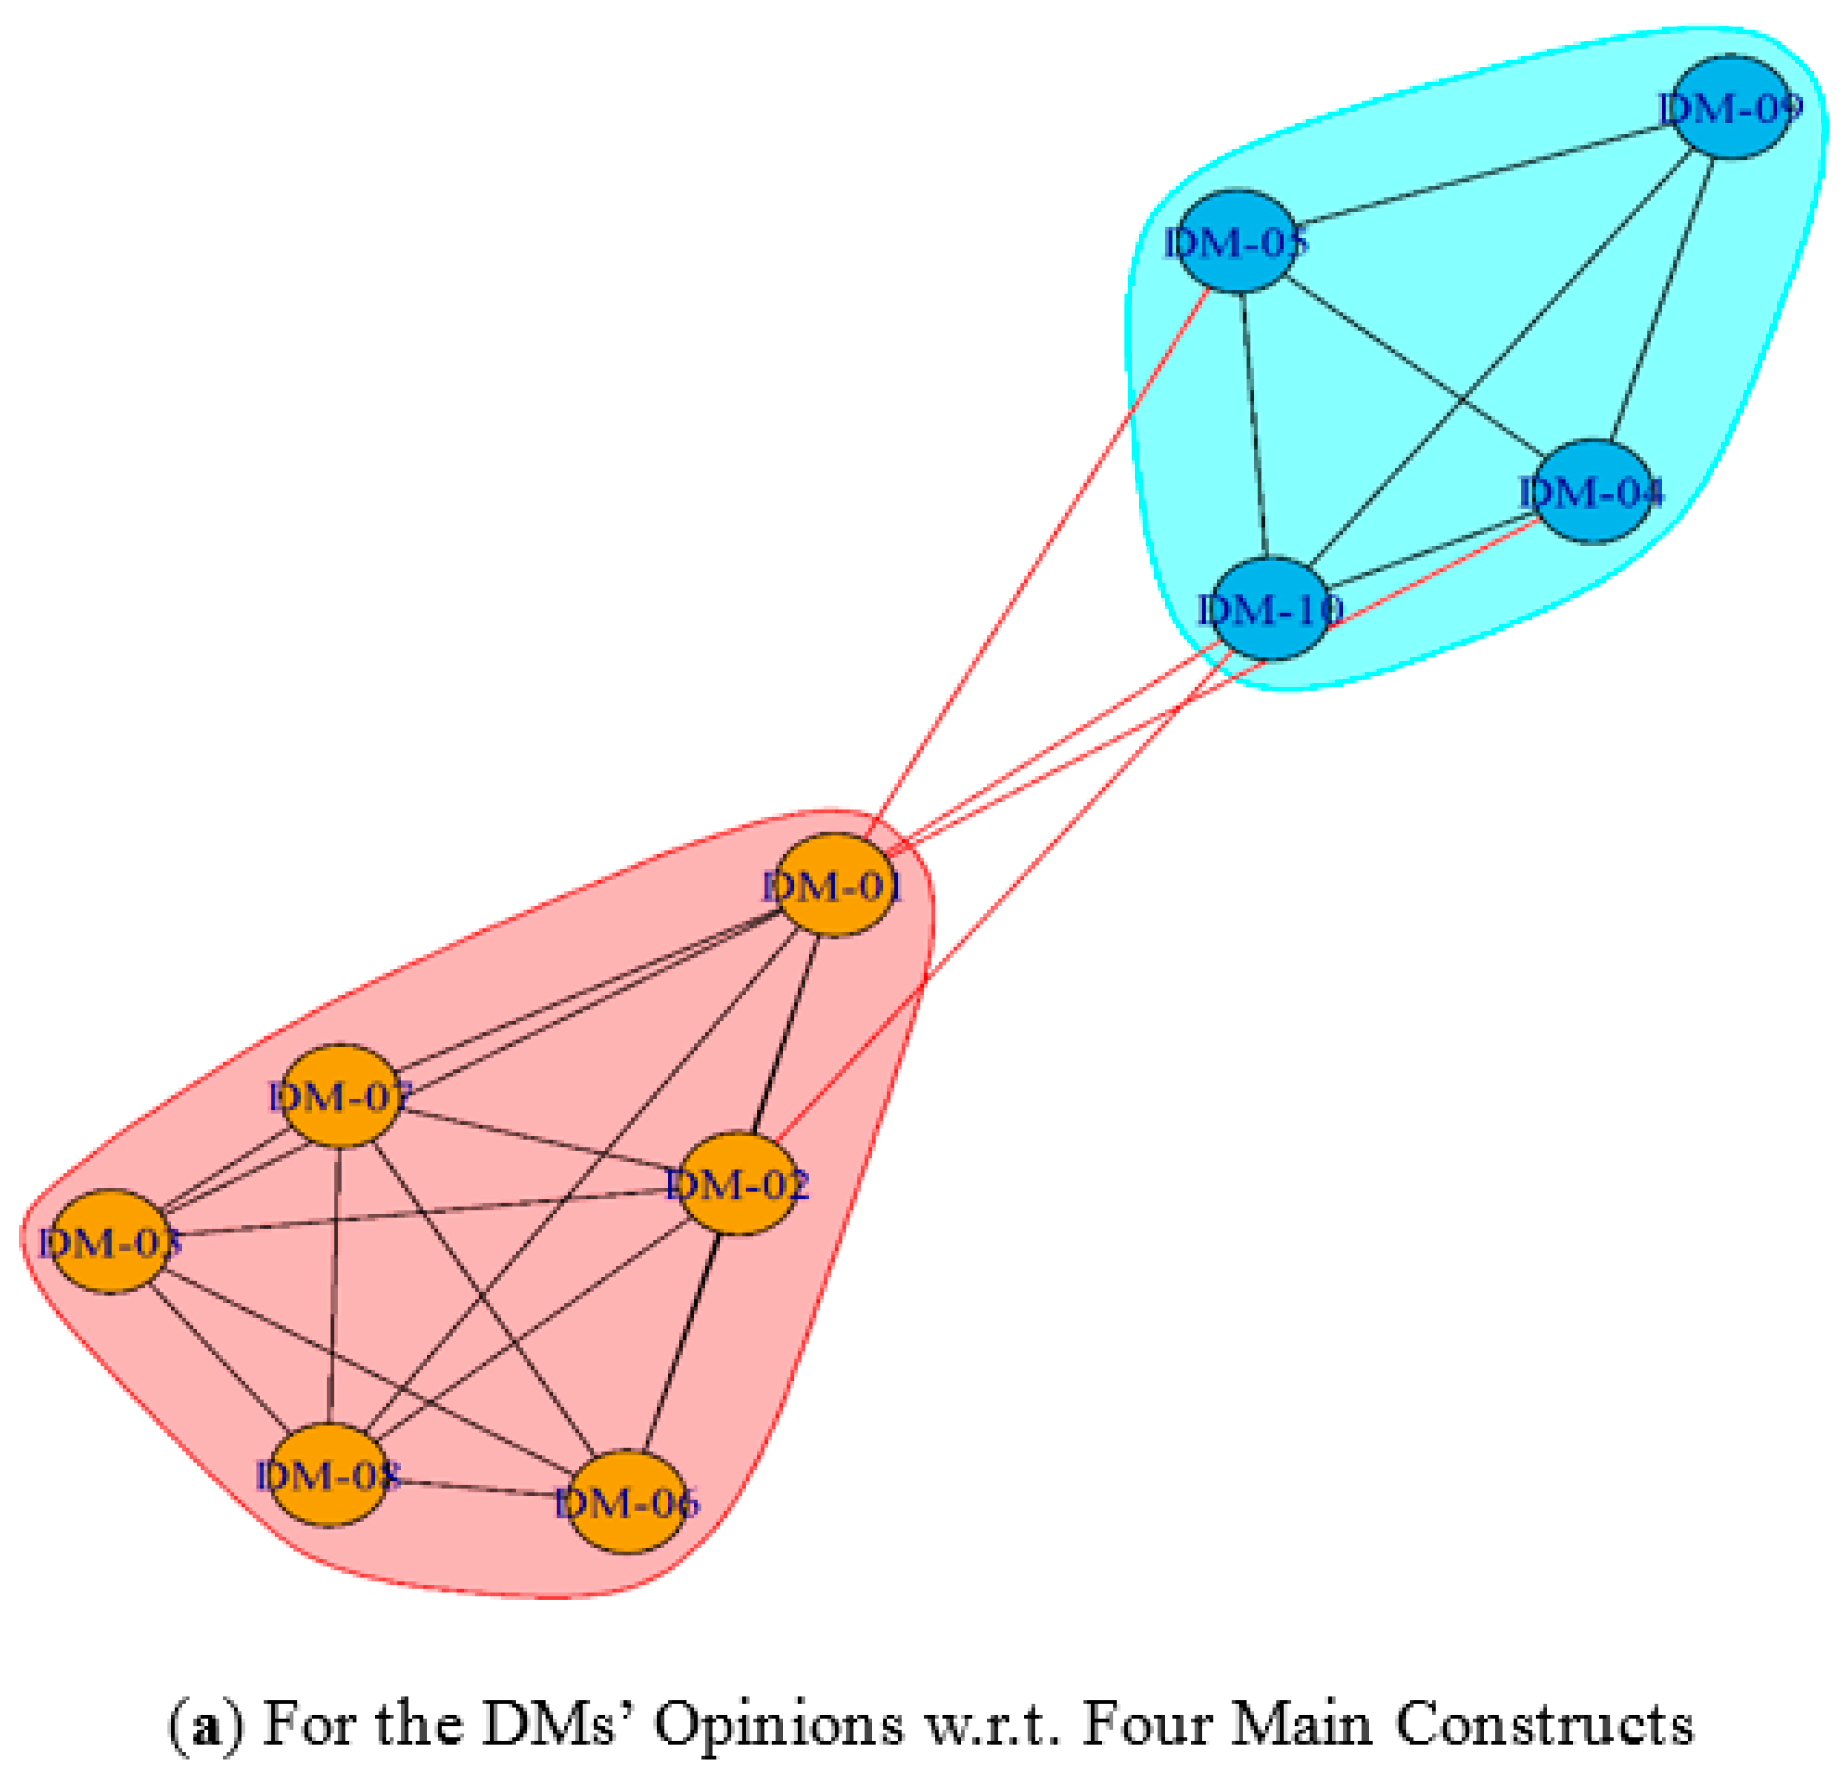
4.2.1. For the Main Constructs
4.2.2. For the Criteria Involved under (w.r.t.) Each Construct
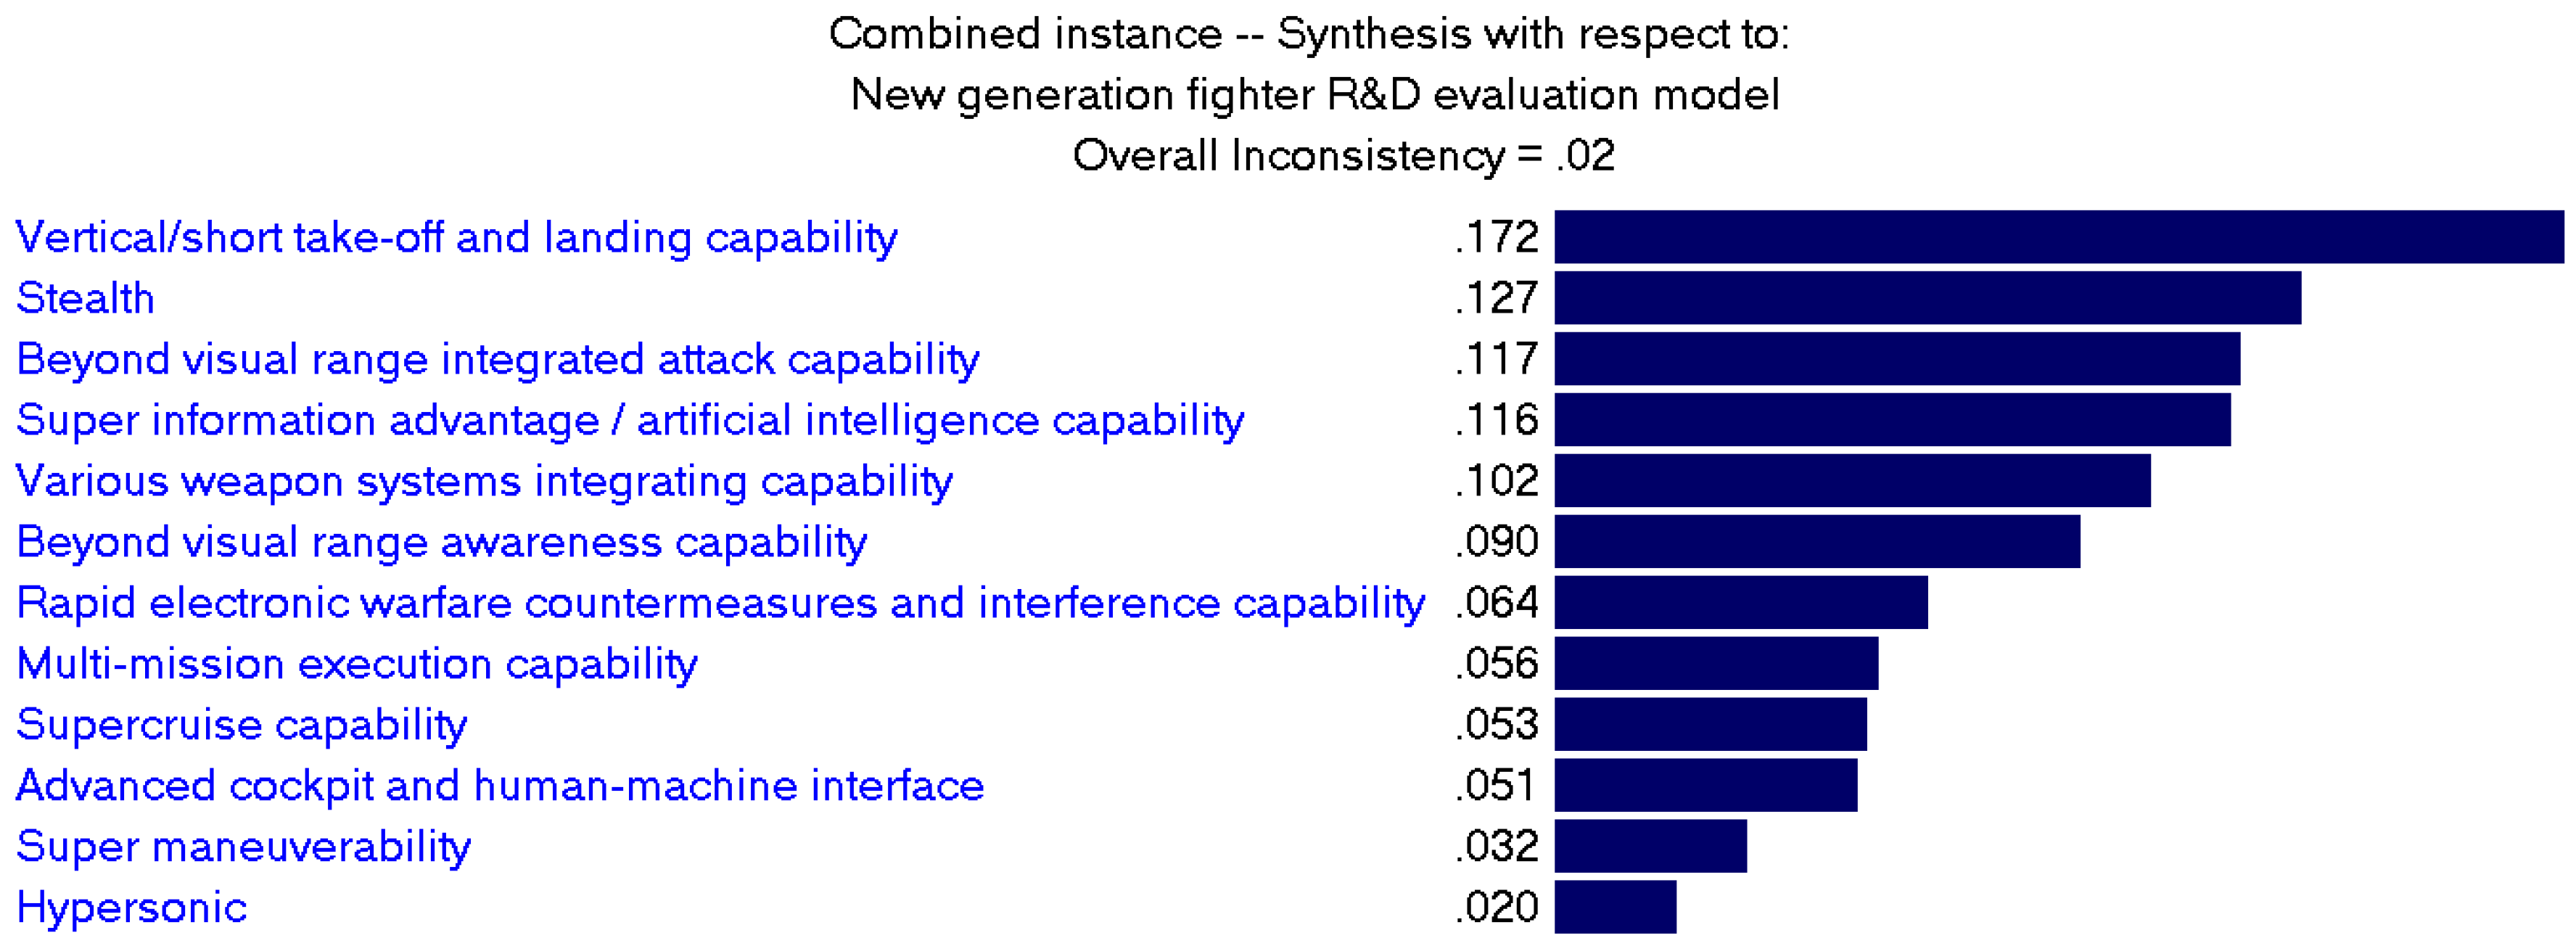
4.2.3. For the Overall Priority Analysis
5. Tutorials for Decision Analysis Identifying Opinion Gaps and Implications
5.1. Required Pre-Processes for the Analyses
5.2. Analysis in Terms of Statistical Correlations
5.3. Analysing the Similarities in Terms of Geometrical Cosine Similarity
6. Discussion, Conclusions, and Recommendations
6.1. Discussion
- (1)
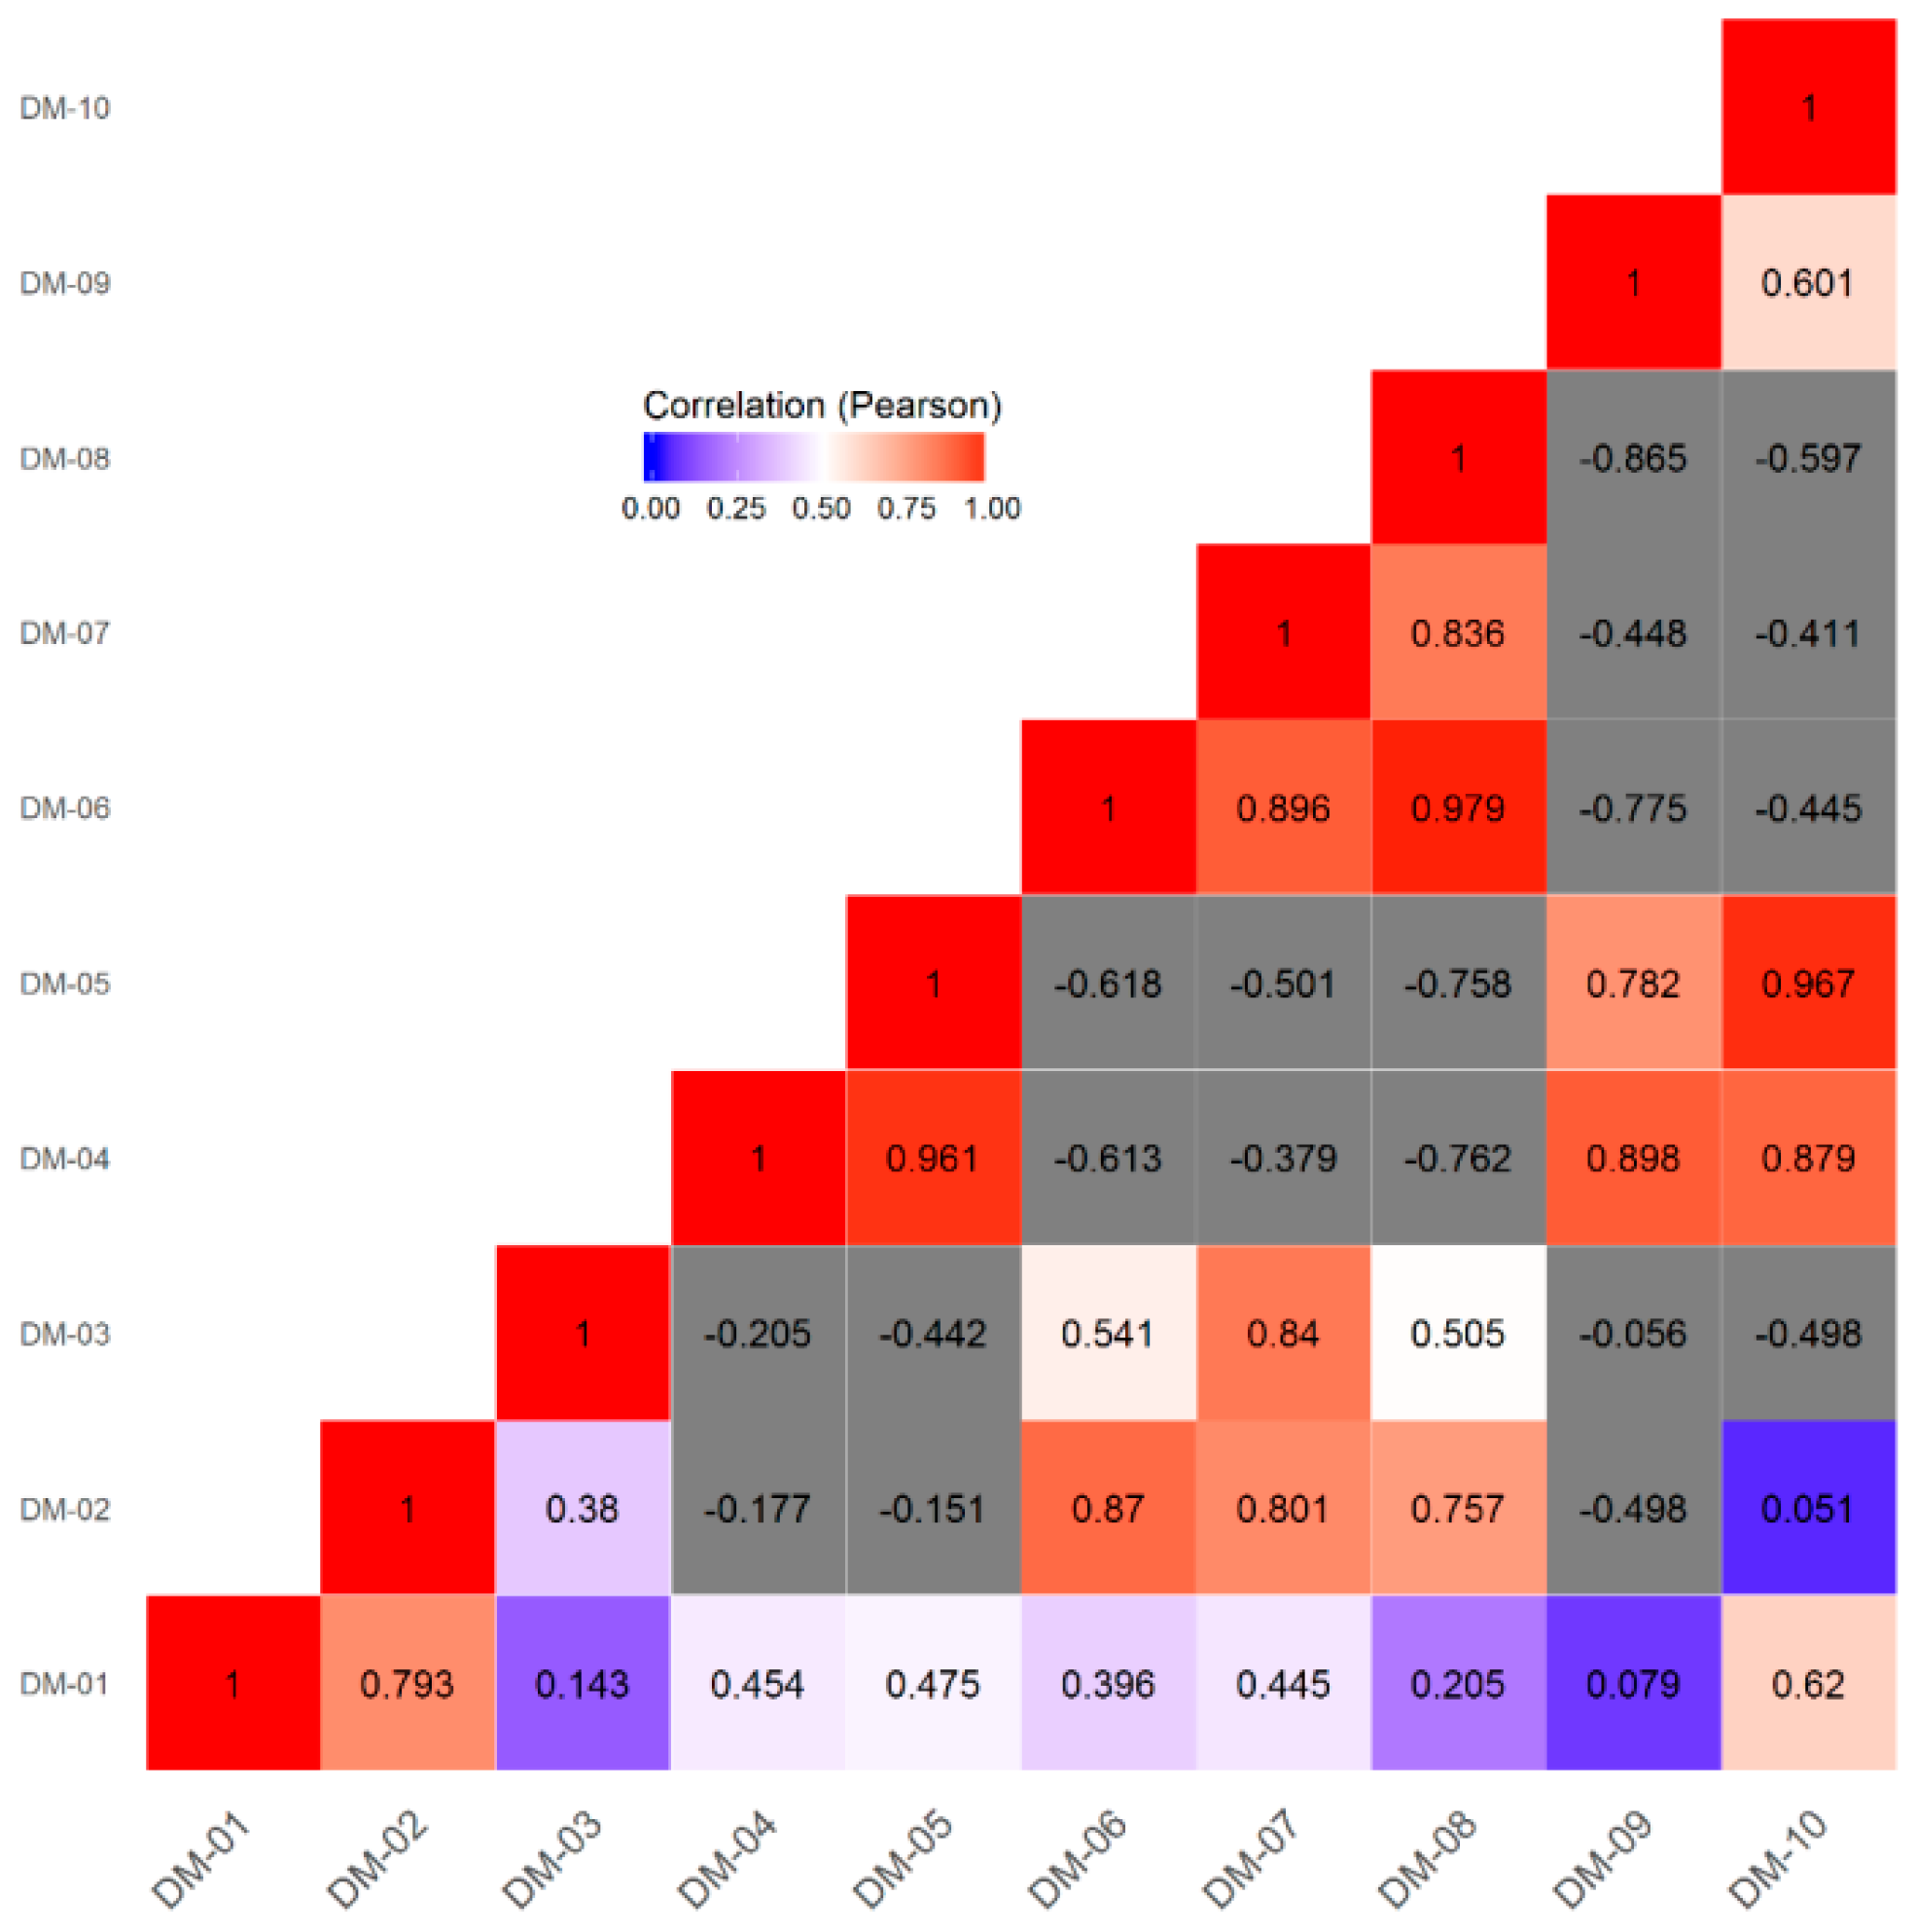
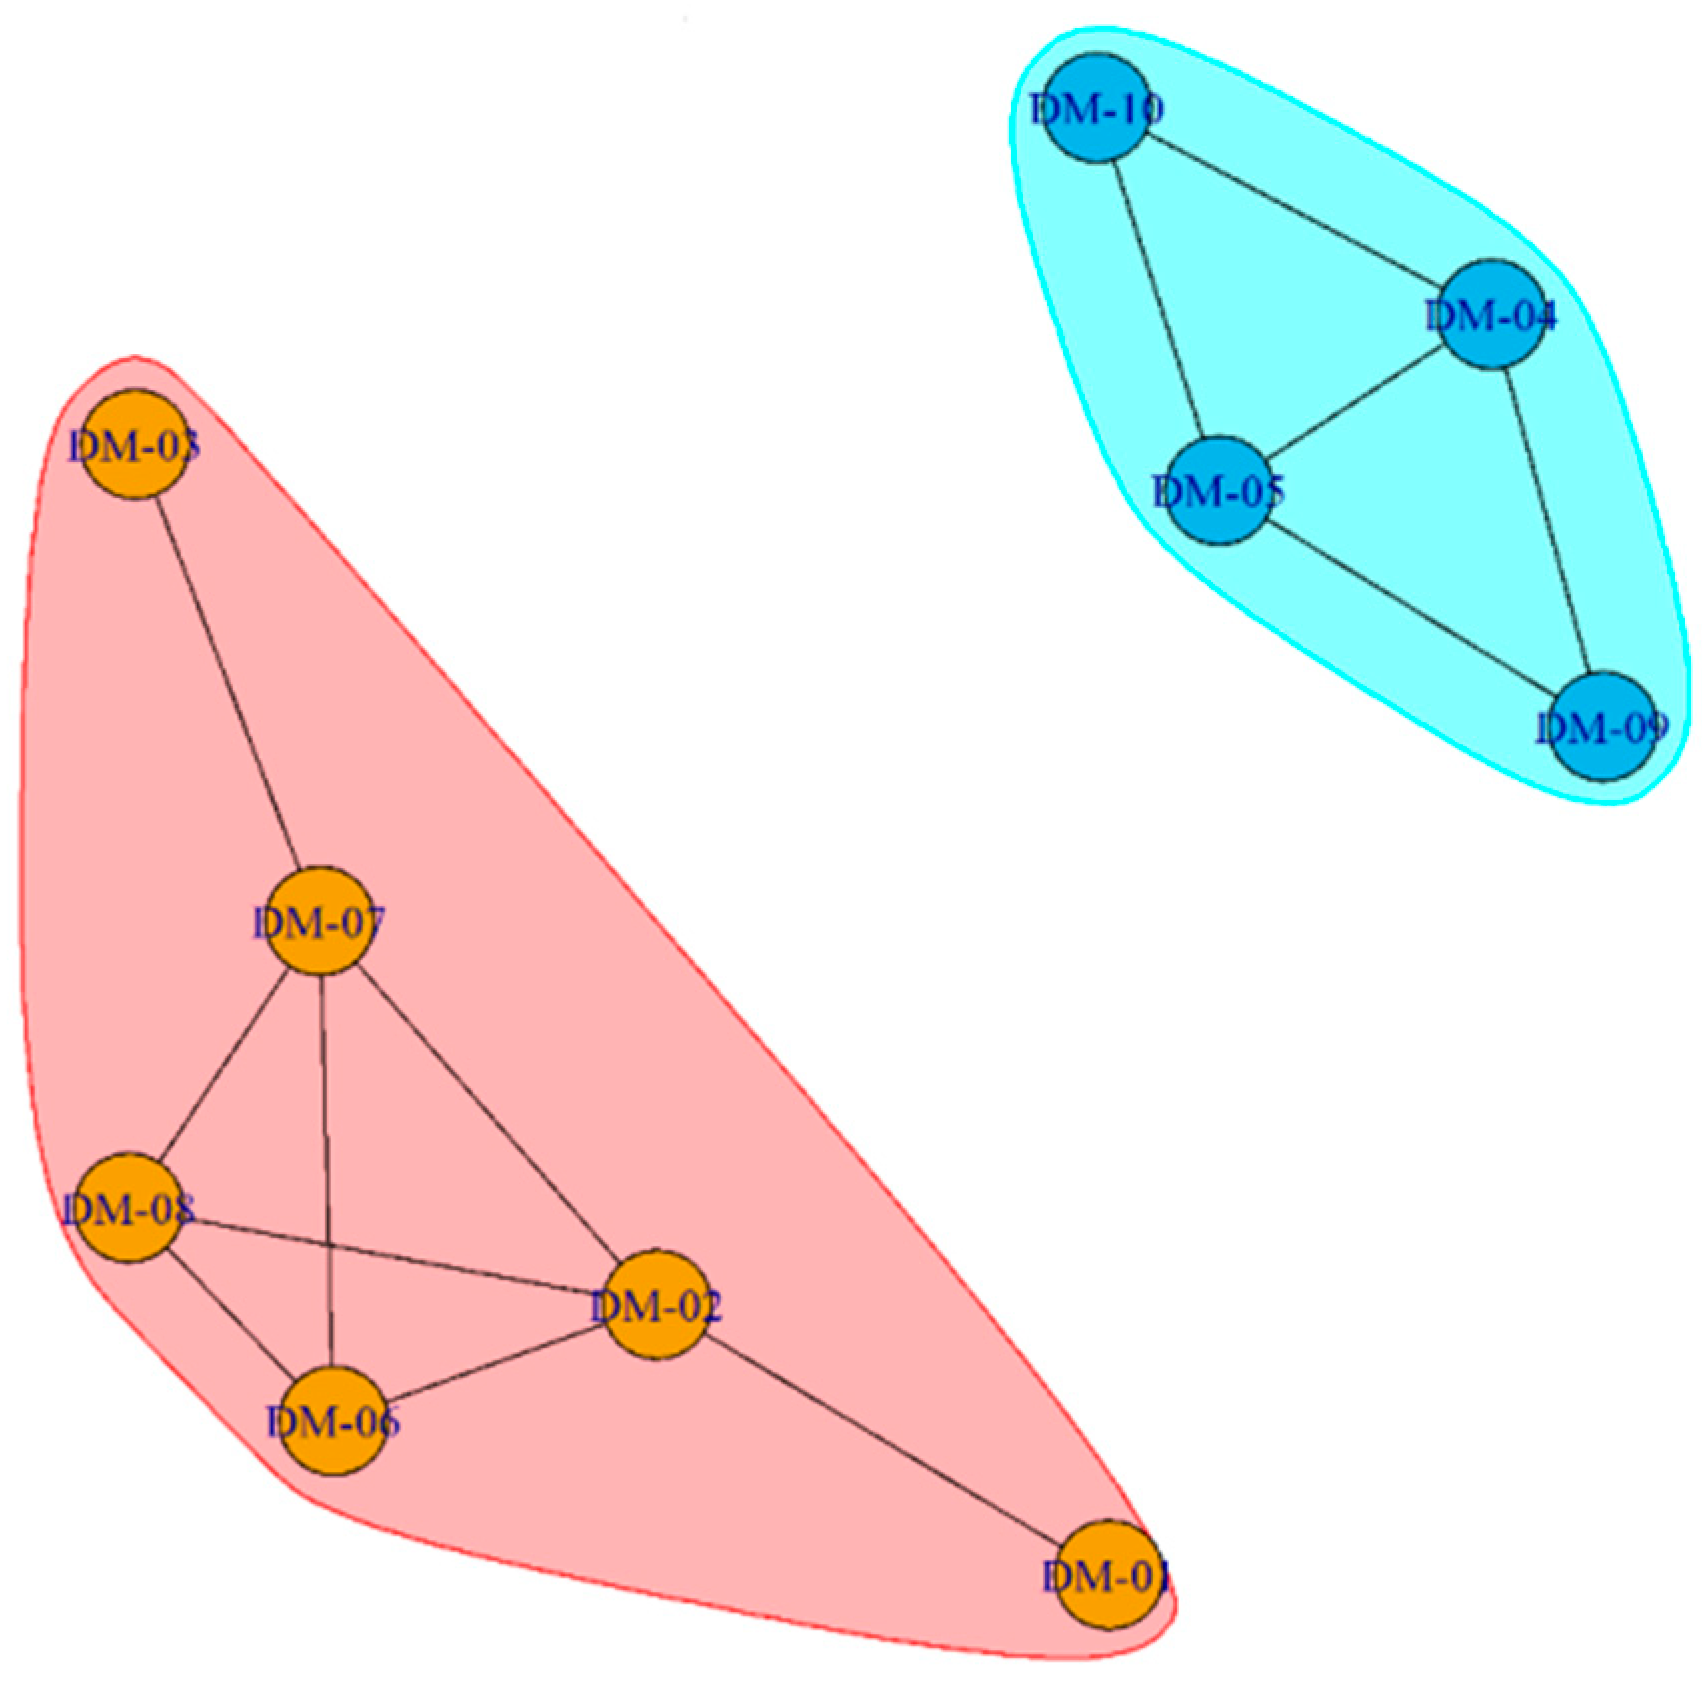
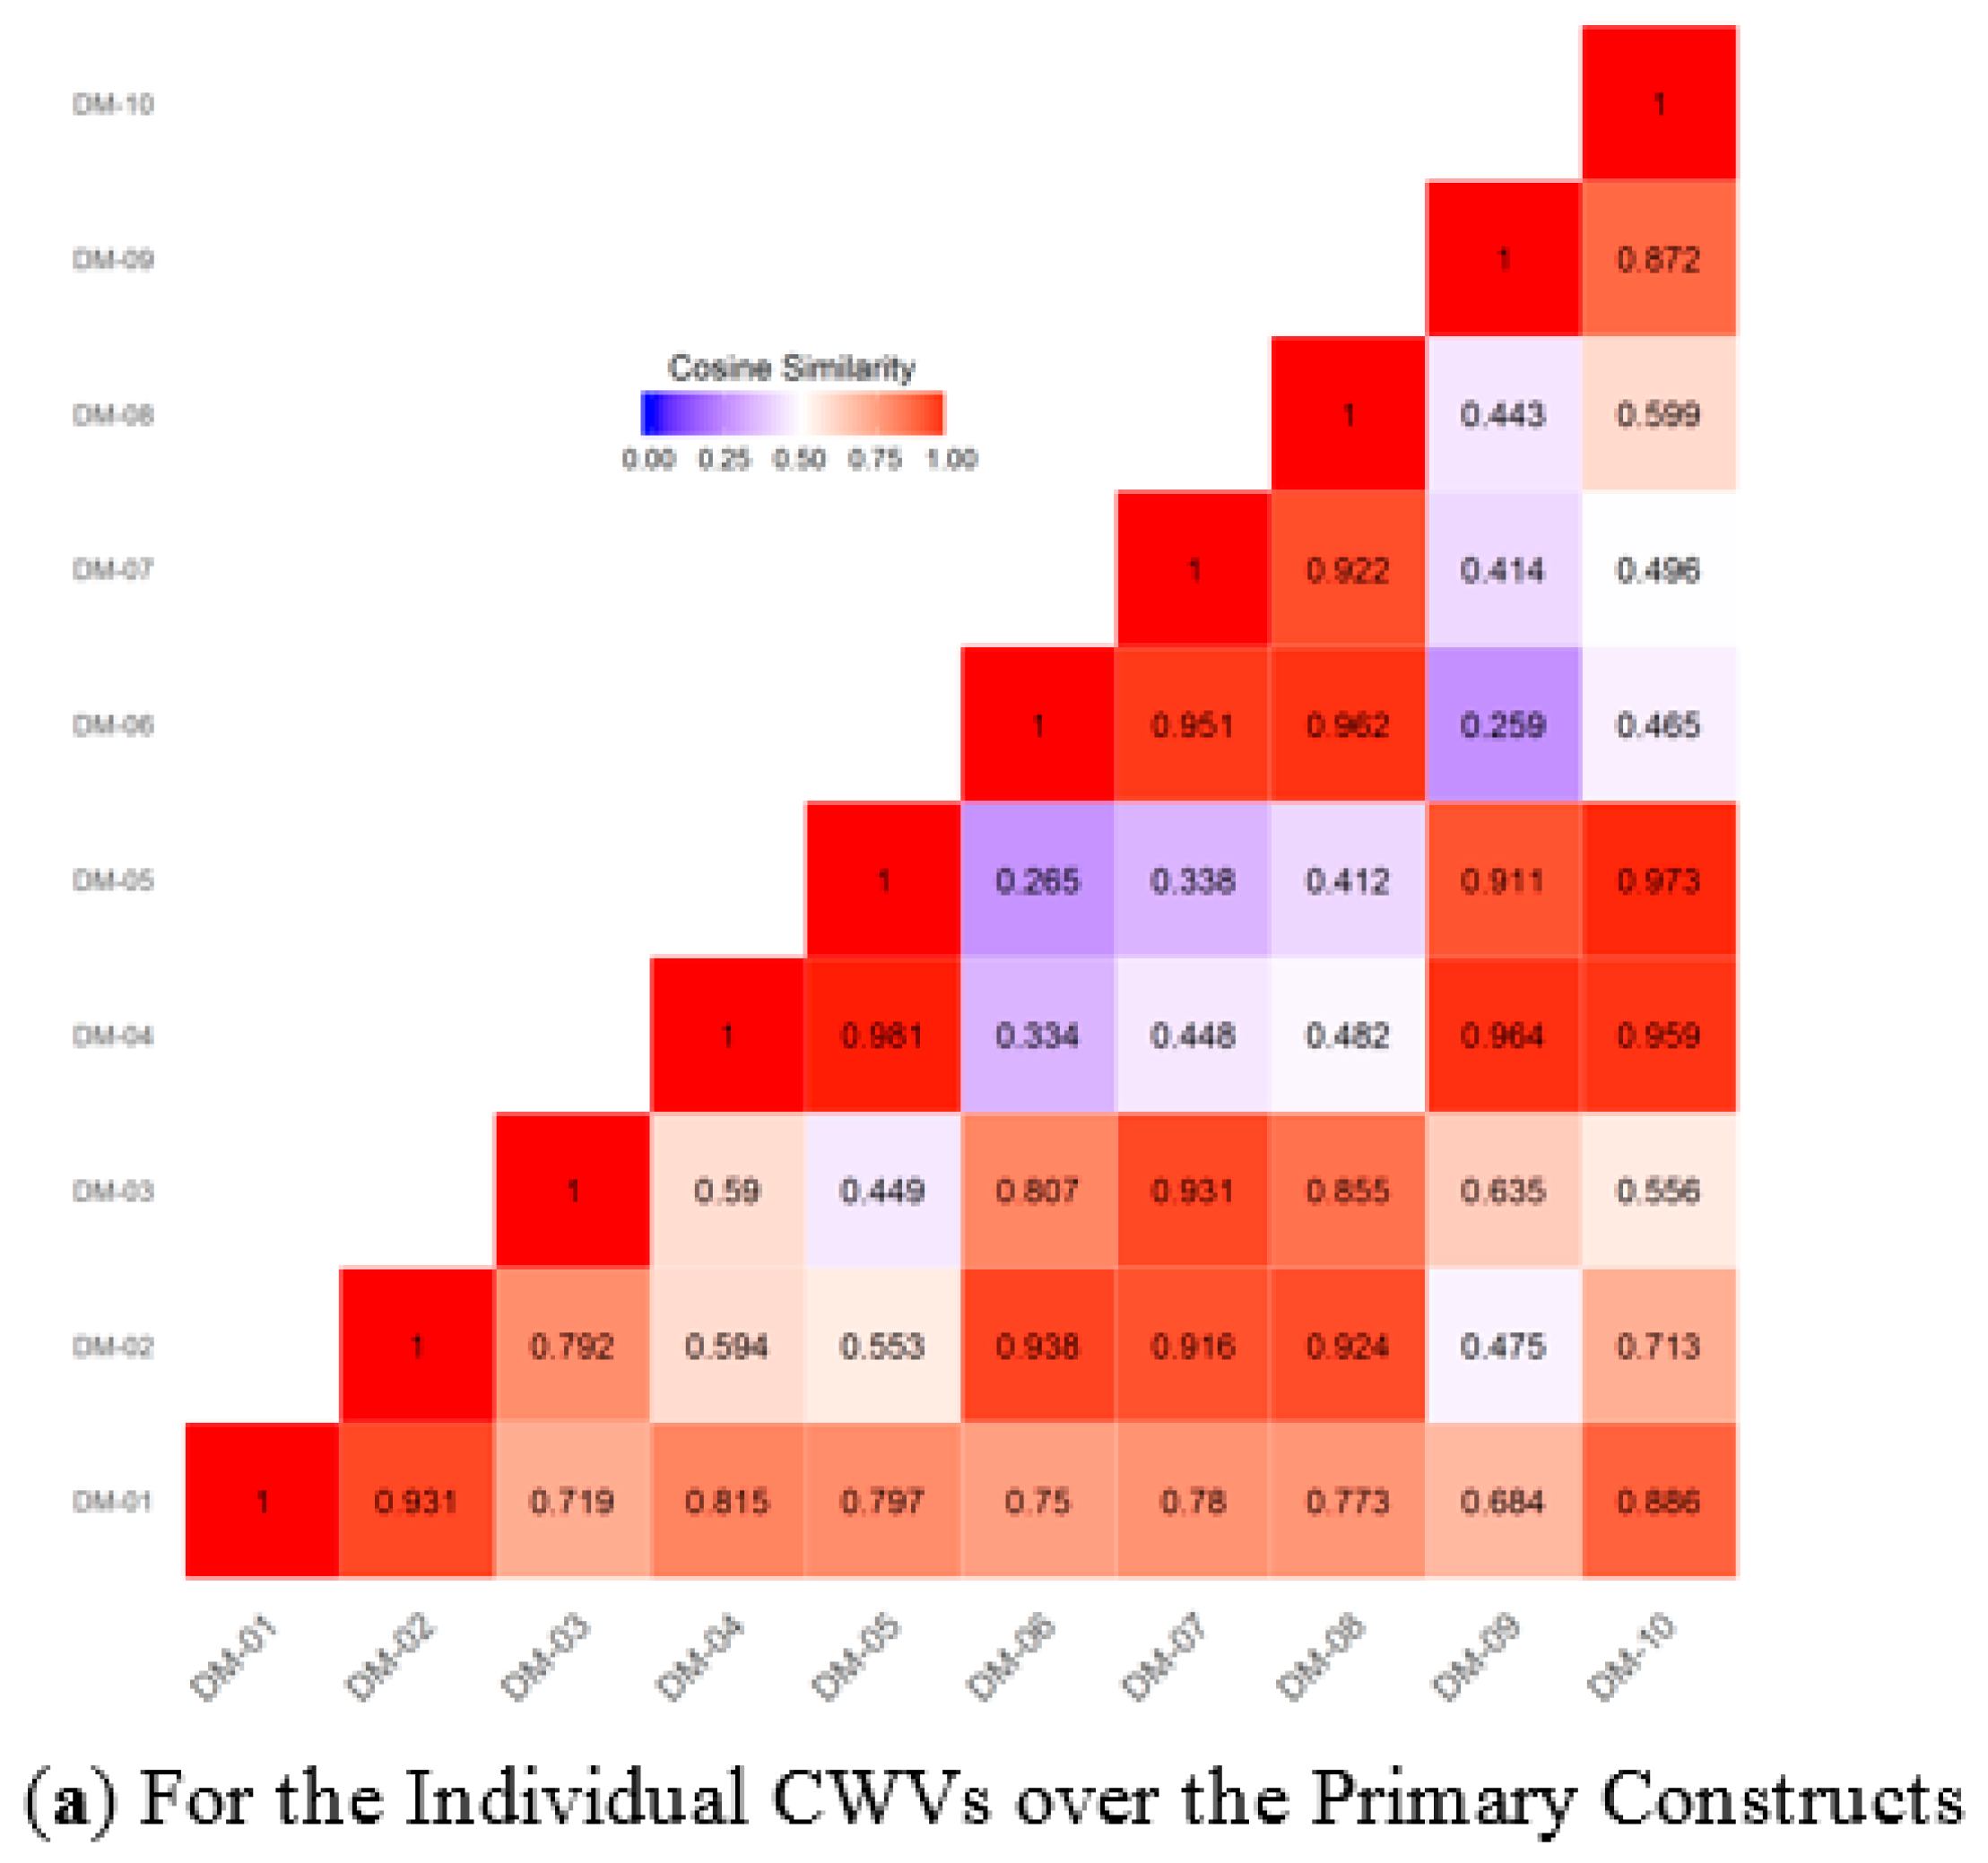
- It was found that w.r.t. the total goal, the grouping scenarios for the DMs are identical (i.e., they are divided into two identical subgroups; so this important empirical finding is cross validated), but despite so, the two subgroups are completely isolated in terms of the correlation relationships, while they are bridged in terms of the similarity relationships, because the measures that are based on the statistical and geometrical concepts are, in the intrinsic, different.
- (2)
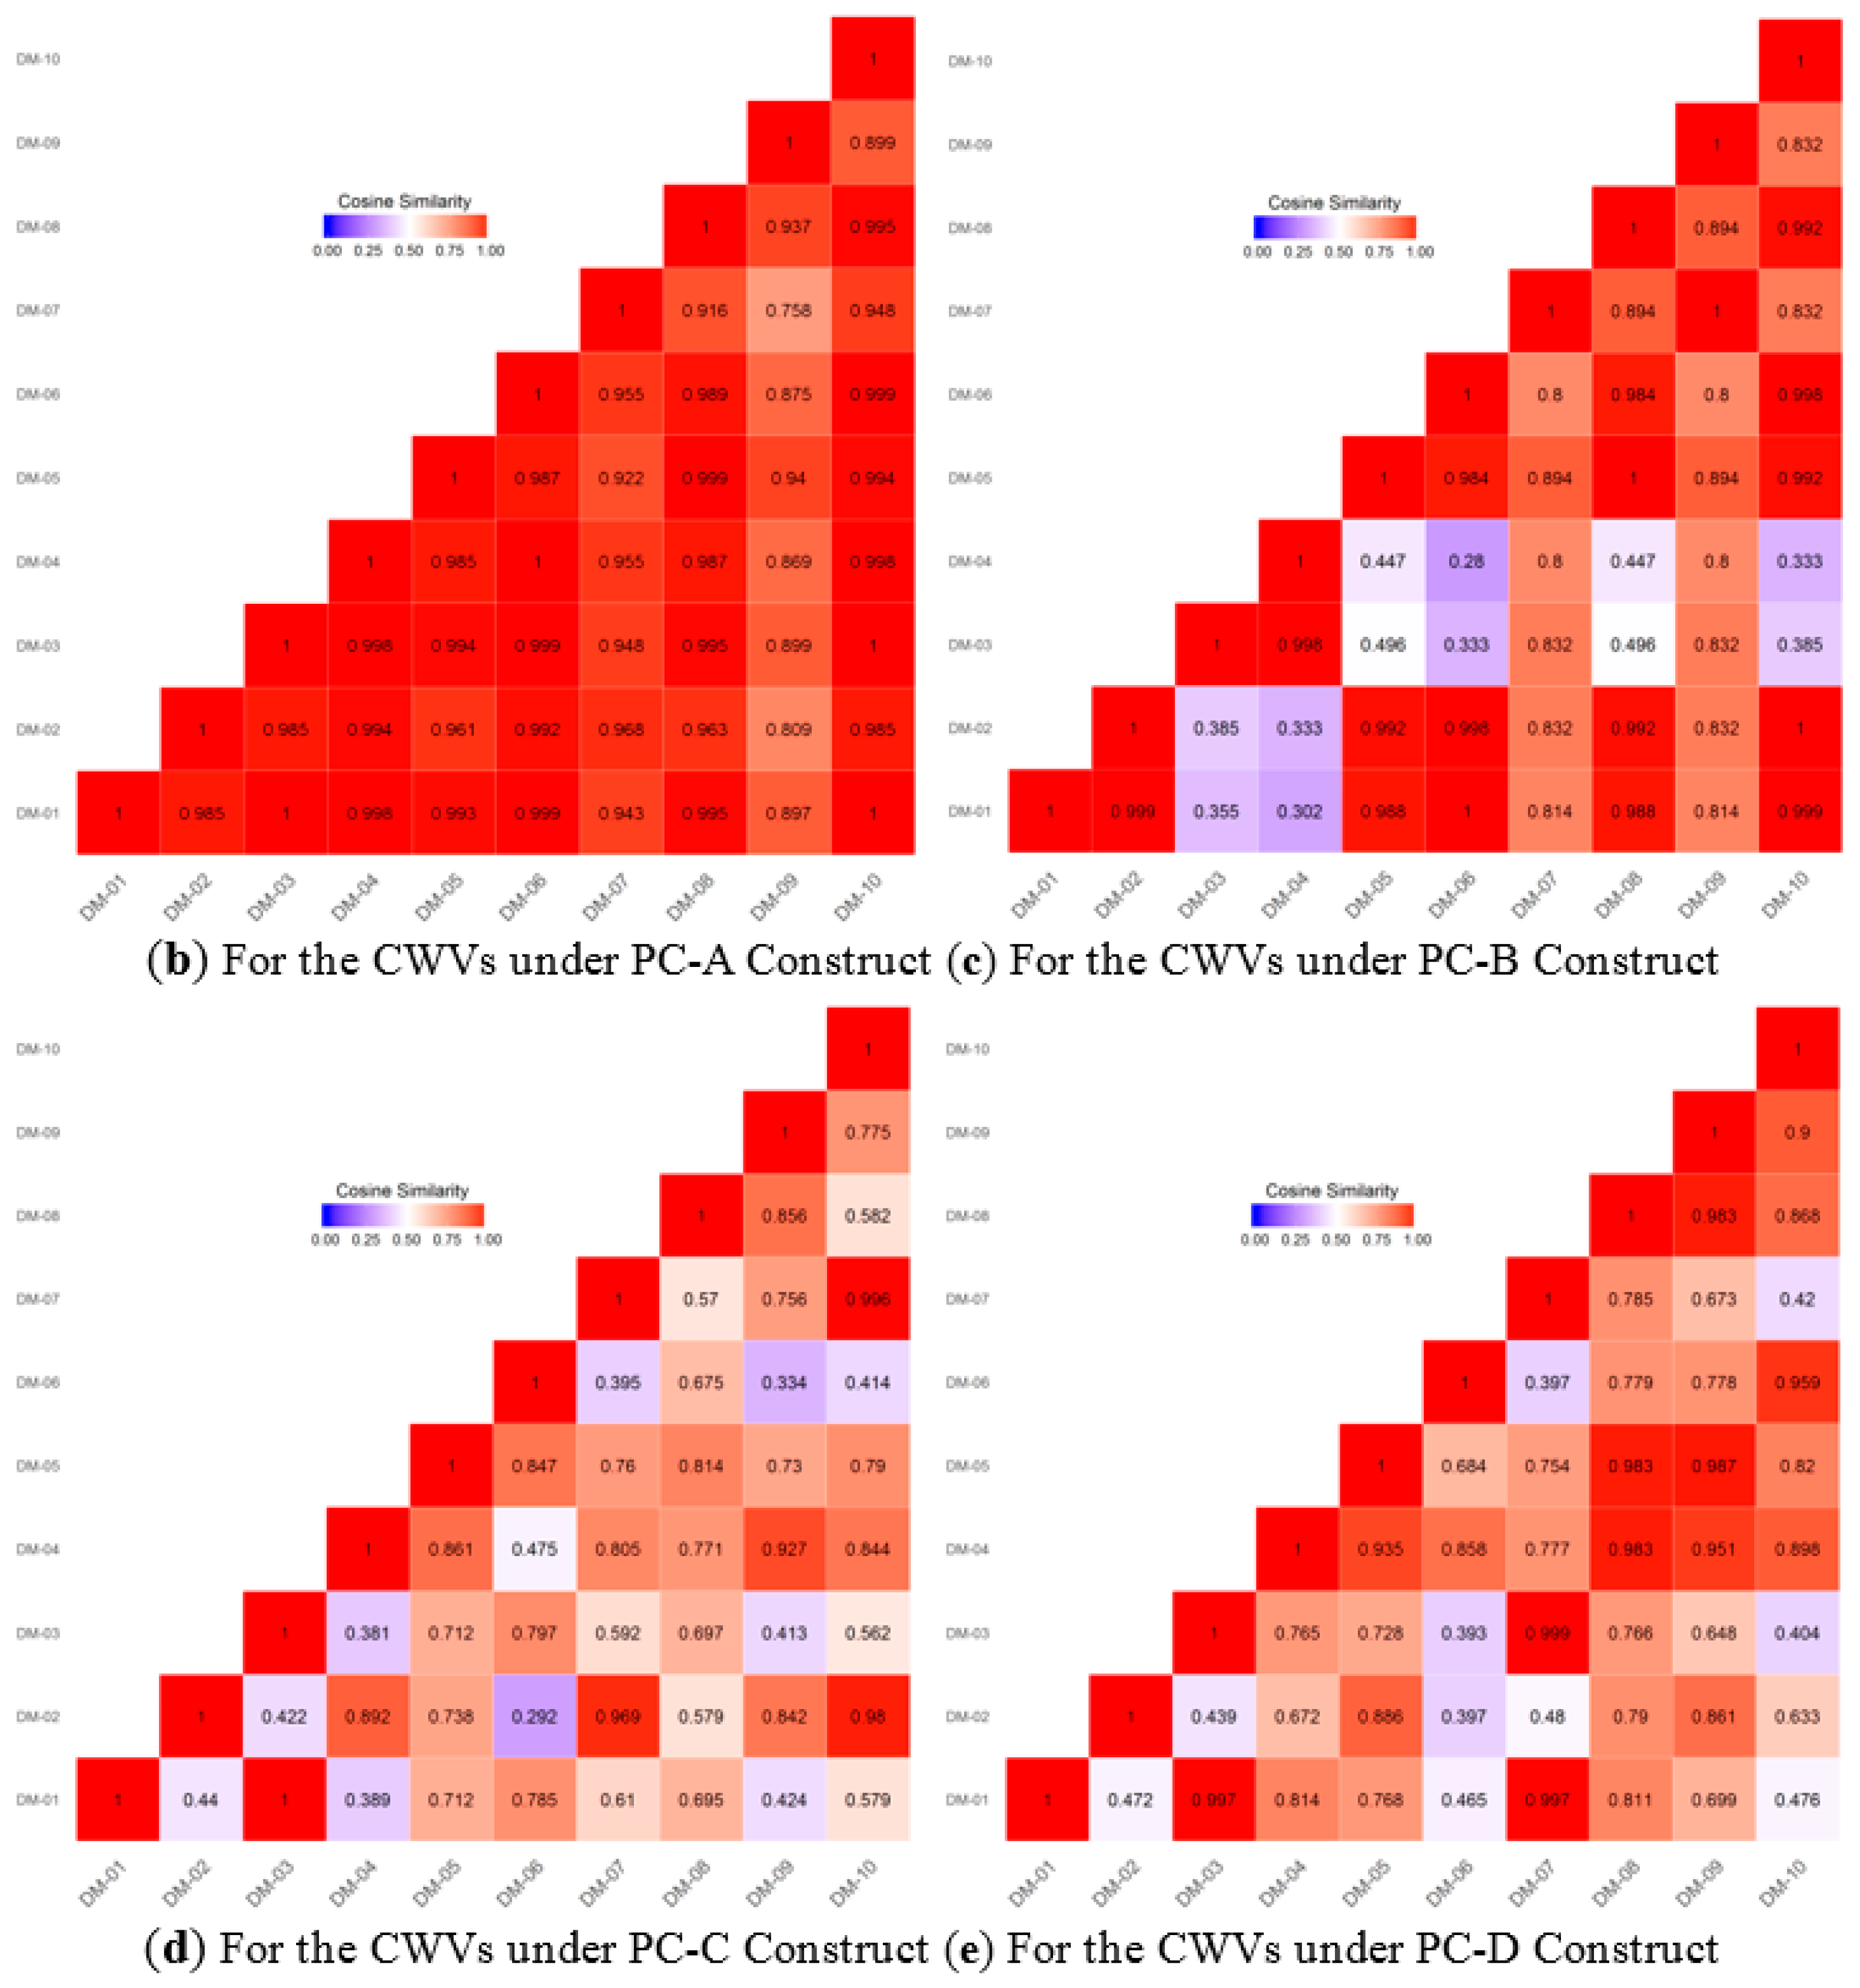
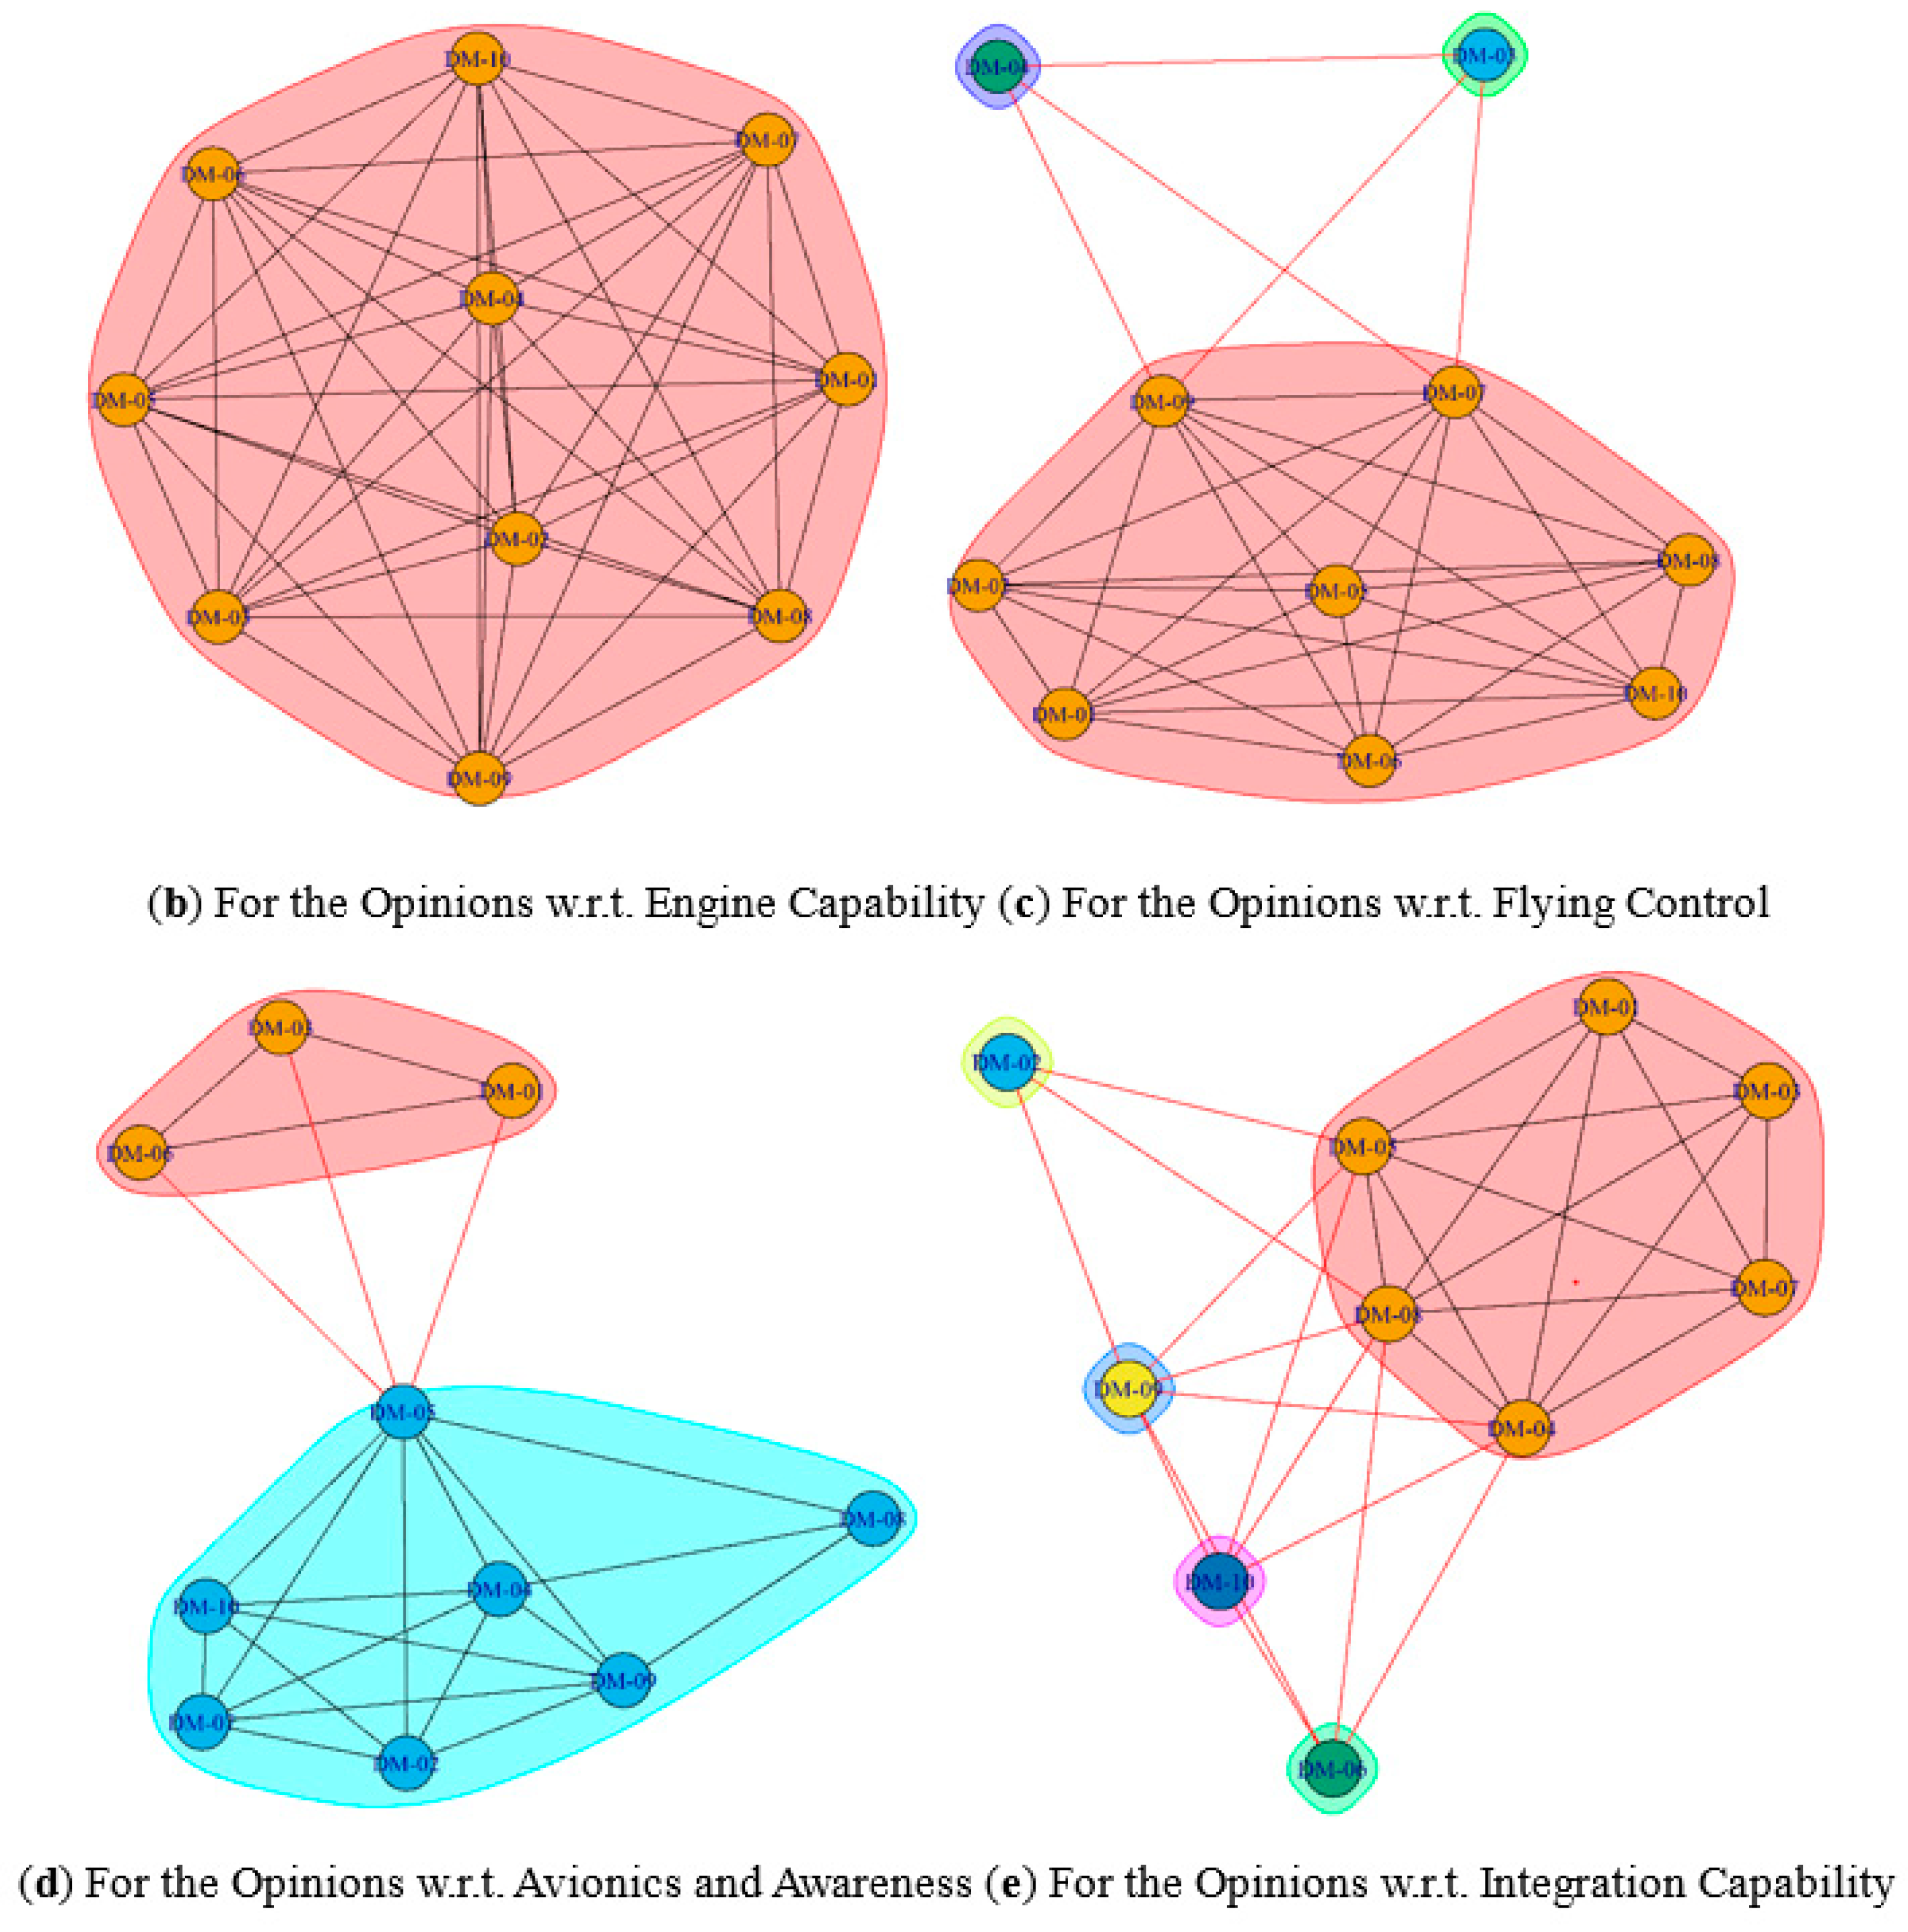
- There is the fact that DMs’ considerations under various constructs are sometimes consistent (under PC-A), but often hard to be consistent (under PC-B, PC-C, and PC-D). This reflects the common variety and diversity of people’s consideration of different decision-making issues.
- (3)
- It was also found that the two methods used to understand (and prioritize) the opinions’ diversity under the different constructs are different, in that the measure of DoD (which is justified based on the distribution of cosine similarity values under a construct) is not analogous to the measure of NSgs (which is the result of classifying the DM opinions in the visualized network diagram under the same construct), because DoD and NSgs are different concepts in nature, although both of them measure the ‘diversity in the opinions of DMs’. This methodological knowledge is important for making other similar decision analyses in the future.
- (4)
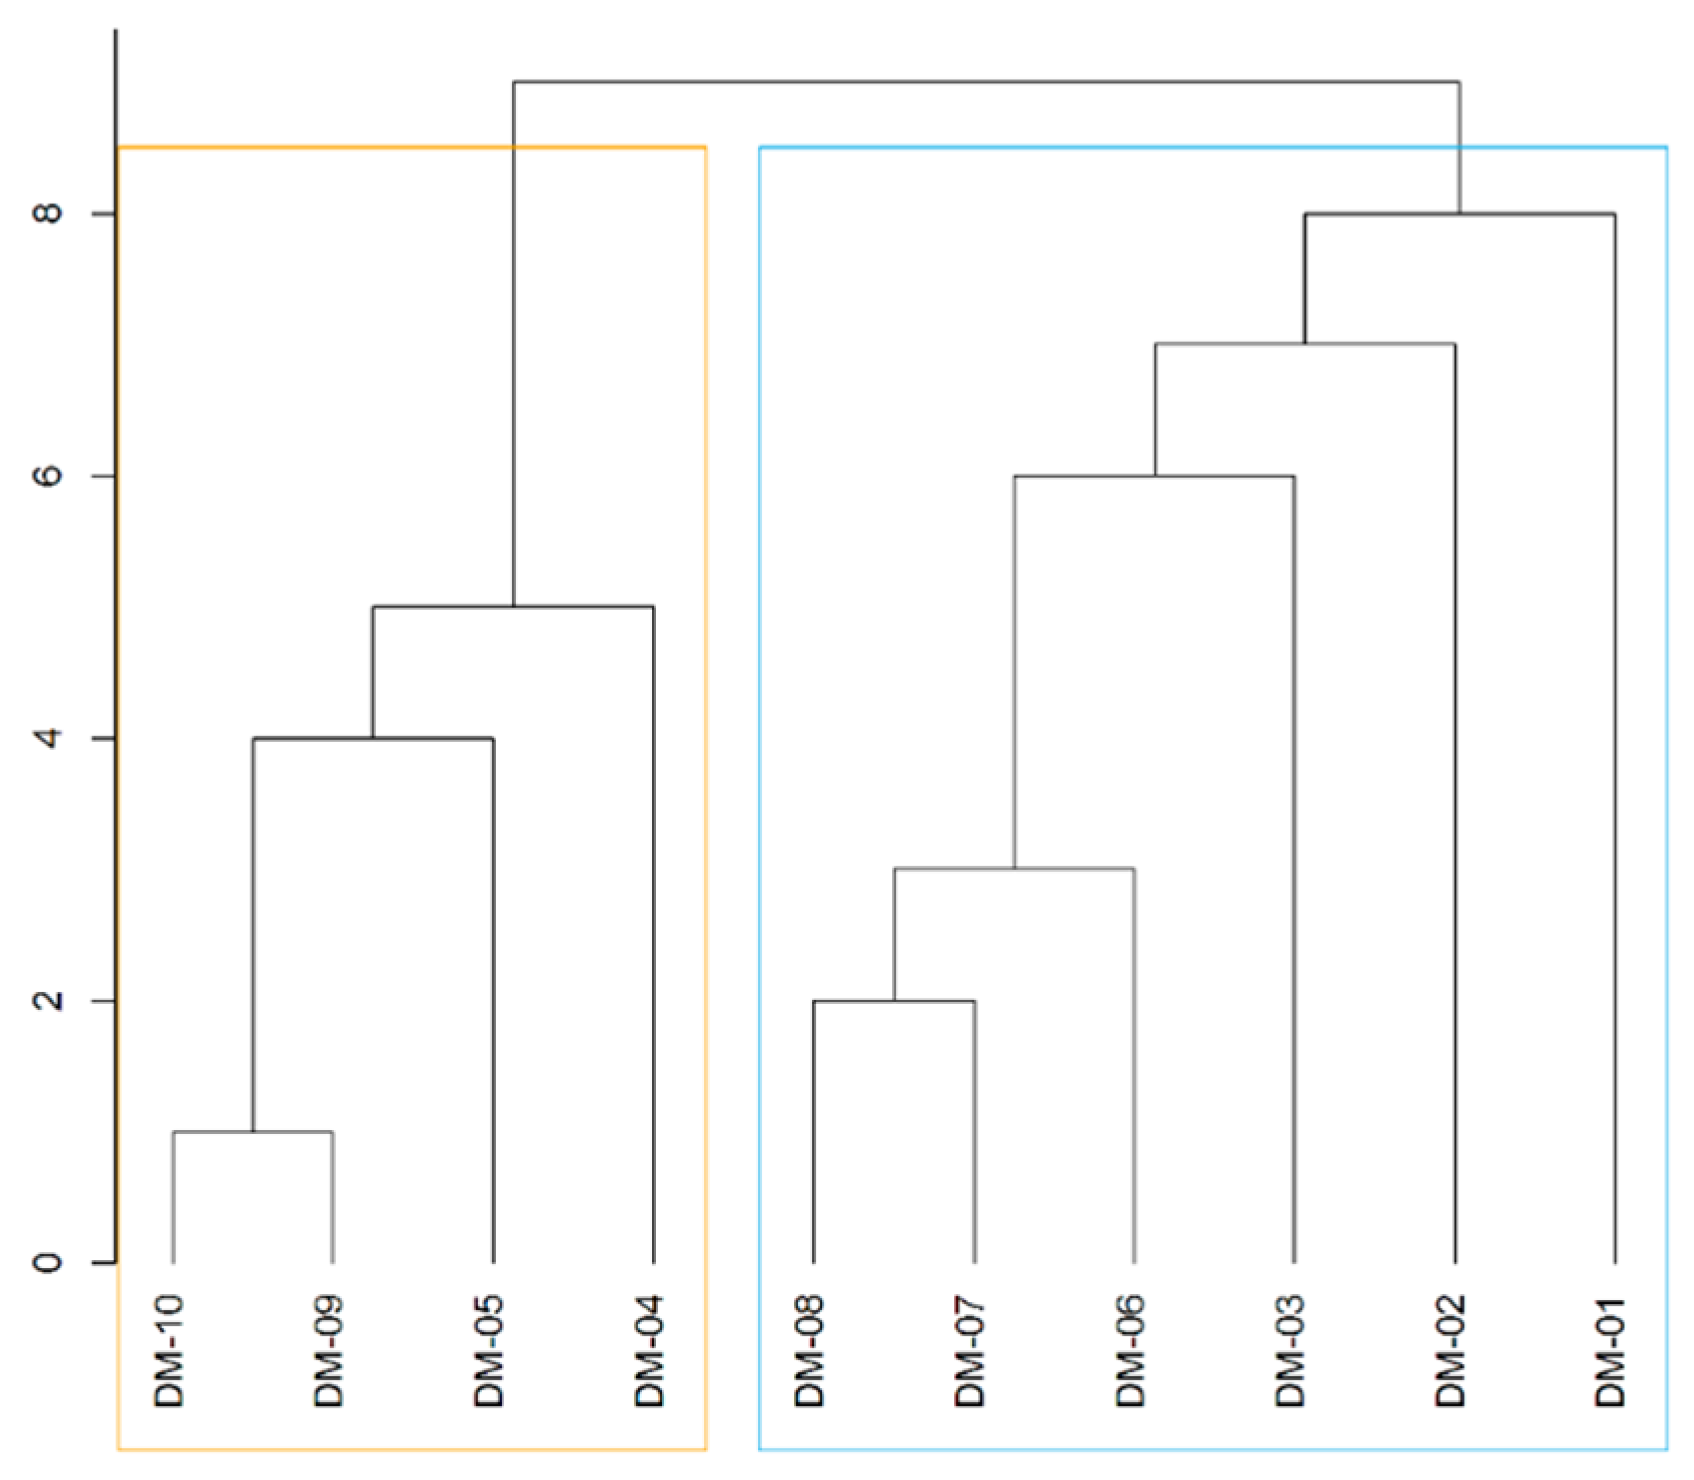
- Additional extensive knowledge is derived from comparing the decision trees that, respectively, cluster the DMs in terms of correlation and similarity. As a result, both trees classify the entire opinion group into two DM subgroups w.r.t. the total goal, i.e., {DM-4, DM-5, DM-9, DM-10} and {DM-1, DM-2, DM-3, DM-6, DM-7, DM-8}. As such, the results from classifying based on geometrical-based similarity and based on the statistical-based correlation, once again, adhere to each other. However, if they are further scrutinized, their tree shapes are, in fact, different, but the identified inconsistencies of opinions in the network graphs are, therefore, explained. Despite so, the knowledge about how the DMs are classified into two categories according to their main attitudes toward the four primary constructs is not only another significant empirical contribution, but also a guide in practice to couple with the divergent opinions from these groups at the top level of decision-making.
6.2. Conclusions
6.3. Recommendations
Author Contributions
Funding
Acknowledgments
Conflicts of Interest
References
- Baker, N.R. R&D project selection models: An assessment. IEEE Trans. Eng. Manag. 1974, 4, 165–171. [Google Scholar]
- Jia, Q.S. Efficient computing budget allocation for simulation-based policy improvement. IEEE Trans. Autom. Sci. Eng. 2012, 9, 342–352. [Google Scholar] [CrossRef]
- Ballantine, J.A.; Galliers, R.; Stray, S.J. The use and importance of financial appraisal techniques in the IS/IT investment decision-making process—Recent UK evidence. Proj. Apprais. 1995, 10, 233–241. [Google Scholar] [CrossRef]
- Ballantine, J.; Stray, S. Financial appraisal and the IS/IT investment decision making process. J. Inf. Technol. 1998, 131, 3–14. [Google Scholar] [CrossRef]
- Cakmak, M.A.; Gokpinar, E.S. Research & development project selection model and process approach in defense industry related programs: First phase-concept approval decision. In Proceedings of the Portland International Conference on Management of Engineering & Technology (PICMET 2007), Portland, OR, USA, 5–9 August 2007; pp. 2225–2235. [Google Scholar]
- Lu, L.Y.; Wu, C.H.; Kuo, T.C. Environmental principles applicable to green supplier evaluation by using multi-objective decision analysis. Int. J. Prod. Res. 2007, 45, 4317–4331. [Google Scholar] [CrossRef]
- Lin, S.S.; Juang, Y.S.; Chen, M.Y.; Yu, C.J. Analysis of green design criteria and alternative evaluation processes for 3C products. In Proceedings of the Asia Pacific Industrial Engineering & Management Systems Conference (APIEMS), Kitakyushu, Japan, 14–16 December 2009; pp. 14–16. [Google Scholar]
- Bartel, A.P. Productivity gains from the implementation of employee training programs. Ind. Relat. A J. Econ. Soc. 1994, 33, 411–425. [Google Scholar] [CrossRef]
- Storey, D.J.; Westhead, P. Management training in small firms—A case of market failure? Hum. Resour. Manag. J. 1997, 7, 61–71. [Google Scholar] [CrossRef]
- Loan-Clarke, J.; Boocock, G.; Smith, A.; Whittaker, J. Investment in management training and development by small businesses. Empl. Relat. 1999, 21, 296–311. [Google Scholar] [CrossRef]
- Harel, G.H.; Tzafrir, S.S. The effect of human resource management practices on the perceptions of organizational and market performance of the firm. Hum. Resour. Manag. 1999, 383, 185–199. [Google Scholar] [CrossRef]
- Antonacopoulou, E.P. Reconnecting education, development and training through learning: A holographic perspective. Educ. Train. 2000, 42, 255–264. [Google Scholar] [CrossRef]
- Bartel, A.P. Measuring the employer’s return on investments in training: Evidence from the literature. Ind. Relat. A J. Econ. Soc. 2000, 39, 502–524. [Google Scholar] [CrossRef]
- Ibrahim, A.B.; Soufani, K. Entrepreneurship education and training in Canada: A critical assessment. Educ. Train. 2002, 44, 421–430. [Google Scholar] [CrossRef]
- Simpson, M.; Tuck, N.; Bellamy, S. Small business success factors: The role of education and training. Educ. Train. 2004, 46, 481–491. [Google Scholar] [CrossRef]
- Aw, B.Y.; Roberts, M.J.; Winston, T. Export market participation, investments in R&D and worker training, and the evolution of firm productivity. World Econ. 2007, 30, 83–104. [Google Scholar]
- Salas, E.; Tannenbaum, S.I.; Kraiger, K.; Smith-Jentsch, K.A. The science of training and development in organizations: What matters in practice? Psychol. Sci. Public Int. 2012, 13, 74–101. [Google Scholar] [CrossRef] [PubMed]
- Wyss, M.; Wilner, A. The next generation fighter club: How shifting markets will shape Canada’s F-35 debate. Can. Mil. J. 2012, 12, 18–27. [Google Scholar]
- Chiang, Y.-Y. Taiwan President Says China’s Military Expansion Could Destabilize Asia. The New York Times. 2017. Available online: https://cn.nytimes.com/china/20171230/taiwan-china-tsai-ing-wen/zh-hant/dual/ (accessed on 26 March 2018).
- Marcum, M. A Comparative Study of Global Fighter Development Timelines. SITC Policy Briefs 2014, 3, 1–5. [Google Scholar]
- Zientek, J.B. Promoting Japan and South Korea’s Role in East Asian Security. Strategy Research Project of U.S. Army War College, Carlisle Barracks, PA, USA. 2010. Available online: http://www.dtic.mil/dtic/tr/fulltext/u2/a521814.pdf (accessed on 15 May 2018).
- Ausink, J.A.; Taylor, W.W.; Bigelow, J.H.; Brancato, K. Investment Strategies for Improving Fifth-Generation Fighter Training; RAND Corporation: Santa Monica, CA, USA, 2011; Available online: http://www.dtic.mil/dtic/tr/fulltext/u2/a537970.pdf (accessed on 15 May 2018).
- Charles, M.B.; Sinnewe, E. India’s indigenization of military aircraft design and manufacturing: Towards a fifth-generation fighter. In The Political Economy of Conflict in South Asia; Webb, M.J., Wijeweera, A., Eds.; Palgrave Macmillan: London, UK, 2015; pp. 93–113. [Google Scholar]
- Lockheed Martin Aeronautics. Lockheed Martin F-35 Lightning II. Wikipedia. 2006. Available online: https://en.wikipedia.org/wiki/Lockheed_Martin_F-35_Lightning_II (accessed on 15 March 2018).
- Hwang, C.-L.; Yoon, K.-S. Multiple Attribute Decision Making Methods and Applications: A State-of-the-Art Survey; Springer: Berlin/Heidelberg, Germany, 1981; ISBN 978-3-540-10558-9. [Google Scholar]
- Ali, Y.; Asghar, A.; Muhammad, N.; Salman, A. Selection of a Fighter Aircraft to Improve the Effectiveness of Air Combat in the War on Terror: Pakistan Air Force—A Case in Point. Int. J. Anal. Hierarchy Process 2017, 9. [Google Scholar] [CrossRef]
- Dožić, S.; Kalić, M. An AHP approach to aircraft selection process. Transp. Res. Procedia 2014, 3, 165–174. [Google Scholar] [CrossRef]
- Atique, M.S.A.; Barman, S.; Nafi, A.S.; Bellah, M.; Salam, M.A. Design of a fifth generation air superiority fighter. In Proceedings of the 11th AIP Conference Proceedings, Dhaka, Bangladesh, 18–20 December 2015; Volume 1754, p. 060003. [Google Scholar]
- Gertler, J. Air force F-22 Fighter Program; Library of Congress, Congressional Research Service: Washington, DC, USA, 2013. [Google Scholar]
- Munjulury, R.C.; Staack, I.; Abdalla, A.M.; Melin, T.; Jouannet, C.; Krus, P. Knowledge-based design for future combat aircraft concepts. In Proceedings of the 29th Congress of the International Council of the Aeronautical Sciences, St. Petersburg, Russia, 7–12 September 2014. [Google Scholar]
- Yang, R.; Shen, C.; Huang, F. Air combat tactics among the fourth generation fighters. J. Autom. Control Eng. 2015, 3, 290–293. [Google Scholar] [CrossRef]
- Johnson, K.F. The Need for Speed: Hypersonic Aircraft and the Transformation of Long Range Airpower. Ph.D. Thesis, Air University, Maxwell Air Force Base, AL, USA, 2005; pp. 1–73. [Google Scholar]
- Stillion, J.; Perdue, S. Air Combat Past, Present and Future. Briefing Slides, RAND Project Air Force, RAND Corporation. 2008. Available online: http://www.aereo.jor.br/wp-content/uploads/2016/02/2008_RAND_Pacific_View_Air_ Combat_Briefing.pdf (accessed on 4 May 2018).
- Lahtinen, T.M.; Koskelo, J.P.; Laitinen, T.; Leino, T.K. Heart rate and performance during combat missions in a flight simulator. Aviat. Space Environ. Med. 2007, 78, 387–391. [Google Scholar] [PubMed]
- Narayana, R.; Sudesh, K.K.; Girija, G.; Debanjan, M. Situation and threat assessment in BVR combat. In Proceedings of the AIAA Guidance, Navigation, and Control Conference, Guidance, Navigation, and Control and Co-located Conferences, Portland, OR, USA, 8–11 August 2011; pp. 1–6. [Google Scholar]
- Horváth, J. JAS 39 Gripen in Air Operations 23: Introduction. The Official Website of REPÜLÉSTUDOMÁNY. 2013. Available online: http://www.repulestudomany.hu/kulonszamok/2013_cikkek/2013-2-30-Jozsef_Horvath.pdf (accessed on 30 April 2018).
- Wolff, S. Using executable VDM++ models in an industrial application-self-defense system for fighter aircraft. Tech. Rep. Electron. Comp. Eng. 2012, 1, 1–18. [Google Scholar]
- Pratt, M. Marine Corps Aerial Electronic Warfare into the Future. United States Marine Corps, Command and Staff College, School of Advanced Warfighting, Marine Corps University. 2003. Available online: http://www.dtic.mil/dtic/tr/fulltext/u2/a510474.pdf (accessed on 28 April 2018).
- Layton, P. Combat thunderstorm, a new form of air warfare. Defence Today 2014, 11, 2–8. [Google Scholar]
- Hathaway, D.C. Germinating a New SEAD: The Implications of Executing the SEAD Mission in a UCAV. Ph.D. Thesis, Air University, Maxwell Air Force Base, AL, USA, 2001; pp. 1–88. [Google Scholar]
- Murman, E.M. Lean Aerospace Engineering; Littlewood Lecture AIAA-2008-4; Massachusetts Institute of Technology: Cambridge, MA, USA, 2008. [Google Scholar]
- Tirpak, J.A. Bomber Questions. Air Force Mag. 2001, 84, 36–43. [Google Scholar]
- Ball, S. The New Reality. In Signals: The Lockheed Martin UK News Update; Rood, P., Ed.; Lockheed Martin UK, Winter 2010/2011: London, UK, 2010; pp. 2–4. [Google Scholar]
- Schriver, R.; Stokes, M. Evolving Capabilities of the Chinese People’s Liberation Army: Consequences of Coercive Aerospace Power for United States Conventional Deterrence. Official Website of the Project 2049 Institute. 2008. Available online: https://project2049.net/documents/ChineseCoerciveAerospaceCampaign.pdf (accessed on 3 May 2018).
- Helldin, T.; Falkman, G. Human-centered automation for improving situation awareness in the fighter aircraft domain. In Proceedings of the 2012 IEEE International Multi-Disciplinary Conference on Cognitive Methods in Situation Awareness and Decision Support (CogSIMA), New Orleans, LA, USA, 6–8 March 2012; pp. 191–197. [Google Scholar]
- Alfredson, J.; Holmberg, J.; Andersson, R.; Wikforss, M. Applied cognitive ergonomics design principles for fighter aircraft. In Proceedings of the 2011 International Conference on Engineering Psychology and Cognitive Ergonomics, Orlando, FL, USA, 9–14 July 2011; Springer: Berlin/Heidelberg, Germany, 2011; pp. 473–483. [Google Scholar]
- Kaminani, S. Human computer interaction issues with touch screen interfaces in the flight deck. In Proceedings of the 30th IEEE/AIAA Digital Avionics Systems Conference (DASC 2011), Seattle, DC, USA, 16–20 October 2011. [Google Scholar]
- Mulgund, S.; Rinkus, G.; Illgen, C.; Zacharias, G. Situation Awareness Modeling and Pilot State Estimation for Tactical Cockpit Interfaces. In Proceedings of the Human-Computer Interaction International 1997, San Francisco, CA, USA, 24–29 August 1997. [Google Scholar]
- Wang, H.Y.; Bian, T.; Xue, C.Q. Experimental evaluation of fighter’s interface layout based on eye tracking. Electro Mech. Eng. 2011, 27, 50–53. [Google Scholar]
- Groh, J.L. Network-Centric Warfare: Leveraging the Power of Information. In U.S. Army War College Guide to National Security Issues; U.S. Army War College: Carlisle, PA, USA, 2008; pp. 323–338. [Google Scholar]
- James, L.D. Airmen: Delivering decision advantage. Air Space Power J. 2012, 6, 4–11. [Google Scholar]
- Shukla Shubhendu, S.; Vijay, J. Applicability of artificial intelligence in different fields of life. Int. J. Sci. Eng. Res. 2013, 1, 28–35. [Google Scholar]
- Capraro, G.T.; Berdan, G.B.; Liuzzi, R.A.; Wicks, M.C. Artificial intelligence and sensor fusion. In Proceedings of the IEEE International Conference on Integration of Knowledge Intensive Multi-Agent Systems 2003, Cambridge, MA, USA, 30 September–4 October 2003; pp. 591–595. [Google Scholar]
- Bolkcom, C.; Anthony, M. F-35 Lightning II Joint Strike Fighter (JSF) Program: Background, Status, and Issues; CRS Report for Congress RL30563; Congressional Research Service, Library of Congress: Washington, DC, USA, 2009. [Google Scholar]
- Higby, L.C.P. Promise and reality: Beyond visual range (BVR) air-to-air combat. In Air War College (AWC) Electives Program: Air Power Theory, Doctrine, and Strategy: 1945–Present; Air War College Seminar, Virginia Military Institute, Air University: Sumter, CA, USA, 2005. [Google Scholar]
- Arik, M.; Akan, O.B. Enabling cognition on electronic counter-measure systems against next-generation radars. In Proceedings of the 2015 IEEE Military Communications Conference (MILCOM 2015), Tampa, FL, USA, 16–28 October 2015; pp. 1103–1108. [Google Scholar]
- Okoli, C.; Pawlowski, S.D. The Delphi method as a research tool: An example, design considerations and applications. Inf. Manag. 2004, 42, 15–29. [Google Scholar] [CrossRef]
- Saaty, T.L. A scaling method for priorities in hierarchical structures. J. Math. Psychol. 1977, 15, 59–62. [Google Scholar] [CrossRef]
- Akaa, O.U.; Abu, A.; Spearpoint, M.; Giovinazzi, S. A Group-AHP Decision Analysis for the Selection of Applied Fire Protection to Steel Structures. Fire Saf. J. 2016, 86, 95–105. [Google Scholar] [CrossRef]
- Bian, T.; Hu, J.; Deng, Y. Identifying influential nodes in complex networks based on AHP. Phys. A Stat. Mech. Appl. 2017, 479, 422–436. [Google Scholar] [CrossRef]
- Dong, Q.; Cooper, O. An orders-of-magnitude AHP supply chain risk assessment framework. Int. J. Prod. Econ. 2016, 182, 144–156. [Google Scholar] [CrossRef]
- Dweiri, F.; Kumar, S.; Khan, S.A.; Jain, V. Designing an integrated AHP based decision support system for supplier selection in automotive industry. Expert Syst. Appl. 2016, 62, 273–283. [Google Scholar] [CrossRef]
- Erdogan, S.A.; Šaparauskas, J.; Turskis, Z. Decision making in construction management: AHP and expert choice approach. Procedia Eng. 2017, 172, 270–276. [Google Scholar] [CrossRef]
- Govindan, K.; Kaliyan, M.; Kannan, D.; Haq, A.N. Barriers analysis for green supply chain management implementation in Indian industries using analytic hierarchy process. Int. J. Prod. Econ. 2014, 147, 555–568. [Google Scholar] [CrossRef]
- Hillerman, T.; Souza, J.C.F.; Reis, A.C.B.; Carvalho, R.N. Applying clustering and AHP methods for evaluating suspect healthcare claims. J. Comp. Sci. 2017, 19, 97–111. [Google Scholar] [CrossRef]
- Nikou, S.; Mezei, J. Evaluation of mobile services and substantial adoption factors with analytic hierarchy process (AHP). Telecomm. Policy 2013, 37, 915–929. [Google Scholar] [CrossRef]
- Samuel, O.W.; Asogbon, G.M.; Sangaiah, A.K.; Fang, P.; Li, G. An integrated decision support system based on ANN and Fuzzy AHP for heart failure risk prediction. Expert Syst. Appl. 2017, 68, 163–172. [Google Scholar] [CrossRef]
- Ho, H.-P.; Chang, C.-T.; Ku, C.-Y. On the location selection problem using analytic hierarchy process and multi-choice goal programming. Int. J. Syst. Sci. 2013, 44, 94–108. [Google Scholar] [CrossRef]
- Kokangül, A.; Polat, U.; Dağsuyu, C. A new approximation for risk assessment using the AHP and Fine Kinney methodologies. Saf. Sci. 2017, 91, 24–32. [Google Scholar] [CrossRef]
- Li, W.; Yu, S.; Pei, H.; Zhao, C.; Tian, B. A hybrid approach based on fuzzy AHP and 2-tuple fuzzy linguistic method for evaluation in-flight service quality. J. Air Transp. Manag. 2017, 60, 49–64. [Google Scholar] [CrossRef]
- Szulecka, J.; Zalazar, E.M. Forest plantations in Paraguay: Historical developments and a critical diagnosis in a SWOT-AHP framework. Land Use Policy 2017, 60, 384–394. [Google Scholar] [CrossRef]
- Xu, Z.; Liao, H. Intuitionistic fuzzy analytic hierarchy process. IEEE Trans. Fuzzy Syst. 2014, 22, 749–761. [Google Scholar] [CrossRef]
- Sadiq, R.; Tesfamariam, S. Environmental decision-making under uncertainty using intuitionistic fuzzy analytic hierarchy process (IF-AHP). Stoch. Environ. Res. Risk Assess. 2009, 23, 75–91. [Google Scholar] [CrossRef]
- Zhuang, Z.-Y.; Yang, L.-W.; Lee, M.-H.; Wang, C.-Y. ‘MEAN+R’: Implementing a web-based, multi-participant decision support system using the prevalent MEAN architecture with R based on a revised intuitionistic-fuzzy multiple attribute decision-making model. Microsyst. Technol. 2018, in press. [Google Scholar] [CrossRef]
- Fernandez, J.F.G.; Marquez, A.C. Managing Maintenance Strategy. In Maintenance Management in Network Utilities: Framework and Practical Implementation; Fernandez, J.F.G., Marquez, A.C., Eds.; Springer: Berlin, Germany, 2012; Chapter 6; pp. 149–183. [Google Scholar]
- Marquez, A.C. Criticality Analysis for Asset Priority Setting. In The Maintenance Management Framework: Models and Methods for Complex Systems Maintenance; Marquez, A.C., Ed.; Springer: Berlin, Germany, 2007; Chapter 9; pp. 107–126. [Google Scholar]
- Zhuang, Z.-Y.; Chiang, I.-J.; Su, C.-R.; Chen, C.-Y. Modelling the decision of paper shredder selection using analytic hierarchy process and graph theory and matrix approach. Adv. Mech. Eng. 2017, 9, 1–11. [Google Scholar] [CrossRef]


| Evaluation Factors | Operational Definition |
|---|---|
| Hypersonic | The features of sonic speed are divided into the following four categories: Subsonic: less than 0.8 Mach Transonic: less than 1.2 Mach and greater than 0.8 Mach Supersonic: less than 5.0 Mach and greater than 1.2 Mach Hypersonic: greater than 5.0 Mach Hypersonic is also known as very high supersonic, meaning the speed is much higher than the supersonic state. In general, at 5 Mach there will be some integrative effects not occurred at supersonic speeds, which are important for propulsion systems and vehicles. This technology has a decisive influence on rapid combat and mobile combat. |
| Supercruise capability | Cruising Speed means the speed of a fighter flying while the engine consumes the minimum fuels for certain flying distance. Similarly, Super Cruising Speed is the speed of a fighter remaining at supersonic state with minimum consumption of fuels for certain flying distance, which usually refers to the condition of a fighter flying over 1.5 Mach at supersonic state for over 30 min. after the engine stops using afterburner for speeding. |
| Vertical/short take-off and landing capability | Vertical landing refers to a process that a Fixed-wing airplane carries out a lift vertically or without a runway. Nevertheless, the requirement for short take-off and landing (STOL) is the fighter being capable of lifting/landing within 300–500 m running distance in fully equipped condition (fully equipped with available weapons), which is further reduced to 250 m in New Generation Fighter. |
| Super maneuverability | Super manoeuvrability of fighters is a capability comprehensively evaluated by manoeuvrability and mobility, demonstrated by the capability of changing manoeuvre state and dimension, and in brief, the capability of changing position. Evaluation of Super manoeuvrability refers to assessing variation of the indicators such as acceleration capability, climbing velocity, steadiness, transient circling angular velocity, and rolling velocity in certain flying time. |
| Multi-mission execution capability | Multi-mission execution capability means the original model can be adapted to execution of multiple missions, instead of single task, without much modification on it. The capability could be performed in integrative execution of more than two of the missions like air combat, counter-surface attack, reconnaissance, bombardment, and electronic warfare |
| Beyond visual range awareness capability | Beyond Visual Range, abbreviated as BVR, refers to the distance beyond visual range of naked eyes and meanwhile the reliance on High-Tech Device to detect or deploy weapon against unknown target [55]. The distance is yet well-defined or unified, but approximately takes tens kilometres to be counted. Therefore, the BVR awareness capability could be referred to not only the capability to sense dimension of time and space in corresponding to environmental factors beyond visual range in a specific event, but also to process and understand the meaning of the factors, and ultimately to predict the outcome when variations, such as time or certain incidence, were added to the algorithm. |
| Advanced cockpit and human-machine interface | Advanced cockpit and human-machine interface refers to fighters equipped with integrative display showing various information provided by avionic fire control system and sensors, which include not only fire control, fuel, loaded weapon, radar warning, but also tactical path and condition sensing of engaging fighters. Advanced cockpit and human-machine interface is usually incorporated with large-sized display to show BVR and whole-field condition sensing information of the fighter, and in addition, applies helmet display for showing information in visual distance and other tactical sensing indicators. Furthermore, Advanced cockpit and human-machine interface will incorporate advanced devices such as Hands on Throttle-and-Stick (HOTAS), touching design, helmet chasing control... etc. |
| Rapid electronic warfare countermeasures and interference capability | Electronic warfare countermeasures refer to capability of fighters to suppress or devastate enemies in application of electromagnetic equipment or other means. Usually, the countermeasure mission covers interfering in enemies’ electromagnetic wave signal receiving and even enemies’ electromagnetic devices. Moreover, fighters also need the influential capability brought by reducing or suppressing enemies’ counteraction, which usually includes methods such as changing radar channels or electromagnetic wave frequencies, radio communication channels. In total, fighters are supposed to be equipped with active and passive interfering capability [56]. Active interfering means sending signal actively to refrain enemy from receiving or even using electromagnetic signals effectively for communication, for example, by dispatching interfering electro signals to cause enemies’ communication failure. Oppositely, passive interfering means fighters do not send signals actively for inference. Instead, they use Chaff for cluttering the radar, special coating material for reduction of far-red signal, shortening detectable distance or lowering possibility of being detected by enemies to ultimately reach the goal of interfering enemies’ application of electromagnetic signals. |
| Super information advantage/artificial intelligence capability | Along with the development and application of internet technology, fighters has become a critical part of the modern combat operation and commanding system. Equipped with ultra-high speed information processing capability and integrative information exchange capability, fighters can make strategy analysis through surrounding combat information or various commanding information, and in further simultaneously make the best combat strategy from multiple combat options ranging from independent or joint operation to commanding peer for execution by superiority on the information processing capability. |
| Stealth | By integrating specialized technics and designs including surface coating, material property, special compound material and appearance designs, fighters can lower the possibility being detected or shorten the detectable distance. The principle military Stealth technology development is focus on reducing radar, far-red light, visible light, sound wave detection. |
| Beyond visual range integrated attack capability | Beyond Visual Range (BVR) refers to the distance beyond visual range of naked eyes and meanwhile the reliance on High-Tech Device to detect or deploy weapon against unknown target [55]. The distance is yet well-defined or unified, but approximately takes tens kilometers to be counted. Therefore, beyond visual range integrated attack capability (BVR attack capability), indicates that fighters can apply multiple weapons, such as Active/semi-active radar homing system, in conduction of attack beyond visual range by equipped avionic devices or information provided by the commanding system. |
| Various weapon systems integrating capability | Various weapon systems integrated with fighters should include not only traditional ammunition, electronic warfare equipment, and reconnaissance photographing device but also new concept weapons, such as Directed Energy Weapons (DEWs) like Laser Weapons, Microwave Weapons, Particle-Beam Weapons, Kinetic Weapons like kinetic kill vehicles, and Electromagnetic Guns. Fighters equipped with various weapon systems will enhance combat capability and return on investment (ROI) and win by unpredictable moves. |
| Stratification | Type | #DMs | % |
|---|---|---|---|
| Gender | Male | 10 | 100% |
| Female | 0 | 0% | |
| Degree | Ph.D. | 4 | 40% |
| M.Sc. | 6 | 60% | |
| Occupancy | Managing | 3 | 30% |
| Advising | 4 | 40% | |
| Staff | 3 | 30% | |
| In Service | 5–10 years | 1 | 10% |
| 11–20 years | 1 | 10% | |
| >21 years | 8 | 80% |
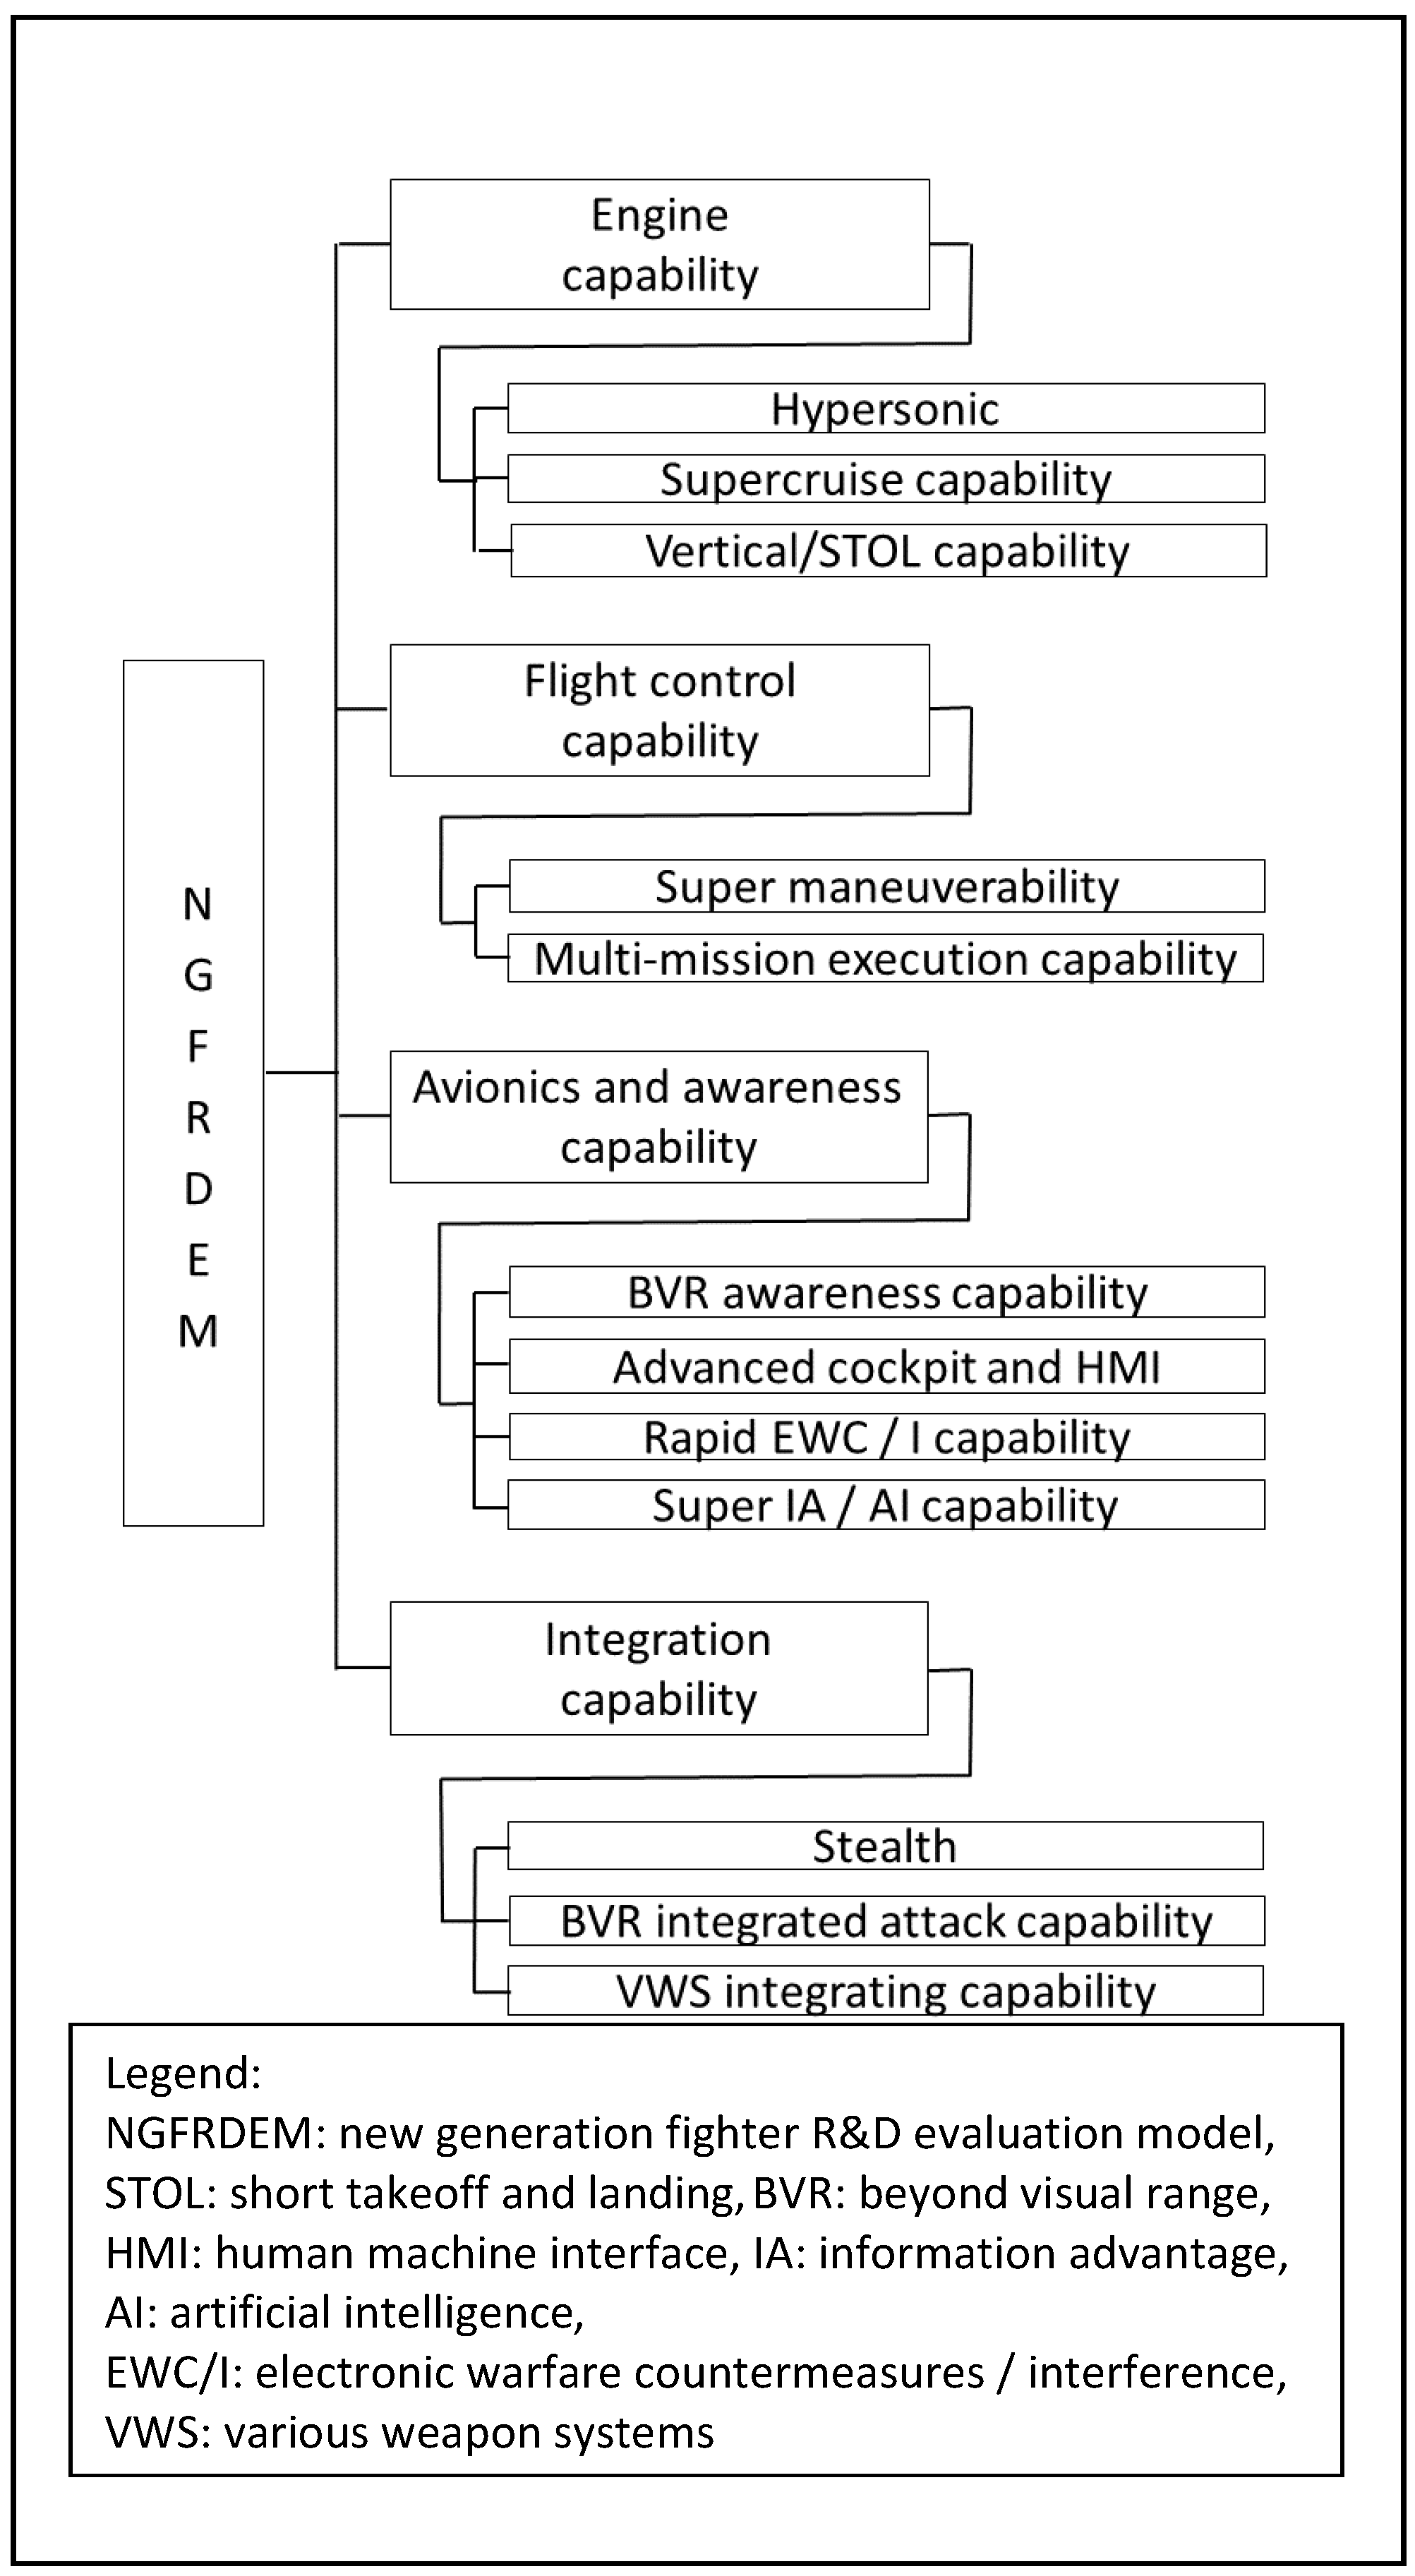
| Decision Goal | Constructs | Criteria |
|---|---|---|
| The Suitable Design of a Next Generation Fighting Aircraft | Engine Capability (PC-A) | Vertical/short Take-off/landing Capability (AC-1) |
| Super-cruise Capability (AC-2) | ||
| Hypersonic (AC-3) | ||
| Flying Control Capability (PC-B) | Multi-mission Execution Capability (BC-1) | |
| Super Maneuverability (BC-2) | ||
| Avionics and Awareness Capability (PC-C) | Super Information Advantage and AI Capability (CC-1) | |
| Beyond-visual Range Awareness Capability (CC-2) | ||
| Rapid e-Warfare Countermeasures and Interference Capability (CC-3) | ||
| Advanced Cockpit and Human Machine Interface (CC-4) | ||
| Integration Capability (PC-D) | Stealth (DC-1) | |
| Beyond-visual Range Integrated Attack Capability (DC-2) | ||
| Various Weapon Systems Integrating Capability (DC-3) |
| Constructs | Relative Importance | Ordinal Rank | Consistency Analysis |
|---|---|---|---|
| (PC-A) Engine capability | 0.366 | 1 | Inconsistency = 0.00934 with 0 missing judgments. |
| (PC-D) Integration capability | 0.269 | 2 | |
| (PC-C) Avionics and awareness capability | 0.245 | 3 | |
| (PC-B) Flying control capability | 0.120 | 4 |
| Criteria | Relative Importance | Ordinal Rank | Consistency Analysis |
|---|---|---|---|
| (AC-1) Vertical/short take-off and landing capability | 0.705 | 1 | Inconsistency = 0.03 with 0 missing judgments. |
| (AC-2) Super-cruise capability | 0.215 | 2 | |
| (AC-3) Hypersonic | 0.080 | 3 |
| Criteria | Relative Importance | Ordinal Rank | Consistency Analysis |
|---|---|---|---|
| (BC-1) Multi-mission execution capability | 0.636 | 1 | Inconsistency = 0 with 0 missing judgments. |
| (BC-2) Super manoeuvrability | 0.364 | 2 |
| Criteria | Relative Importance | Ordinal Rank | Consistency Analysis |
|---|---|---|---|
| (CC-1) Super information advantage/AI capability | 0.361 | 1 | Inconsistency = 0.02 with 0 missing judgments. |
| (CC-2) Beyond visual range awareness capability | 0.282 | 2 | |
| (CC-3) Rapid electronic warfare countermeasures and interference capability | 0.199 | 3 | |
| (CC-4) Advanced cockpit and human-machine interface | 0.158 | 4 |
| Criteria | Relative Importance | Ordinal Rank | Consistency Analysis |
|---|---|---|---|
| (DC-1) Stealth | 0.366 | 1 | Incon. = 0.03 with 0 missing judgments. |
| (DC-2) Beyond visual range integrated attack capability | 0.339 | 2 | |
| (DC-3) Various weapon systems integrating capability | 0.294 | 3 |
| (a)The Matrix of CWVs under Total Goal Compiled for the DMs | |||||||||||
| Criteria | DM-1 | DM-2 | DM-3 | DM-4 | DM-5 | DM-6 | DM-7 | DM-8 | DM-9 | DM-10 | Aggregated |
| PC-A | 0.429669 | 0.54304 | 0.439606 | 0.129464 | 0.091736 | 0.645984 | 0.620258 | 0.465819 | 0.0625 | 0.183708 | 0.361179 |
| PC-B | 0.042796 | 0.135989 | 0.08001 | 0.040752 | 0.066449 | 0.222832 | 0.081912 | 0.27714 | 0.0625 | 0.136885 | 0.114727 |
| PC-C | 0.113017 | 0.076465 | 0.411034 | 0.309636 | 0.228508 | 0.086187 | 0.243843 | 0.16107 | 0.4375 | 0.172599 | 0.223986 |
| PC-D | 0.414518 | 0.244505 | 0.06935 | 0.520148 | 0.613307 | 0.044997 | 0.053986 | 0.09597 | 0.4375 | 0.506808 | 0.300109 |
| (b)The Compiled Matrix of CWVs under the Engine Capability Construct (PC-A) | |||||||||||
| Criteria | DM-1 | DM-2 | DM-3 | DM-4 | DM-5 | DM-6 | DM-7 | DM-8 | DM-9 | DM-10 | Aggregated |
| AC-3 | 0.062254 | 0.075284 | 0.077839 | 0.065391 | 0.080688 | 0.070421 | 0.243756 | 0.056743 | 0.066667 | 0.077839 | 0.087688 |
| AC-2 | 0.236438 | 0.124351 | 0.234432 | 0.199419 | 0.292328 | 0.206212 | 0.066933 | 0.294638 | 0.466667 | 0.234432 | 0.235585 |
| AC-1 | 0.701308 | 0.800365 | 0.687729 | 0.735190 | 0.626984 | 0.723367 | 0.689311 | 0.648619 | 0.466667 | 0.687729 | 0.676727 |
| (c)The Compiled Matrix of CWVs under the Flying Control Capability Construct (PC-B) | |||||||||||
| Criteria | DM-1 | DM-2 | DM-3 | DM-4 | DM-5 | DM-6 | DM-7 | DM-8 | DM-9 | DM-10 | Aggregated |
| BC-2 | 0.142857 | 0.166667 | 0.833333 | 0.875000 | 0.250000 | 0.125000 | 0.500000 | 0.250000 | 0.500000 | 0.166667 | 0.380952 |
| BC-1 | 0.857143 | 0.833333 | 0.166667 | 0.125000 | 0.750000 | 0.875000 | 0.500000 | 0.750000 | 0.500000 | 0.833333 | 0.619048 |
| (d)The Compiled Matrix of CWVs under the Avionics and Awareness Capability Construct (PC-C) | |||||||||||
| Criteria | DM-1 | DM-2 | DM-3 | DM-4 | DM-5 | DM-6 | DM-7 | DM-8 | DM-9 | DM-10 | Aggregated |
| CC-1 | 0.607784 | 0.118621 | 0.608204 | 0.037579 | 0.206250 | 0.357440 | 0.250392 | 0.279167 | 0.122375 | 0.208063 | 0.279587 |
| CC-2 | 0.044341 | 0.152306 | 0.047210 | 0.306580 | 0.164583 | 0.088841 | 0.050765 | 0.391667 | 0.425406 | 0.068007 | 0.173971 |
| CC-3 | 0.185842 | 0.073467 | 0.196865 | 0.217168 | 0.341667 | 0.503527 | 0.081885 | 0.164583 | 0.047306 | 0.117358 | 0.192967 |
| CC-4 | 0.162033 | 0.655606 | 0.147721 | 0.438673 | 0.287500 | 0.050193 | 0.616958 | 0.164583 | 0.404914 | 0.606572 | 0.353475 |
| (e)The Compiled Matrix of CWVs under the Integration Capability Construct (PC-D) | |||||||||||
| Criteria | DM-1 | DM-2 | DM-3 | DM-4 | DM-5 | DM-6 | DM-7 | DM-8 | DM-9 | DM-10 | Aggregated |
| DC-1 | 0.665070 | 0.234432 | 0.723506 | 0.327778 | 0.327778 | 0.091528 | 0.702839 | 0.333333 | 0.261111 | 0.090352 | 0.375773 |
| DC-2 | 0.231082 | 0.077839 | 0.193186 | 0.411111 | 0.261111 | 0.707060 | 0.182234 | 0.333333 | 0.327778 | 0.555927 | 0.328066 |
| DC-3 | 0.103847 | 0.687729 | 0.083308 | 0.261111 | 0.411111 | 0.201412 | 0.114927 | 0.333333 | 0.411111 | 0.353721 | 0.296161 |
| Criteria | DM-1 | DM-2 | DM-3 | DM-4 | DM-5 | DM-6 | DM-7 | DM-8 | DM-9 | DM-10 | Aggregated |
| Strength | Weakness |
| For exploring multi-criteria decision-making issues, many solutions use Delphi and AHP methods to set evaluation criteria and build hierarchical evaluation model. Then, these solutions can understand numerically assessed group-based priority for the constructs and the criteria under each constructs. Comparing with other solutions, the proposed framework uses Delphi and AHP methods to receive numerically assessed group-based priority of the constructs and the criteria under each constructs. Moreover, it also uses several DDDM methods to analyse opinions of individual DM to get the Similarities and Diversities between/among DMs’ opinions. The analysis results of the DDDM methods would help users to understand completely and deeply ideas of an individual DM or groups of decision makers’ for multi-criteria decision-making issues. | Comparing with traditional studies about multi-criteria decision-making issues, the proposed education framework in this study will teach users to use more methods to receive more information to identify opinion gaps and implications that might help them to solve their multi-criteria decision-making issue further. Therefore, in addition to understanding Delphi and AHP methods, users need to spend extra time to familiarize themselves with the relevant analysis methods of the DDDM method in the proposed framework; it will be the shortcoming of the proposed framework. Moreover, users will take more time to analyse DMs’ opinions with the DDDM method. |
| Opportunity | Threat |
| With the DDDM analysis, the proposed framework can help users to understand further Similarities and Diversities between/among opinions from an individual DM or groups of DMs with Correlation, Cosine Similarities, SNA Network Diagram, Heat Map, Decision Tree, etc. The analysis results of the Correlation, Cosine Similarities, SNA Network Diagram, Heat Map, Decision Tree methods might excite users’ other views about the multi-criteria decision-making opinions of DMs. | With the DDDM analysis, the proposed framework might present different opinions of individual DM or groups of DMs and find opinion gaps between/among DMs. If there is no good opinion communication bridge among/between individual or groups of DMs; the presented results might cause an enmity among DMs. This might be a hidden worry issue for a R&D institution to perform a large R&D project smoothly. |
© 2018 by the authors. Licensee MDPI, Basel, Switzerland. This article is an open access article distributed under the terms and conditions of the Creative Commons Attribution (CC BY) license (http://creativecommons.org/licenses/by/4.0/).
Share and Cite
Chi, L.-P.; Zhuang, Z.-Y.; Fu, C.-H.; Huang, J.-H. A Knowledge Discovery Education Framework Targeting the Effective Budget Use and Opinion Explorations in Designing Specific High Cost Product. Sustainability 2018, 10, 2742. https://doi.org/10.3390/su10082742
Chi L-P, Zhuang Z-Y, Fu C-H, Huang J-H. A Knowledge Discovery Education Framework Targeting the Effective Budget Use and Opinion Explorations in Designing Specific High Cost Product. Sustainability. 2018; 10(8):2742. https://doi.org/10.3390/su10082742
Chicago/Turabian StyleChi, Li-Pin, Zheng-Yun Zhuang, Chen-Hua Fu, and Jen-Hung Huang. 2018. "A Knowledge Discovery Education Framework Targeting the Effective Budget Use and Opinion Explorations in Designing Specific High Cost Product" Sustainability 10, no. 8: 2742. https://doi.org/10.3390/su10082742
APA StyleChi, L.-P., Zhuang, Z.-Y., Fu, C.-H., & Huang, J.-H. (2018). A Knowledge Discovery Education Framework Targeting the Effective Budget Use and Opinion Explorations in Designing Specific High Cost Product. Sustainability, 10(8), 2742. https://doi.org/10.3390/su10082742