1. Introduction
Economic growth mode in China has entered into a new stage where the mode of high speed economic growth has changed into a steady growth model, and innovation has become an important driving factor for the sustainable development of the regional economy. On the one hand, innovation can provide direction to create new industries and activate traditional industries for the sustainable development of a regional economy; on the other hand, it can provide strong guarantee for the sustainable development of a regional economy, and many types of technologies needed for new and traditional industries can be realized by innovation. Although all regions attach great importance to the role of regional innovation in the regional economy, there is a phenomenon of unbalanced development among different regions that can be explained from two aspects: supply and demand. From the perspective of demand, the level of regional economic development determines more needs of regional innovation to a certain extent. In the developed areas, regional innovation is more vigorous because more regional innovation is needed to support economic development [
1]. From the perspective of supply, the abundance of innovation resources in the region is an important factor determining regional innovation output. The ability of the developed areas to attract innovative resources is far greater than the less developed areas. The agglomeration degree of innovation elements and the uneven degree among regions are accelerating in China [
2], which leads to the development of disequilibrium of regional innovation output in a long term. This study attempts to focus on the process and the mechanism of disequilibrium development of regional innovation from the perspective of R&D personnel. The developing tendency and speed of the disequilibrium of regional innovation output are analyzed by using σ convergent model and
β convergent model respectively during the period of analyzing the process of the disequilibrium development where the disequilibrium is measured from three aspects: patent output, scale of R&D personnel, and efficiency of R&D personnel. The LMDI method is used to analyze the character of regional innovation output by using R&D personnel as an important endogenous factor during the period of analyzing the mechanism of the disequilibrium development.
The role of regional innovation in regional economic development is well-known, but there is no consensus on how to measure regional innovation [
3]. There are three main measurement approaches in the current empirical literature. The first and most widely used approach is the use of a single indicator to measure. The index of patent and its related indexes are widely used whose advantage is that it can directly reflect the total output of innovation in the region [
4]. The second approach is to use a set of evaluation index system to evaluate regional innovation capability according to the characteristics of different regions. The main advantage of this method is that it can reflect the innovation characteristics of the region according to different indicators, so as to be more objective and suitable for regional assessment of large regional differences [
5,
6]. The third approach is the comprehensive index evaluation method. This approach is widely used by countries and regions, for example, the Global Innovation Index and the StatsAmerica Innovation Index. In this paper, the main purpose is to study the influence of R&D personnel on regional innovation disequilibrium. In order to correspond the impact of R&D personnel to the index of regional innovation, the single index of patent index is selected.
There are many scholars studying the influence factors of regional innovation. Furman [
7] believes that national innovation capability depends on innovative infrastructure, a more specific innovation environment in industrial clusters, and the links between them. Wei et al. [
8] improved the analysis framework of Furman, and studied the influencing factors of China’s provincial innovation ability from 1998 to 2007. The results showed that the regional innovation ability was influenced not only by the innovative basic conditions such as the scale of R&D activities, but also by the efficiency of regional innovation. Some scholars also study influence factors on regional innovation from the perspective of regional knowledge. Giovanni [
9] studied the influence of regional knowledge which was divided into four aspects: human capital, relational capital, structural capital, and social capital. Regional knowledge affects the output level of innovation to a great extent, however the R&D personnel is an important carrier of regional knowledge. Therefore, this paper chooses to study regional innovation from the perspective of R&D personnel. Florian [
10] and Ruediger [
11] studied regional knowledge from the perspective of forming conditions and evolution factors of regional knowledge respectively. Regional innovation and regional knowledge accumulation have been playing an important role in regional economic growth within the new economic growth theory since the 1980s. Many scholars have put forward the corresponding views for the importance of regional innovation. For example, Cantner [
12] believes that regional knowledge is the basic condition for the formation of different regional innovation capabilities. The new growth theory, represented by Romer [
13] and Lucas [
14], holds that capital accumulation and innovation are important forces for promoting technological progress and economic growth. Most scholars focus on knowledge production activities from the perspective of input–output. For example, Scherer [
15] took R&D investment and R&D personnel as input variables, and took the number of patents and sales of new products as knowledge output, and use the production function to discuss the relationship between input and output. Then, the knowledge production function was expanded in many aspects, including the time lag between input and output, the problem of knowledge stock and the discussion of knowledge spillover effect. Wu et al. [
16] used the knowledge production function to study regional innovation in China.
The research on the disequilibrium development of regional innovation focuses on two aspects. The first aspect is the analysis of the factors influencing the disequilibrium development of regional innovation. Many scholars explore these factors from many perspectives. From the perspective of investment, R&D investment and human capital investment in a region are important factors leading to regional disequilibrium. From the perspective of regional industry, the degree of industrial agglomeration in a region also affects the ability of regional innovation to a certain extent. Feldman [
17] concluded that geographic clustering and the coordinating functions of a variety of supply factors play a significant role in this disparity, while Scott [
18] and Storper [
19] believed that technological markets and social networks are crucial to the regional innovation ability. The second aspect is to use different approaches to analyze the disequilibrium development of regional innovation. Cheng et al. [
20] used the Gini coefficient, Theil index and regional separation coefficient to study the differences of regional innovation ability. Zhang et al. [
21] studied the innovation ability of prefecture level cities, and concluded that R&D personnel and investment were the main factors that affected regional innovation disparity. Wang et al. [
22] explored the mechanism and countermeasures of regional innovation. Zabala [
23] used the data envelopment analysis (DEA) to evaluate the differences in regional innovation in Europe by taking the number of education, enterprise R&D investment, and the number of patent applications as input indicators, and using per capita GDP as the output index [
11]. Cao et al. [
24] changed the previous methods of establishing the evaluation index system, and selected several key indexes to study the variation of regional innovation ability in China by using the Theil coefficient. Xiao et al. [
25] took the number of patent authorization as the main index to analyze the spatial and temporal evolution process, pattern and characteristics of the regional innovation difference in China during the last 1985–2013 years by using the methods of variation coefficient and the spatial Markov chain and spatial autocorrelation. Deng et al. [
26] and Zhao et al. [
27] used the spatial SUR (Seemingly Unrelated Regressive) model to study the dynamic time-varying characteristics of knowledge production and spatial spillover in China.
We can see that scholars in the area of innovation research focus on comprehensive evaluation research, influencing factors and spatial pattern from the analysis of above literatures [
28]. At present, research focuses more on the macro aspects of regional innovation and the interaction among various factors, while ignoring the in-depth study of individual factors. In order to make up for the in-depth study of the influence of individual factors on the disequilibrium development of regional innovation, this paper takes patent as an index of regional innovation output to study the process and mechanism of the impact of the R&D personnel on the disequilibrium development. This article is based on this line of thinking: (i) a study of the process of disequilibrium development between regions. Three indexes, that is, the amount of patent, scale, and efficiency of R&D personnel, are used to compare the differences between regions. Here, R&D personnel efficiency refers to the ratio of the number of regional patent output to the number of R&D personnel. Under the condition of the uneven development of the level of innovation output among the regions in China, the whole country is divided into three regions in the study, that is, eastern region, central region and western region according to the economic development and its location characteristics. The eastern region includes Beijing, Tianjin, Hebei, Liaoning, Shanghai, Jiangsu, Zhejiang, Fujian, Shandong, Guangdong, Guangxi, Hainan. The central region includes Shanxi, Inner Mongolia, Jilin, Heilongjiang, Anhui, Jiangxi, Henan, Hubei, Hunan, and the western region includes Chongqing, Sichuan, Guizhou, Yunnan, Tibet, Shaanxi, Gansu, Ningxia, Qinghai and Xinjiang.
The σ convergent model and β convergent mode are used to analyze the development trend and speed of the disequilibrium of regional innovation output respectively. The reason to choose the σ convergence model is that it cannot only find the overall disequilibrium development trend among different regions, but can also explore the source of disequilibrium between the regions from the perspective of efficiency and scale of R&D personnel; (ii) research on the mechanism of R&D personnel’s influence on regional disequilibrium development. The LMDI (logarithmic mean Divisia index) method is used to analyze the time characteristics of the unbalanced development among regions by using R&D personnel as an important endogenous factor of regional innovation output. The reason why the LMDI method was chosen is that this method has the advantages of full decomposition with no residual, its ease of use, and the consistency of the penalty decomposition and addition decomposition and the uniqueness of the result. It can comprehensively explain the impact of R&D personnel on the impact mechanism of regional innovation from three aspects of scale, efficiency and structure. The index of regional innovation output in this paper is the number of authorized regional patents. The index of R&D personnel is full-time equivalent of R&D personnel by region. The source of these two indexes came from the China Statistical Yearbook on Science and Technology. The research period is set from 2000 to 2015.
2. Convergence Analysis of Regional Innovation Output Disequilibrium
According to the previous regional division, the samples are divided into three parts to undertake this comparative study, that is, eastern–central regions, eastern–western regions, and central–western regions. This paper further analyzes the characteristics of unbalanced development of innovation output in different regions from the three indicators, that is, the scale of R&D personnel, R&D personnel efficiency and the number of patents, in the provinces of the three regions from 2000 to 2015. We choose the
σ convergence model as the research method to analyze the unbalanced development trend of regional innovation output. At the same time, we use the
β convergence model to analyze the speed of the unbalanced development of this region. The formula of the
σ convergence model is as follows:
where
CV represents the convergence coefficient of regional innovation output;
yi represents the number of patents in each province, the full-time equivalent of R&D personnel, and the efficiency of the R&D personnel’s patent output, respectively;
ӯ represents the average of the corresponding indicators in the three regions of the eastern-central regions, eastern-western regions, and central-western regions; n represents the number of provinces included in the region. The value of convergence coefficient of these three regions can be obtained as follow.
Table 1 observes the disequilibrium development of regional innovation from a national perspective. It can be seen that the convergence of the indicator of patent output has a divergence trend during the period of 2000–2012 years, which indicates that the unbalanced gap between regions gradually increases. However, it began to decline from 2013 to 2015, indicating that the unbalanced characteristics began to decrease. The index of scale of regional R&D personnel has been in the trend of divergence, indicating the imbalance between regions is gradually increasing, which is also a consequence of the contention for talent leading to more talents flowing into the developed regions. The index of output efficiency of regional innovation is in a divergence trend in the two stage of 2000–2003 and 2009–2011, however it is in a convergent trend during the 2004–2008 and 2012–2015, which reflects that the efficiency gap between regions is narrowing. It can be seen that although the gap of scale of R&D personnel in different regions is increasing, the gap in the output efficiency is narrowing. The enlightenment to the underdeveloped regions is that although it does not have the advantage of attracting talent, it can make full use of the existing resources and improve the efficiency, which can reduce the gap of regional innovation to a certain extent. In order to understand the development situation of different regions in China more clearly, we made further study as shown in
Table 2.
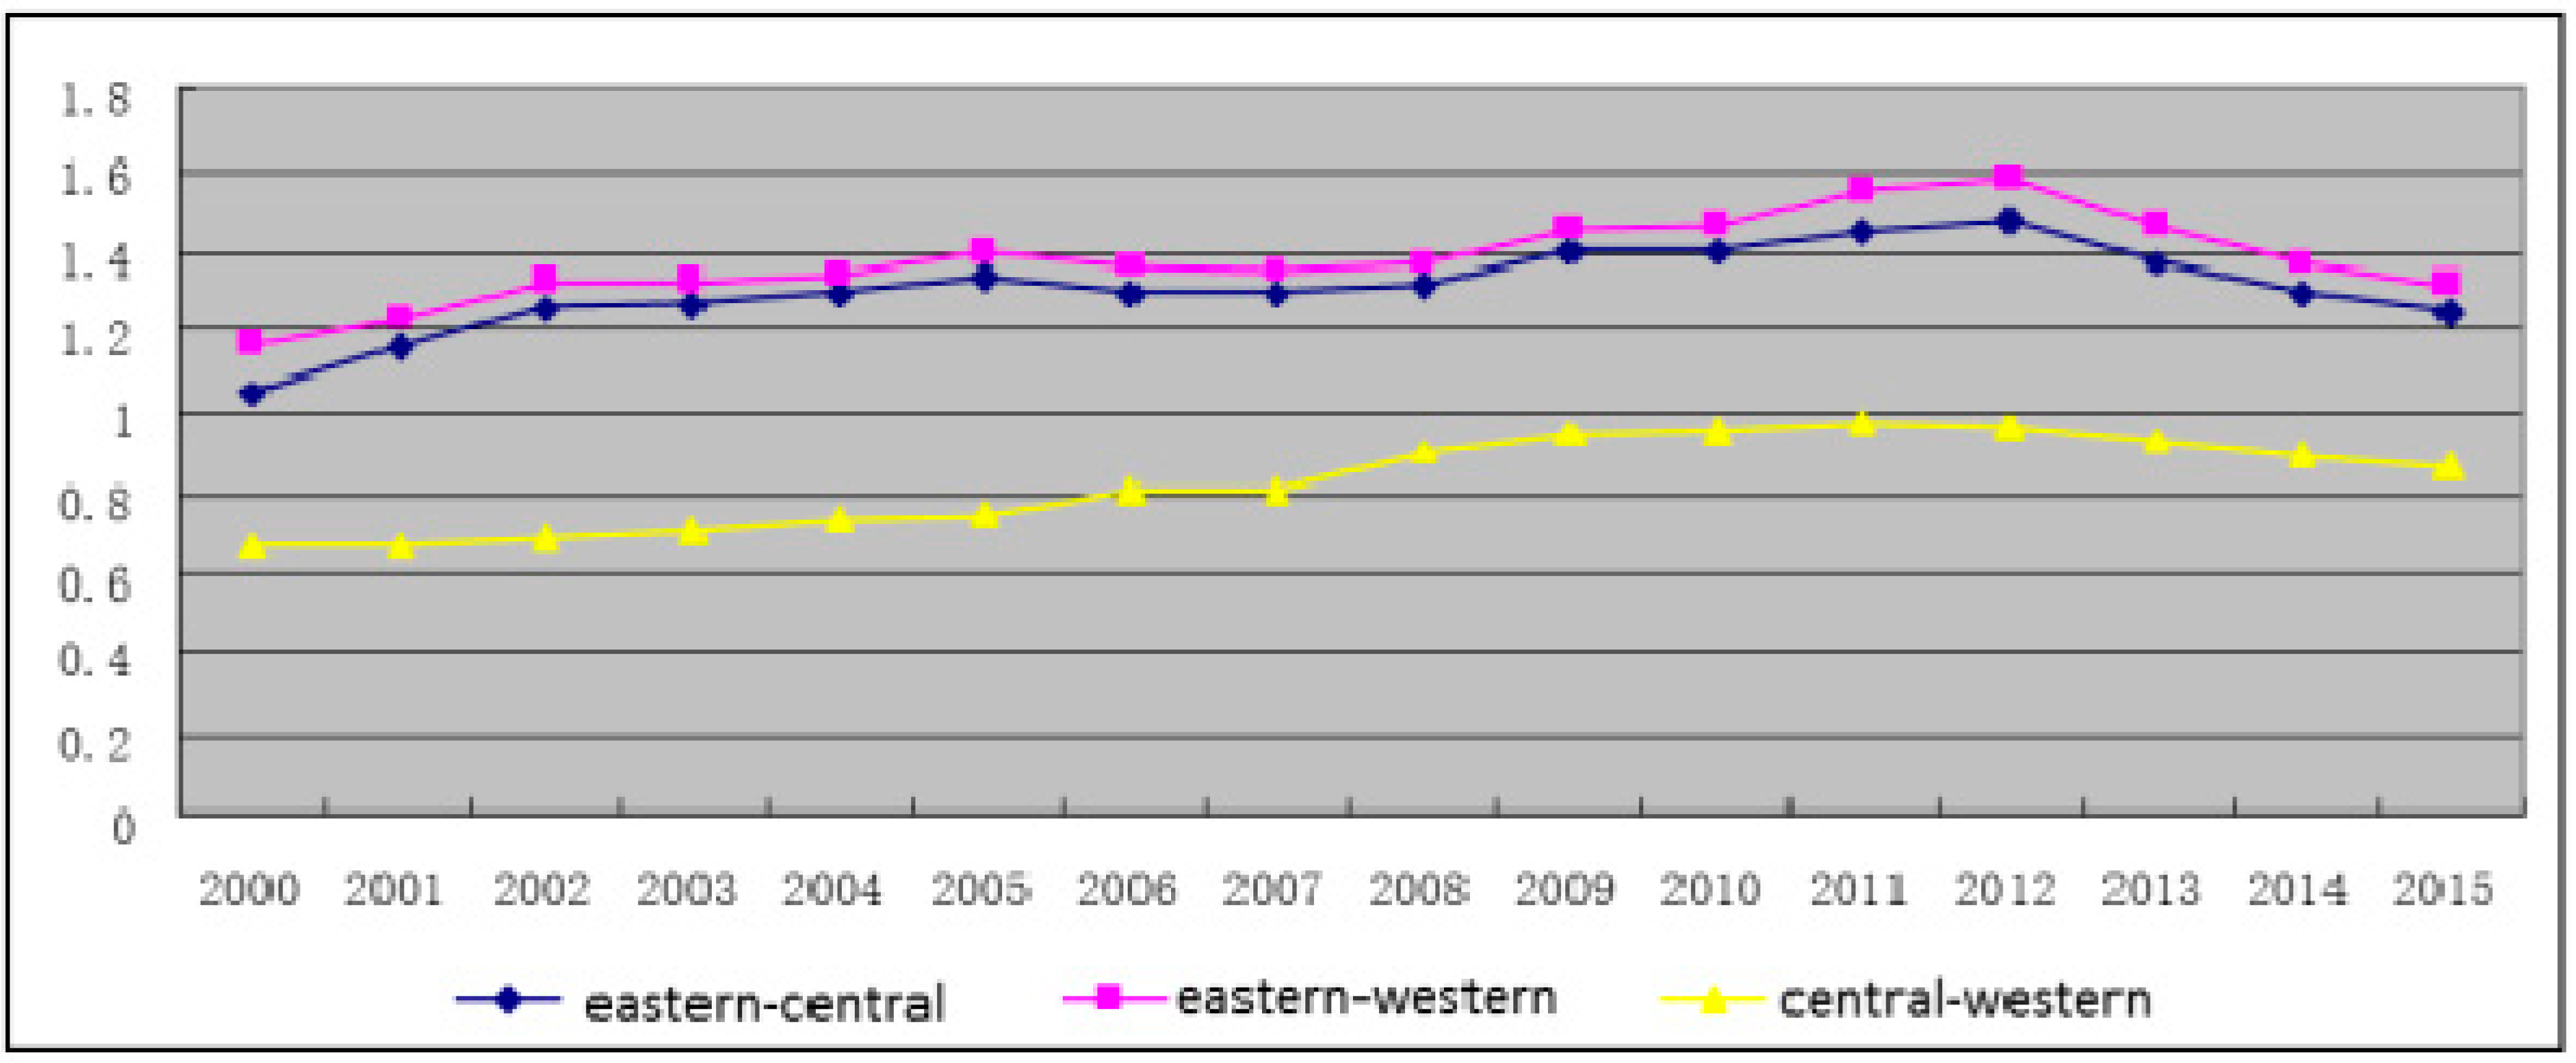
As we can see from
Figure 1, the imbalances between the eastern–central regions and the eastern–western regions are obviously greater than that in the central–western regions, but the convergence of the three regions is somewhat similar. From 2000 to 2011, the convergence of patent output has a divergence trend, indicating that the disequilibrium gap in different regions has begun to expand. However, it began to decline from 2011 to 2015, indicating that the unbalanced characteristics of patent output began to decrease in the three regions, which reflects the provinces have begun to narrow the gap in the total amount of regional innovation output. This is mainly due to the country’s policy of encouraging innovation and development in this period, such as determining the dominant position of the enterprise in the whole innovation system and establishing a national innovation system on the basis of independent innovation, which has promoted the innovation level of the whole region. Although the central–western regions have a lower development base, they have a backward advantage to reduce the difference with the eastern regions on the scale of output.
In
Figure 2, we can see that the differences in the scale of R&D personnel in the two regions of eastern–central and eastern–western have a divergent tendency during 2000–2010, which indicates the gap between the eastern regions and the central and western regions is gradually widening in the size of the R&D personnel. From 2011 to 2015, there was a certain trend of convergence, which indicates that the disequilibrium gap began to narrow at this stage. The disequilibrium of the central–western regions is in a convergent trend, which shows the disequilibrium situation in this area has not changed much. The eastern region has an obvious advantage over the central and western regions in attracting and investing in R&D personnel. Therefore, it has been able to gain the advantage of scale for a long time, while the gap in the R&D personnel in the central and western regions is narrowing to a certain extent. As the country attaches great importance to the development of the central and western regions, the central and western regions have a certain relative advantage in attracting and investing in R&D personnel, which makes the gap between the eastern and central regions no longer increase.
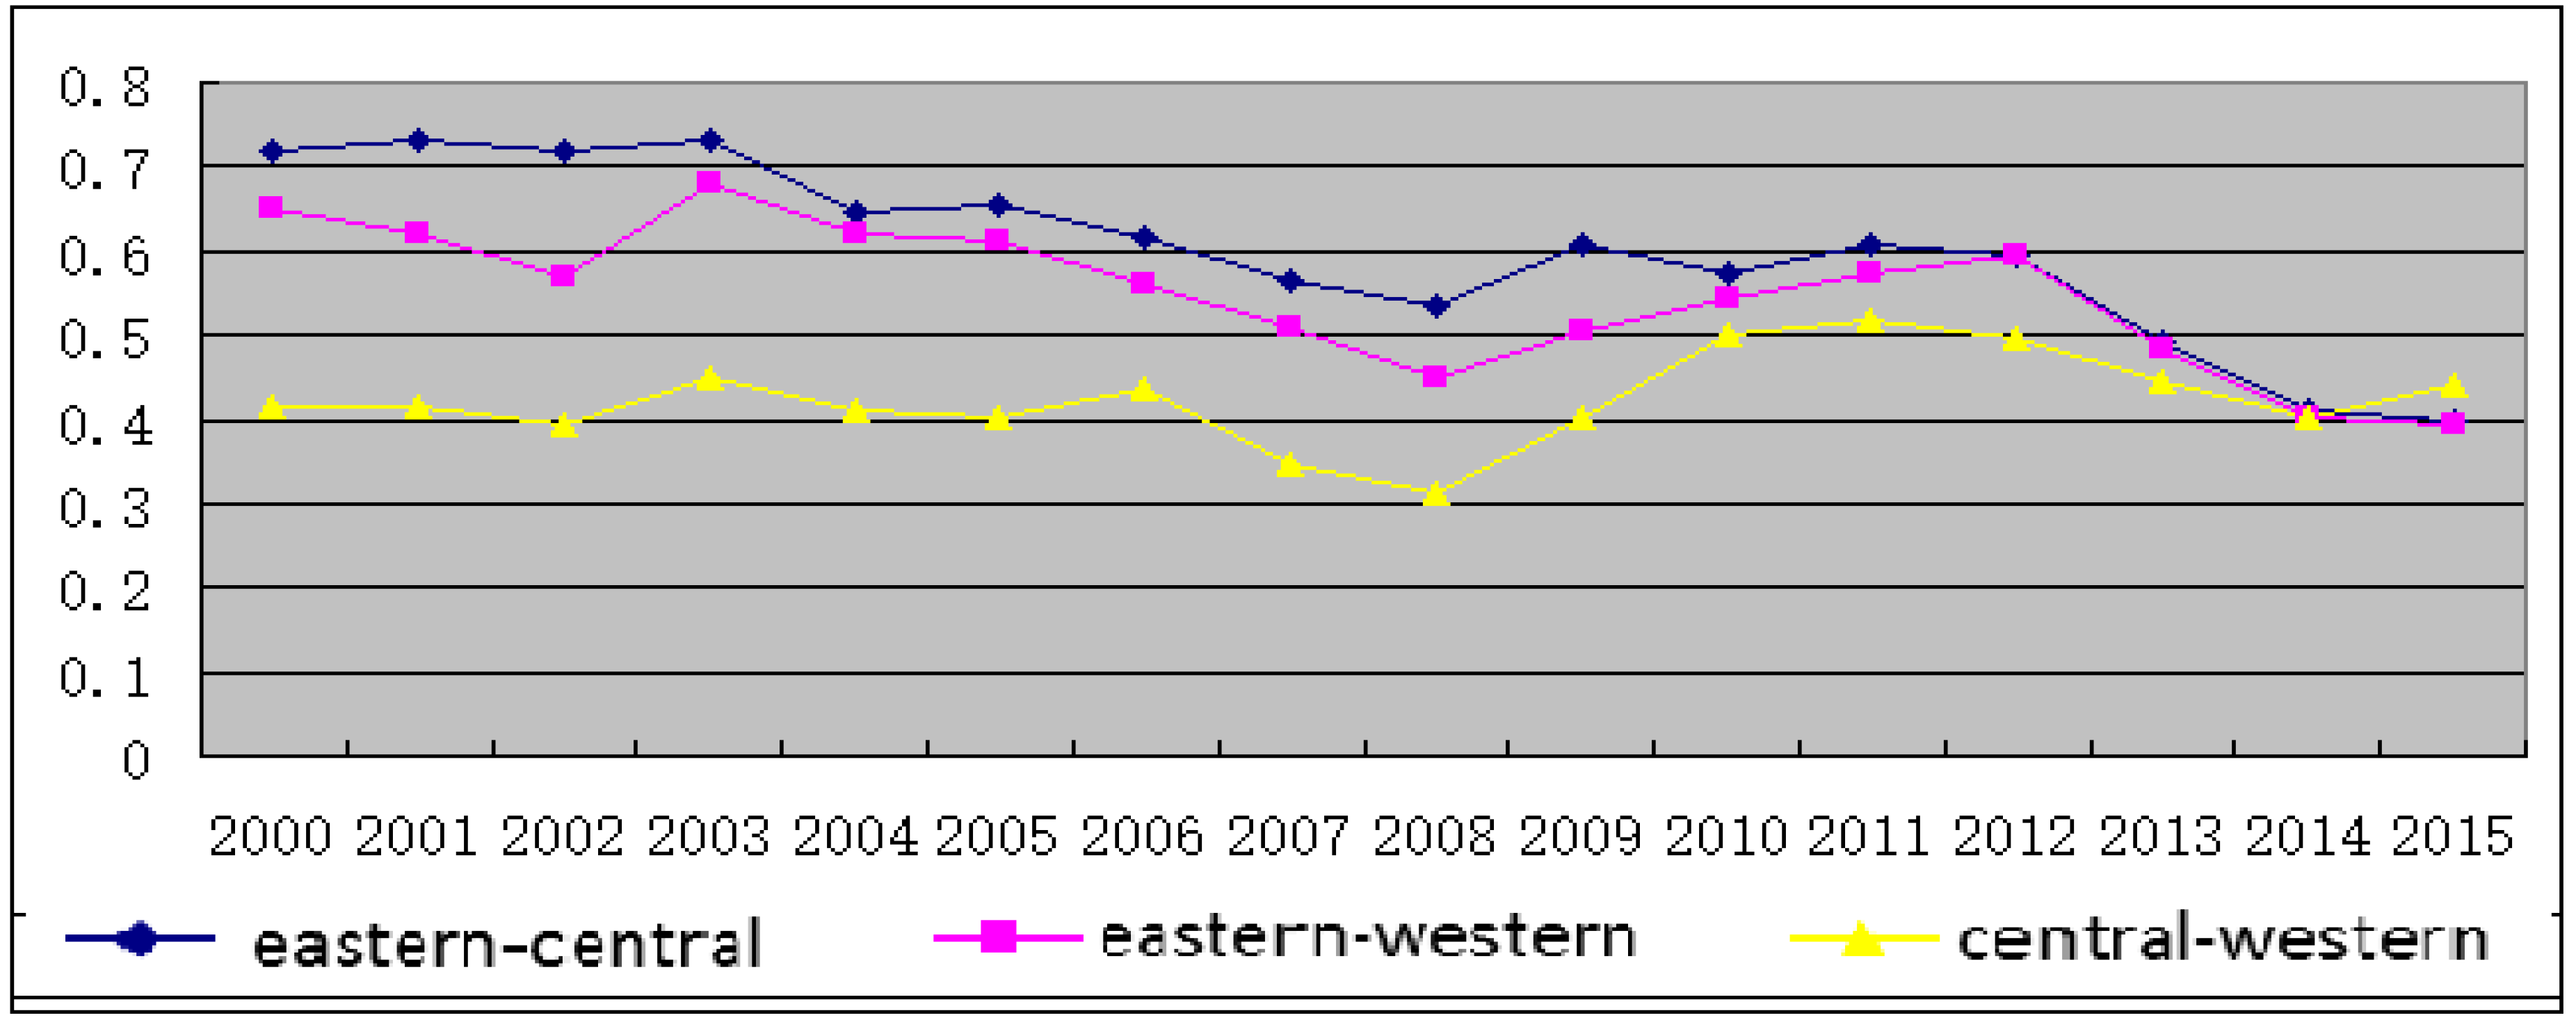
From
Figure 3, we can see that the disequilibrium of regional innovation efficiency in the eastern–central and eastern–western regions is basically the same, and all of them are in a state of convergence. The disequilibrium between the central-western regions was in the convergence trend from 2000 to 2008, followed by a divergence trend. From the perspective of efficiency, the efficiency gap is shrinking compared with the central and western regions although the eastern region has the scale advantage of R&D personnel, which explains the convergence trend of the scale of regional innovation output in
Figure 1 in recent years.
It can be seen that the disequilibrium development of these regions will exist in a long period of time through the variation trend of the value of convergence coefficient in various regions.
Although the trend of its disequilibrium change can be seen, the speed of convergence cannot be reflected. Therefore, we need to further study the rate of innovation convergence through the
β convergence model to clarify the rate of equilibrium development among different regions. We use panel data to establish the following model of
β convergence:
where
and
represent different variables in eastern-central, eastern-western, and central-western regions respectively;
represents panel data in the model may have fixed effects or random effects;
obeys
.
If the
β coefficient is negative, it shows that there is a
β convergence in
yit, which indicates that the region’s growth rate below the average value in the region is higher than that in the developed region, and the equilibrium time will also be accelerated. At the same time, it can be calculated according to the estimated value of the
β convergence coefficient to reach the stable state value of
γ0 and the convergence rate
θ. These indexes show that the backward regions catch up with the advanced regions to achieve the rate of balanced development. The calculation method is [
29]:
Through the panel data on the number of patents in different regions, the full-time equivalent of R&D personnel and the patent efficiency of R&D personnel from 2000 to 2015, the
β convergence is analyzed, and the results are obtained are shown in
Table 3.
From
Table 3, we can see that the Hausman test results show that the 1% level is significant and can reject the existence of random effects during the analysis of the effectiveness of regional innovation
β convergence. Therefore, the fixed effect model is used to achieve effective regression in the analysis process. Through the regression results, we can see that the
β value of the number of regional patents, the full time equivalent of R&D personnel, and the R&D personnel’s patent output efficiency are all negative, which indicate the existence of
β convergence, that is, the disequilibrium of regional innovation output can be reduced the gap by regional development. However, there is still some difference between the convergence rates among different regions. As a whole, the development of different regions still has the characteristics of disequilibrium development and the average values of rate of convergence in number of patent, scale of regional R&D personnel and efficiency of regional innovation are 2.18%, 1.87%, and 2.17% respectively. In terms of the number of regional patents, the rate of convergence in the eastern–western regions was 2.61%, followed by 2.40% in the central–western regions, and 1.52% in the eastern–central regions. The two aspects of the scale of R&D personnel and the efficiency of the R&D personnel are the fastest convergence rate in the central-western regions, which are 2.83% and 2.58% respectively, followed by the eastern-western regions, and the last part of the east-central regions. The main reason is that the central and western regions provide a guarantee for the rapid development of the two regions with the strong support of national policies and local governments, which allow these regions to reduce the differences with the developed regions faster.
3. The Disequilibrium Characteristics of Regional Innovation Output under the Time Dimension
The core technology of LMDI (logarithmic mean index decomposition method) is to decompose the target from several different aspects and quantify the impact of the decomposed structural changes on the total target. The LMDI method was first used to study carbon emissions, but with the deepening of the research, the method was introduced into different fields, including the measurement of the driving effect of employment change, the measurement of driving effect of regional innovation [
30,
31,
32]. This approach is applicable to the problems studied in this paper because the investment of R&D personnel in regional innovation can also be decomposed according to the total amount.
The index of R&D personnel can be divided into three effects during the study of the target variable of regional innovation output, that is, the contribution effect of R&D personnel scale, the contribution effect of R&D personnel efficiency and the contribution effect of the regional structure of R&D personnel. Thus, the influence or contribution degree of the three effects on the total variables in the process of regional innovation output can be calculated in the context of the time series. The most influential factors can be determined by the empirical results. The models are as follows:
where
G represents the total number of patents in three regions in the eastern, central and western regions;
L represents the sum of R&D personnel in each region;
i represents one province in a given region which refer to the eastern, central or western region;
Gi represents the number of each provinces patent;
Li represents the scale of R&D personnel in each provinces;
Ei =
Gi/
Li represents the efficiency of R&D personnel in the various provinces of regional innovation output;
Si =
Li/
L represents the regional structure of R&D personnel in the provinces of regional innovation output.
In addition, the LMDI decomposition is carried out by time series, where
GT−1 and
GT represents the base period and T year respectively; Δ
Gtot represents the total effect; Δ
Gact represents the effect of the R&D personnel scale; Δ
Geff represents the effect of efficiency of R&D personnel; Δ
Gst represents the effect of the regional structure of R&D personnel.
The total benefit meets the following condition:
From
Table 4 we can see the result of LMDI decomposition structure in the eastern region, it can be seen that the R&D personnel have a promoting effect on the overall impact of regional innovation output, but the degree of its role is different during different periods. It can be seen from
Figure 4 that the total effect was negative for two consecutive periods from 2012 to 2014, indicating that R&D personnel had a negative impact on regional innovation output during this period. On the whole, the scale of R&D personnel plays a promoting role in the output of regional innovation at all times, while the efficiency of R&D personnel is more volatile, and the structural effect of R&D personnel is stable except in 2013.
This shows that the stable R&D team in the eastern region plays an important role in the regional innovation output, although the impact of R&D personnel efficiency fluctuates greatly whose role is more influential than the scale of R&D personnel. Therefore, it is necessary to further improve the efficiency of R&D personnel to promote the output level of regional innovation.
It can been seen from
Table 5 and
Figure 5 that the cumulative value of scale effect, efficiency effect and structural effect of R&D personnel in the central region is 190,430.3, 263,009.7 and 114,081.2 respectively. The positive impact of R&D scale effect on regional innovation output in the central region has kept steady growth, which is similar to the eastern region, but the positive impact of R&D efficiency in the central region is greater than that of the other two effects. This shows that the gap with the eastern region can be reduced by improving the efficiency of R&D personnel although there is a gap of the scale of the R&D personnel.
It can be seen from
Table 6 and
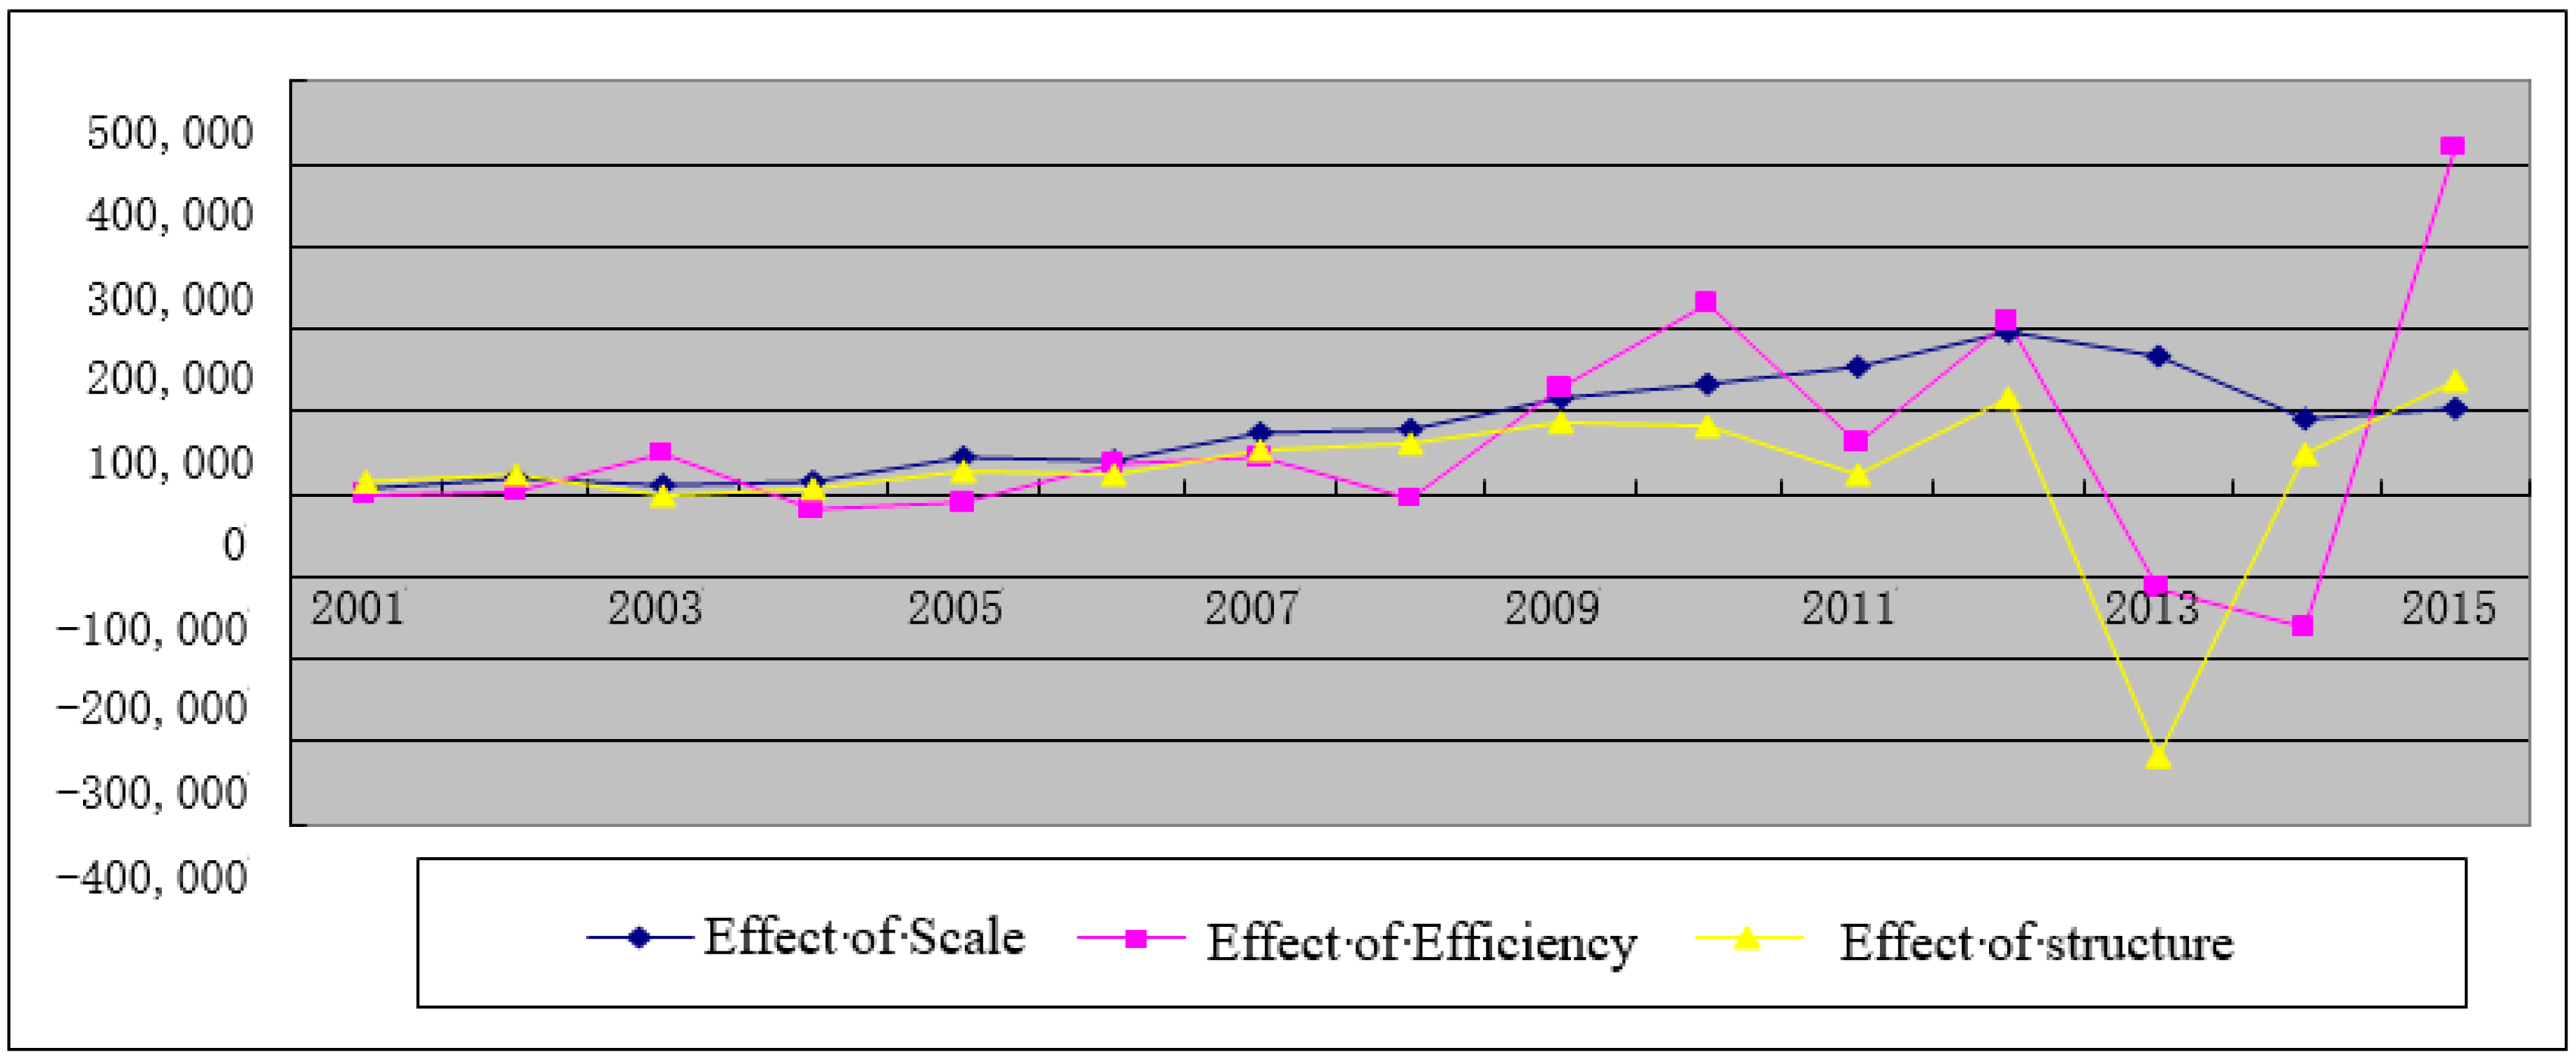
Figure 6 that the cumulative value of scale effect, efficiency effect, and structural effect of R&D personnel in the western region is 119,056.6, 260,421.4 and −52,731.1 respectively. The effect of structure of R&D personnel in the western region has a negative impact compared with the eastern and central areas, while the positive impact of R&D personnel efficiency is far higher than the other two aspects. It shows that the proportion of R&D personnel is not reasonable in the western region, which requires that the western region should play a more important role in the regional innovation output by improving the efficiency of R&D personnel under the limited scale.
By analyzing the impact mechanism of R&D personnel in regional innovation output, we can see that the distribution structure of R&D personnel is an important reason for disequilibrium regional innovation output. Regional R&D personnel are distributed in two parts mainly: one is R&D organizations led by the government; the other is the R&D institution of the enterprise. It can be seen from
Table 7 that the largest differences in the first kind of organizations are in the eastern and the central region, the difference of R&D personnel was up to 3.2 times, and the difference of the number of institutions is up to 1.6 times. The largest difference of R&D personnel was up to 10.6 times in the R&D institution of the enterprise. Therefore, the central and western regions should pay more attention to R&D institution of enterprise. The policy published in 2013 by the State Council had clearly defined the regional innovation keynotes in the future, that is, playing the main position role of enterprise in the process of regional innovation, so the central and western regions should focus on cultivating more R&D institutions of enterprises.
4. Conclusions
Our research analyzes the disequilibrium development of regional innovation in China from the perspective of R&D personnel, and analyzes the process and mechanism of regional innovation output disequilibrium. We analyze the process from three aspects: regional innovation output, R&D personnel scale, and efficiency, and analyze the mechanism from other three aspects: scale, efficiency, and structure of R&D personnel. Three conclusions are drawn by empirical research as follow.
- (i)
The convergent trend can be seen through the σ convergence model. The results show that the degree of convergence between different regions is not consistent. On the whole, the disequilibrium between the regions will exist for a long time, but the imbalance between the regions has a tendency to converge, that is to say, the gap between the regions is narrowing. The index of efficiency of patent output is more obvious in narrowing the gap among the western–eastern and central–eastern regions.
- (ii)
The convergence rate of regional disequilibrium can be seen through the model of β convergence. The results show that the speed of narrowing the gap in central–western region is faster than other region in two aspects of the scale and efficiency of R&D personnel, however, the speed of eastern–western region is the fastest in the aspect of number of regional patents.
- (iii)
The mechanism of imbalance between R&D personnel can be seen by the LMDI model. The results show that R&D personnel efficiency is the most important factor in narrowing the gap of disequilibrium development of regional innovation output.
The implication to us is that we should be clear that this disequilibrium will exist for a long time, but we can find some specific measures to narrow the gap by analyzing some important factors. In the process analysis of the disequilibrium development of regional innovation, it can be seen that the efficiency of R&D personnel has significant convergence, and the efficiency of R&D personnel has a strong positive effect on regional innovation output during the mechanism analysis. Hence, giving full play to the efficiency of R&D personnel is an important way to narrow the disequilibrium development of regional innovation output.
Our research also has some limitations. First, and most notably, our results are based on the data of China. We believe the result is true based on the empirical test above and in line with China’s national condition, however, this result cannot be widely applied to other regions because of the different situation of each region. There are some flaws in the process of regional division where we consider regional factors more, which will lead to the neglect of some special cases in the region. For example, the indicators of Sichuan Province in the western region are better than some provinces in the eastern provinces, however, we cannot consider this problem effectively. Therefore, we need to choose a better regional division standard in future research. We can also expand the scope of the research to carry out a comparative study of regional innovation in international regions where we can study the influence of R&D personnel on disequilibrium development according to the innovation characteristics of different regions.


