Article

Title “Organic Fertilizers” in Vietnam’s Markets: Nutrient Composition and Efficacy of Their Application

1
Vietnam Institute of Meteorology, Hydrology and Climate Change (IMHEN), Hanoi 117000, Vietnam
2
Department of Environmental Ecology, Graduate School of Environmental and Life Science, Okayama University, Okayama 700-8530, Japan
*
Author to whom correspondence should be addressed.
Sustainability 2018, 10(7), 2437; https://doi.org/10.3390/su10072437
Submission received: 27 April 2018 / Revised: 4 July 2018 / Accepted: 10 July 2018 / Published: 12 July 2018
(This article belongs to the Special Issue Assessment and Governance of Sustainable Soil Management)

Abstract

:
Organic fertilizers have recently been gaining popularity; however, their governance is not completely assessed in developing countries. This study investigated the nutrient composition of so-called organic fertilizers in Vietnam’s markets and issues related to their production, and evaluated their potential to contaminate the groundwater. We analyzed the physicochemical properties of 12 domestic and four imported products of the fertilizers, and conducted a cultivation experiment in sandy soil with the fertilizer applied at a rate of 200 mg N kg−1 soil using an automatic watering apparatus in a greenhouse. We further studied the production of an “organic fertilizer” from coffee by-products. The nutrient content greatly varied among domestic products, whereas they were quite similar among imported products. The product packaging of the collected samples lacked information regarding raw materials. Two thirds of the domestic products contained over 30% of the total N in the inorganic form, implying that the N content dramatically increased in the fertilizers rather than in their supposed raw materials. The stages involved in the production were composting, the addition of extra soil as a bulking agent, and the mixing-in of chemical substances to increase the nutrient content before packing. The remarkably high ratio of inorganic N to total N was attributed to excessive N leaching from soil by the application of domestic fertilizers. These results suggested the need for quality criteria guidelines for organic fertilizers in Vietnam that underline not only nutrient levels, but also the control of raw materials and production process of compost, because they are closely related to nutrient uptake and the leaching loss of nutrients.

1. Introduction

Organic agriculture according to the internationally accepted standards is a relatively new method of farming in developing countries. Consumers have difficulty distinguishing between genuine organic and other “clean” products [1,2,3,4]. Vietnam is one of the most dynamic emerging countries in the East Asia region, with a gross domestic product (GDP) growth rate of 6.8% in 2017. The country’s economic performance reflected strong export-oriented manufacturing, strong domestic demand, and the gradual rebound of agriculture [5]. One of the most striking problems for Vietnam is widespread soil degradation in agricultural areas, requiring the use of the land in a more sustainable manner [6,7,8]. Nguyen et al. [9] reported that improved land tenure security is associated with a higher level of manure use by farm households. Sustainability certification has become increasingly popular in recent years, even though the excessive application of fertilizers and irrigation have made it difficult for farmers to conform to most certification standards and programs. Easy labeling showing environmental performance costs much less than certifying with international agencies has probably led Vietnamese farmers to move away from international certification and opt for a cheaper labeling scheme [10].
In this context, the organic fertilizer industry has recently expanded. The organic fertilizer market is estimated to have increased at an impressive 11% compound annual growth rate from 2016 to 2021. The country annually produces >1.2 million tons of organic fertilizers [11,12,13]. Various fertilizers labeled as “organic fertilizer” are being sold in the markets; however, criteria of their raw materials and production have not been established. Quality of these fertilizers requires clarification.
On the other hand, composting is considered a proper approach to the rising amount of organic waste from municipal solid waste, sewage sludge, and agricultural by-products in developing countries. In Vietnam, composting the wastes have recently begun. Adding chemical fertilizers to the waste during composting is a common practice [14,15]. There is a lack of empirical evidence for the effectiveness of this practice.
The application of compost is recommended not only for improving soil productivity, but also for reducing eutrophication because of excessive application of chemical fertilizers [16,17,18,19,20]. Under the Asian monsoon climate, nutrient leaching via surface runoff or percolation through the unsaturated zone into groundwater is predicted to be high because of the high frequency of heavy rainfall [21]. Thus, the evaluation efficacy of the fertilizers should involve assessing the leaching of nutrients from agricultural soil.
The objectives of this study were to clarify the nutrient composition of the so-called organic fertilizers and elucidate the effects of their application on cropping plants and the leaching loss of nutrients from agriculture land. Therefore, nutrient composition was analyzed, and a cultivation experiment was conducted using some typical “organic fertilizers”. Moreover, to determine the reasons why nutrient content greatly varied among “organic fertilizers”, we investigated the flow of raw materials and manufacturing processes for an “organic fertilizer” made from coffee by-products.

2. Materials and Methods

2.1. Sampling and Chemical Analysis

We acquired 16 so-called organic fertilizers (12 domestic products, V1–V11 and VC, and four imported products, I1–I4), which were being sold in the markets of Hanoi, Thua Thien Hue province, Lam Dong province, and Ho Chi Minh City in Vietnam. Hanoi and Ho Chi Minh City are two of the largest municipalities located in Northern Vietnam and Southern Vietnam, along with large suburban areas for vegetable production to meet urban vegetable demand. Lam Dong province in the Central Highlands is known as the largest vegetable producer, it also has the second largest area of coffee plantations in Vietnam. Vegetable production is characterized by a high level of fertilizer input. Thua Thien Hue province is located in the Central Coastal Region of Vietnam, which is dominated by poor-quality sandy soil. Samples were collected in November 2015 and June 2016; replicate samples were deleted. These goals were to ensure that the selected samples were representative of “organic fertilizers” in Vietnam. Samples were then brought to the Laboratory of Environmental Soil Science of Okayama University, Japan to analyze their physicochemical properties and conduct a cultivation experiment.
The pH was measured using a pH electrode (1:5 fresh sample: water, w/v). The total C and N were determined using a CN-analyzer (CN Corder MT-700; Yanaco, Japan). In the organic form (NH4+, NO3), N was extracted using 2 mol L−1 KCl, and concentrations of NH4+ and NO3 were measured using the phenate method and vanadium (III) chloride reduction method, respectively, with a spectrophotometer (UV-1200, Shimadzu, Japan) [22,23]. Exchangeable cations (Exch.K, Exch.Mg, and Exch.Ca) were extracted using 1 N NH4OAc. The remaining total nutrient content was assessed by wet digestion with HNO3 and perchloric acid. Available phosphorus (Truog P) was extracted using 0.002 N H2SO4. Total K, Ca, and Mg contents were measured using atomic absorption spectrophotometry. The total P and Truog P contents were determined using the ascorbic acid sulfomolybdo-phosphate blue color method [24].

2.2. Investigation of the Flow of Raw Materials and Manufacturing Process of an “Organic Fertilizer”

The research site of this study covered two districts (Duc Trong district and Lam Ha district) of Lam Dong province in the Central Highlands, which is the main coffee producing area in Vietnam. The coffee processing industry, whether employing either a wet or dry method to remove the shells from the cherries, generates a large volume of coffee by-products. Most of the waste was deposited on land, causing environmental pollution, and composting is suggested as an attractive solution for handling the waste. Consultation with local experts in coffee production and sampling coffee by-products for nutrient analysis were conducted as preliminary work in the early 2016. In June 2016, we visited coffee plantations that are mainly operated by households, with a small production scale of several hectares. During the harvest time, they collect the cherries and sell them to processing companies in the area.
A survey using face-to-face interviews was conducted at three of the 11 coffee processing companies and a private fertilizer company that made a so-called organic fertilizer from coffee by-products (VC) in the area. In the coffee-processing companies, we gathered data on the working capacity, technology employed (wet method or dry method), input materials and output materials, waste generation, and disposal costs, and we also visited the disposal sites of coffee by-products. In the fertilizer company, we collected information on source of raw materials, composting technique, stages involved in the manufacturing process, the purpose of each stage, the target customers, and the price of coffee by-products and the commercial product of fertilizer. We also took samples at each stage of the manufacturing process and brought them to Japan for analyses, aiming to evaluate changes in the nutrient levels during the process. Parameters were measured as described above.

2.3. Cultivation Experiments

Japanese Komatsuna (Brassica rapa var. perviridis) was cultivated in 1/5000a Wagner pots in a greenhouse using an automatic watering apparatus for six weeks. The design was completely randomized, with three replicates per sample, using nine selected “organic fertilizers”, a chemical inorganic fertilizer, and a control (soil only). Sandy-textured soil was first passed through a 2-mm sieve. Then, 2.2 kg of the graded soil was placed in planting pots, followed by 1 kg of the graded soil into which the fertilizer was mixed. Table 1 presents the pH value and nutrient contents of the soil used in this experiment.
The following two nutritional supplementation treatments were used: N-fertilizer alone and N-fertilizer + P, K. For the N-fertilizer treatments, “organic fertilizers” and a chemical inorganic fertilizer were applied at a rate of 600 mg N per pot (equivalent to 300 kg N ha−1). To prepare the N-fertilizer + P, K treatments, we calculated the total P and K contents contributed by the “organic fertilizers”, and supplemented these with P as super phosphate and K as potassium chloride to bring the P content to 410 mg per pot and the K content to 1150 mg per pot (except for the soil-only control). Twelve seeds of Komatsuna were sown in each pot. One week after germination, the seedlings were thinned to a density of eight seedlings per pot.
Plant and soil samples were taken at harvest (six weeks after sowing). The dry weight of the plants in each pot was measured. Soil samples were collected from each pot from the top and bottom soil stratum. Plant and soil samples were dried in an oven at 105 °C for 24 h, ground, and stored for further analysis. An analysis of variance (ANOVA) was used to compare the effects of the fertilizer type and nutritional supplementation on the dry weight and nutrient uptake of plants. Differences between individual averages were tested using the post-hoc least significant difference (LSD) test at p < 0.05.

3. Results and Discussion

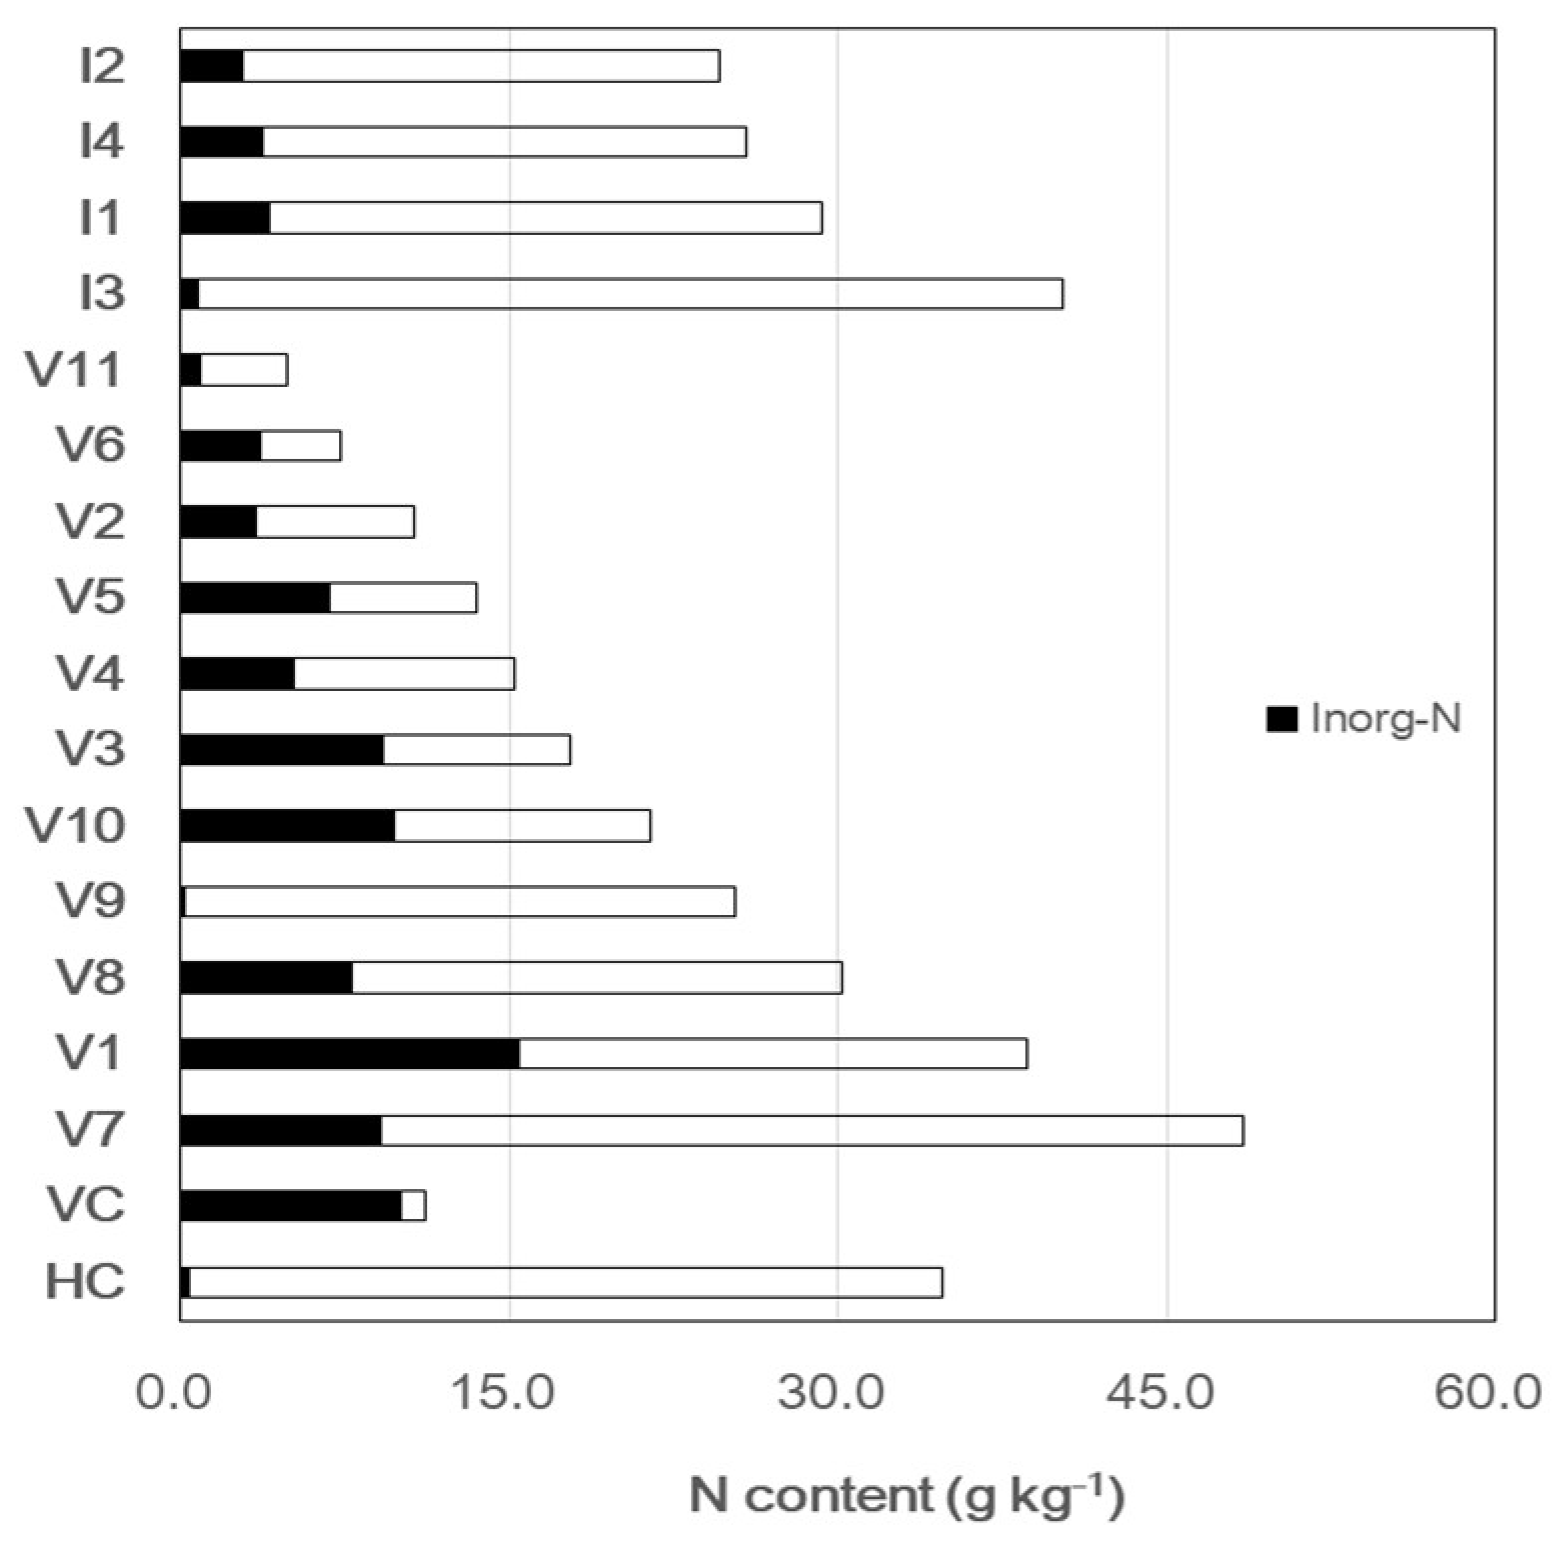
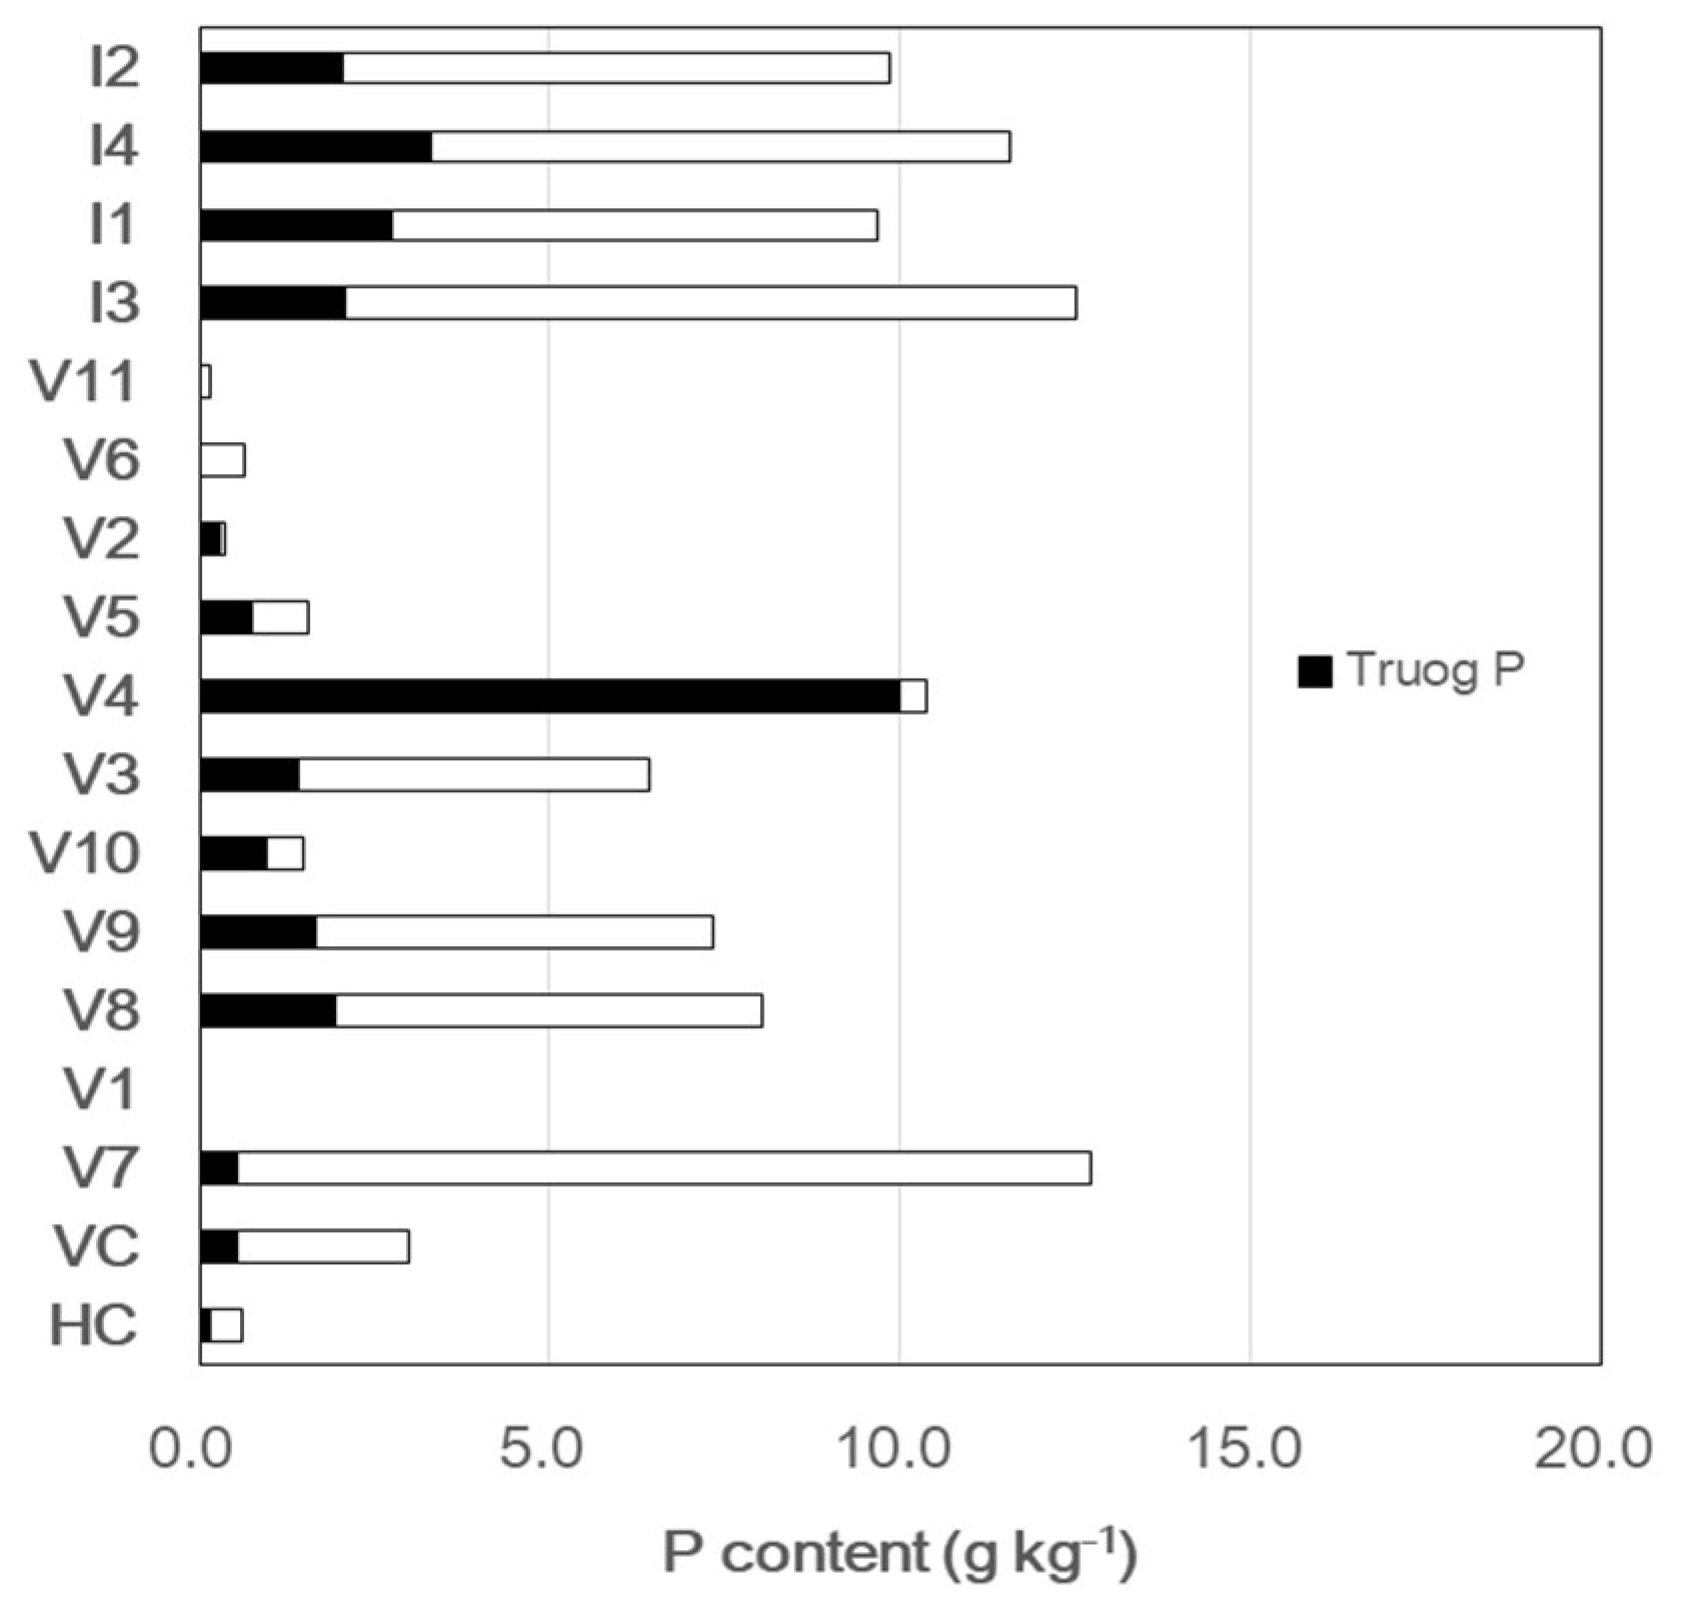
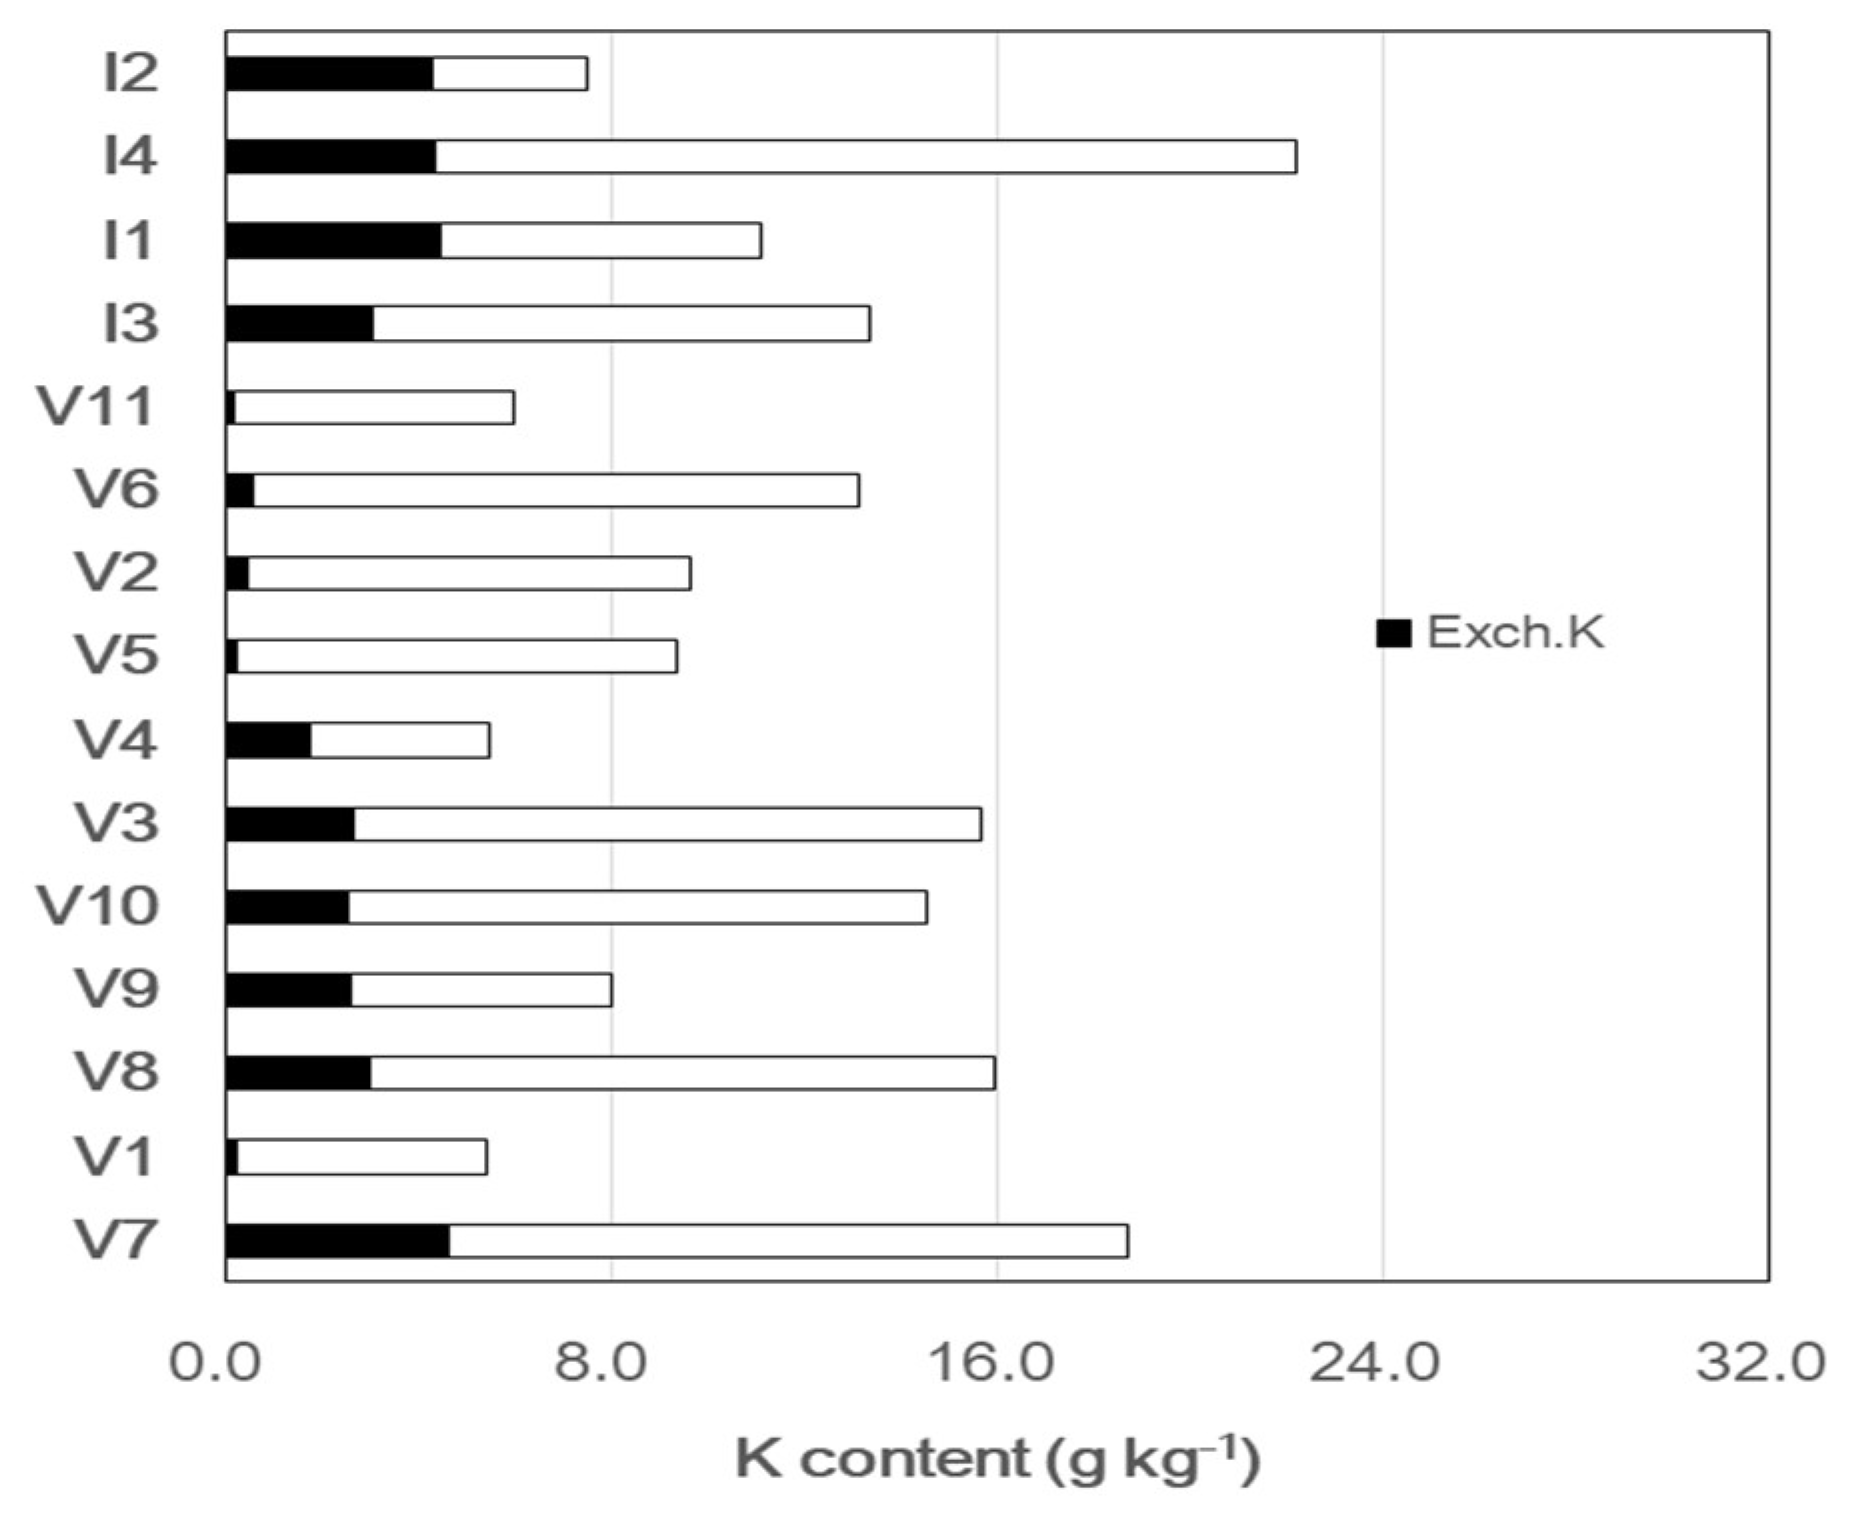
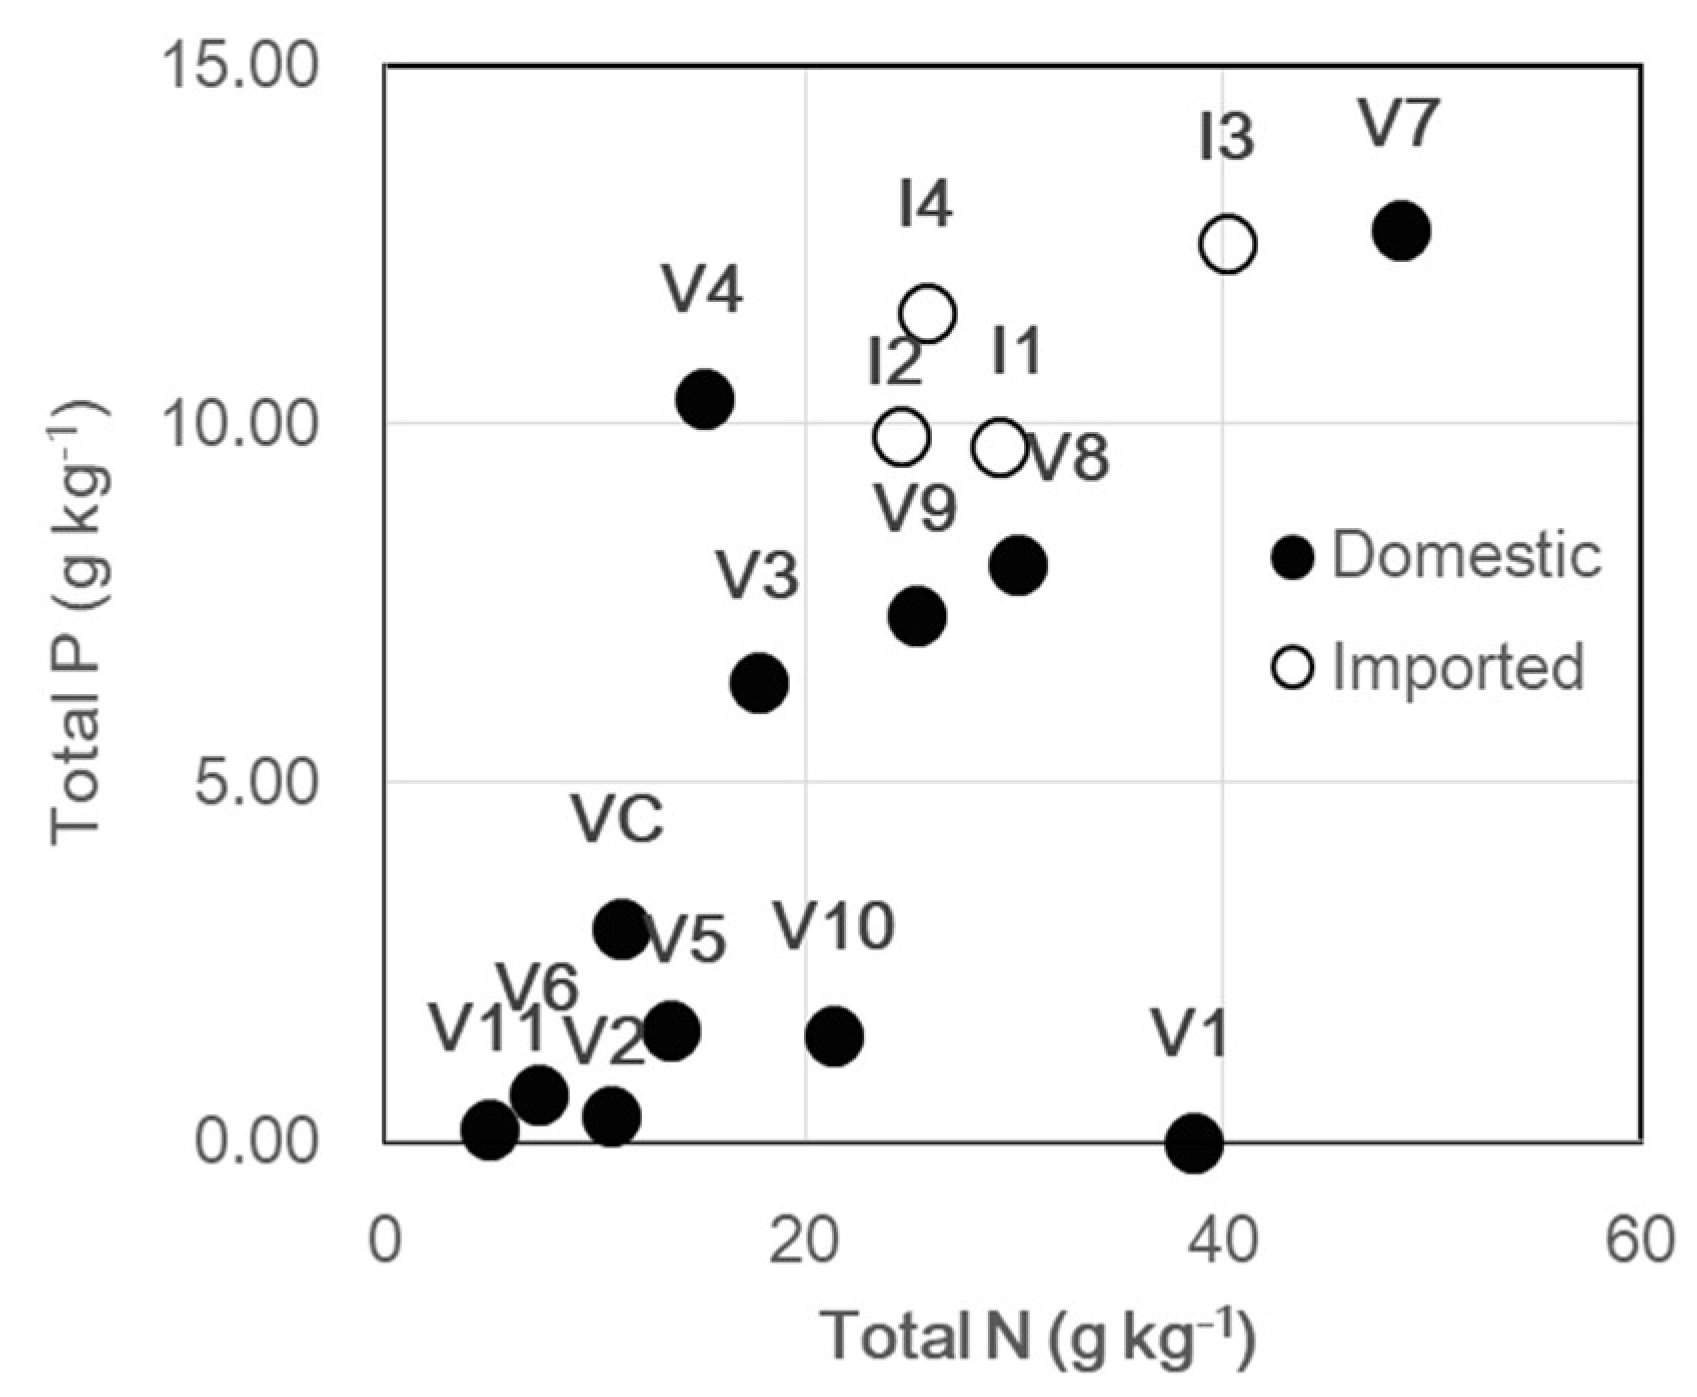
3.1. Characteristics of “Organic Fertilizers”

Figure 1, Figure 2 and Figure 3 show the N, P, and K contents of the collected samples. Table 2 presents the summaries of pH (H2O), the C: N ratio, and the concentrations of other nutrients.
We found that N and other nutrient contents greatly varied among the domestic products, whereas these were quite similar among the imported products. In the domestic products, the total N, P, and K contents were in the ranges of 4.9–48.5 kg−1, 0.0–12.7 kg−1, and 5.8–26.0 g kg−1, respectively, whereas in the imported products, these were in the ranges of 24.6–40.2 kg−1, 9.7–12.5 kg−1, and 14.2–29.0 g kg−1, respectively. The ratio of inorganic N to total N in most domestic products was high. Two-thirds of domestic products contained approximately 30% of the total N in the inorganic form, and the imported products contained approximately 10%. In contrast, the ratio of Truog P to total P greatly varied among domestic products.
Raw materials, which are the foundation for the quality of organic fertilizers, are varied. They are by-products of vegetable, animal, and human origin that have been popularly used worldwide for over a thousand years. They are organic materials from municipal solid waste, sewage sludge, and waste of agro-industrial origin whose use recently markedly increased in modern agriculture as organic waste-based fertilizers [25]. These wastes are becoming important recyclable organic materials in developing countries. Composting the wastes has recently begun in Vietnam; however, governance instruments and policies on this recycling activity have not been established. There is no standard for raw materials of organic fertilizers in regulations regarding fertilizer production, distribution, and use [26]. Varied raw materials and poorly controlled manufacturing could cause a wider range of nutrient content of domestic “organic fertilizers” compared with that of the imported ones.
Since there was no information regarding raw materials on the product packaging of our collected “organic fertilizers”, we guessed their feedstock based on their N content and appearance. The N content of organic fertilizers depends on the raw materials. The percentage of N recorded in poultry manure, dairy manure, municipal solid waste, crop residue, and sewage sludge are in the range of 2.0–4.0, 1.0–2.0, 1.0–1.5, 1.5–2.5, and 3.7–5.0, respectively [16,27,28]. Two-thirds of domestic “organic fertilizers” contained less than 2% N (Figure 1) and various pieces of litter, branches, nylon, and stones were observed in the fertilizers (Table 3). To date, the waste has not yet been separated at the source in Vietnam. It appeared that most of the domestic products might have been produced from municipal solid waste.
It must be emphasized that the percentage of inorganic N within the total N in most collected domestic “organic fertilizers” was noticeably high. Many studies show that inorganic N comprised less than 10% of compost N [27,29,30]. The ratio of inorganic N to total N in our collected samples of imported products was approximately 10%. Meanwhile, the ratio for two-thirds of the collected domestic products was over 30%. For example, V6 sold at Hanoi as named Que Lam 01 contained 7.3 kg kg−1 N, but approximately 50% of it was the inorganic form. V1 sold at Thua Thien Hue province and named Song Huong contained 38.6 kg kg−1 N, but inorganic N also accounted for approximately 40% of the total N.
Figure 4 shows the relationship between the total N and P of the collected samples. We categorized them into two groups: the first included four imported and five domestic products (V3, V4, V7, V8, and V9) containing both N and P, and the second included the remaining seven domestic products containing N, but less P. Interestingly, the price of the former group was higher than that of the latter group (Table 3). It implies that the adjustment of N and P plays an important role in the price of the fertilizers. Thanh and Matsui [14] reported that the addition of N, P, and K to matured compost is typically the final step in the production process for organic solid waste compost in Vietnam. This supportably explains the common increase in the ratio of inorganic N to total N of domestic “organic fertilizers” in this study. Since the product packaging of the collected samples lacked information regarding raw materials, we could not precisely compare the nutrient content of commercial products with those of their supposed raw materials. To determine the reason for the remarkable proportion of inorganic N in domestic products, it was necessary to investigate the manufacturing processes and changes in nutrient composition during each process of a so-called organic fertilizer made from coffee by-products.

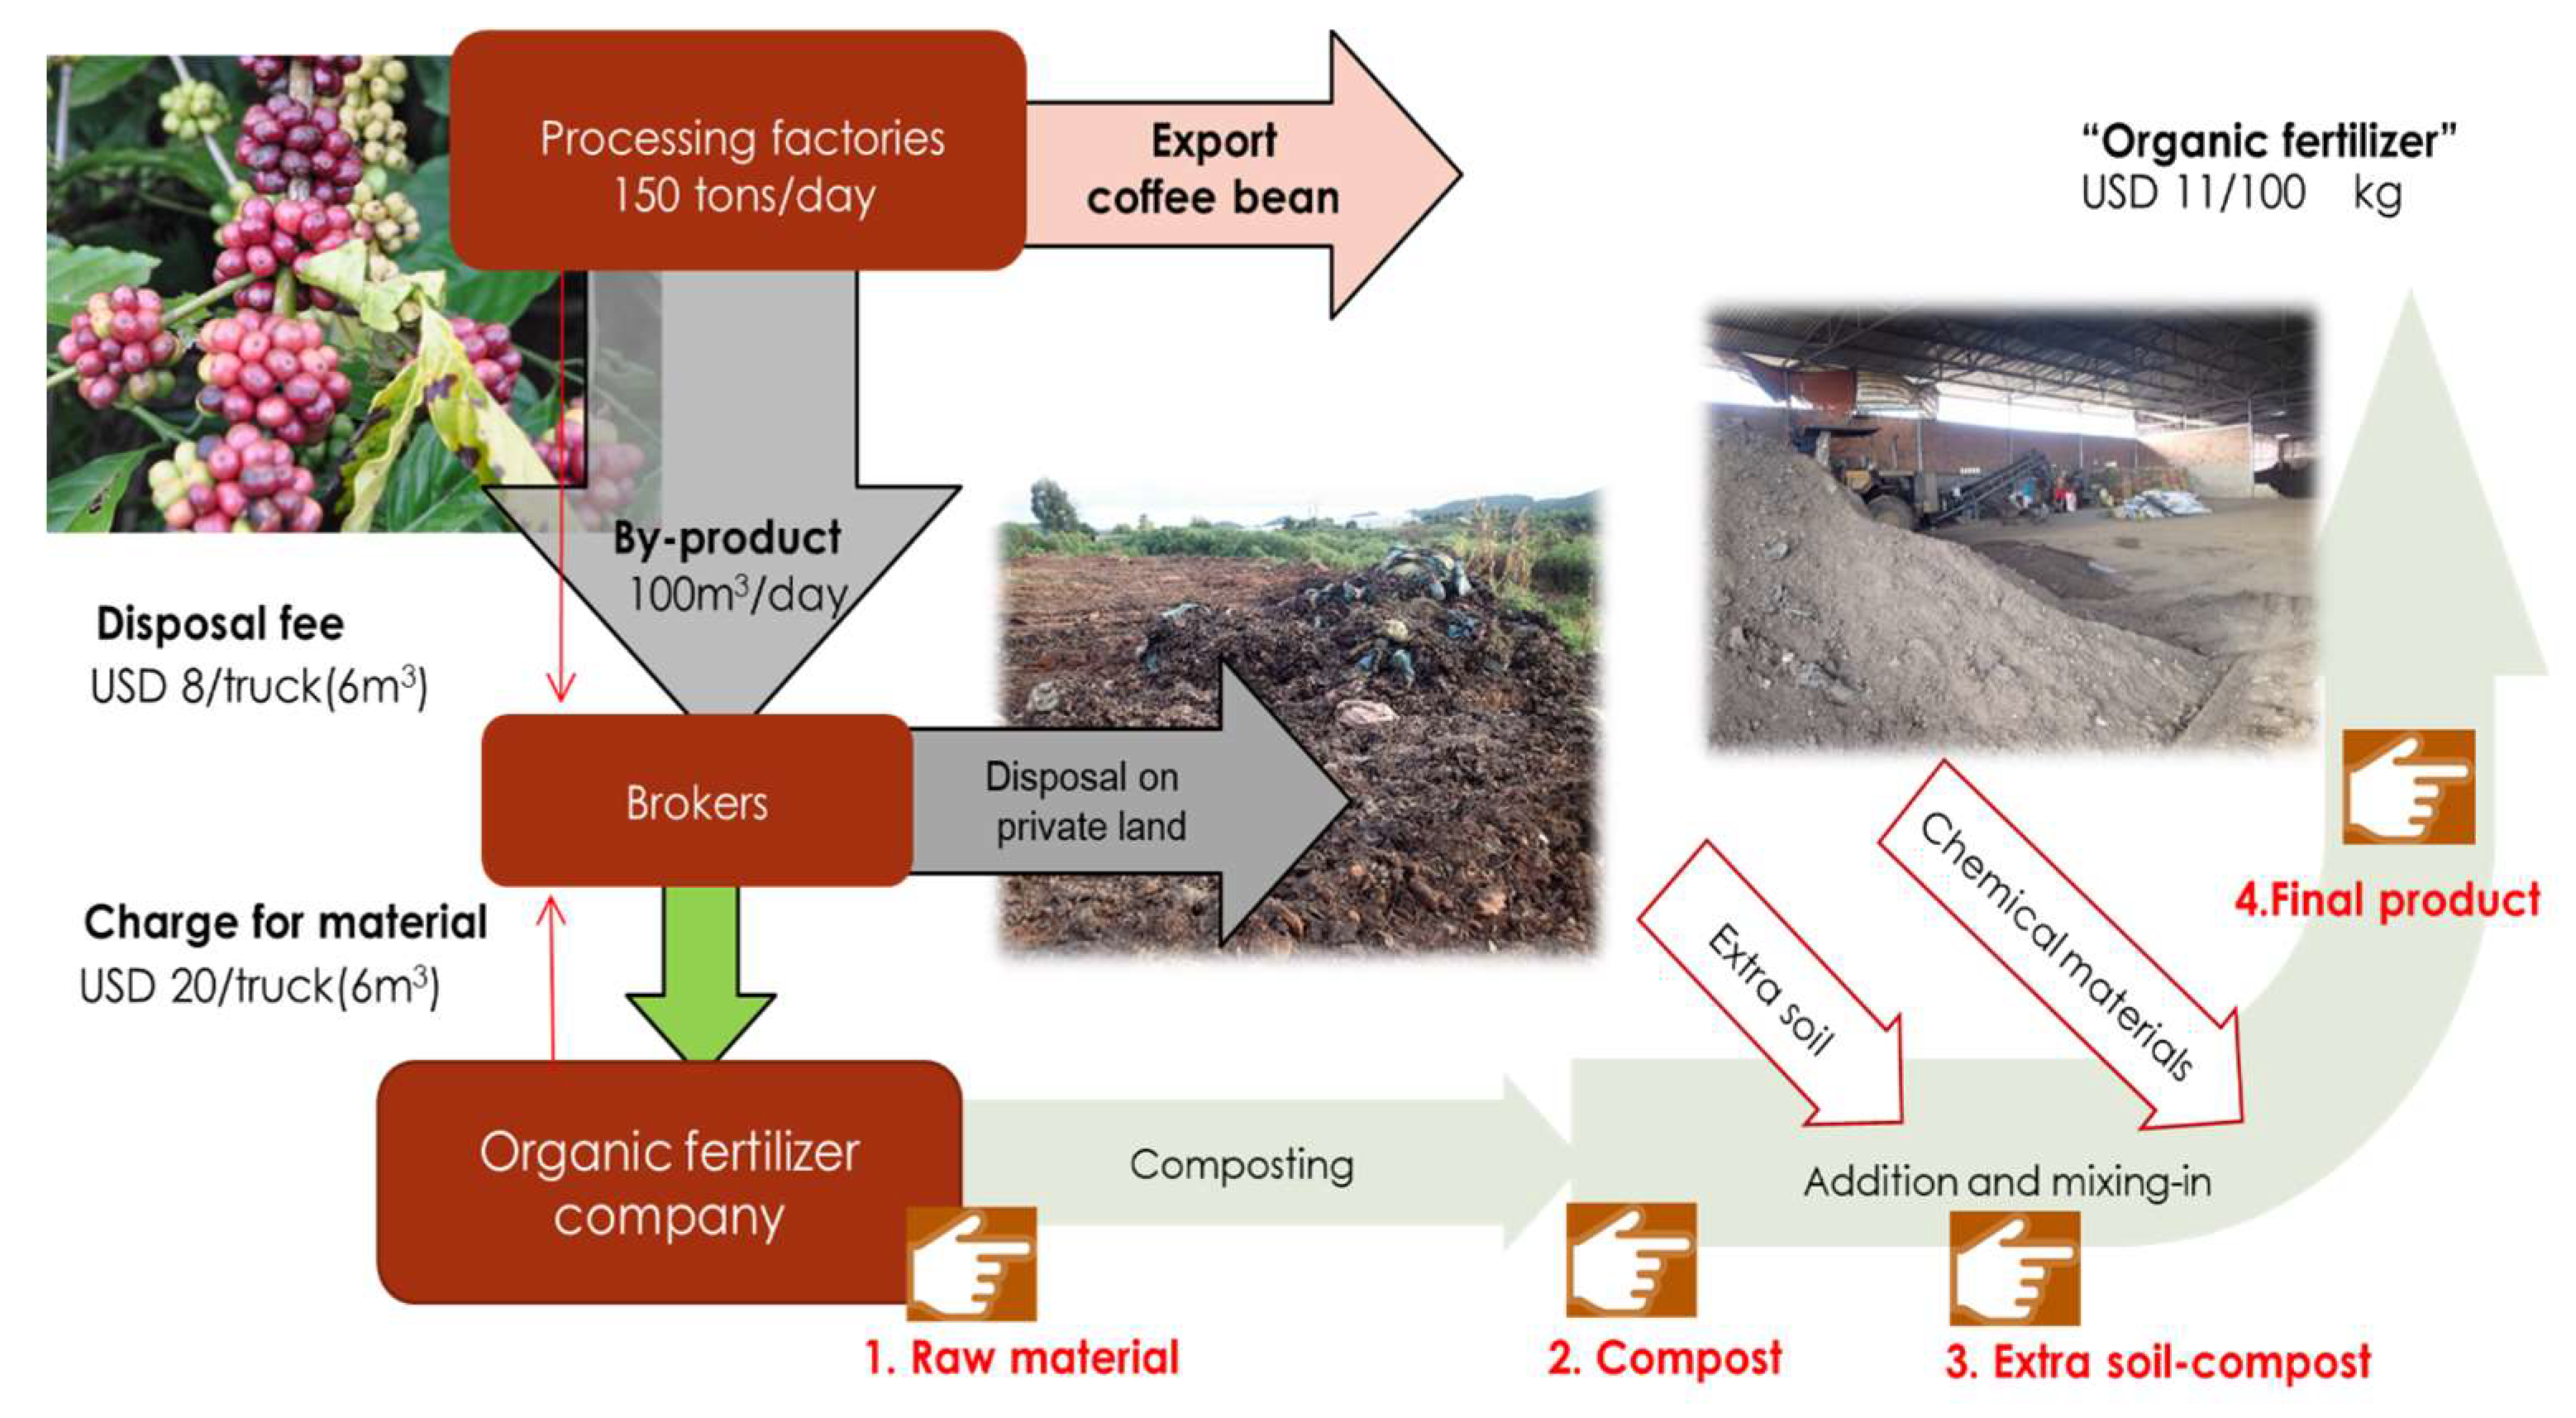
3.2. Production Method of an “Organic Fertilizer” from Coffee By-Products

Figure 5 illustrates the flow of raw materials and manufacturing processes for an “organic fertilizer” made from coffee by-products. After harvesting, coffee cherries were processed by one of two methods: dry or wet. In the wet method, the outer covering of the coffee bean was removed when the cherries were still fresh. This is a popular technique in this area, which generates a large volume of by-products (coffee pulp). For example, a medium-scale processing factory with a working capacity of 150 tons per day generates approximately 100 m3 of coffee pulp. Companies arrange brokers to collect the waste, and the fee is based on the disposal volume (currently 1.3 USD per m3). The brokers then deposit it on private land or sell it to fertilizer companies (currently at a price of 3.3 USD per m3).
The composting companies use aerobic composting over several months, after which extra soil is added to increase the volume and density. Finally, they add chemical substances such as urea and phosphate to enhance the fertilizer effect before packing the product for sale in the markets as “organic fertilizer” at a price of 11 USD per 100 kg (current price). Our investigation results are in accordance with the findings of Thanh and Matsui, as reported above. However, the authors did not provide evidence of changes in the nutrient levels during the manufacturing processes. Our study clarifies this limitation.
Table 4 shows changes in the nutrient levels during the manufacturing processes of an “organic fertilizer” made from coffee by-products. It indicates that coffee by-products are rich organic material, with nitrogen and potassium. The total C content was high, being up to 423.2 g kg−1, and the N and K contents were 32.80 g kg−1 and 9.71 g kg−1, respectively. However, the P content was very low. After composting, the carbon content slightly decreased, but the concentration of total N and K increased. The compost contained were 34.8 gN kg−1 and 12.54 gK kg−1, respectively. After bulking out the compost with extra soil, the total C, N, and K contents were reduced to 83.20 g kg−1, 6.40 g kg−1, and 4.48 g kg−1, respectively. The concentration of exchangeable K was reduced from 25.68 cmol kg−1 to 4.13 cmol kg−1. After packing, the total N content nearly doubled from 6.40 g kg−1 to 11.20 g kg−1. NH4+ concentration increased 34-fold, whereas NO3 concentration remained unchanged. The total P content tripled from 0.99 g kg−1 to 2.99 g kg−1, and the Truog P content increased 13-fold from 0.04 g kg−1 to 0.54 g kg−1.

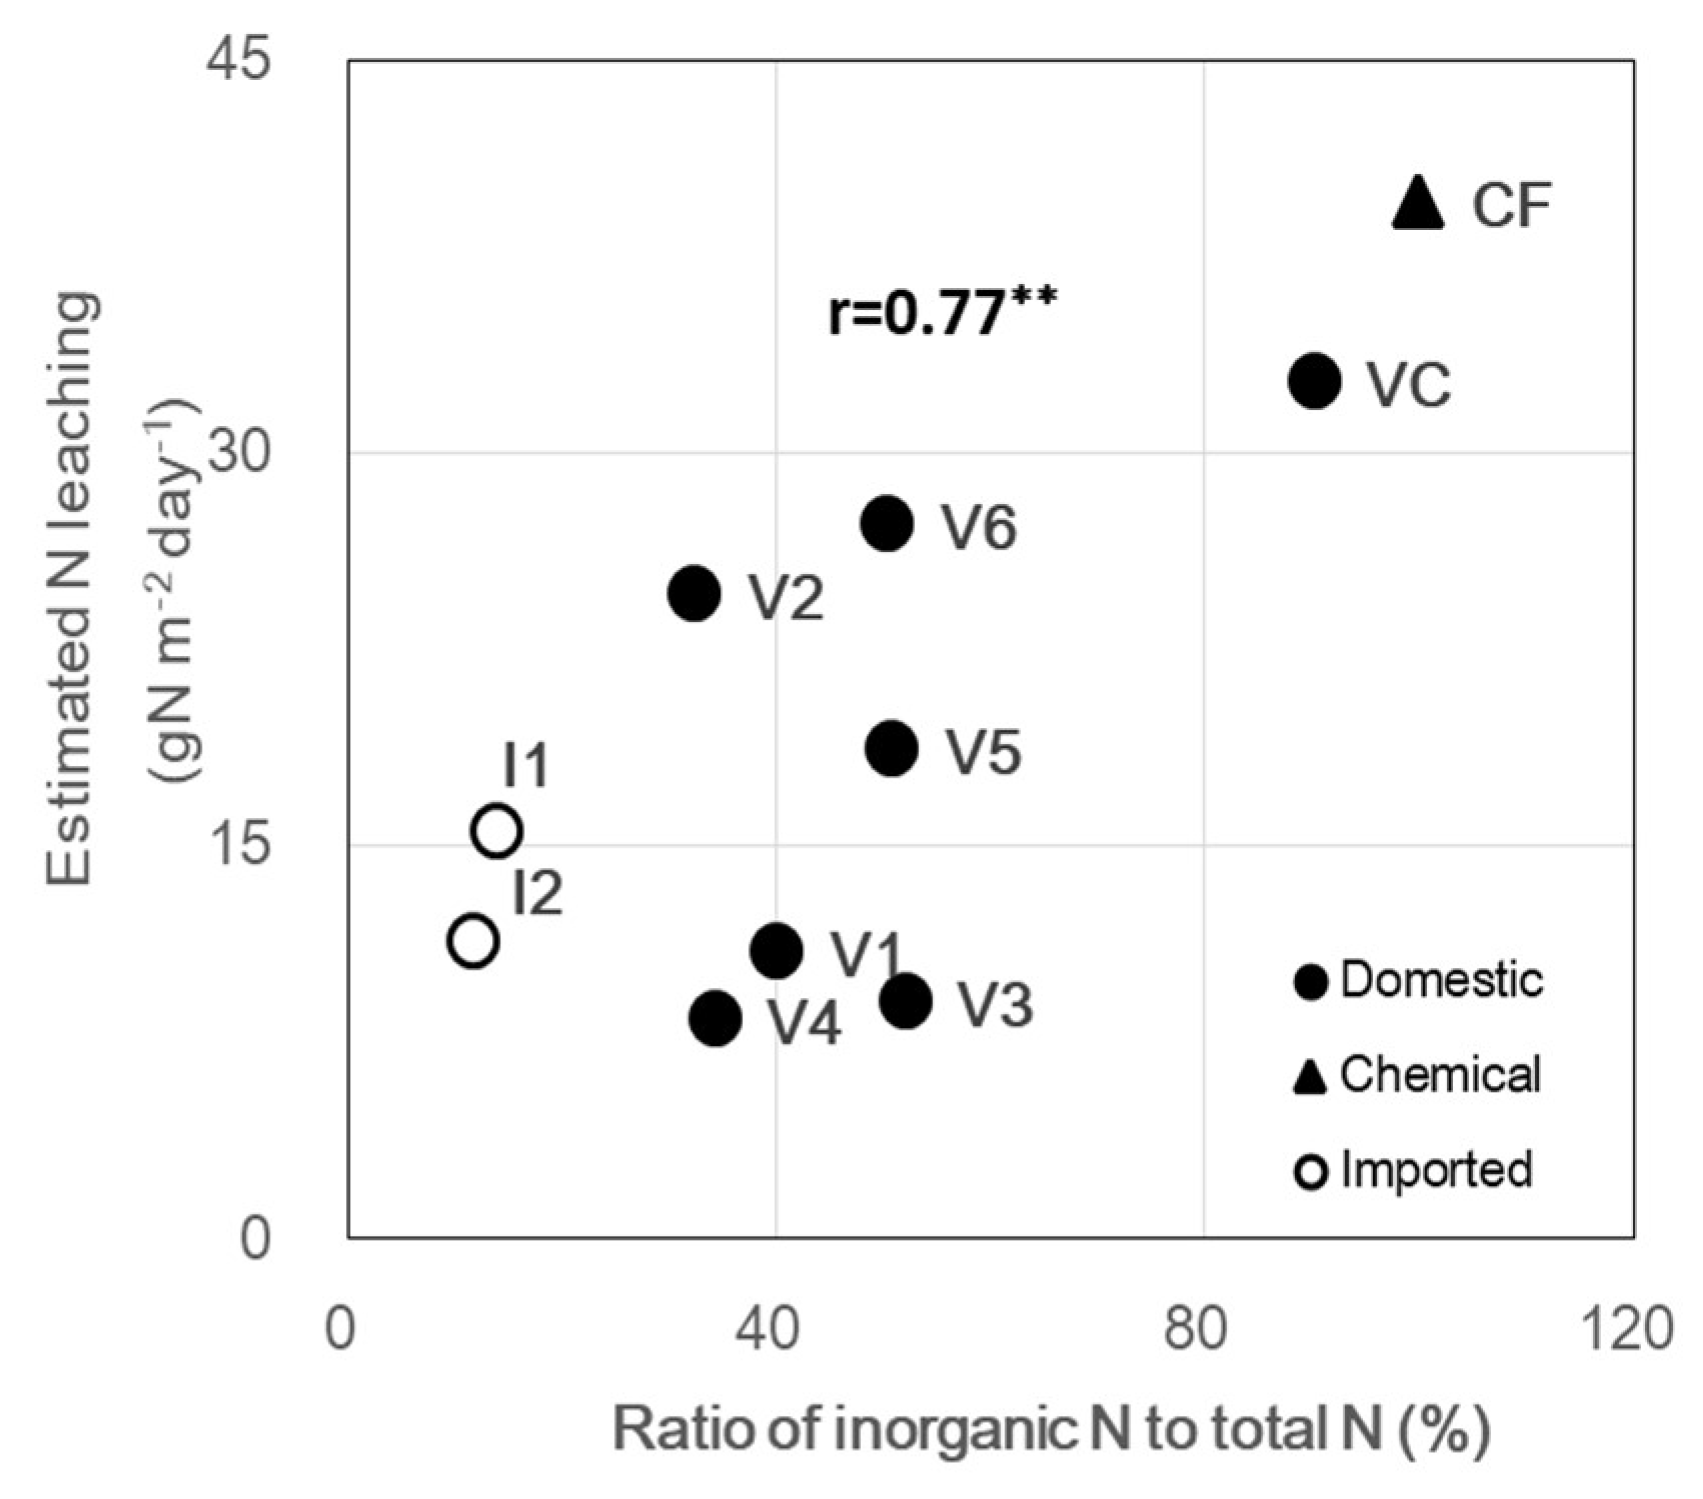
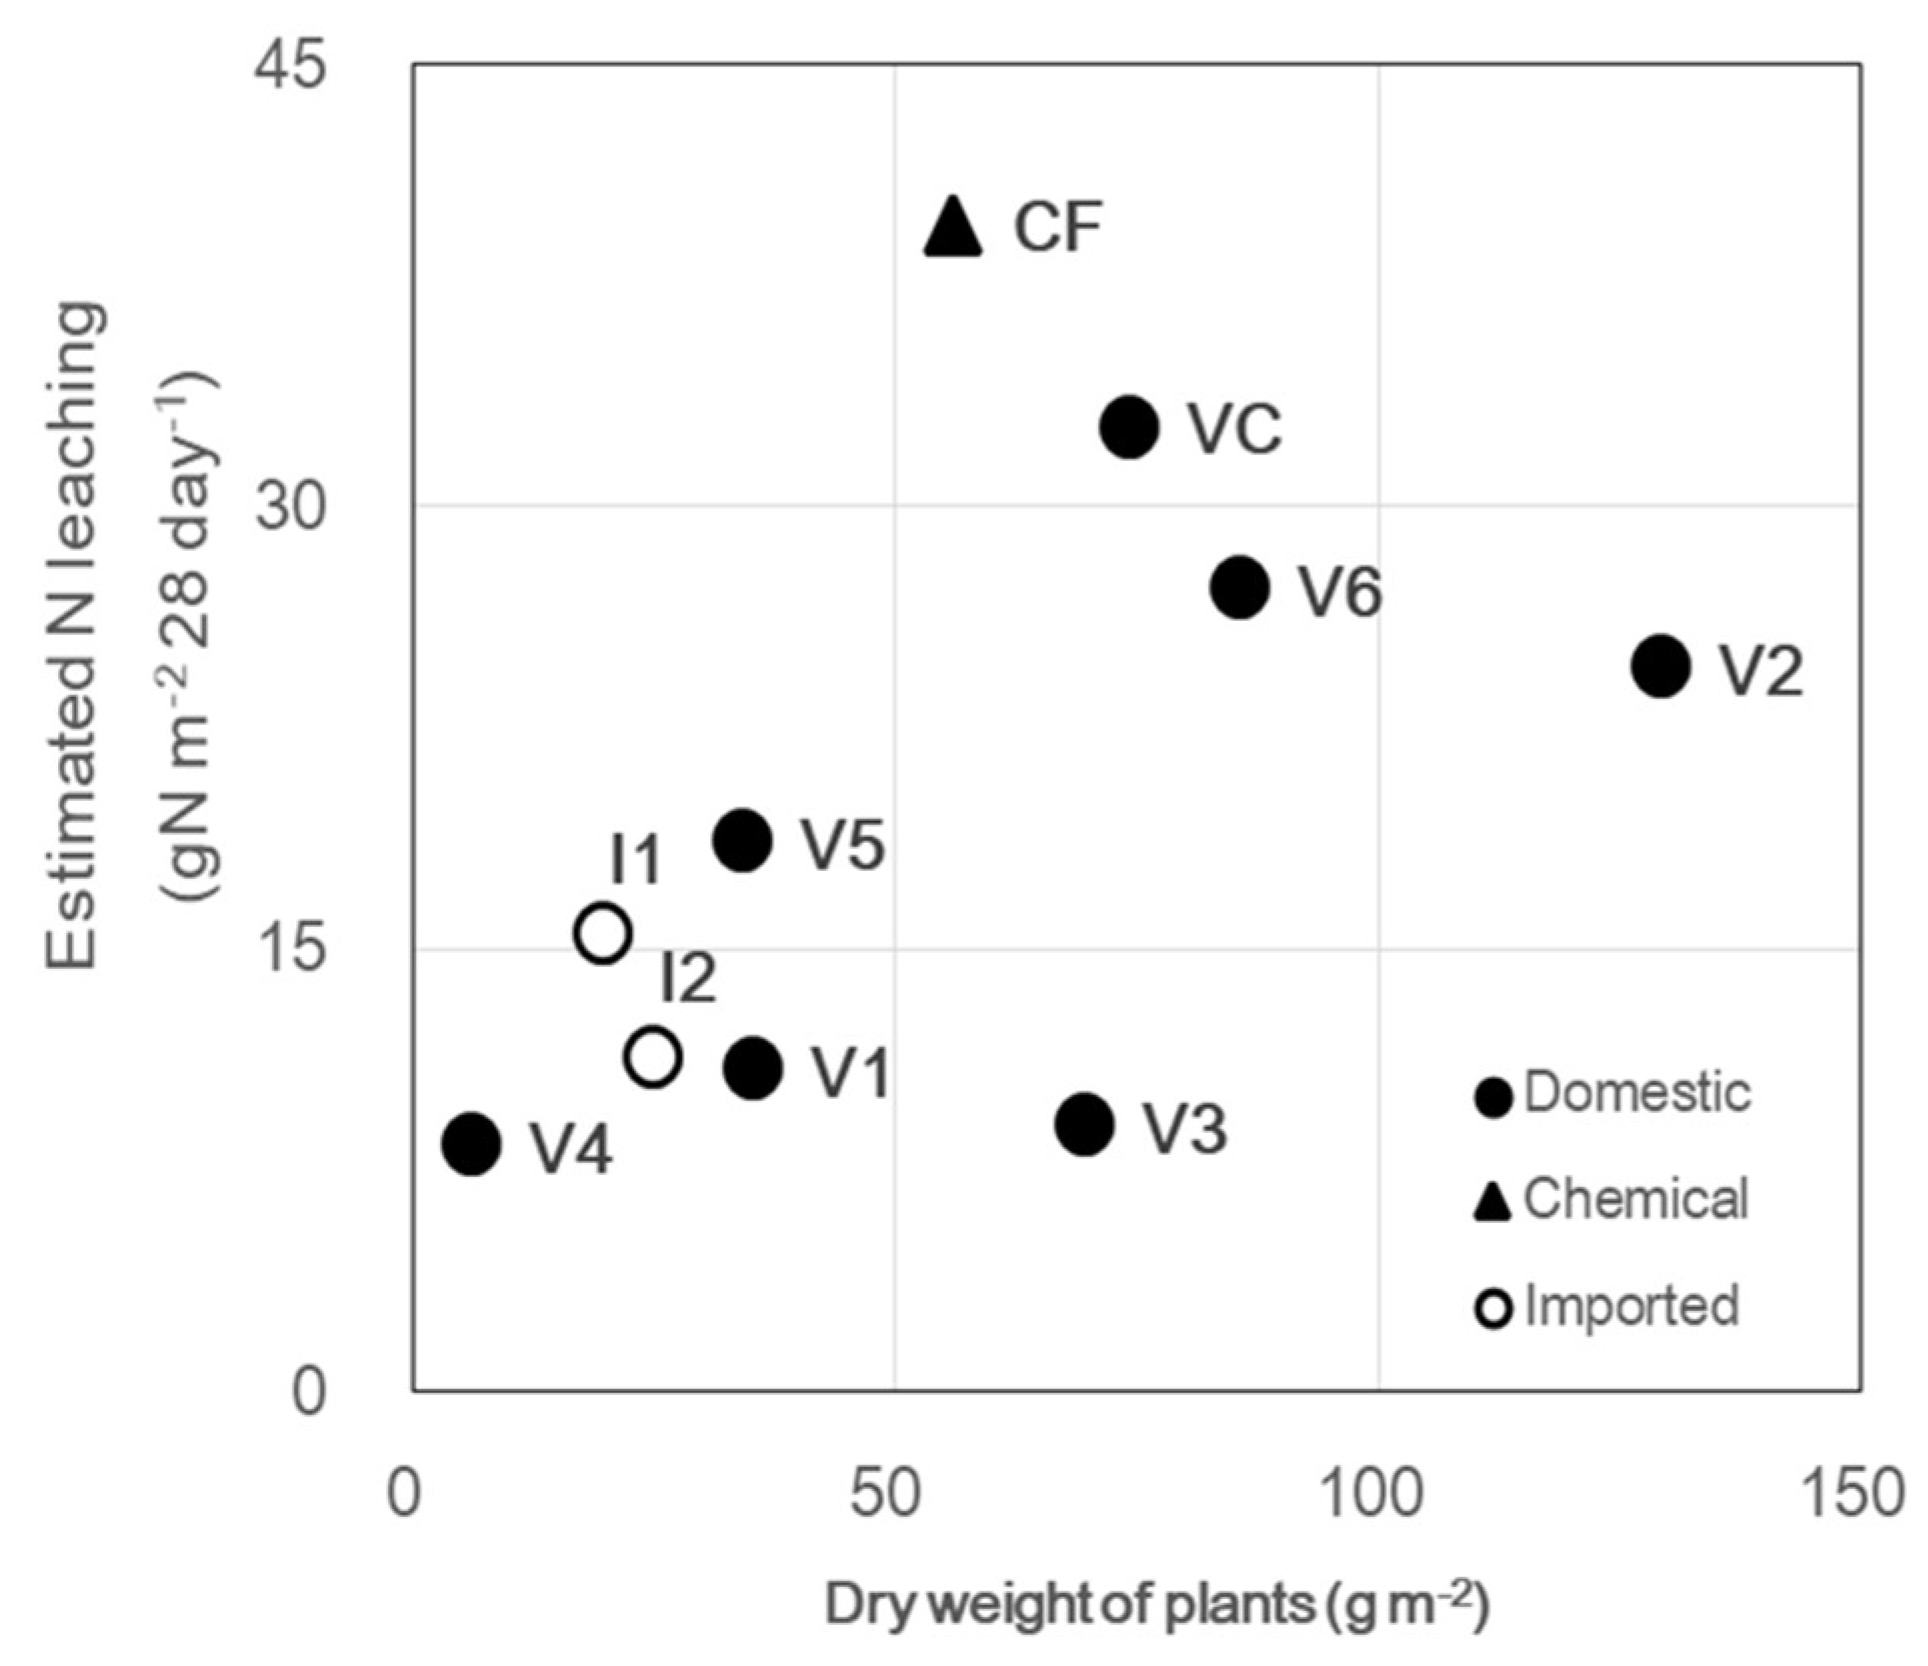
3.3. Effects of “Organic Fertilizers” on Plant Growth and N Leaching

The dry weight and N uptake of plants were significantly influenced by the fertilizer type and nutritional supplementation. The combined interaction of these factors had no significant effect on the dry weight and N uptake (Table 5 and Table 6, respectively). The P uptake was significantly influenced only by the fertilizer type (Table 7).
The dry weight and nutrient uptake effects of the fertilizer type and/or nutritional supplementation are presented in Table 8. Generally, the order of treatments for dry weight and nutrient uptake was as follows: domestic fertilizers ≥ chemical fertilizer ≥ imported fertilizers > control. Conversely, the effect of the domestic V4 treatment was not significantly greater than that of the corresponding control. With a single application (N-fertilizer), there was no significant difference in the dry weight among the domestic V6 and VC treatments and chemical fertilizer. In treatments with additional P and K (N-fertilizer + P, K), the dry weight was significantly greater for half of the domestic treatments (V2, V5, V6, and VC) than that of the corresponding chemical fertilizer. There was no significant difference in dry weight among treatments using the remaining domestic products, imported products, and chemical fertilizers.
The measurement of N uptake by plants and N stored in soil enabled us to estimate N leaching. A single application of chemical fertilizers and most domestic “organic fertilizers” resulted in significantly higher N leaching from soil than that by the application of imported products. The positive correlation between N leaching, and the ratio of inorganic N to total N in the applied fertilizers is illustrated in Figure 6 (r = 0.77, p < 0.01).
It has been reported that the majority of N in manure or compost is in the organic form that must first become mineralized before plants can uptake it, or it becomes susceptible to loss by leaching. Only a small fraction (3.5%) of their total N was mineralized within the growing season, resulting in the lowly met N requirement of crops. Compost is often reported to be less effective in supplying available N to plant during the first year of application compared to inorganic mineral fertilizer [28,31,32]. Organic fertilizers have been commonly applied to the soil to increase soil fertility and minimize N leaching. The application did not increase the loss of N through leaching compared with controls, and the compost provided advantages over mineral fertilizers from a water quality perspective [16,17,18,19,20].
However, the so-called organic fertilizers collected in our study showed the opposite effect. Our study ranked dry weight and nutrient uptake as follows: domestic “organic fertilizers” ≥ chemical fertilizers ≥ imported organic fertilizers > control. In addition, a single application of either chemical fertilizers or most domestic “organic fertilizers” resulted in significantly greater N leaching from the soil than that by the application of imported products. This indicates clearly that in poor-quality sandy soils, the application of chemical fertilizers or “fake” organic fertilizers should be considered a significant threat to groundwater (from excessive N leaching). The high leaching rate can be attributed to the high proportion of inorganic N to total N in the applied fertilizers. Figure 7 illustrates the relationship between dry weight and N leaching under a single application of the fertilizers. The application of chemical fertilizer and domestic “organic fertilizers” V2, V6, and VC resulted in an increase in both dry weight and N leaching, which was probably because of the high ratio of inorganic N to total N in these fertilizers. The application of imported fertilizers (I1 and I2) resulted in a lower dry weight of plants, but reduced N leaching. The poor crop response to the fertilizer, V4, and low level of N leaching from the soil in this treatment indicate N immobilization.
Finally, the effect of domestic “organic fertilizers” on crop yield was not in accordance with their price, which might be decided by the adjustment of the N and P content of the fertilizers. V6, V2, and VC were categorized as lower priced, and had lower concentrations of total N and total P, but their application was effective on plant growth. Meanwhile, V4 was the most expensive domestic “organic fertilizer”, with higher concentrations of total N and total P, but was not effective on plant growth.

4. Conclusions and Implications

Various fertilizers labeled as “organic fertilizer” are sold in Vietnam’s markets; however, with their manufacture being poorly regulated, their quality has not yet been fully explored. Our study clarified the nutrient composition of these fertilizers and elucidated their effects on plant growth and leaching loss of N from soil. Domestic products greatly varied in nutrient contents, and most of them contained a noticeably high proportion of inorganic N. In poor-quality sandy soil, the application of these fertilizers constituted a threat to groundwater quality because of N leaching. To clearly explain the marked difference in “organic fertilizers”, we investigated the production of a typical “organic fertilizer”. This helped to confirm that the addition of chemical materials is typically the final step in the production process for organic waste-based compost. No regulations on raw materials and the manufacturing of organic fertilizer, and an insufficient understanding of organic waste-based fertilizers are considered to be the main reasons for this situation.
These findings pose two important recommendations. First, it is necessary to build quality criteria guidelines for organic fertilizers in Vietnam. In developed countries, the criteria usually not only include nutrient levels and properties of compost, but also thresholds for pathogens and heavy metals. The operators of composting sites are cautious about accepting feed materials for composting process that will ensure that the finished compost product will meet requirements. They also give indicators to assess compost maturity level [33]. Second, the following issues regarding compost need to be evaluated and farmers, organic fertilizer companies, and related managers should be cautioned. N and P are the most controlled factors of plant growth, but the quality of compost does not depend on only their content. The addition of chemical substances to enhance the nutrient content in commercial products of so-called organic fertilizers needs to be considered because of both agronomic effectiveness and environmental aspects. Application of immature compost fixes N in the soil and restricts plant growth, and thus, compost must be mature before applying.
Our research provides useful information on the status of so-called organic fertilizers in Vietnam’s markets. However, the work has a number of limitations that need to be addressed by further study. Firstly, the collected sample quantity should be greater. Secondly, investigation of the flow of raw materials and production method of compost must be taken into account in various products that were made from different materials. Finally, in order to fully evaluate the effects of “organic fertilizers” on plant growth and nutrient leaching, more cultivation experiments need to be conducted.

Author Contributions

Writing, H.T.Q.; Research ideas, S.K.

Funding

This research was funded by the Japanese Ministry of Education, Culture, Sports, Science and Technology (MEXT) and the Research Grant for Encouragement of Students, Graduate School of Environmental and Life Science, Okayama University, Japan.

Acknowledgments

The authors wish to acknowledge the assistance with sampling and preparation of experiments by the members of the Laboratory of Environmental Soil Science, Okayama University. Our sincere thanks also goes to Vo Trung Tin, the director of Hopelandvietnam Co., Ltd. for his strongly support in the consultation and survey in Lam Dong provice, Vietnam. We thank the anonymous reviewers and the editor for their valuable comments.

Conflicts of Interest

The authors declare no conflict of interest.

References

  1. Parvathi, P.; Waibel, H. Fair trade and organic agriculture in developing countries: A review. J. Int. Food Agribus. Mark. 2013, 25, 311–323. [Google Scholar] [CrossRef]
  2. Rehber, E.; Turhan, S. Prospects and challenges for developing countries in trade and production of organic food and fibers: The case of Turkey. Br. Food J. 2002, 104, 371–390. [Google Scholar] [CrossRef]
  3. Dam, N.D.; Canh, D.X.; Ha, N.T.T.; van Tan, N.; Thieu, N.D. Vietnam organic agriculture: An overview on current status and some success activities. In Proceedings of the 4th ANSOFT Workshop—Gwangju, Jeonam, Korea, 18–20 October 2012. [Google Scholar]
  4. Dam, N.D. Production and Supply Chain Management of Organic Food in Vietnam. Available online: http://www.fftc.agnet.org/library.php?func=view&id=20150728143506&type_id=4 (accessed on 20 December 2017).
  5. The World Bank: Vietnam-Context. Available online: http://www.worldbank.org/en/country/vietnam/overview#1 (accessed on 1 April 2018).
  6. Tien, T.M. Vietnam soil resources. In Proceedings of the Asian Soil Partnership Consultation Workshop on Sustainable Management and Protection of Soil Resources, Bangkok, Thailand, 13–15 May 2015; Available online: http://www.fao.org/fileadmin/user_upload/GSP/docs/asia_2015/Vietnam.pdf (accessed on 1 April 2018).
  7. Kazuto, S.; Binh, N.T.; Quynh, H.T.; Yu, H. The effects of land-use change for rubber plantation on physical properties of surface soil in Central Vietnam. In Proceedings of the Japan—Vietnam Research Workshop on Sustainable Society Development in Asian Countries Talking Climate Change, Ho Chi Minh City, Vietnam, 2–3 November 2015. [Google Scholar]
  8. Vu, Q.M.; Le, Q.B.; Frossard, E.; Vlek, P.L.G. Socio-economic and biophysical determinants of land degradation in Vietnam: An integrated causal analysis at the national level. Land Use Policy 2014, 36, 605–617. [Google Scholar] [CrossRef]
  9. Nguyen, T.T.; Bauer, S.; Grote, U. Does land tenure security promote manure use by farm households in Vietnam? Sustainability 2016, 8, 178. [Google Scholar] [CrossRef] [Green Version]
  10. Ho, T.Q.; Hoang, V.; Wilson, C.; Nguyen, T. Eco-efficiency analysis of sustainability-certified coffee production in Vietnam. J. Clean. Prod. 2018, 183, 251–260. [Google Scholar] [CrossRef]
  11. Mordor Intelligence. Vietnam Organic Fertilizers Market (2016–2021), a Sample Report 2017. Available online: https://www.mordorintelligence.com/industry-reports/vietnam-fertilizers-market (accessed on 5 October 2017).
  12. Doan, T. Fertilizer Industry Report, 2015. Available online: http://www.fpts.com.vn/FileStore2/File/2015/08/11/FPTS-Fertilizer%20Industry%20Report.2015.pdf (accessed on 5 October 2017).
  13. Viet Nam News: Experts Urge Organic Fertilizer Use. Available online: http://vietnamnews.vn/economy/405614/experts-urge-organic-fertiliser-use.html#Kz12tHuMf9qzWFlJ.97 (accessed on 5 October 2017).
  14. Thanh, N.P.; Matsui, Y. Municipal solid waste management in Vietnam: Status and the strategic actions. Int. J. Environ. Res. 2011, 5, 285–296. [Google Scholar] [CrossRef]
  15. Dzung, N.A.; Dzung, T.T.; Khanh, V.T.P. Evaluation of coffee husk compost for improving soil fertility and sustainable coffee production in rural Central Highland of Vietnam. Resour. Environ. 2013, 3, 77–82. [Google Scholar]
  16. Quynh, H.T.; Kazuto, S.; Binh, N.T. Evaluation of composted municipal solid waste for agricultural use in Vietnam. J. Adv. Agric. Technol. 2018, 5, 14–18. [Google Scholar] [CrossRef]
  17. Kokkora, M.I.; Hann, M.J. Crop production and nitrogen leaching resulting from biowaste and onion compost amended sand. In Proceedings of the Eleventh International Waste Management and Landfill Symposium, Cagliari, Italy, 1–5 October 2007. [Google Scholar]
  18. Mamo, M.; Rosen, C.J.; Halbach, T.R. Nitrogen availability and leaching from soil amended with municipal solid waste compost. Environ. Qual. 1998, 28, 1074–1082. [Google Scholar] [CrossRef]
  19. Golabi, M.H.; Denney, M.J.; Iyekar, C. Value of composted organic waste as an alternative to synthetic fertilizers for soil quality improvement and increased yield. Compos. Sci. Util. 2007, 15, 267–271. [Google Scholar] [CrossRef]
  20. Hepperly, P.; Lotter, D.; Ulsh, C.Z.; Seidel, R.; Reider, C. Compost, manure and synthetic fertilizer influences crop yields, soil properties, Nitrate leaching and crop nutrient content. Compos. Sci. Util. 2009, 17, 117–126. [Google Scholar] [CrossRef]
  21. Nguyen, T.T.; Ruidisch, M.; Koellner, T.; Tenhunen, J. Synergies and tradeoffs between nitrate leaching and net farm income: The case of nitrogen best management practices in South Korea. Agric. Ecosyst. Environ. 2014, 186, 160–169. [Google Scholar] [CrossRef]
  22. Carter, M.R.; Gregorich, E.G. Chapter 6 nitrate and exchangeable ammonium nitrogen. In Soil Sampling and Methods of Analysis, 2nd ed.; CRC Press: Boca Raton, FL, USA, 2007; pp. 71–80. [Google Scholar]
  23. Doane, T.A.; Horwa´th, W.R. Spectrophotometric determination of nitrate with a single reagent. Anal. Lett. 2003, 36, 2713–2722. [Google Scholar] [CrossRef]
  24. Tan, K.H. Chapter 10 determination of macroelements. In Soil Sampling, Preparation, and Analysis; CRC Press: Boca Raton, FL, USA, 1996. [Google Scholar]
  25. Clapp, C.E.; Hayes, M.H.B.; Ciavatta, C. Organic waste in soils: Biogeochemical and environmental aspects. Soil Biol. Biochem. 2007, 39, 1239–1243. [Google Scholar] [CrossRef]
  26. Decision 36/2007/QĐ-BNN. Regulations Regarding Fertilizer Production, Distribution and Use; Ministry of Agricultural and Rural Development: Hanoi, Vietnam, 2007. (In Vietnamese) [Google Scholar]
  27. Nutrient Value of Compost. Available online: http://vric.ucdavis.edu/events/2009_osfm_symposium/UC%20Organic%20Symposium%20010609%2005b%20Hartz.pdf (accessed on 10 March 2018).
  28. Kuo, S.; Ortiz-Escobar, M.E.; Hue, N.V.; Hummel, R.L. Composting and Compost Utilization for Agronomic and Container Crops. Available online: https://www.ctahr.hawaii.edu/huen/composting_compost_util.pdf (accessed on 20 October 2017).
  29. Al-Bataina, B.B.; Young, T.M.; Ranieri, E. Effects of compost age on the release of nutrients. Int. Soil Water Conserv. Res. 2016, 4, 230–236. [Google Scholar] [CrossRef]
  30. Horrocks, A.; Curtin, D.; Tregurtha, C.; Meenken, E. Municipal compost as a nutrient source for organic crop production in New Zealand. Agronomy 2016, 6, 35. [Google Scholar] [CrossRef]
  31. Amlinger, F.; Götz, B.; Dreher, P.; Geszti, J.; Weissteiner, C. Nitrogen in biowaste and yard waste compost: Dynamics of mobilization and availability—A review. Eur. J. Soil Biol. 2003, 39, 107–116. [Google Scholar] [CrossRef]
  32. Hartz, T.K.; Mitchell, J.P.; Giannini, C. Nitrogen and carbon mineralization dynamics of manures and composts. HortScience 2000, 35, 209–212. [Google Scholar]
  33. Cofie, O.; Nikiema, J.; Impraim, R.; Adamtey, N.; Paul, J.; Koné, D. Co-composting of solid waste and fecal sludge for nutrient and organic matter recovery. In Resource Recovery and Reuse Series 3; CGIAR Research Program on Water, Land and Ecosystems: Colombo, Sri Lanka, 2016; pp. 22–24. [Google Scholar]
Figure 1. N content of so-called organic fertilizers in Vietnam’s markets. Notes: V1–V11, VC: domestic products; I1–I4: imported products; VC: the so-called organic fertilizer made from coffee by-products; HC: coffee by-products compost.
Sustainability 10 02437 g001
Figure 2. P content of the so-called organic fertilizers in Vietnam’s markets. Notes: V1–V11, VC: domestic products; I1–I4: imported products; VC: the so-called organic fertilizer made from coffee by-products; HC: coffee by-products compost.
Sustainability 10 02437 g002
Figure 3. K content of the so-called organic fertilizers in Vietnam’s markets. Notes: V1–V11: domestic products; I1–I4: imported products.
Sustainability 10 02437 g003
Figure 4. Relationship between total N and P of the so-called organic fertilizers.
Sustainability 10 02437 g004
Figure 5. Flow of raw materials and production method of an “organic fertilizer” from coffee by-products.
Sustainability 10 02437 g005
Figure 6. Correlation between N leaching and ratio of inorganic N to total N in the applied fertilizers. **, significant at p < 0.01.
Sustainability 10 02437 g006
Figure 7. Relationship between dry weight of plants and N leaching under single application of the fertilizers.
Sustainability 10 02437 g007
Table 1. pH value and nutrient contents (g kg−1) of soil used in the cultivation experiment.
ConstituentsValues
pH (H2O)8.99 ± 0.17
Total C≤0.001
Total N≤0.001
Total P0.01 ± 0.00
Total K2.26 ± 0.04
Total Mg1.72 ± 0.00
Total Ca3.24 ± 0.10
Values are means ± SD (n = 3).
Table 2. pH, C:N ratio, and concentration of other nutrients in the so-called organic fertilizers in Vietnam’s markets.
Domestic ProductsImported Products
pH (H2O)7.22(5.14~9.07)8.35(7.40~8.97)
C:N ratio8.88(3.22~19.43)9.16(7.71~10.62)
Total Ca28.45(10.44~61.78)60.14(40.29~69.59)
Exch.Ca0.02(0.00~0.05)0.04(0.03~0.05)
Total Mg3.88(0.88~7.19)5.20(4.34~6.40)
Exch.Mg2.40(0.13~5.77)3.92(2.91~4.40)
Values are average and the ranges are given in parentheses. Total Ca and Total Mg are expressed in g kg−1. Exch.Ca and Exch.Mg are expressed in cmol kg−1.
Table 3. General available information on collected samples.
Product NameSample LabelIngredient DescriptionsForeign Objects Mixed in ProductsProduct Shape, Instructions for UseMarket Price (USD/kg)
Domestic products
TRIMIX—N1V7Without indication Small granules,
For horticulture
1.46
SONG HUONGV1Without indicationSmall pieces of branches and litterSmall granules,
For all crops
0.09
HADICO—THANG LONG 03V8Without indicationSmall pieces of branches and litterSmall granules,
For horticulture
0.33
CFARM Pb02V9Without indicationSmall pieces of wood and nylonSmall granules,
For vegetables, horticulture
0.56
TRIBAT T—OV10Without indication Small granules,
For all crops
0.40
DAU TRAU HCMK7-HUU CO TRICHODERMA + TEV3Without indication Small granules,
For all crops
1.56
ORMIC 02—TRICHODERMAR sp—AZOTOBACTER spV4Without indication Fine powder
For all crops
2.22
HUU CO VI SINH MOI TRUONG HA NOIV5Without indicationSmall pieces of woodSmall granules,
For vegetables, horticulture
0.22
SONG GIANH 1V2Without indicationSmall pieces of stoneSmall granules,
For all crops
0.18
QUE LAM 01V6Residue of crops, fish, and seaweedSmall pieces of woodSmall granules,
For all crops
0.44
SONG GIANH 2V11Without indicationSmall pieces of wood, branches, stoneSmall granules,
For horticulture
0.22
PHAN CA PHEVCCoffee by-products For vegetables0.11
Imported products
MIEN TAY—WOPROFERT
(Holland)
I3Without indication For all crops2.22
NEUTROG—RAPID RAISER
(Australia)
I1Without indicationPieces of rice husks For all crops2.22
VIMAX 3-3-3
(Malaysia)
I4Without indication For vegetables, fruits, tobacco, coffee tree, flowers, and rice2.22
NEUTROG—BOUNCO BACK
(Australia)
I2Without indicationPieces of rice husks For all crops2.22
Table 4. Changes in the nutrient levels during the production of the “organic fertilizer”.
Raw MaterialAfter Composting After Bulking out Final Product
pHNA#8.518.039.01
Total C423.20417.2083.2064.20
Total N32.8034.806.4011.20
NH4+-NNA# 0.370.258.47
NO3-NNA#0.010.190.16
C:N ratio12.9212.0113.025.76
Total P0.700.610.992.99
Truog P0.280.170.040.54
Total K9.7112.544.484.20
Exch.K37.8725.684.135.06
Total Mg0.410.710.370.65
Exch.Mg2.392.300.660.82
Total Ca1.552.490.833.05
Exch.Ca 3.264.692.027.98
Nutrients content is expressed in g kg−1. Exchangeable cations are expressed in cmol kg−1. NA#: not analyzed.
Table 5. Two-way analysis of variance (ANOVA) testing the effects of fertilizer type and nutritional supplementation on the dry weight of plants.
Source of VariationSSdfMSFp-ValueF Crit
Fertilizer type153,238.001015,323.809.324.7 × 10−82.05
Nutritional supplementation13,825.79113,825.798.410.00584.06
Interaction12,841.96101284.190.780.64632.05
Table 6. Two-way analysis of variance (ANOVA) testing the effects of fertilizer type and nutritional supplementation on N uptake.
Source of VariationSSdfMSFp-ValueF Crit
Fertilizer type155.23917.256.142 × 10−52.12
Nutritional supplementation17.67117.676.290.0164.08
Interaction15.0891.680.600.7922.12
Table 7. Two-way analysis of variance (ANOVA) testing the effects of fertilizer type and nutritional supplementation on P uptake.
Source of VariationSSdfMSFp-ValueF Crit
Fertilizer type0.0890.016.2418 × 10−62.12
Nutritional supplementation0.0010.000.860.36014.08
Interaction 0.0590.013.820.00152.12
Table 8. Dry weight and nutrient uptake of treatments.
TreatmentN-FertilizerN-Fertilizer + P, K
Dry Weight (g m−2)Uptake (mg kg−1)Dry Weight (g m−2)Uptake (mg kg−1)
NPNP
V141.83ab2.60b0.03ab52.33ab2.64ab0.04ab
V2161.67c3.70bc0.13c174.83b5.33b0.11b
V377.33ab4.61c0.21d86.17ab4.81b0.04ab
V47.67a0.17a0.01a12.50a0.52a0.02a
V537.50ab2.29b0.06b109.67b4.37b0.08ab
V6106.75b0.96ab0.07b191.50b4.44b0.11b
VC81.00b3.99bc0.09b119.17b5.15b0.06ab
I124.83ab0.26a0.02ab69.50ab0.80a0.04ab
I230.33ab0.37ab0.03ab69.67ab1.07ab0.05ab
Chemical69.83ab1.63ab0.05ab71.83ab2.29ab0.05ab
Control9.50a0.07a0.01a
Different letters within a column indicate difference among treatments at the 0.05 level.

