1. Introduction
Sulfur hexafluoride (SF
6) is one of the controlled greenhouse gases identified by the 1997 Kyoto Protocol, because of its high global warming potential (GWP; 23,900). Emissions of SF
6 are derived mainly from four sources: equipment (gas circuit breakers (GCB), gas-insulated switchgear (GIS), and gas-insulated transformers (GIT) as an insulator) used in electricity transmission and distribution (hereafter, electrical equipment), magnesium smelting, semiconductor manufacturing, and SF
6 production [
1]. Globally, electrical equipment constitutes the largest source of SF
6 emissions. The excellent insulating and arc-extinguishing characteristics of SF
6 have led to its widespread use in electrical equipment such as gas circuit breakers, gas-insulated switchgear, and gas-insulated transformers. The total amount of SF
6 emissions globally in 2010 was equivalent to 1.25 Gt of CO
2 (GtCO
2e), and it subsequently continued to increase at a rate of 10% annually [
2,
3]. In developed countries [
4], SF
6 emissions have been reduced substantially through stabilized electricity consumption, technical developments, and emission reduction measures. Corresponding studies have shown that the recent growth of SF
6 emissions has been mainly attributable to rapidly increasing demand for electricity in non-Annex I countries [
1]. According to the International Energy Agency’s World Energy Outlook, global electricity demand is projected to grow by 30% during 2015–2040 [
5], most of which will be driven by developing countries. Therefore, the emission and control of SF
6 in developing countries such as China will play very important roles in the control of SF
6 emissions globally.
According to the National Emission Inventory of China, the total quantity of SF
6 emissions in 2012 was 1000 t [
6], i.e., more than twice the 2005 level (People’s Republic of China Second National Communication on Climate Change, SNC) [
7], 95% of which was attributed to electrical equipment. To meet environmental requirements, the use of SF
6 gas has been phased out of semiconductor production and, after 2010, the use of SF
6 as a protective gas in magnesium production in China was halted [
8,
9]. Additionally, given recent improvements in technology and management, leakage during the SF
6 production process can be regarded as negligible. Therefore, electrical equipment remains the primary sector for SF
6 consumption and the main source of future SF
6 emissions.
China is the consumer of the largest quantities of SF
6 in the world. Since 2010, the installed electrical capacity of China has been the largest globally, and most of its new electrical equipment has used SF
6 as the arc-quenching gas. China’s annual consumption of SF
6 was 5000–7000 t in 2010, and this has increased at a rate of 20% annually [
10,
11,
12]. Meanwhile, China has also played an important part in SF
6 emissions, accounting for about one third of the global total, and its rate of increase of SF
6 emissions has been much greater than that of CO
2, CH
4, and N
2O [
13,
14,
15,
16]. Therefore, control of the consumption and emission of SF
6 in China’s power sector is highly important in relation to global SF
6 emission reduction.
Research on the future SF
6 emission scenario in China is limited. A few studies have considered the consumption and emission of SF
6 in relation to electrical equipment in power sector. Other related research has focused mainly on CO
2 emissions from fossil fuel combustion and on the inventory of SF
6 emissions, and only a few studies have investigated future SF
6 emission trajectories [
17,
18,
19]. Several studies on SF
6 emission inventories have been conducted using methodologies incorporating a Lagrangian model [
20,
21,
22,
23] and the emission inventory method [
1,
6,
7,
24,
25]. Some studies have focused on greenhouse gas emissions from the power industry [
26,
27,
28], but without conducting detailed analyses on SF
6 emissions. Although recent analysis has considered China’s SF
6 emissions and emission reduction potential by 2020 [
1], there has been no investigation of long-term estimations of SF
6 emissions from China’s power sector [
29].
Most previous studies of SF
6 scenarios have used SF
6 consumption as a proxy for emissions. However, SF
6 emissions in the power sector are not equivalent to its consumption because of the so-called “delayed emission effect.” As a protective gas, SF
6 is usually consumed (i.e., filled and sealed) during the process of equipment production and during its installation. In routine operation, although small amounts of SF
6 can be emitted primarily through leakage, the bulk of SF
6 emission occurs during equipment maintenance and/or retirement [
10,
25,
29]. Therefore, there can be a considerable difference between the consumption and the emission of SF
6 in any given year. The lifetime of electrical equipment in the power sector is usually 30–40 years. Therefore, if the delayed emission effect are not considered, current consumption will be selected as an estimate of annual emissions. Such an assumption would usually overestimate short-term emissions and underestimate long-term emissions, which would have important consequences for assessments of global greenhouse gas concentrations and the effects of global warming.
Another shortcoming of earlier research is the uncertainty associated with electrical equipment. The lack of basic data regarding the consumption and emission of SF
6 associated with China’s electrical equipment has resulted in a level of uncertainty in historical emission estimations of about 2–3 times [
20,
21,
22,
23,
24,
25,
26,
27,
28,
29]. Given the installed capacity of electrical equipment in China has increased rapidly in recent years, the level of uncertainty in estimations of the consumption and emission of SF
6 could be even greater in the future [
30,
31].
In addition, studies have shown that several alternative gases with low GWP value may replace SF
6 gradually or partially in electrical equipment in power sector. But it is a long-term process and the SF
6 cannot be substituted completely in the short term. In near future, the mixed gas of SF
6/N
2 has the most application prospect to partially replace SF
6. In the long run, lower GWP gas may be used to completely replace SF6 [
1,
2,
4,
13]. The projection of SF
6 emissions in China could be further improved in two respects: consideration of delayed emission effects and examination of sensitivity analyses on electrical equipment scenarios. This study complements previous research by focusing on the improvement of the estimation method and on the reduction of estimation uncertainty. For the projection of SF
6 emissions, we constructed a model that considers the delayed emission effect by incorporating factors such as installed capacity, technology choice, and technology improvement and substitution. Furthermore, scenario analyses and sensitivity analyses [
32,
33,
34,
35,
36] were performed to reduce the uncertainties of related parameters and of the calculated results.
The remainder of this paper is organized as follows. In
Section 2, we detail our research method and define some key assumptions, such as the installed capacity of the power sector, lifetime of electrical equipment, emission factor, recovery ratio, and substitution ratio. In
Section 3, we discuss the results, including the consumption and emission of SF
6 in the future, its cumulative consumption and emission, sources of consumption and emission, emission reduction potential, as well as the delayed emission effects. In
Section 4, we describe the sensitive analysis performed on key parameters of SF
6 consumption and emission. In
Section 5, we summarize our research conclusions and key findings regarding the consumption and emission of SF
6 in relation to electrical equipment.
2. Method and Key Parameters
Models used to calculate SF
6 emissions can be divided into two categories [
25]. Those in the first category adopt a simplified calculation method that does not consider the difference between consumption and emission due to the delayed emission effect. Thus, consumption of SF
6 can be used as a proxy for emission. Such a simplified methodology is approximately correct for sectors in which SF
6 is used as a cover gas, such as magnesium production. However, for electrical equipment, consumption can no longer be regarded an accurate estimate of emission because of the long lifetime of the equipment and the associated delayed emission effect. Therefore, models of the second category adopt a revised methodology that accounts for the delayed emission effect, which is usually disproportionate to the specific activity or consumption of any given year but closely related to the cumulative activity or consumption of SF
6 stock. As a cumulative variable, the SF
6 stock is closely related to various characteristics of the electrical equipment such as its type, lifetime, survival, and retirement curve. However, the SF
6 stock is also dependent on the filling quantity per unit capacity, leakage rate, and other factors such as technological improvements, management level, substitute products, and recycling technology.
In this study, we use the revised methodology that accounts for the delayed emission effect to calculate SF
6 emissions. In this section we first describe methodology in detail in
Section 2.1, then elucidate the future scenario setting in
Section 2.2, and finally discuss and estimate the key parameters and assumptions in
Section 2.3.
2.1. Methodology
2.1.1. Method of Calculating SF6 Emissions
A method for calculating the SF
6 emissions of electrical equipment was proposed in 2006 by the Intergovernmental Panel on Climate Change (IPCC), i.e., the IPCC Tier 2 country-specific emission factor method [
25]. Based on the equipment life cycle, the SF
6 emissions associated with electrical equipment can be divided among four processes: manufacture, installation, operation and maintenance, and disposal. The emissions associated with the first two processes are mainly related to production quantity and the newly added installed capacity of electrical equipment, whereas the emissions associated with the final two processes are mainly related to the stock of electrical equipment in operation. The emissions associated with the manufacture and installation processes are difficult to distinguish; therefore, they are amalgamated in our analysis.
The emissions from each process are usually equal to the product of the current activity (Activity) or the cumulative activity (Stock) and the emission factor (Emission factor). With consideration of the possibility of recycling during the retirement process, the calculation of SF
6 emissions for electrical equipment in year
t can be expressed as
where
Et is the total quantity of SF
6 emissions (t),
CM,t is the quantity of SF
6 in the electrical equipment newly manufactured and installed in year
t (t),
EFM,t is the SF
6 emission factor of the electrical equipment newly manufactured and installed in year
t (t/t),
So,t is the current stock of electrical equipment in operation (including the newly added electrical equipment) (t),
EFo,t is the SF
6 emission factor of the stock of electrical equipment in operation (including the newly added electrical equipment) (t/t),
DD,t is the residual quantity of SF
6 of the electrical equipment retired in year
t (t), and
RD,t is the recycling coefficient of the residual SF
6 of the electrical equipment retired in year
t (%).
2.1.2. Method of Calculating SF6 Consumption
Consumption of SF
6 occurs primarily during the process of filling during manufacture and refilling during routine operation and maintenance [
1]. Generally, the quantity of SF
6 emission during the process of operation and maintenance is mainly attributed to natural leakage, which is replenished during the maintenance process. Therefore, the emissions during routine operation and maintenance are approximately equal to the quantity of SF
6 refilled (consumed) during this process. In the process of electrical equipment disposal, SF
6 can be recycled and reused. Therefore, the equation describing the net SF
6 consumption in each part of Equation (1) can be expressed as follows:
where
Ct is the total quantity of SF
6 consumed in year
t (t), and the other parameters are as described in Equation (1).
The quantity of SF
6 consumed in filling the newly added electrical equipment can be obtained by multiplying the capacity of the new electrical equipment by the SF
6 filling quantity per unit capacity, and then deducting substituted SF
6, as shown in Equation (3).
where
Nt is the newly added electrical equipment capacity in year
t (GW), which equals the net newly installed capacity plus the retired installed capacity;
At is the filling quantity of SF
6 per unit of added electrical equipment (t/GW); and
SA,t is the ratio of SF
6 substituted in the newly added electrical equipment (%).
The SF
6 stock of electrical equipment in operation is equal to the sum of SF
6 in the surviving electrical equipment put into operation in previous years (within the range of equipment lifetime), which is related to factors such the equipment lifetime, service time, survival ratio of electrical equipment, and ratio of substituted SF
6, as shown in Equation (4).
where
SRt−j+1 is the survival ratio of newly added electrical equipment in year
t −
j (%),
n is the equipment lifetime (a), and the other parameters are as explained in Equation (3).
As electrical equipment reaches the end of its life and/or its retirement time, residual SF
6 in the electrical equipment is either emitted directly into the atmosphere or recovered/destroyed. The capacity of retired equipment in year
t is equal to the sum of the capacity of the retired equipment that was put into operation in previous years. The residual quantity of SF
6 in the retired equipment (
DD,t) can be expressed as in Equation (5):
where
PD,t is the ratio of residual SF
6 in the retired electrical equipment (%) (i.e., fraction of charge remaining at retirement) [
25],
DRt−j is the retirement ratio of newly added equipment in year
t −
j (%), and the other parameters are as explained in Equation (3).
2.1.3. Method of Calculating the Survival and Retirement Ratios of Electrical Equipment
To consider the delayed emission effect of SF
6, it is necessary to consider the aging and retirement process of the electrical equipment. The lifetime of electrical equipment is usually 30–40 years, and the retirement curve can be determined as follows. Equipment is retired each year, and the retirement rate is low at the beginning of its operation. However, the retirement rate is increased substantially toward the end of the equipment lifetime [
37,
38,
39]. To quantify the survival ratio and the retirement curve, a Weibull function with dual parameters is proposed as the survival ratio function. Meanwhile, the retirement rate function is the absolute value of the derivative of the survival ratio function (i.e., the annual retirement ratio), shown as Equations (6) and (7).
where
SRt is the survival ratio of the newly added equipment in year
t (%),
SPt is the survival quantity of the newly added equipment in year
t (GW),
RP is the total quantity of the newly added equipment (GW),
DRt is the retirement ratio of equipment in year
t (%),
K is the function shape parameter (dimensionless), and
T is the average lifetime of the equipment (a).
For this study, the average lifetime of electrical equipment was taken as 30 years, and the function shape parameter was generally one third of the equipment lifetime [
39,
40,
41] and was chosen as 10. For newly added equipment put into operation, the survival ratio and the retirement ratio for each year are as shown in
Figure 1. Once the equipment is put into operation, the equipment survival ratio is high and the retirement ratio is small during the first 20 years. As the age of the equipment reaches 30 years, the retirement ratio reaches its peak. Then, the retirement ratio reduces gradually as the proportion of surviving equipment is reduced. After 40 years, the survival and retirement ratios are close to zero.
2.2. Future Scenario Setting
Two different types of factor affect the consumption and emission of SF6. The first category comprises driving factors, i.e., principally the future installed capacity of electrical equipment, which is determined mainly by population, electricity demand, and the share of renewable energy. The second category is related to factors of SF6 technology, which include technological improvements, management level, substitution ratio, recovery ratio, and policies for the regulation of SF6. Considering the uncertainty associated with the future development of these relevant factors, we established three scenarios: a Business As Usual scenario (BAU), Carbon Mitigation Scenario (CMS), and Deep Mitigation Scenario (DMS).
BAU: Business as Usual scenario
In this scenario, per capita electricity demand is high, installed generation capacity increases dramatically, and the proportions of wind and photovoltaic power increase substantially. The SF6 technology is frozen at current levels, and the consumption and emission rates per unit equipment remain at fixed at current levels. Moreover, only limited substitution of SF6 is adopted in electrical equipment, and a limited quantity of SF6 is recycled during the disposal process because of current relaxed policies and regulations concerning SF6.
CMS: Carbon Mitigation Scenario
In this scenario, per capita electricity demand is moderate, installed generation capacity increases at a modest rate, and the proportions of wind and photovoltaic power increase substantially. Although China has no mandatory legislation/regulation for the control of the consumption and emission of SF
6, reducing or limiting the use of SF
6 is an inevitable trend given technological developments and policy changes in relation to greenhouse gas emissions [
1]. The consumption and emission of SF
6 can be reduced through the following measures: (1) reduced filling quantity and minimized leakage rate through improvements in technology and management; (2) an increased recycling ratio prompted by stronger policy incentives; and (3) an increased ratio of substitution of SF
6.
DMS: Deep mitigation scenario
In this scenario, with consideration of the low-carbon development strategy and strict environmental and resource constraints, electricity demand grows slowly and future per capita electricity demand is relatively low in comparison with the other scenarios. Moreover, the developments of wind and photovoltaic power are reasonably slow and the installed generation capacity increases slowly. However, improvements in SF6 technology and in the substitution and recycling ratios are substantial.
These three scenarios are typical and represented the full range of uncertainty in the SF6 consumption and emission in the future considering different factors uncertainty range. And the information for each parameters setting are detailed in
Section 2.3.
2.3. Key Parameters and Assumptions
2.3.1. Population, Per Capita Electricity Demand, and Installed Capacity
The consumption and emission of SF
6 from electrical equipment are proportional to the activity level of the power sector. In this paper, similar to the approach adopted in the SNC [
7], the installed capacity is used to represent power sector activity. Thus, the SF
6 consumption and emission of the manufacture and installation processes, operation and maintenance emissions, and disposal emissions are proportional to the newly added installed capacity, stock in operation, and retired capacity, respectively.
Installed capacity is determined by the total electricity demand and the electricity structure, which are closely related to population, per capita electricity demand, and share of renewable energy. The population of China continues to grow at a reasonably slow rate. In 2015, the population of China was 1.38 billion. It is expected to reach a peak of 1.42 billion in 2030, before reducing slowly to 1.40 billion by 2050. In 2015, the installed electricity capacity of China was 1525 GW, and the per capita electricity demand was 4100 kWh, i.e., about half that of OECD countries in 2015 [
30]. Various research has shown the installed generation capacity of China could reach 3000–3500 GW by 2050 [
17,
26]. Considering the uncertainties of per capita electricity demand and future development of renewable energy, this study considered three scenarios for the per capita electricity demand in 2050: 6500, 7500, and 8500 kWh. Meanwhile, the generation shares of wind and photovoltaic power in the three scenarios are projected to increase to 18%, 28%, and 35%. The newly installed capacity is large in the early stage, and it gradually decreases toward the later stage. By 2050, the total installed capacity is considered to reach saturation level. The corresponding installed capacities are shown in
Table 1.
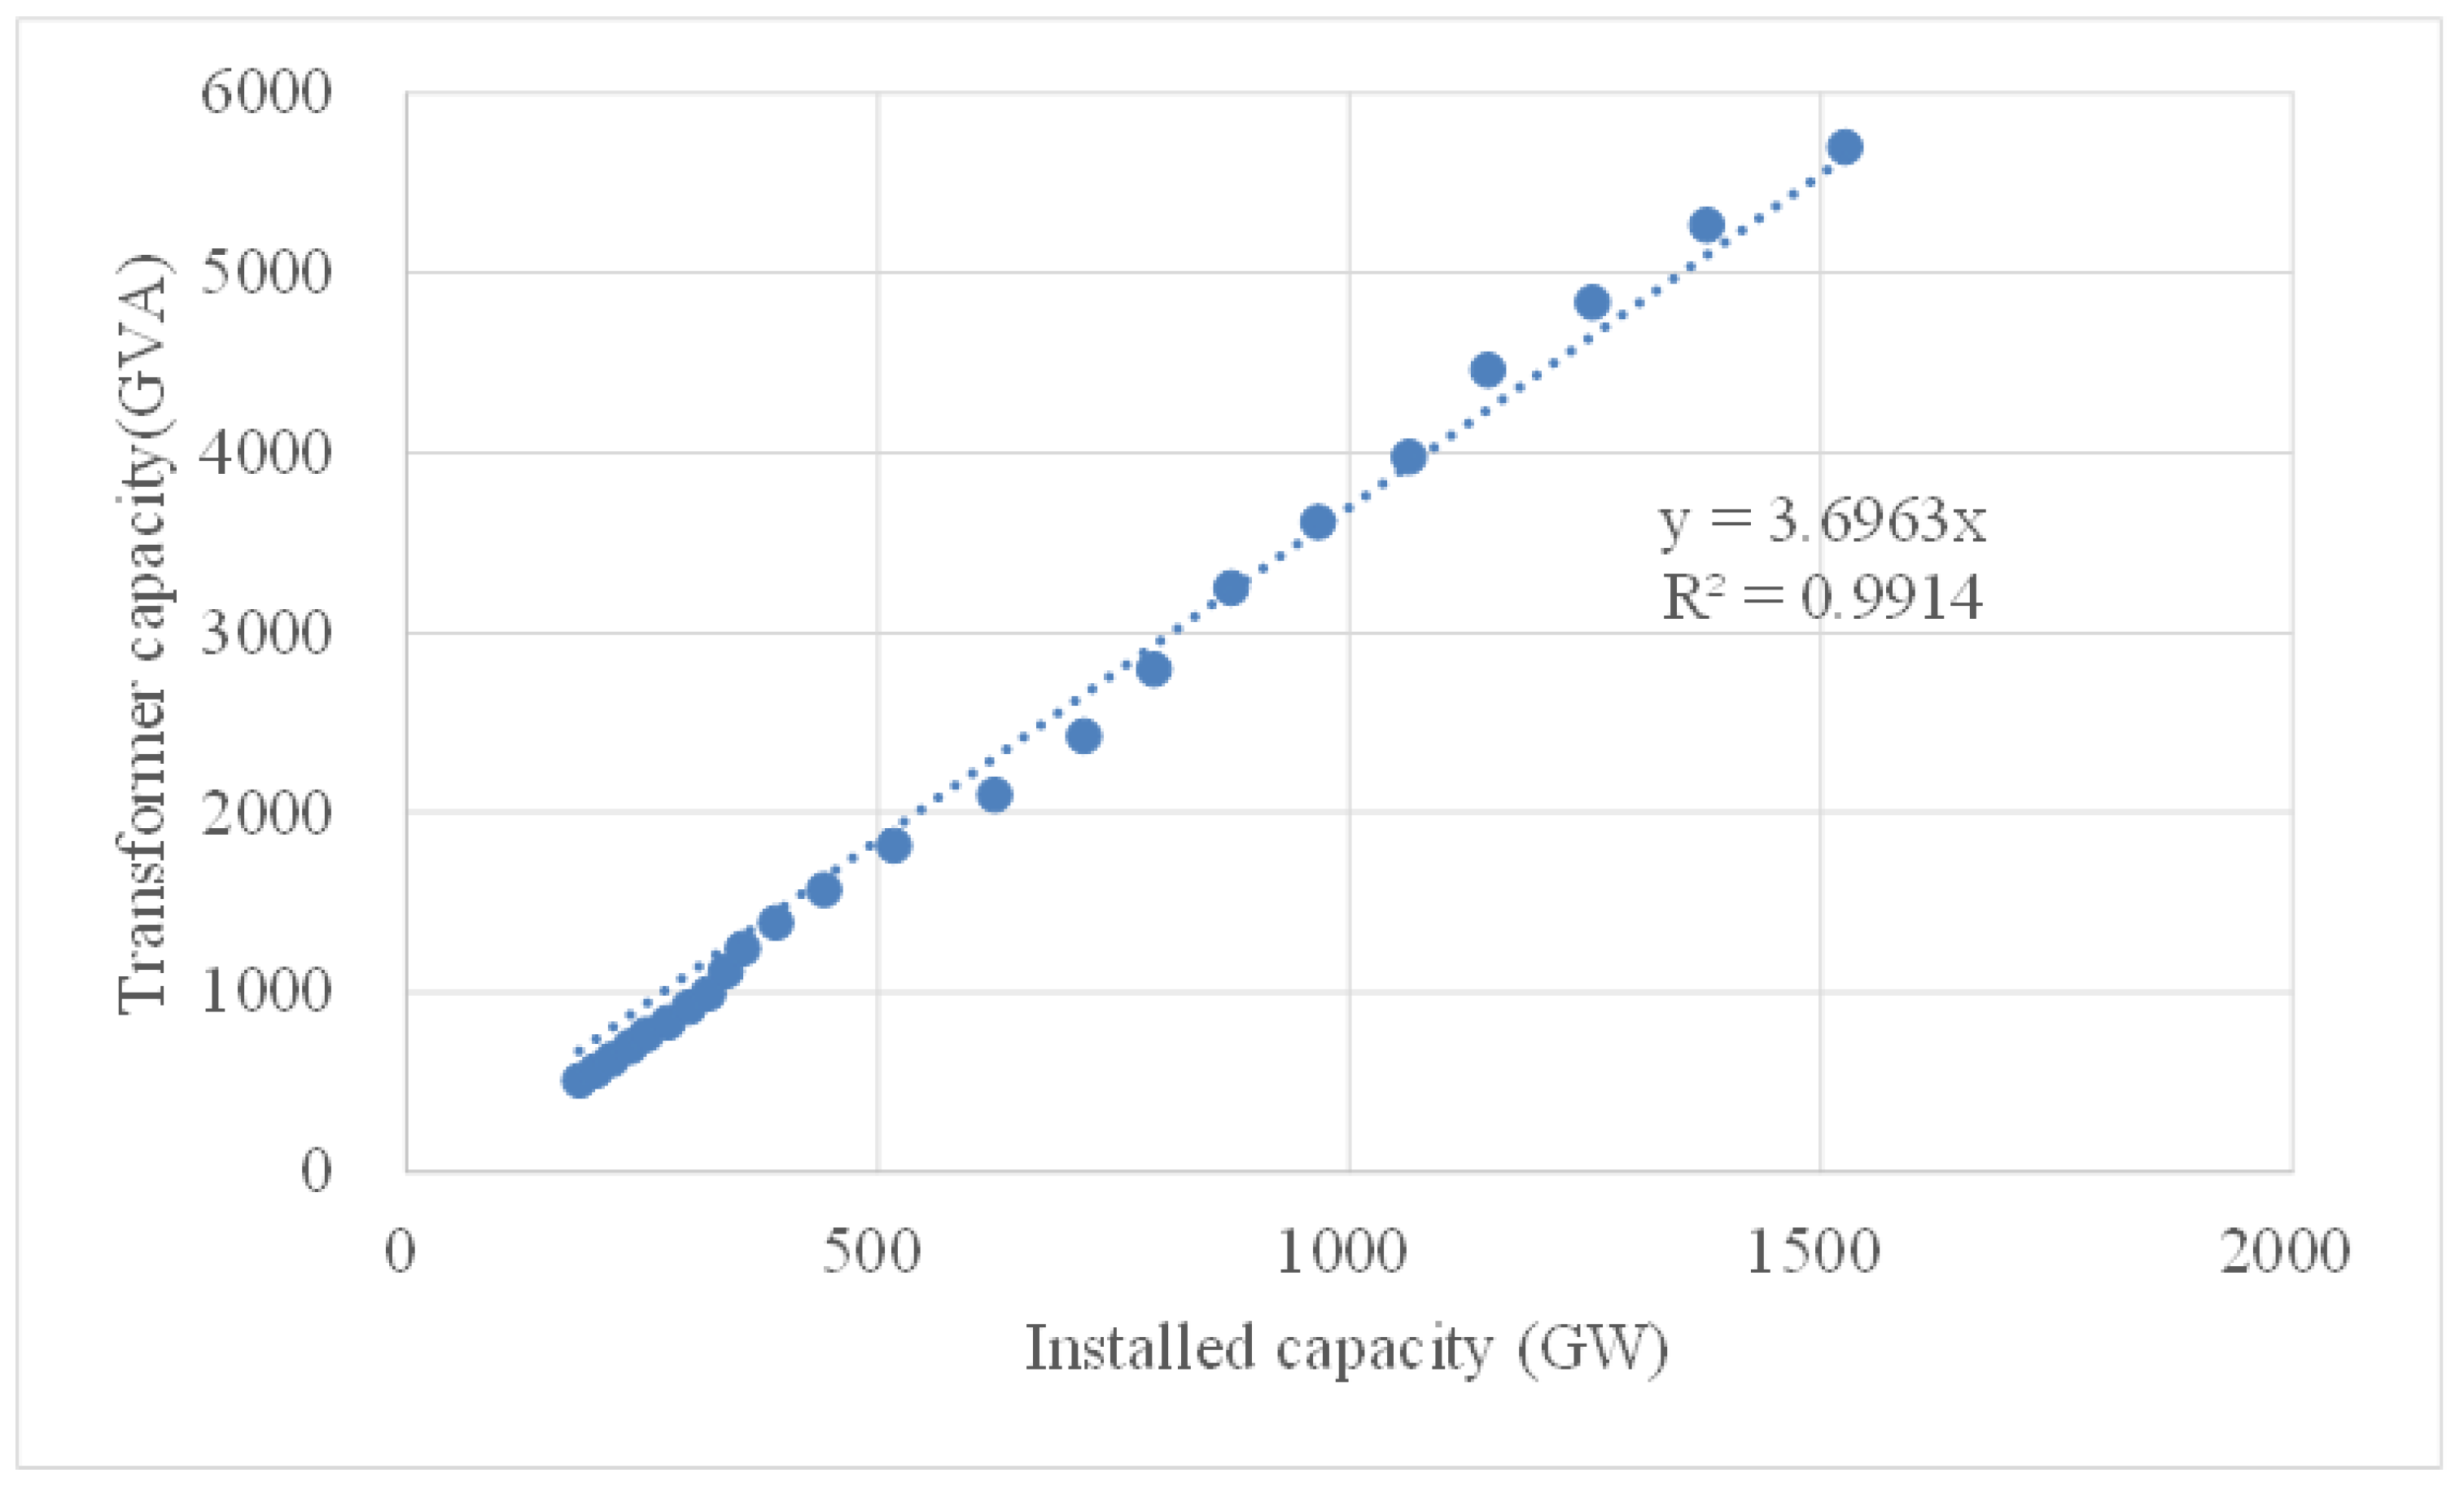
2.3.2. Relationship between Installed Capacity and Transformer Capacity of Electricity in Power Sector
SF
6 is mainly used in gas circuit breakers, gas-insulated switchgear, and gas-insulated transformers as an insulator for the electrical equipment. Generally, these devices are installed in transformer substations and switch stations with various voltage grades ranging from 35 to 1000 kVA, and the transformer substation capacity determines the scale of electricity demand or supply load. Therefore, the consumption and emission of SF
6 are proportional to transformer capacity. For the National Emission Inventory of China in 2012, the national SF
6 emission was estimated using transformer capacity as the driving factor in the sample region [
6]. For the SNC in 2005, the installed capacity of the sample region was used as the driving factor to estimate national SF
6 emissions [
7]. According to statistics of installed capacity and transformer capacity above 35 kVA in China during 1993–2015, the relationship between transformer capacity and installed capacity is approximately linear with a coefficient of determination (R
2) of 0.9914, as shown in
Figure 2. Thus, installed generation capacity can be used as a proxy for transformer capacity to represent the driving factor of SF
6 consumption and emission.
2.3.3. Emission Parameters of SF6
The parameters related to SF6 emission include the filling quantity of SF6 per unit of newly added installed capacity, equipment lifetime, the substitution ratio of SF6, emission factors of manufacture and installation, emission factor of operation and maintenance, the residual ratio, and the recovery ratio. In this study, 2015 was selected as the base year, and the related parameters were collected from the SNC and other relevant literature. Sensitivity analyses on the key parameters are investigated in the following sections.
As shown in
Table 2, the related emission parameters were collected from National Emission Inventory in 2005 [
7] or IPCC 2006 [
25]. The ranges of parameters are also compared with related literature. For the BAU, the emission parameters were frozen as those of the SNC. For the DMS, the lower bounds of the ranges for the filling and emission factors were selected, as were the upper bounds of the ranges for the substitution and recovery ratios. For the CMS, the averages of the BAU and DMS parameters were adopted. For all scenarios, the parameters for intervening years between the base year and 2050 were obtained via linear interpolation.
The initial filling quantity per unit of installed generation capacity is the amount of SF
6 consumption per GW of newly installed capacity. Based on historical data of SF
6 consumption and installed capacity during 2001–2010 [
4,
13], the range of this parameter is 40–66 t/GW, with a median value of 52 t/GW.
The substitution of SF6 is only considered in newly manufactured and installed equipment because of the technological requirements. Research has shown that SF6 cannot be substituted completely in the short term. Moreover, the mixed gas of SF6/N2 can only partially substitute SF6. In the long term, a gas with a low GWP might be used to substitute SF6. Therefore, the substitution of SF6 to achieve emission reduction is a long-term process. The substitution ratio was generally zero in 2015, and it was assumed that the substitution ratio of new electrical equipment could be increased to 100% by 2050; thus, SF6 could be substituted completely under the DMS. Therefore, the range of this parameter was selected as 0–100%.
The IPCC default values of emission factors (including natural leakage and emissions of operation, maintenance, and disposal) are 2.6% for the EU, 0.7% for Japan, and 2.0% as a global average. However, there is no default emission factor specified for China [
25]. The literature indicates that the operation and maintenance emission factor was 4.38% in 2010, based on the actual SF
6 consumption data of the Guangdong power grid [
29]. This is similar to the value of 4.7% of the SNC, which was based on SF
6 consumption data of the North China power grid [
3]. Therefore, the operation and maintenance emission factor was set as 0.7–4.7%. In addition, the emission factor of manufacture and installation in the literature and the SNC was 2.18% (1.71–3.25%) [
1] and 8.6%, respectively. Therefore, the range of the manufacture and installation emission factor was set as 1.71–8.6%.
Most electrical equipment in China that incorporates SF
6 is not at the retirement stage. In addition, because of technological limitations, the SF
6 recovery ratio remains low [
4]. In 2007, the National Power Grid Corp. undertook pilot projects on SF
6 recycling in three provinces: Gansu, Hebei, and Sichuan. By 2014, the National Power Grid Corp. established several processing centers for the recovery of SF
6 in Shanxi, Tianjin, Inner Mongolia, Jiangxi, and other provinces. These centers demonstrated the technical feasibility of the process by achieving a recovery and reutilization rate of SF
6 of 98%. However, the total national scale of SF
6 recovery remains almost negligible. Therefore, assuming appropriate technological development and the introduction of relevant policies, the SF
6 recovery ratio of retired electrical equipment was considered to vary from 0% initially to 100% by 2050 [
35,
36,
37].
5. Conclusions
This research explored the future SF6 consumption and emission pathways associated with electrical equipment in China according to the equipment life cycle. Considering the delayed emission effect, equipment survival, and retirement curves, three scenarios were investigated: BAU, CMS, and DMS. The analysis also examined future SF6 consumption and emission, cumulative consumption and emission, the sources of consumption and emission, the potential for and contributions to emission reduction, and the delayed emission effect. Moreover, the sensitivity of SF6 emission to the key factors of installed electricity capacity, technological improvements, and the recovery and substitution ratios was also investigated.
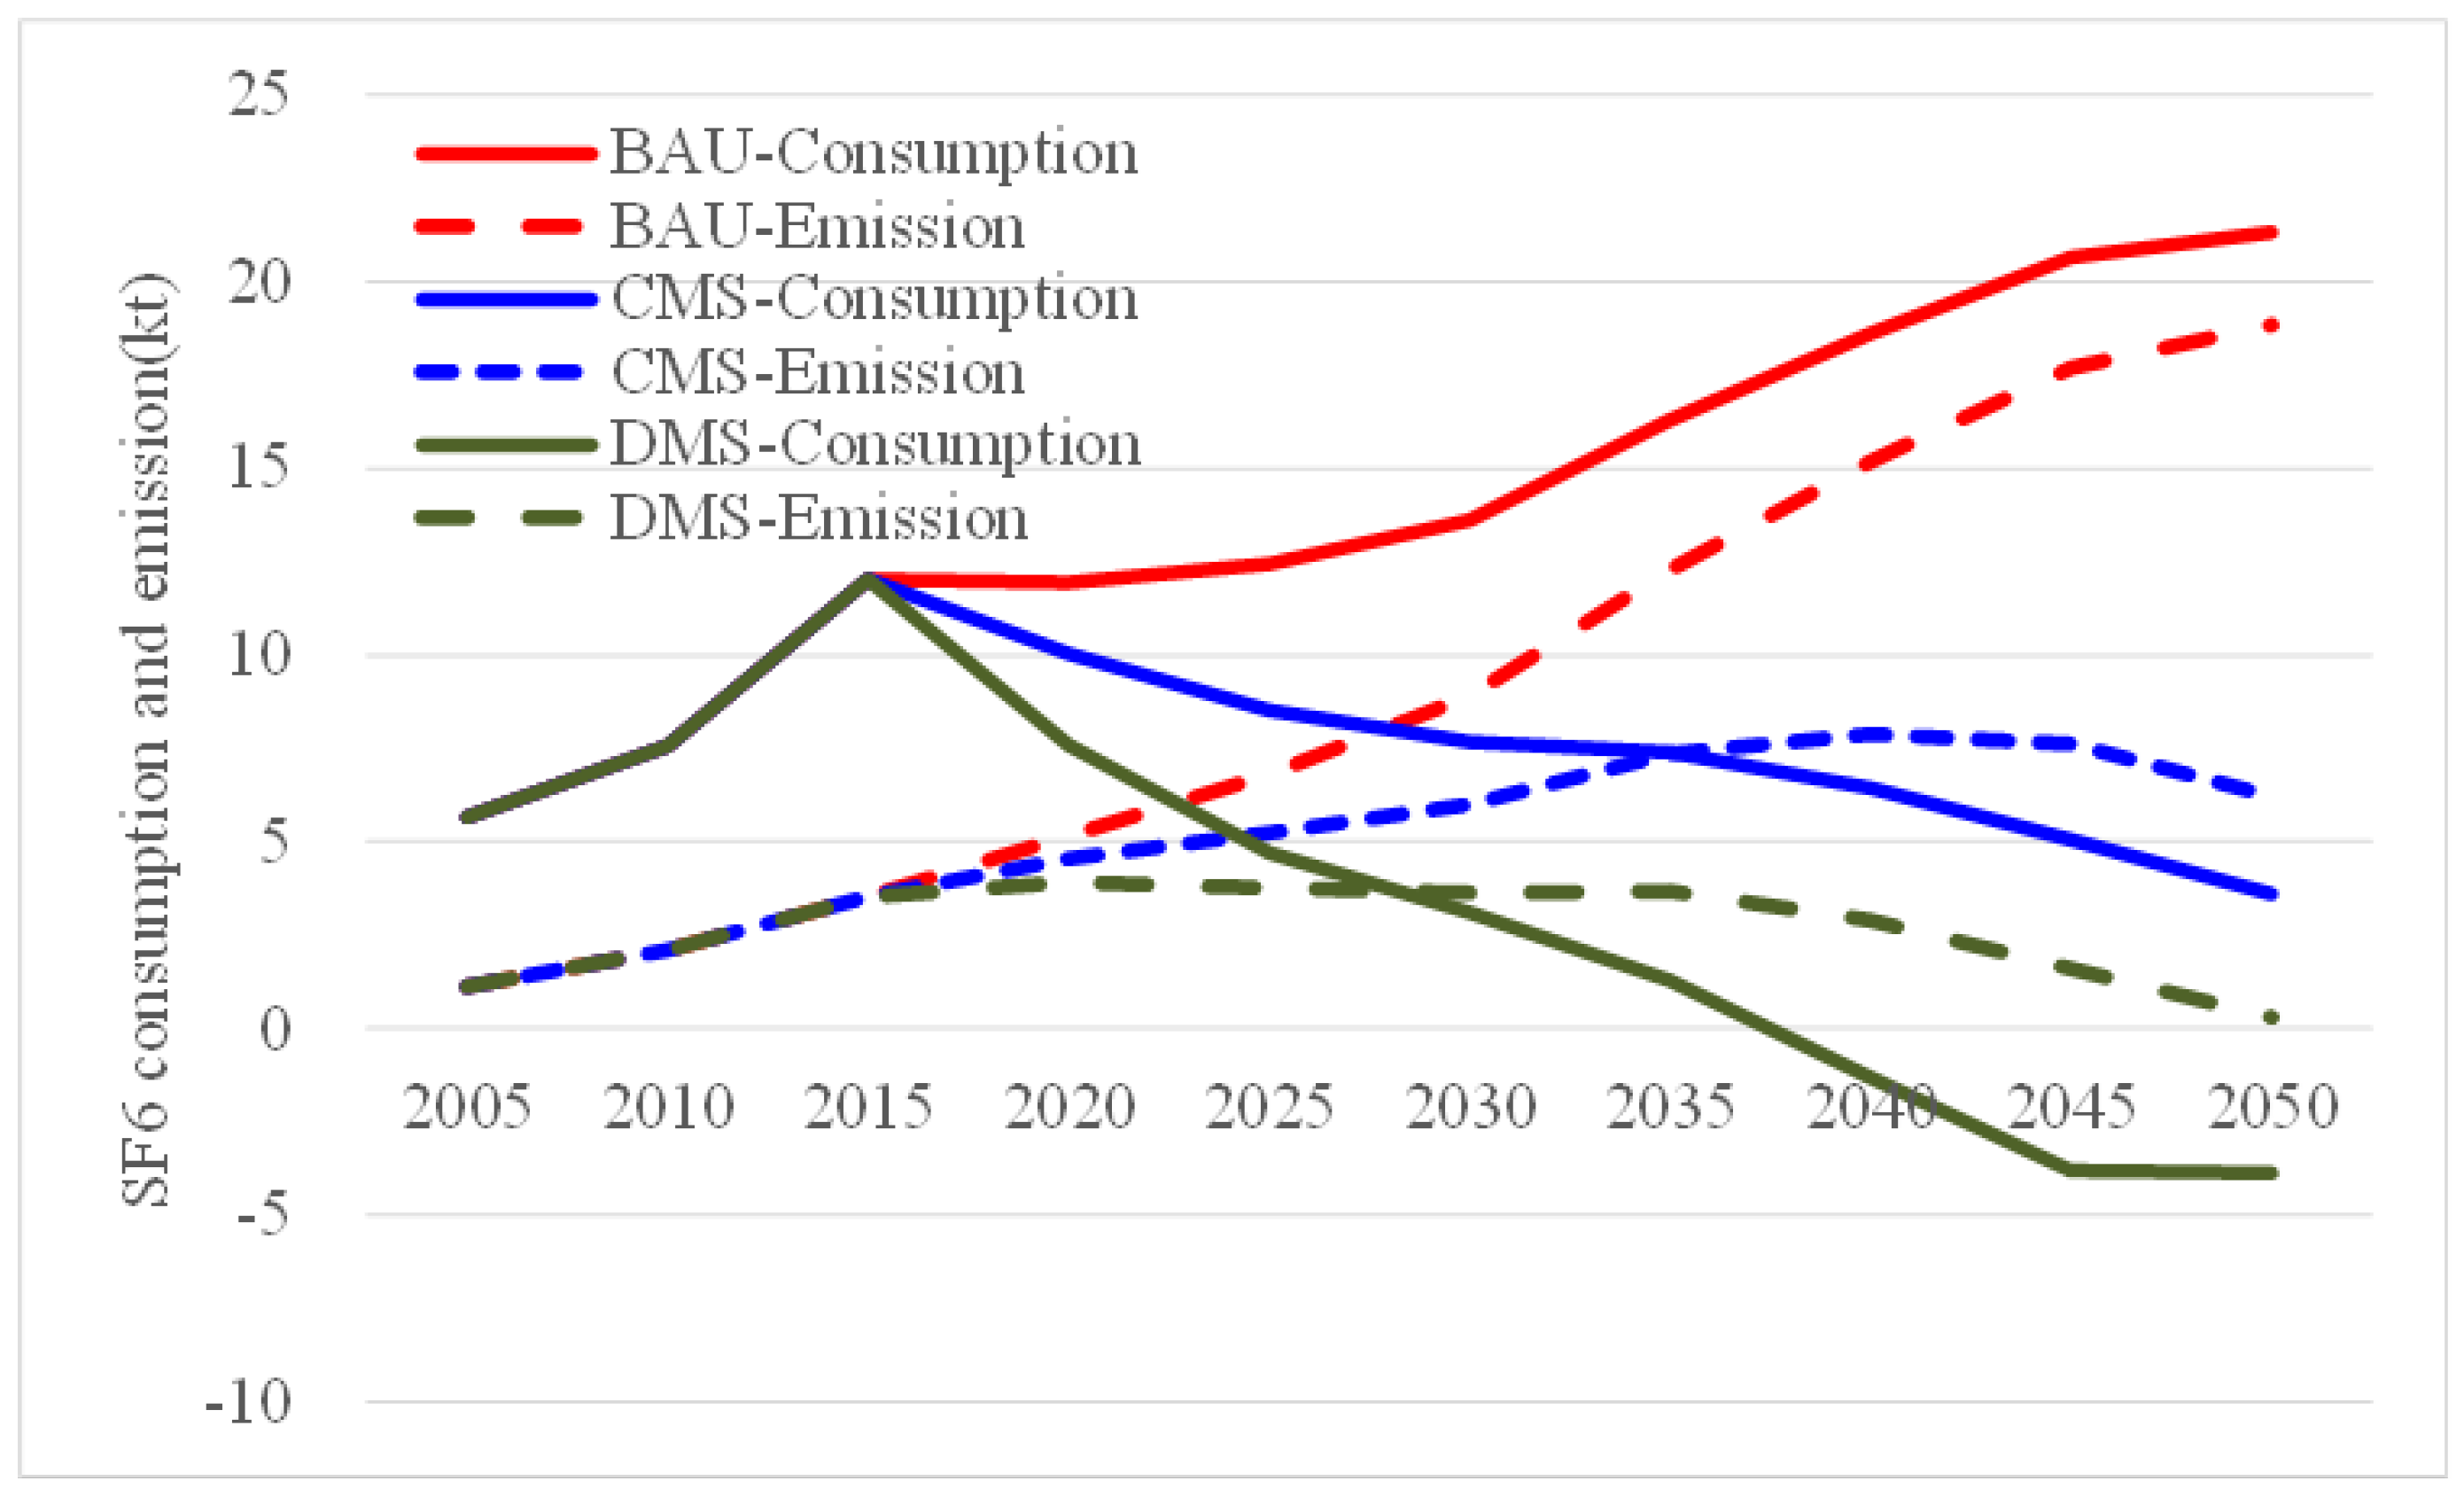
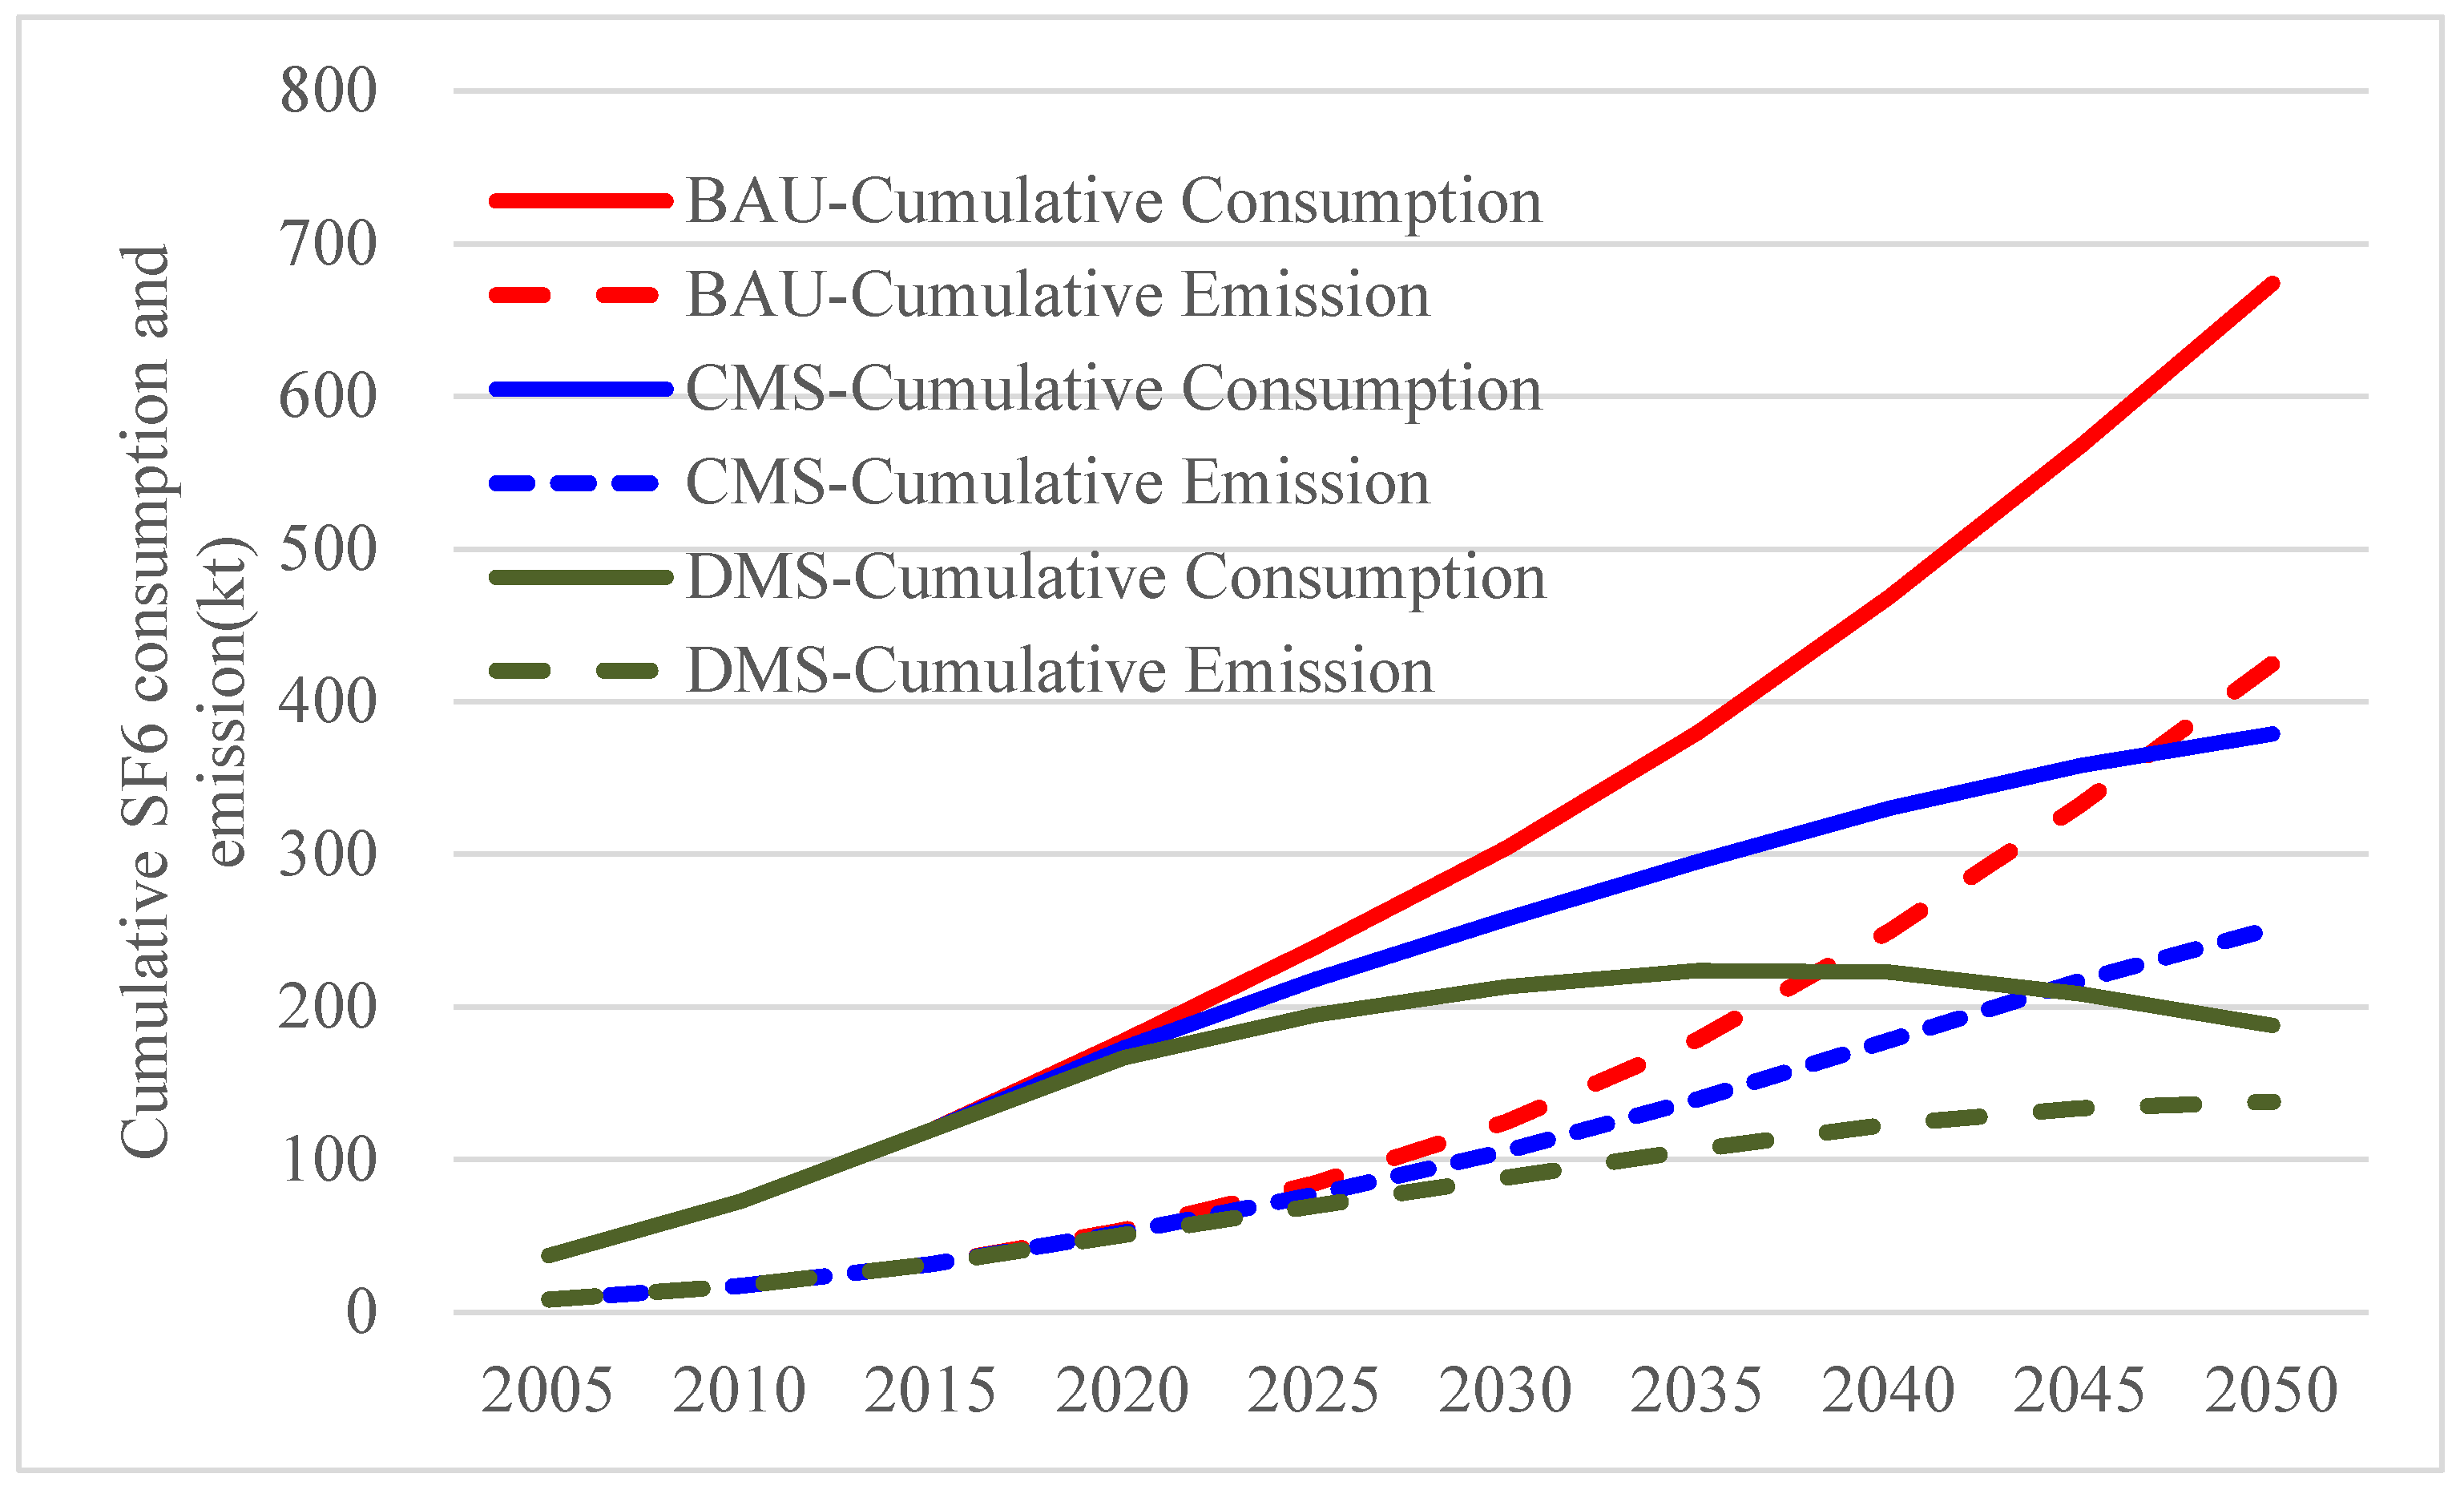
It was found that SF6 consumption and emission under the BAU could increase substantially to 21.3 and 18.8 kt, respectively, by 2050, i.e., 1.8 and 5.3 times the 2015 levels. Because of the decrease of installed capacity, SF6 technology improvements, and increases in the recovery and substitution ratios, SF6 consumption and emission under the CMS and DMS were predicted to be markedly lower than under the BAU (i.e., decreases of over 80%). Correspondingly, the SF6 cumulative consumption and cumulative emission were projected to increase continuously under the BAU to reach 674 and 425 kt, respectively, by 2050 (i.e., 5.6 and 13.5 times the 2015 levels). Under the CMS and DMS, the same factors were predicted to be about 40% and 70% lower by 2050, respectively, in comparison with the BAU.
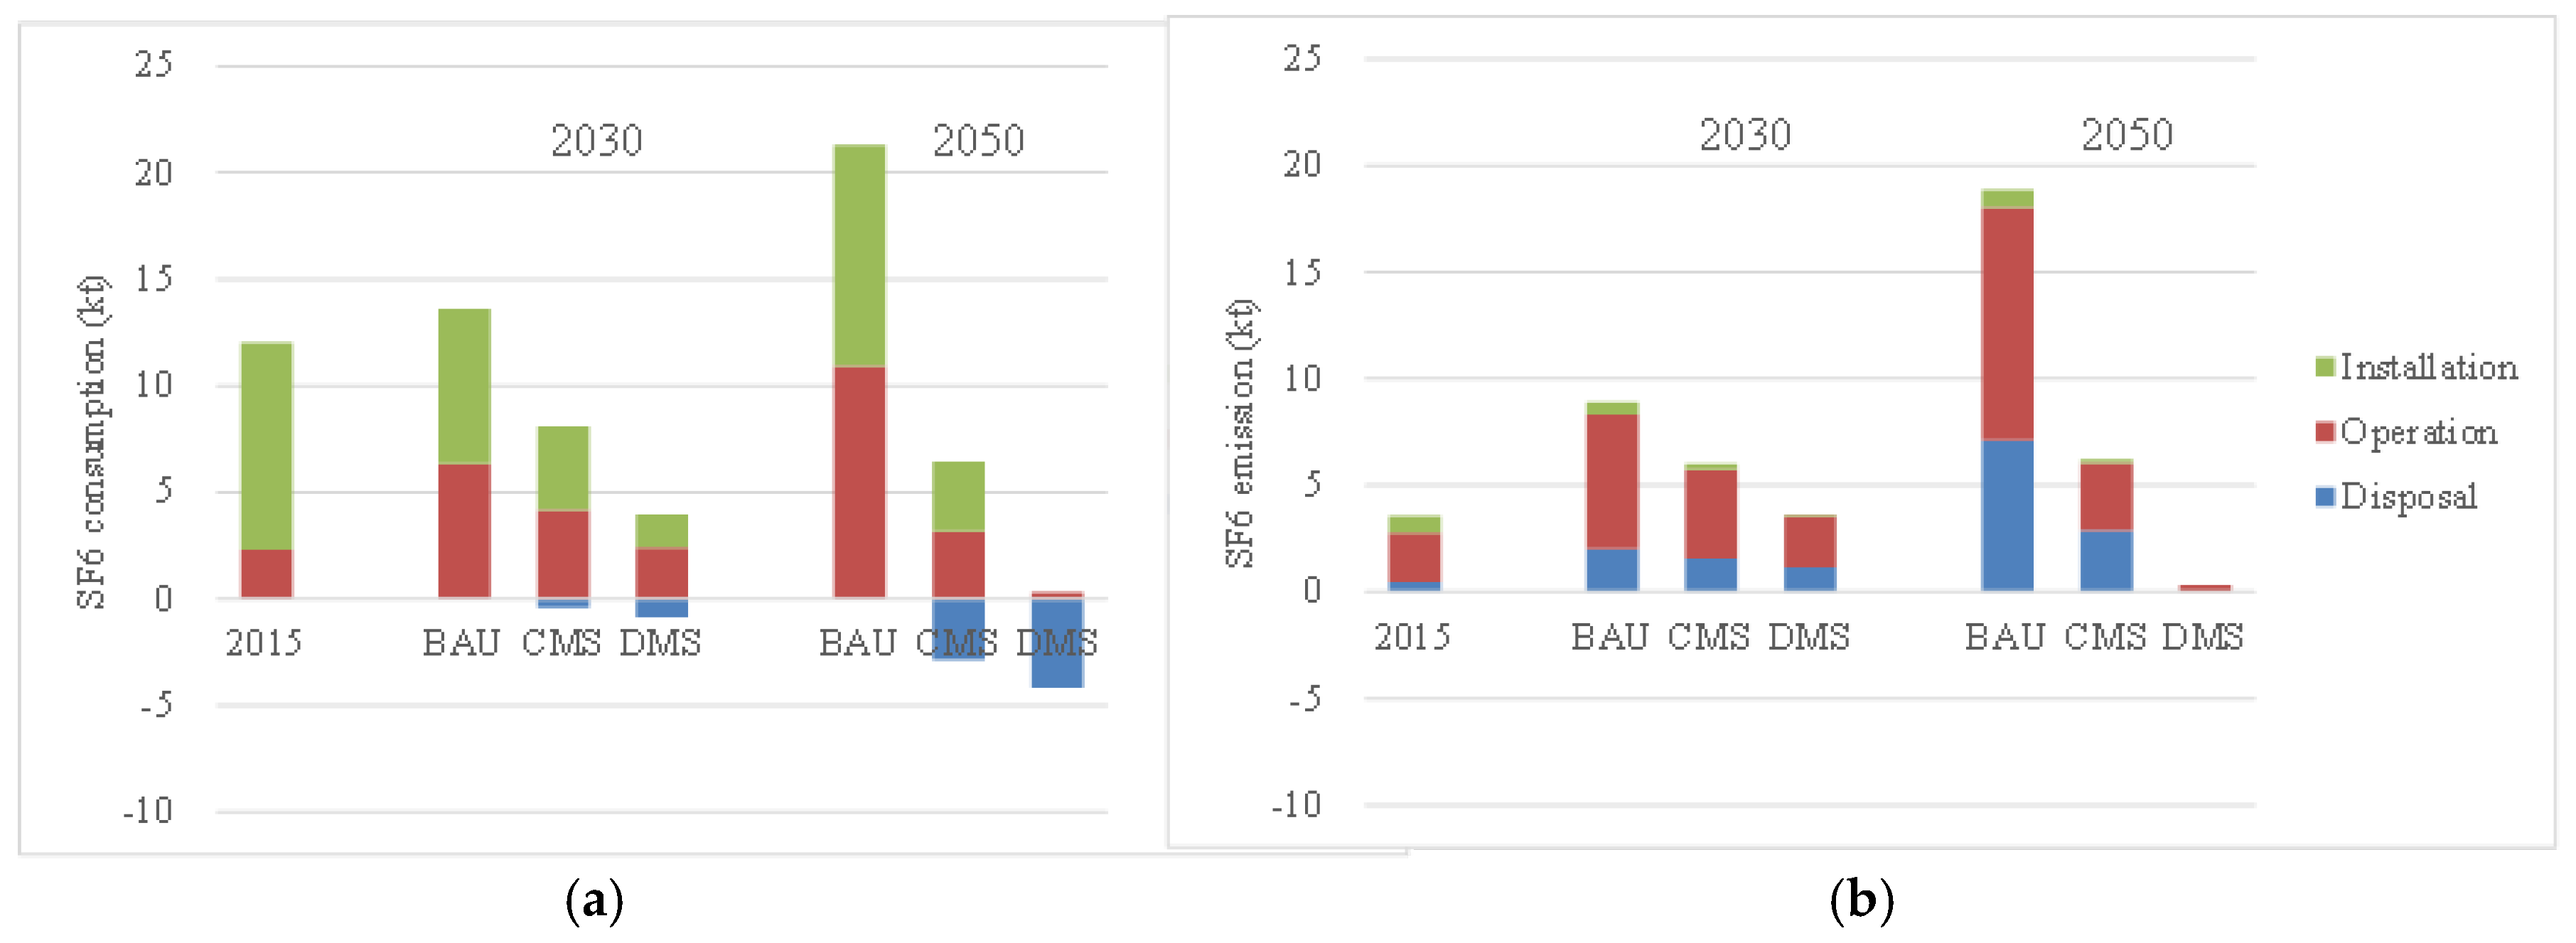
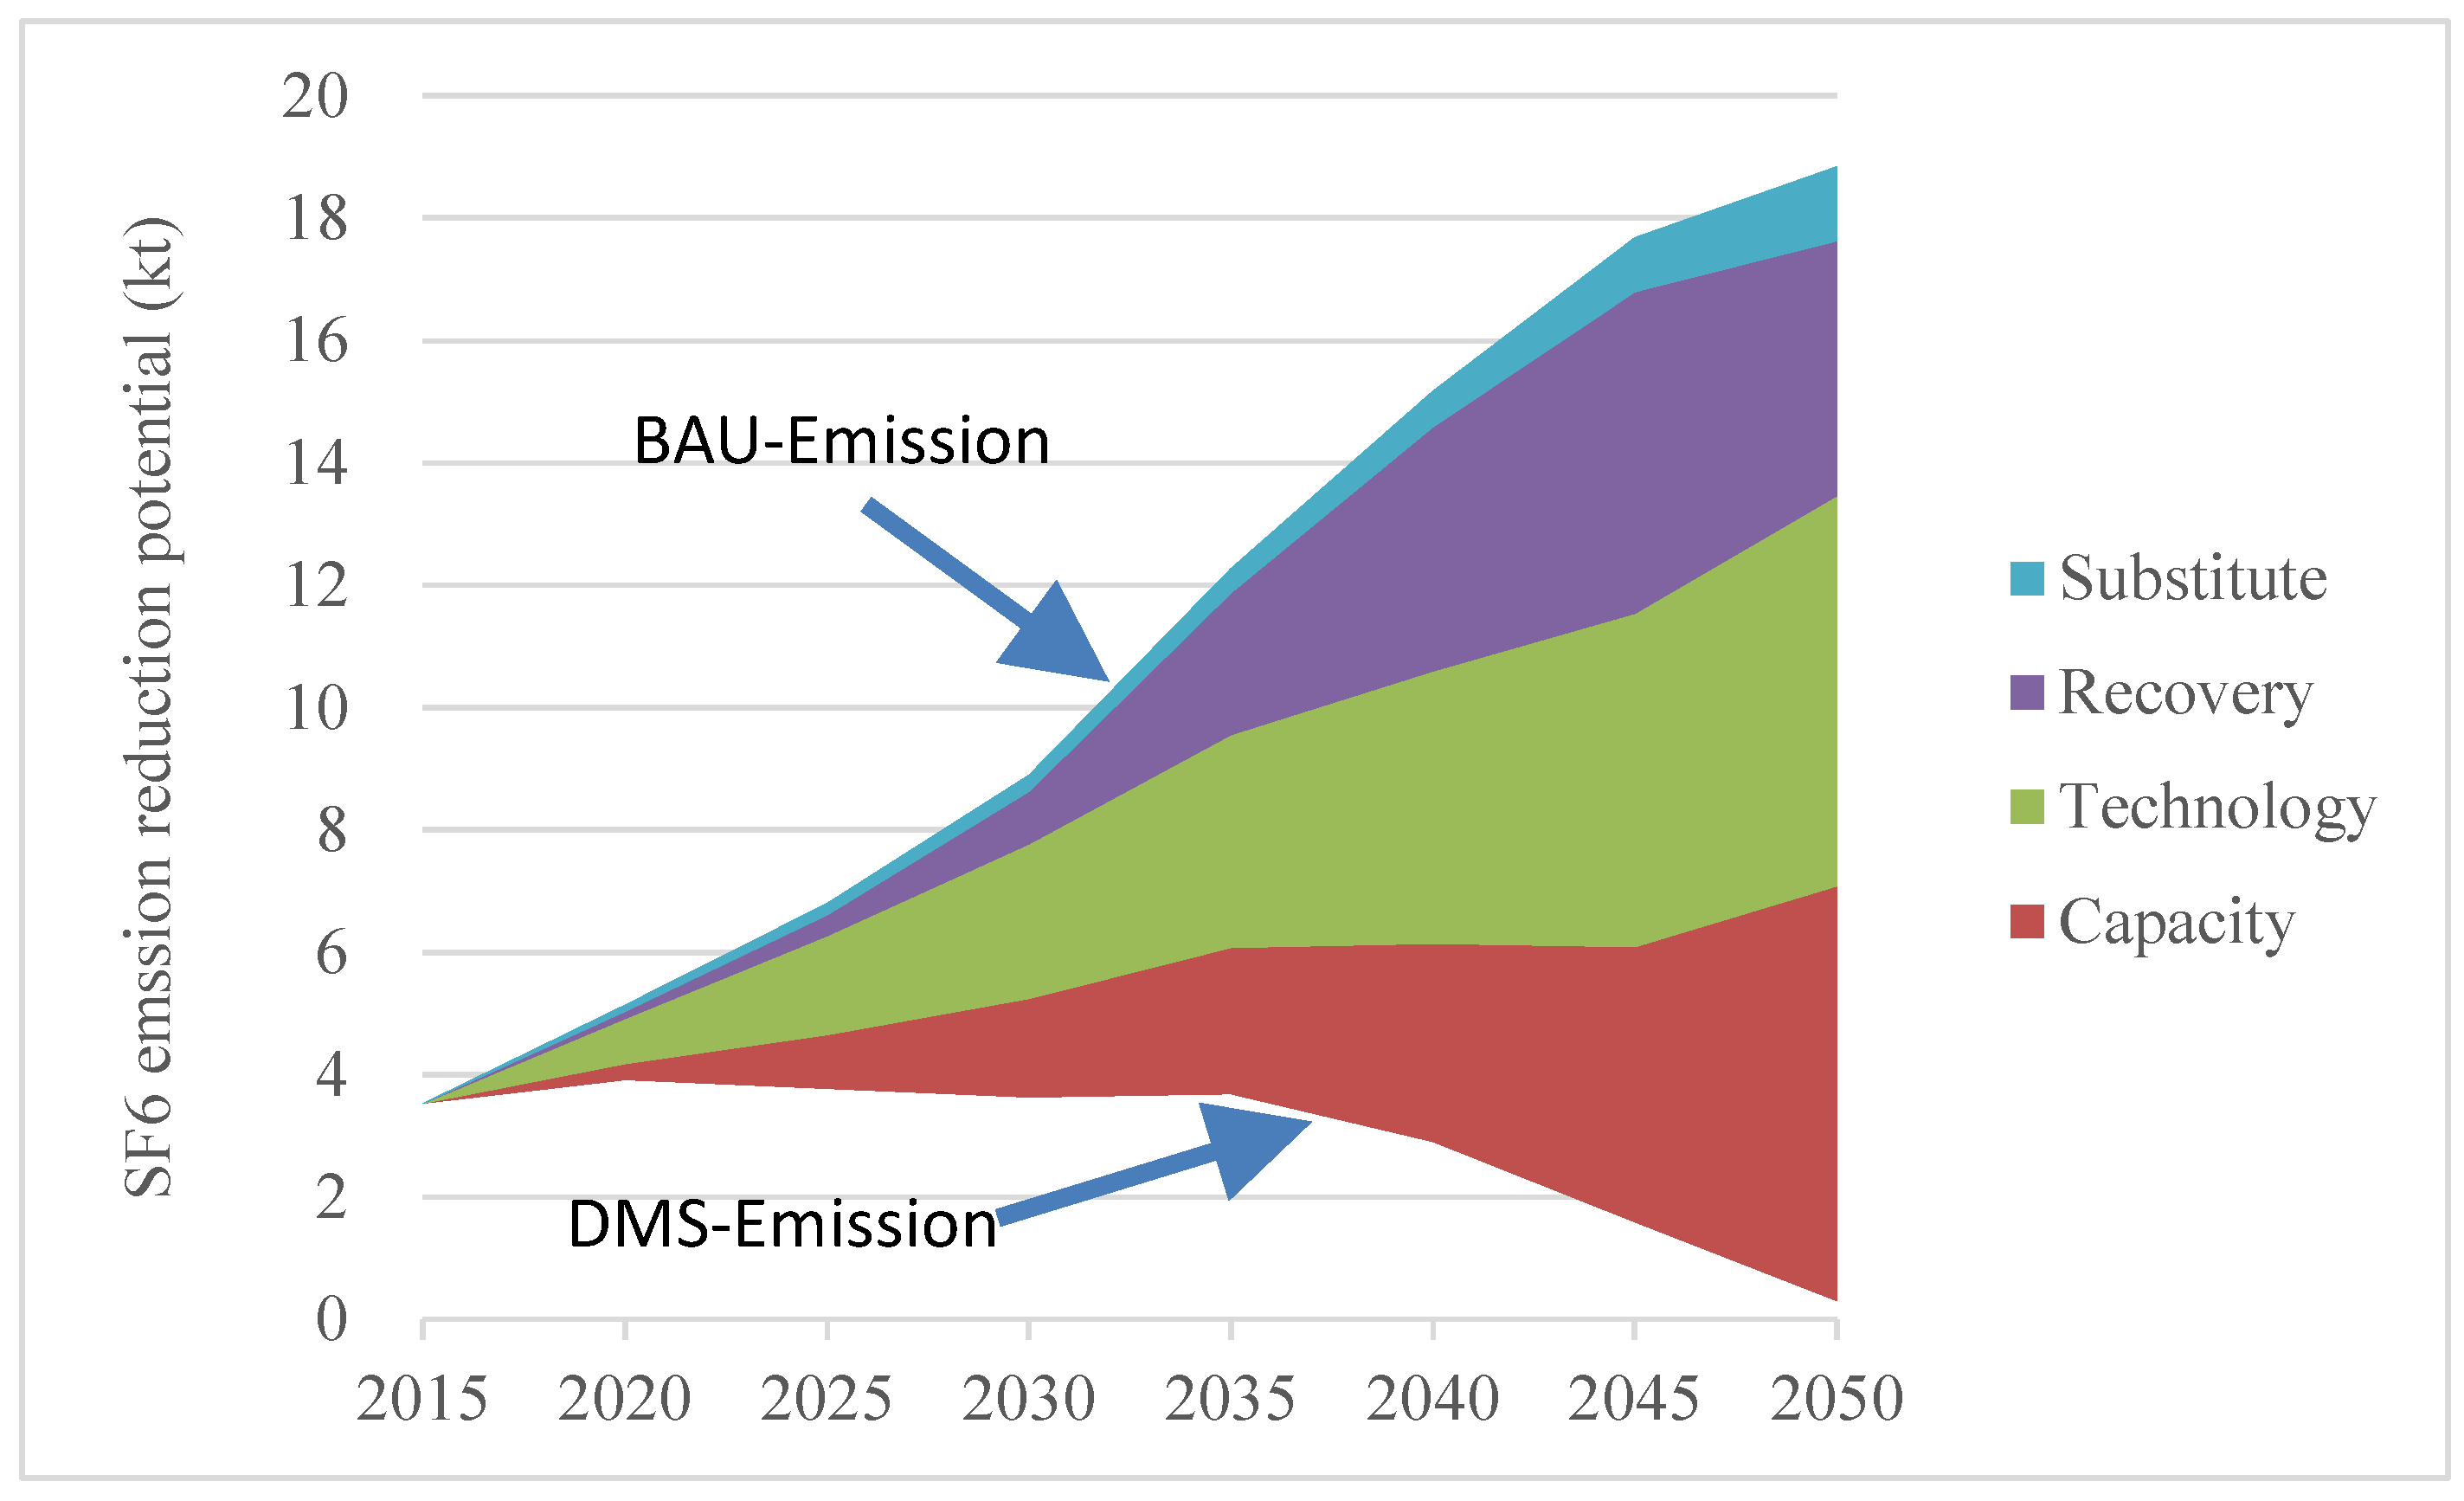
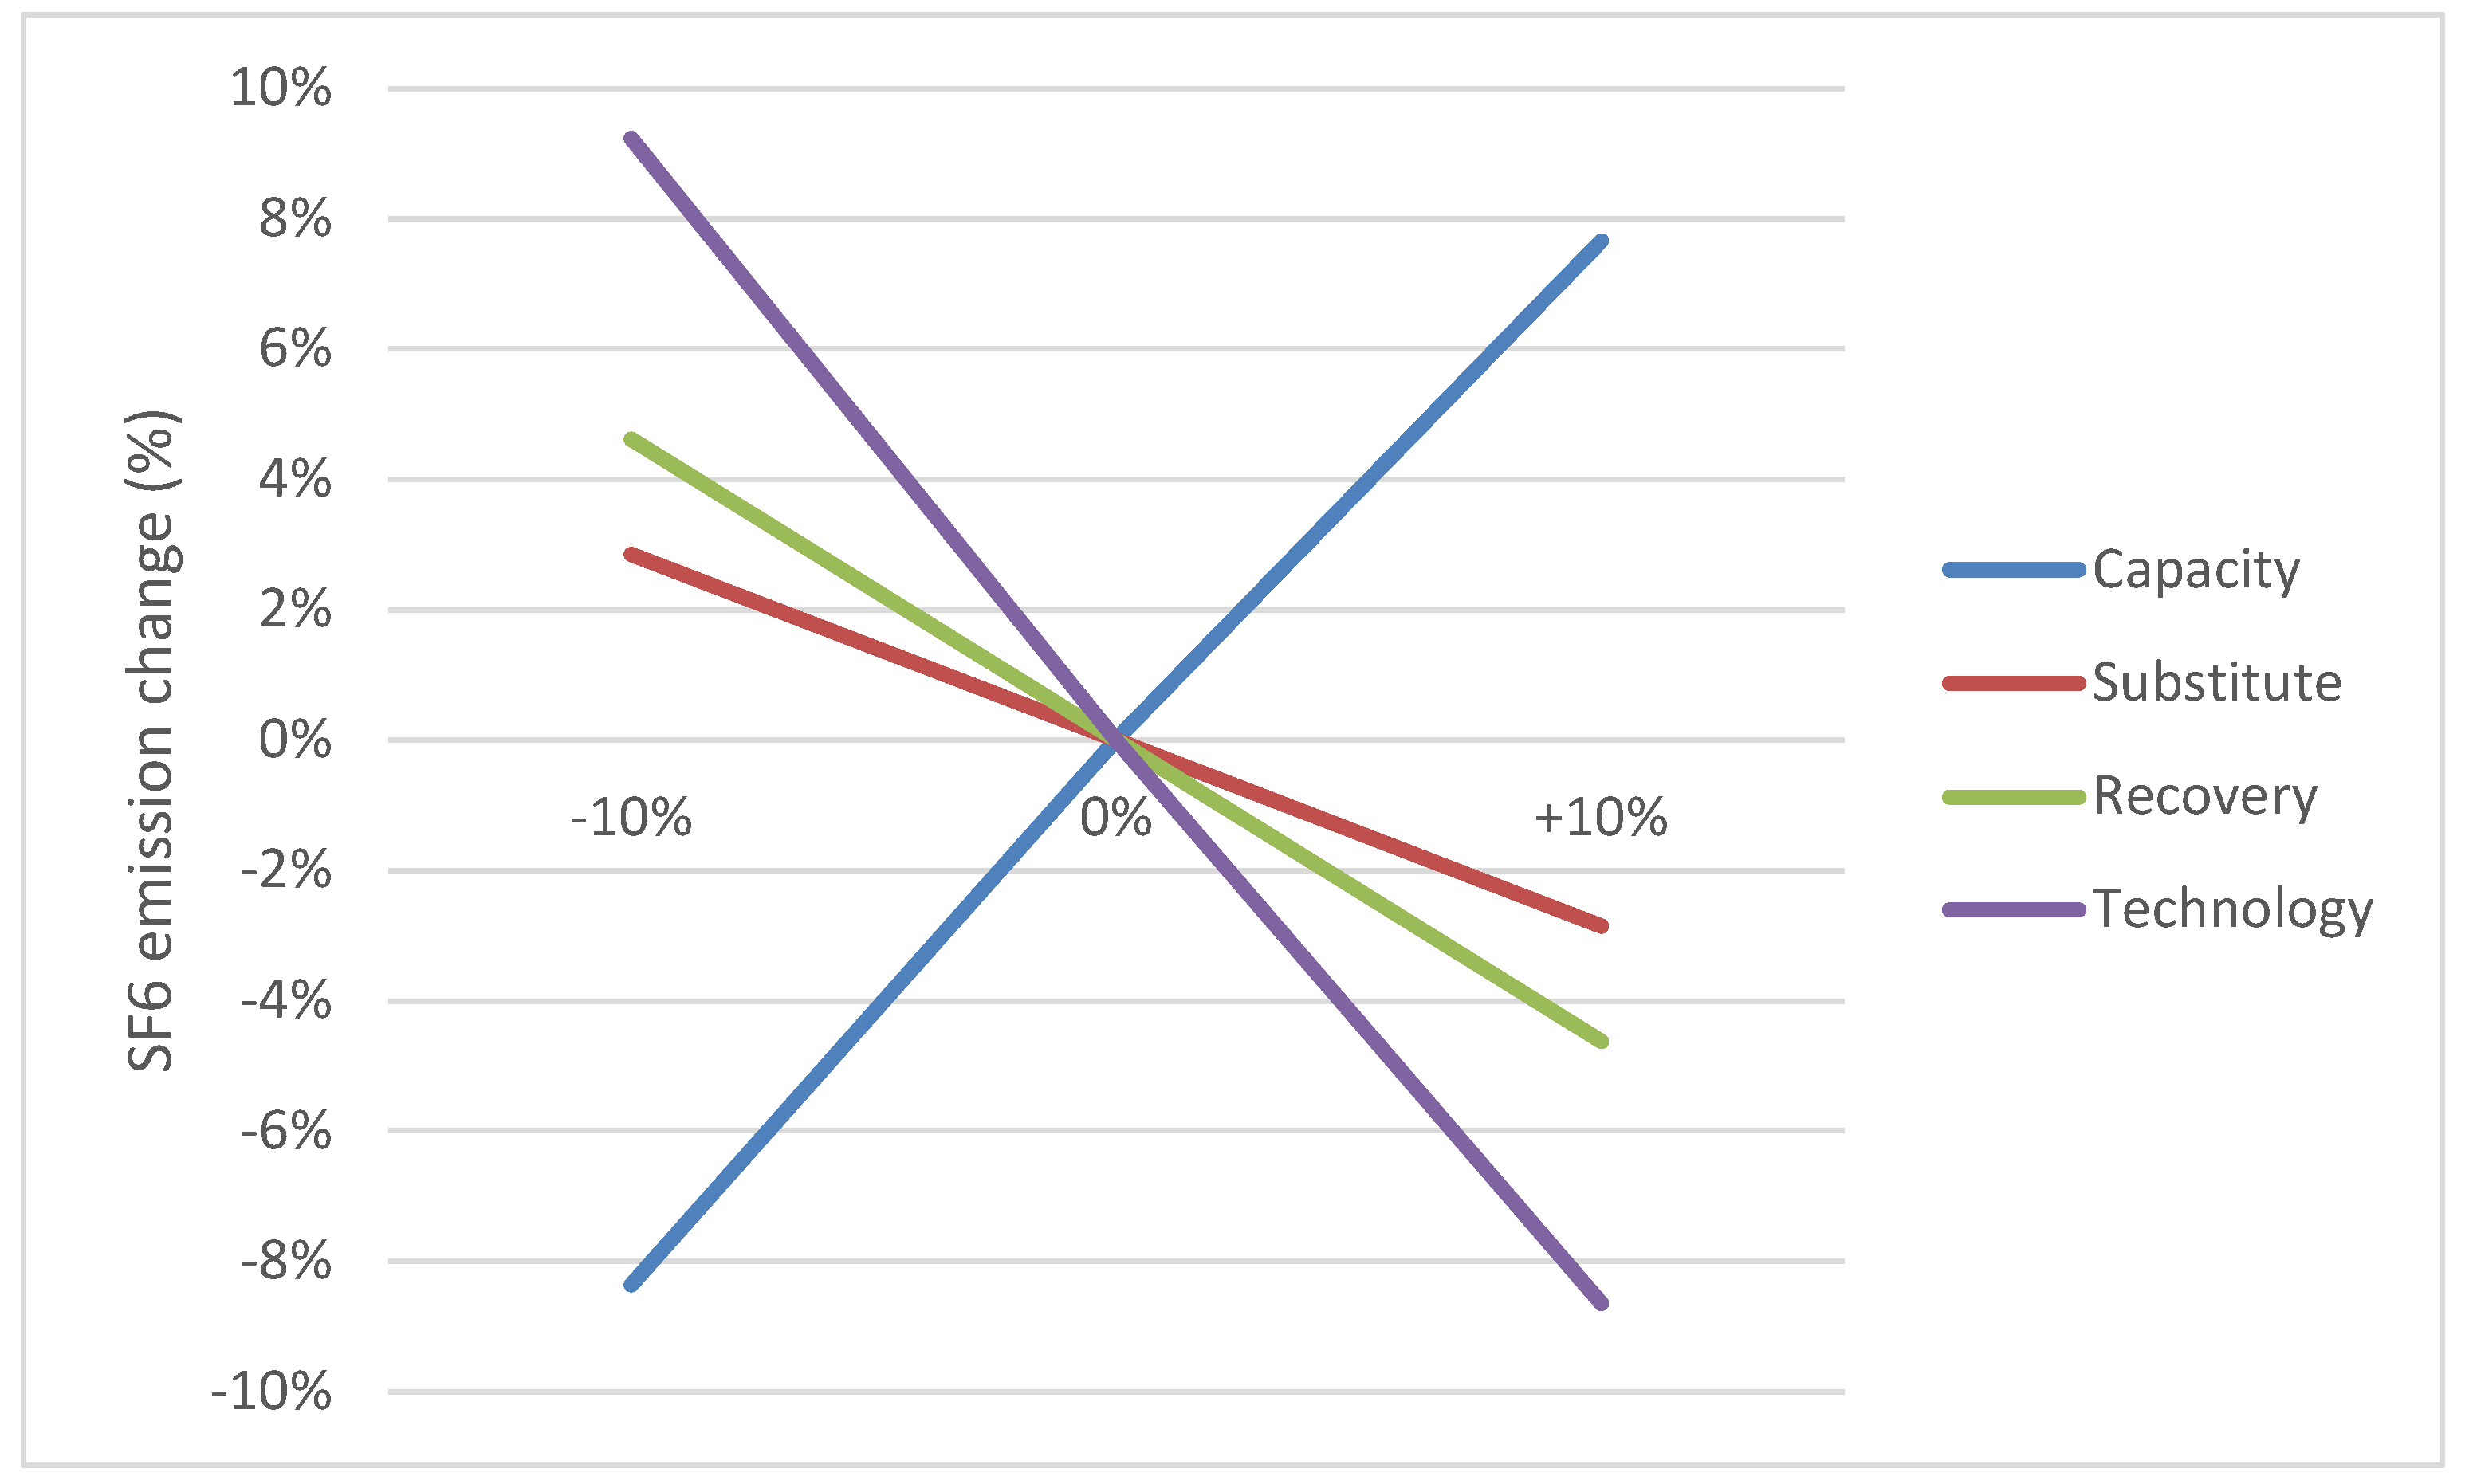
It was also found that, before 2030, the source of SF6 consumption could be attributed mainly to the SF6 filling quantity of newly added equipment, whereas the source of SF6 emission could be attributed mainly to leakage from operational stock. By 2050, the source of SF6 consumption was projected to be associated mainly with the operation, maintenance, and refilling of operational stock. In addition, the recovery and reuse of SF6 from retired equipment (i.e., negative consumption) were predicted to increase substantially. The source of SF6 emission was expected to be mainly leakage from operational stock and emissions from retired equipment. By 2050, in comparison with the BAU, the potential for SF6 emission reduction was projected to be about 18.5 kt under the DMS, and the contributions of the installed electrical capacity, technological improvements, recovery ratio, and substitution ratio to emission reduction were estimated to be 37%, 34%, 22%, and 7%, respectively. The sensitivity analyses indicated that the factors influencing SF6 consumption and emission in descending order of importance are technological improvements, installed electrical capacity, the recovery ratio, and the substitution ratio.
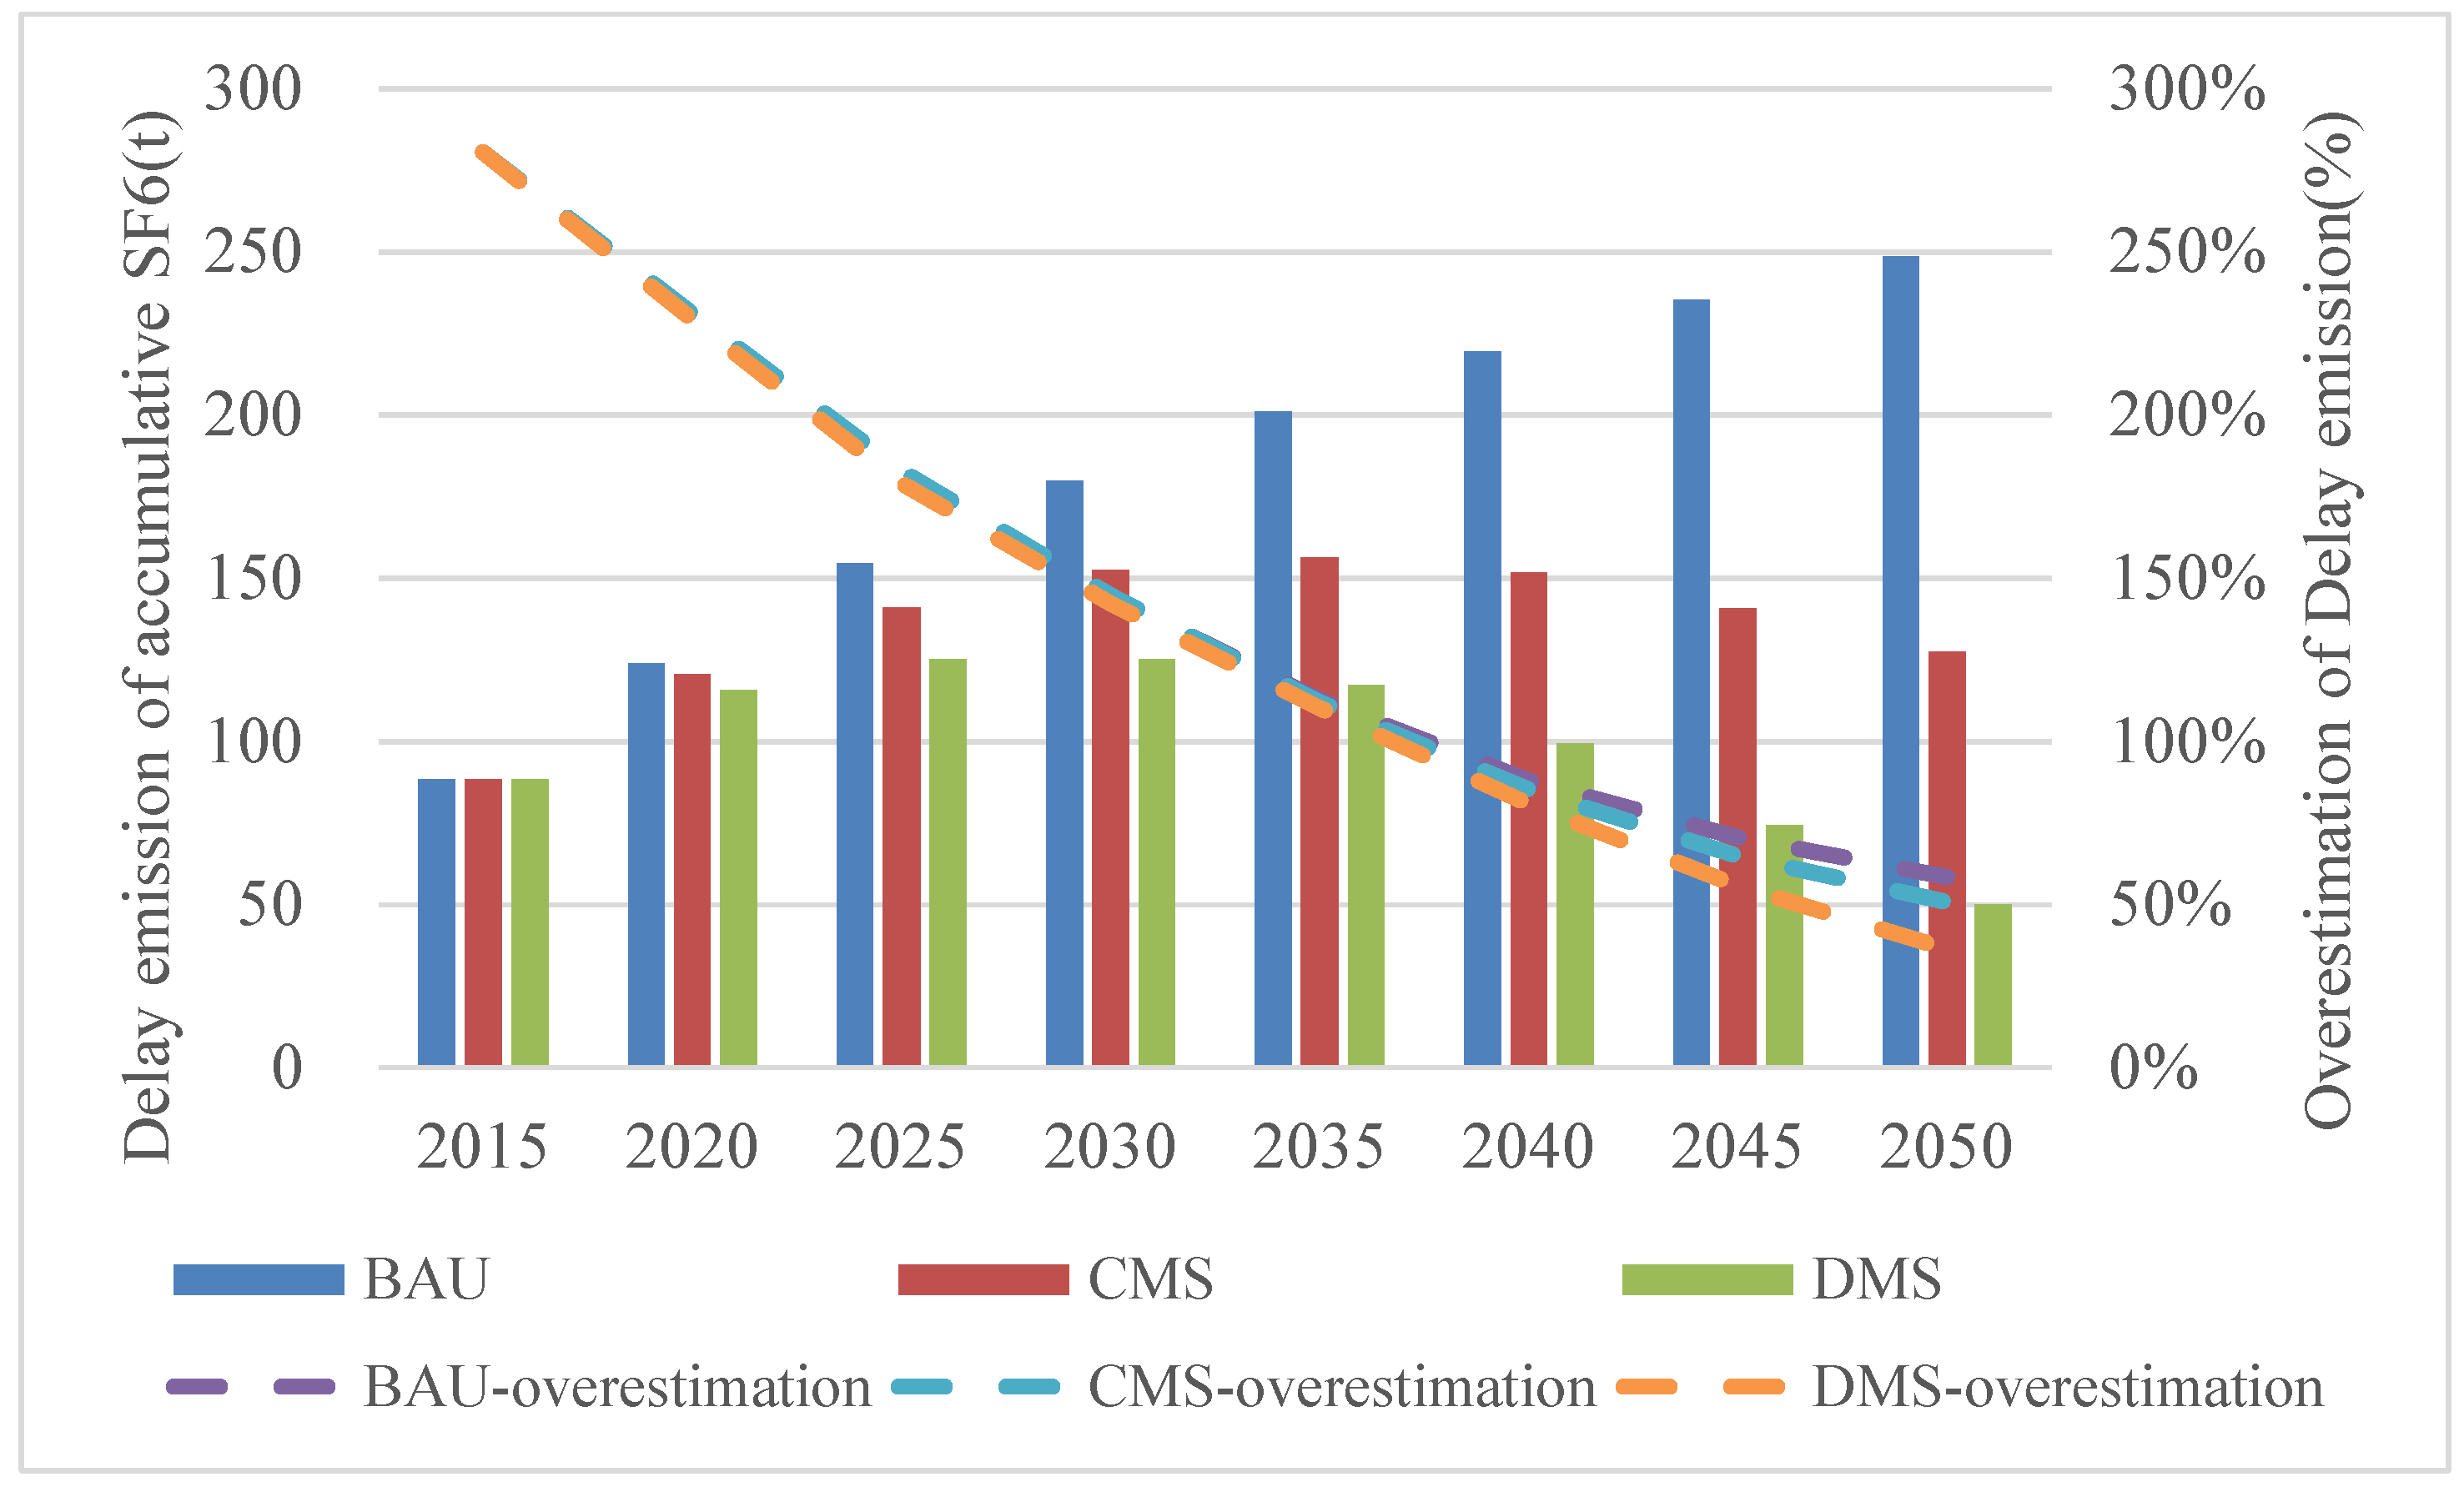
Finally, we also found that the SF6 delayed emission effect from electrical equipment was obvious. By 2050, the cumulative delayed emission was projected to be 50–249 kt under the three scenarios, which could be considered equivalent to 1.2–6.0 GtCO2e. Therefore, SF6 emission before 2035 could be overestimated by a factor of 1–2 times if the delayed emission effect were not considered and consumption were used as an inaccurate proxy for emission.


