1. Introduction
SMR is a type of nuclear power plant which output electric power is less than 350 MWe and are smaller than conventional power plants. During the past 12 years, SMRs have been given attention and importance from the engineering community of nuclear industry. Up to now, several SMRs are under development [
1]. Innovative SMRs are developed with enhanced safety features based on experiences feedback from nuclear accidents and nuclear plant operations. In order to improve the inherent safety of the reactor and make its design simple, natural circulation and passive safety systems are often used [
2].
NuScale Power Modular (NPM) is a typical small modular reactor which was developed for many years based on practical application of pressurized water reactor (PWR) technology. Because it is highly scalable and modularized, NuScale is easy to satisfy the requirement according to the customer’s energy demands [
3].
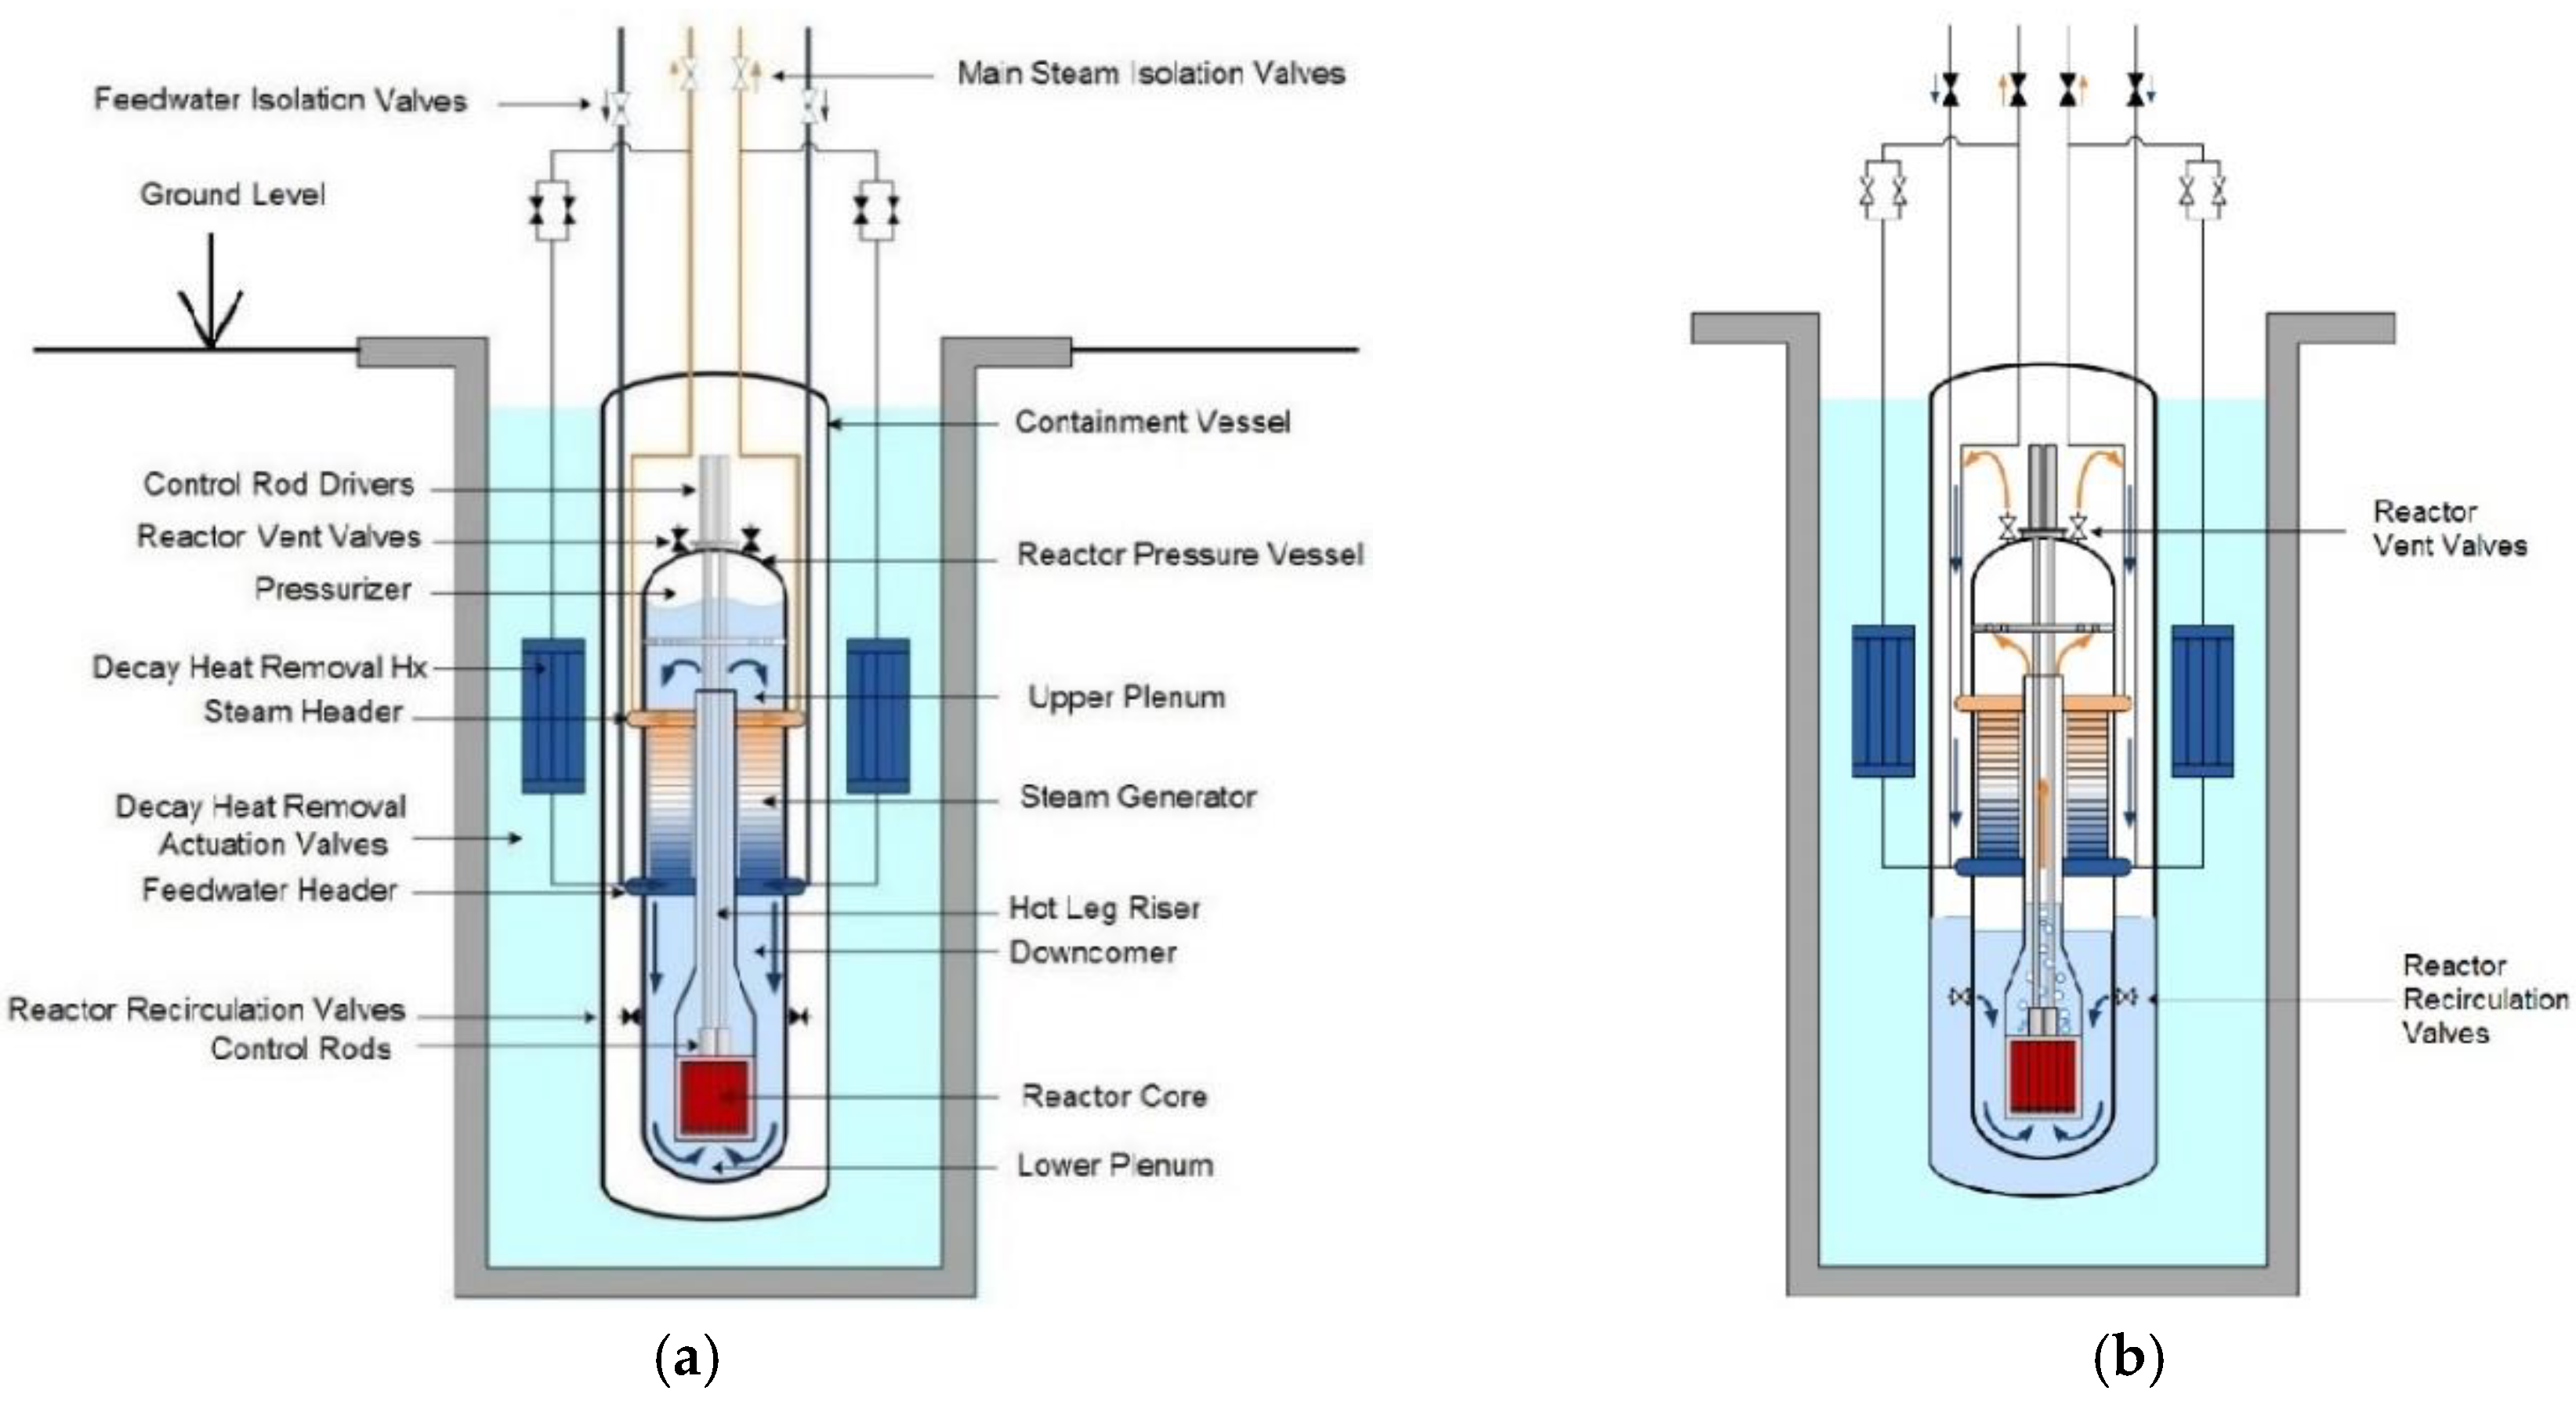
NPM’s reactor cooling pool, which is steel-lined, is located below the plant ground level and the upper surface is open to the atmosphere. The cooling pool can absorb all the decay heat from the reactor core for at least 72 h after LOCA. The pressure inside the containment vessel is kept at a partial vacuum during the condition of normal operating. Keeping the vacuum can eliminate convection heat transfer in the containment. Thereby, insulation for RPV is not needed and potential debris in the CNV greatly reduces as well.
Figure 1a shows the component of NPM and the normal operation condition.
During LOCA, the primary coolant is returned to the reactor vessel from containment by opening two independent reactor recirculation valves. This guarantees that the core stays covered and decay heat can be removed continuously. The Emergency Core Cooling System (ECCS) removes core decay heat and maintains the pressure of the containment by condensing the steam and transferring the heat to the inner surface of CNV. After that, the heat is transferred through the CNV wall by conduction and then to the water of the reactor pool by convection. Long-term cooling is built up via natural circulation of the reactor coolant, which is initiated by opening the two reactor vent valves (RVVs) and the two reactor relief valves (RRVs), as shown in
Figure 1b [
4].
Natural circulation represents a very convenient option for efficient fluid motion within a closed circuit of the reactor coolant during LOCA. The reactor cooling pool is the same. When thermal energy is transported from a high-temperature source to a low-temperature sink, it need not bring them in direct contact or include any external device or power [
5]. On the other hand, convection heat transfer in a limited zone does not mean that the temperature field is near homogeneous or homogeneous. The heat transfer process is affected by developed three-dimensional convection flows and may form thermal stratification in some places [
6]. Natural convection in a rectangular chamber which is heated by a vertical plate shows that the top layer of water remains nearly homogeneous and thermally stratified water forms in lower layers [
7]. Thermal stratification conditions can be affected by two forces: the buoyancy force from the hot condensate and the momentum force from steam bubble oscillation [
8]. Strong temperature stratification for some systems is desired, but in the case of nuclear reactors, it is not good, and it introduces early fatigue in some critical components [
9]. Temperature stratification in the large pool is a problem that needs to be studied to maximize the efficacy with the same amount of water in the pool [
10].
In this study, thermal stratification outside a small containment vessel immersed in a water pool was examined through experimental and numerical simulation. The main objectives of this study are to obtain the influence of thermal stratification on the heat transfer process in the SMR reactor pool during LOCA accidents, find out the mechanism of thermal stratification in the reactor pool of NuScale power modular, and verify the k-ε model for this situation.
2. Thermal Stratification in SMR’s Reactor Pool
When a vertical heat source is placed in a pool of water, the fluid adjacent to the source is heated. In this process, the density of fluid reduces, so, it moves up because of buoyancy. After reaching the top free surface, the heated water takes a turn, moving towards the wall of the pool along the surface. Since the density of this heated water is small, it does not flow downward. If a vertical sink is provided, downward flow will take place in a narrow region adjacent to the sink. Over a period of time, depending on the volume of the pool and the heat source, most of the pool becomes thermally stratified when it is far from the heat source surface. In the region of thermal stratification, the fluid is almost static [
11]. A slice of the pool is selected as the analysis object because it is axisymmetric.
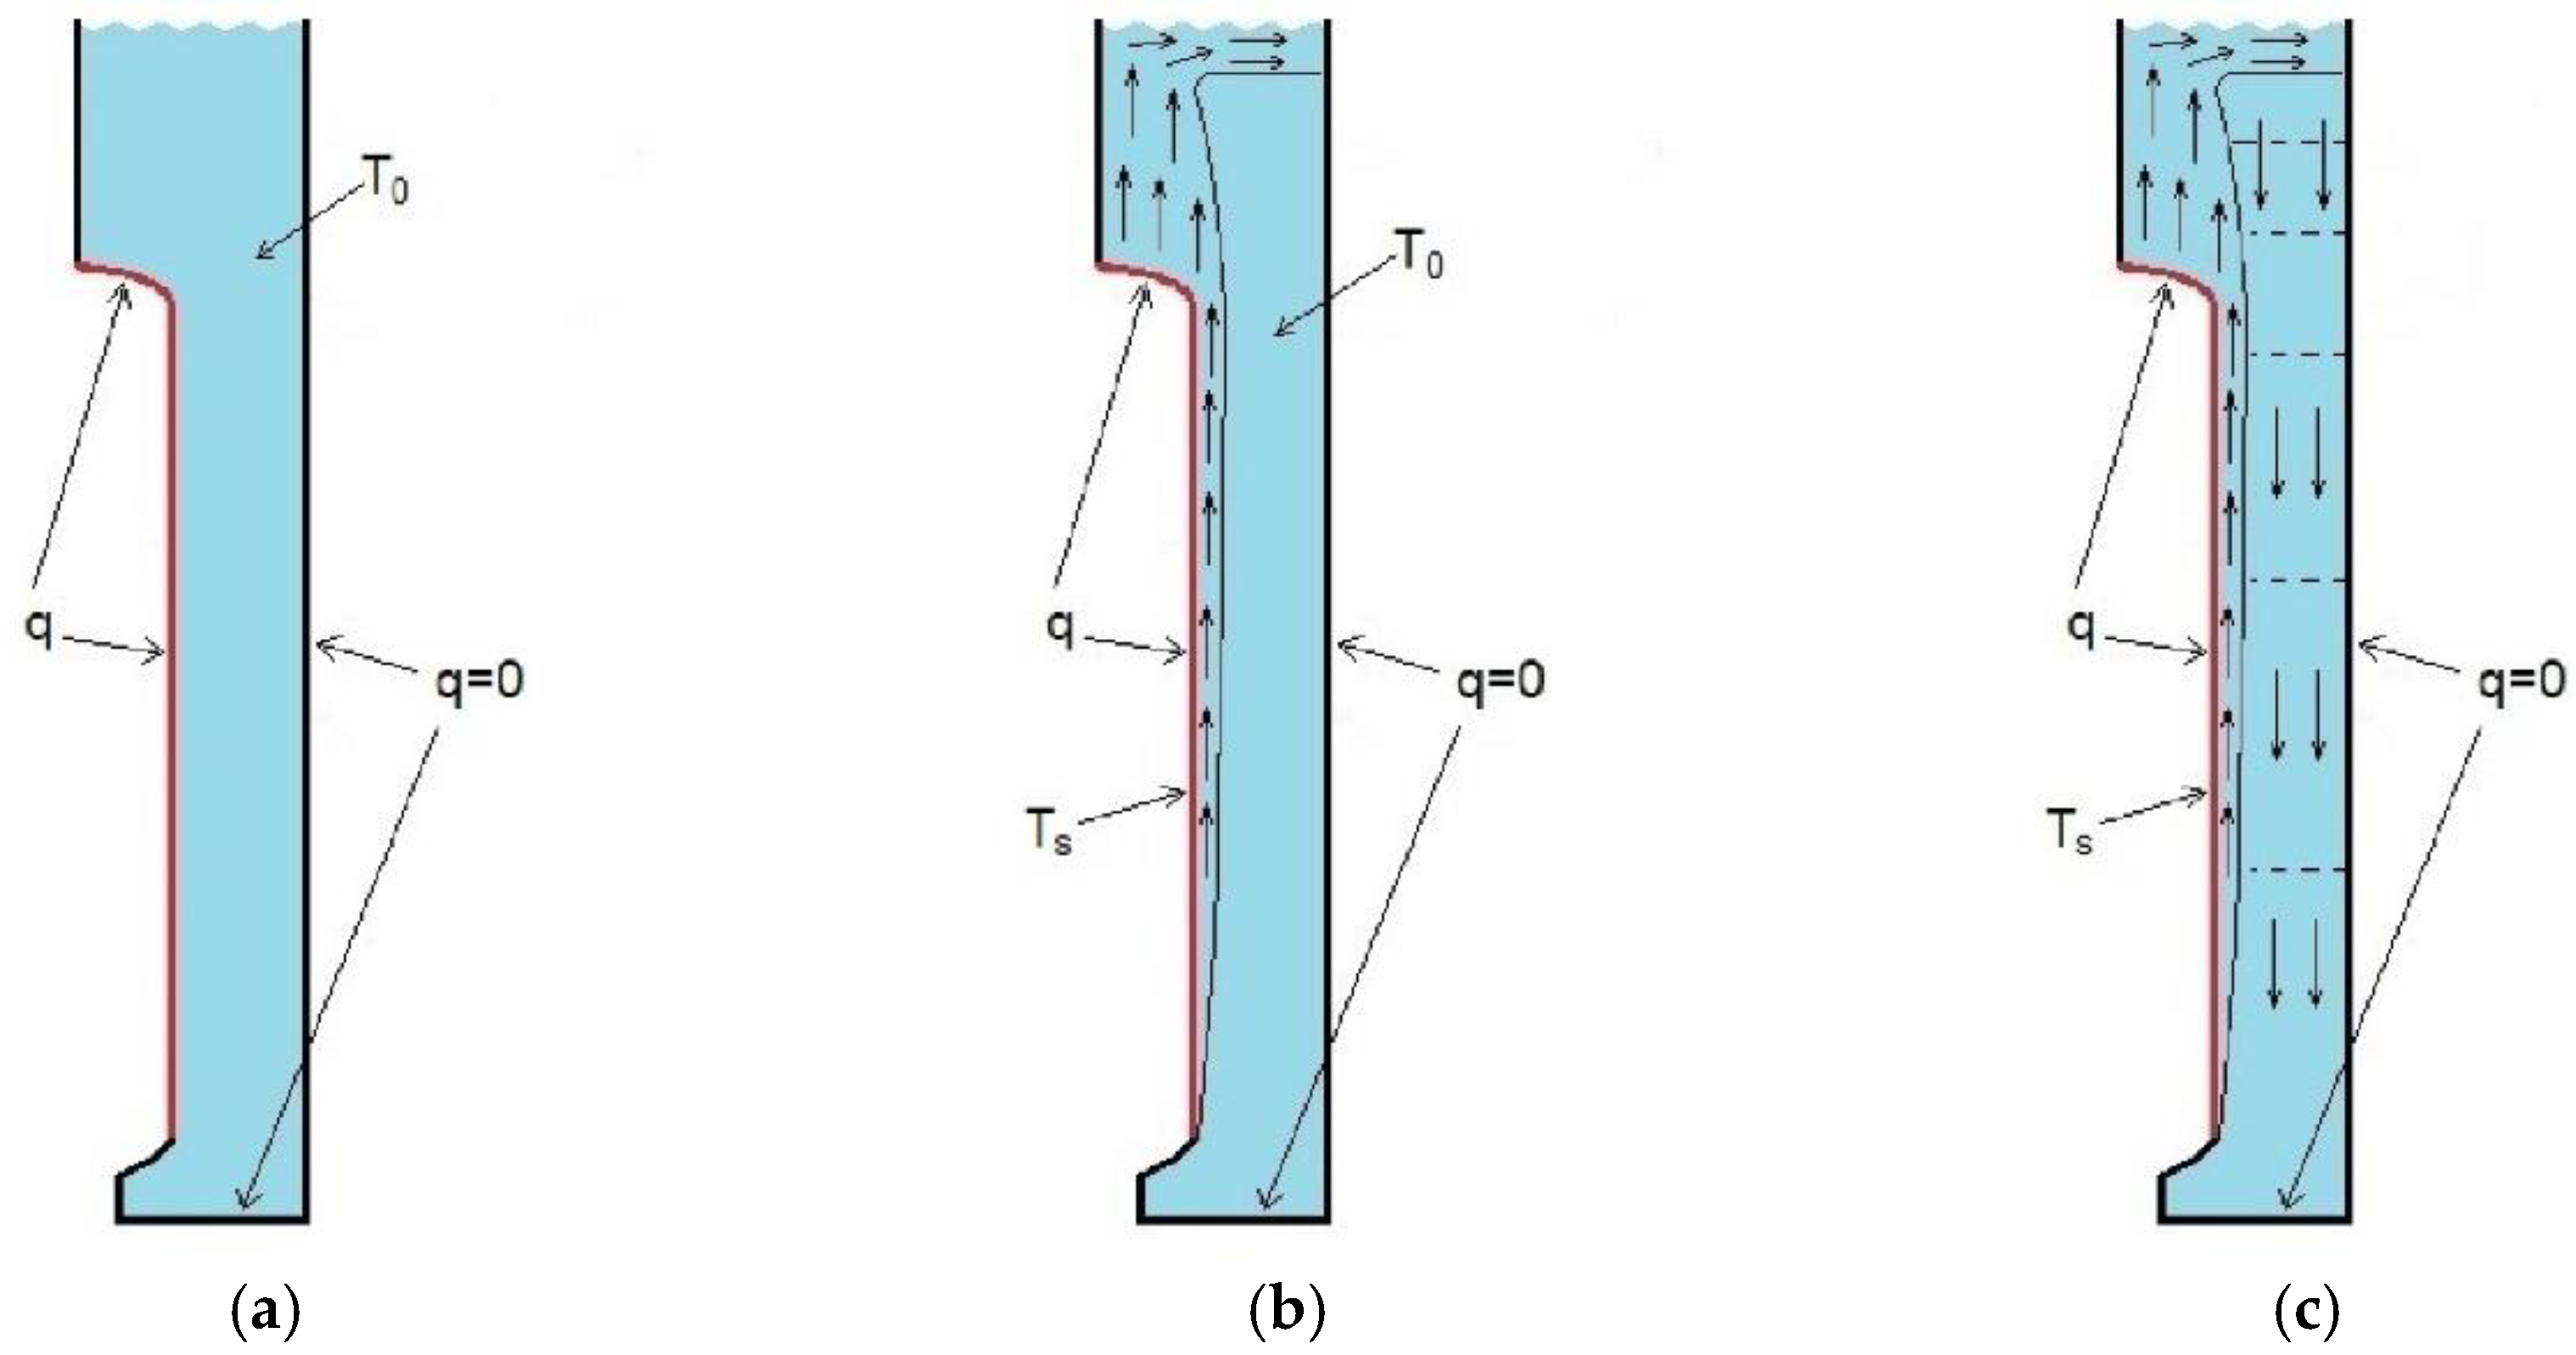
Figure 2 shows the formation of thermal stratification during an LOCA accident.
The top surface of the tank is open to the atmosphere, and the bottom and right-side wall are assumed to be perfectly insulated. The water temperature is uniform at the beginning of the LOCA accident (
Figure 2a). Then, the outer surface temperature of containment increases and adjacent water flows upward and towards the pool wall when it reaches the water surface. Thus, the temperature of the upper horizontal layer is higher than the lower water layer. The containment surface temperature increases with time and the upper layer will move downward when a hotter layer is generated in the top due to the density difference (
Figure 2c).
3. Experiment
3.1. Experimental Apparatus
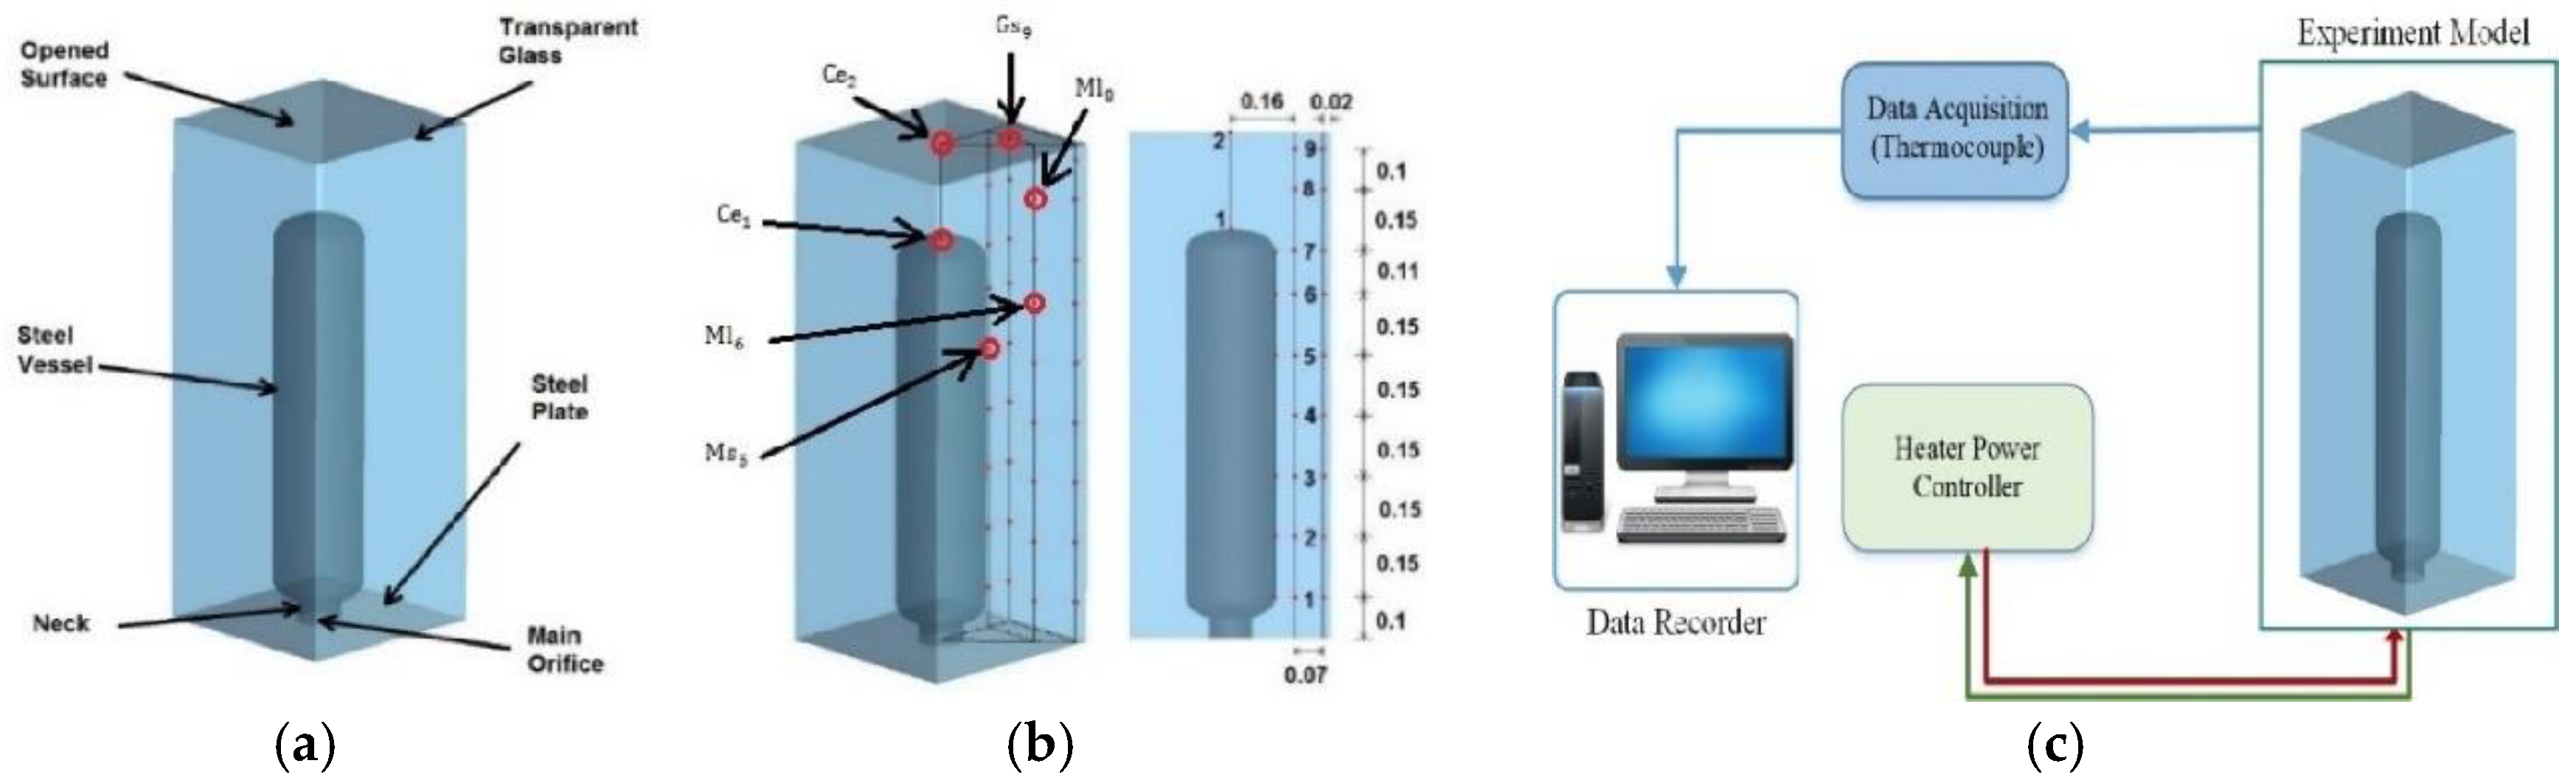
The small scaled model of the experiment was built depending on the dimensions of the NuScale reactor at the ratio of 1/20. The test consists of a 0.002 m-thick steel vessel immersed in a pool of water, as shown in
Figure 3a. An electric heater provides the small containment vessel with constant thermal power from inside. A number of thermocouples are arranged in the pool to measure the water temperature during the experiment.
Figure 3b shows the thermocouple arrangement and the localizations of selected thermocouples that were used in the CFD validation. Pool walls are made of 0.012 m-thick transparent toughened glass, allowing the thermal hydraulic phenomenon in the pool to be visible and the PIV technique to be used. The bottom of the pool is made of a 0.002 m-thick steel plate with the main orifice in the center to supply the cables to the heater. A containment vessel is located in the center of the pool at 0.05 m above the bottom plate. The length, width, and height of the pool are 0.5 m, 0.5 m, and 1.25 m, respectively, the pool is filled with water, and the upper surface is open to the atmosphere. Vessel length and diameter are 0.96 m and 0.219 m, respectively.
Figure 3c shows the experiment schematic.
3.2. Experimental Conditions and Procedures
Four tests were done with 1 kW, 2 kW, 3 kW, and 4 kW thermal power supplied by the heater as a constant rated power for 1200 s continuously for each test, where the room air temperature was approximately 298 K, relative humidity was 64%, and air velocity was 0.2 m/s. Upon heating up the cylindrical wall and upper dome of the small steel containment vessel from inside, the water film temperature on the outer surfaces rises gradually and flows upward. The temperature at different regions is measured by the thermocouples. The temperature data during the 1200 s for each test were saved every 5 s to be compared with CFD results.
4. CFD Model
Development of computer technology has prompted the development of numerous turbulence models for certain problems that are intensively used in different fields. The k-ε model is suitable for using in fully developed turbulence regions. For boundary regions near a wall, Re is small, so the gradients of k and ε are very large. Low Re models have been developed to analyze the boundary regions, but the low Re models need many cells in the boundary layer region, so they are impractical. Therefore, wall functions are normally used to treat the boundary layer near the wall [
12]. Thus, the standard k-ε model was used.
In order to reduce the calculation time, only 1/8 of the experimental model volume was taken to build the three-dimensional model.
4.1. Initial and Boundary Condition
Boundary conditions were set as exactly consistent with the experiment benchmark test and some supplementary conditions were estimated with the assumption to fulfil the numerical simulation:
Constant heat fluxes provided by the heater were applied in the upper dome and cylindrical walls.
Heat dissipating rates through the upper surface due to vaporization were calculated in 4 tests depending on the upper surface temperatures and environment.
Radiation heat transfer was ignored due to its percentage being very small.
Heat dissipating rates through the glass wall, lower plate, and steel neck are neglected.
4.2. General Setting
In natural convection, fluid motion is generated due to the density difference (buoyancy) in the fluid caused by temperature gradients. Therefore, a full buoyancy effect was enabled and a standard wall function was used for transitional simulation. Atmospheric pressure was set in operating conditions, gravity was enabled at a value of 9.81 m/s
2 in the negative y-direction, and calculated values of operating temperature and density were set depending on each test’s initial temperatures. Boussinesq approximation density was used. A pressure-based segregated solver was selected and the SIMPLE algorithm was adopted. The boundary conditions are listed in
Table 1.
5. CFD Model Validation
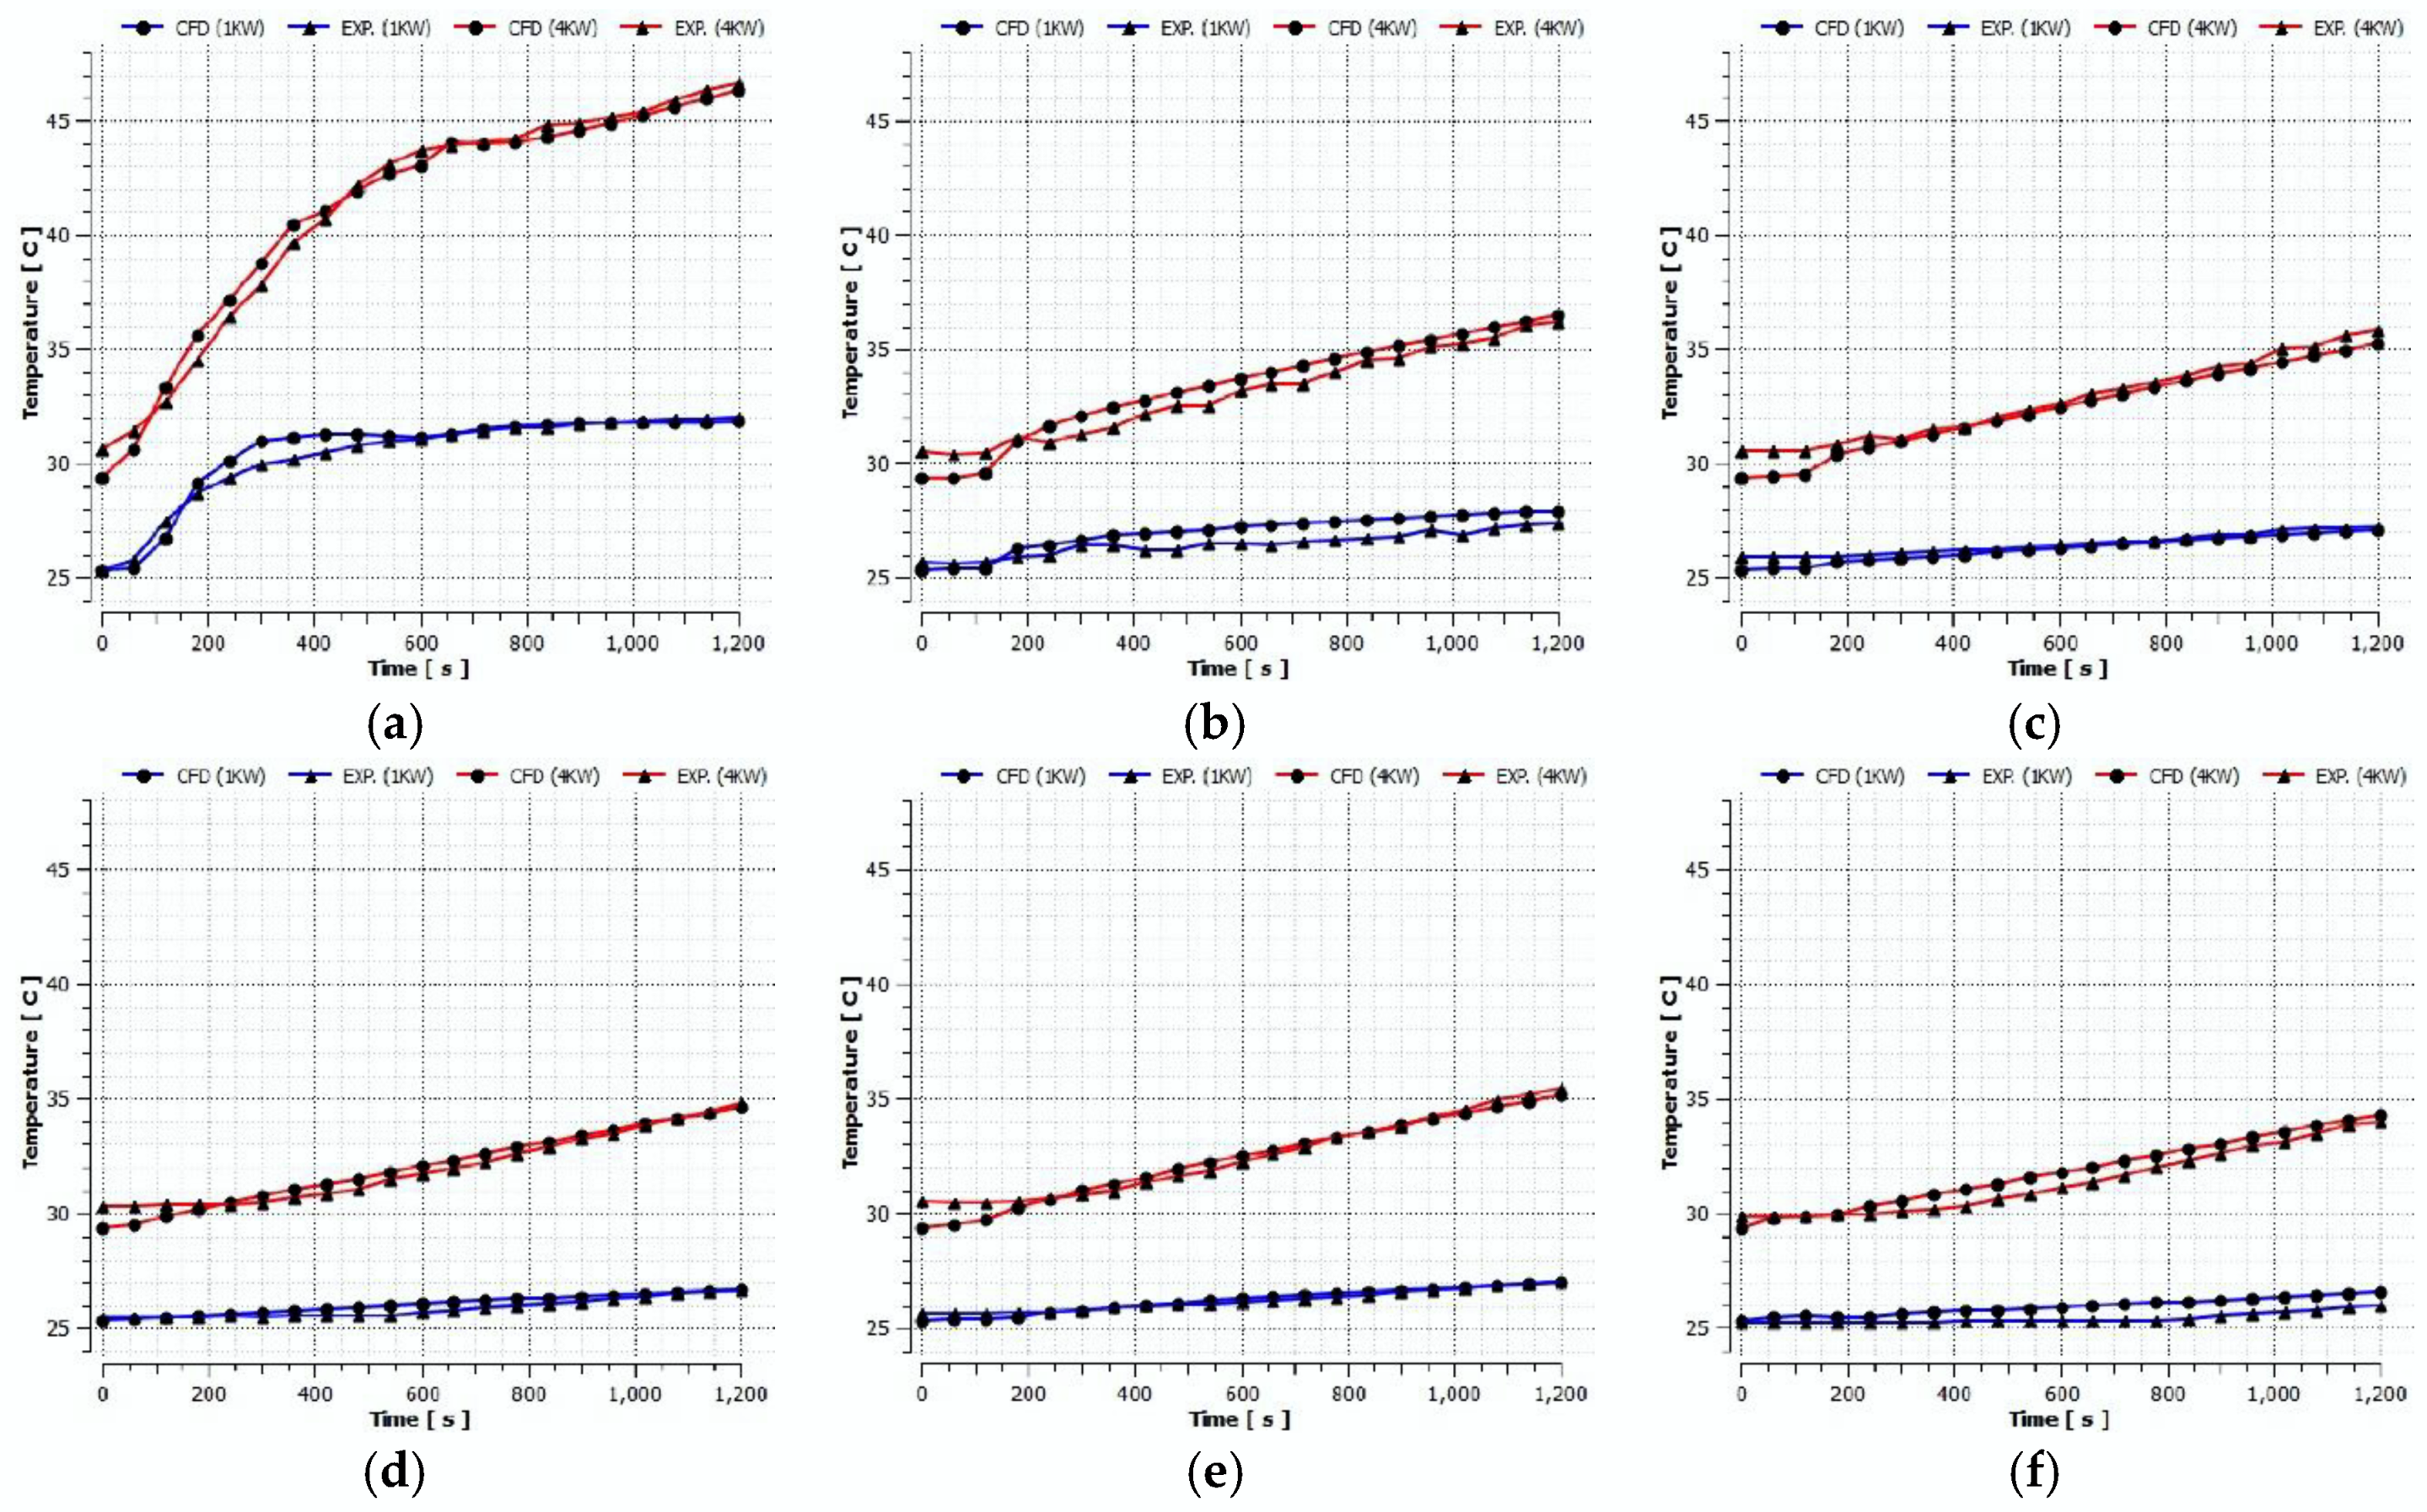
To confirm the temperature distribution of the CFD simulation during the time period of 1200 s with the experimental results, six points were selected, which refer to vertical thermocouples lines at different heights (
). The localization of the selected thermocouple points is shown in
Figure 3b. Measured and calculated temperature during the 1200 s for the considered points in the cases of 1 kW and 4 kW are compared in
Figure 4a–f.
6. Results and Discussion
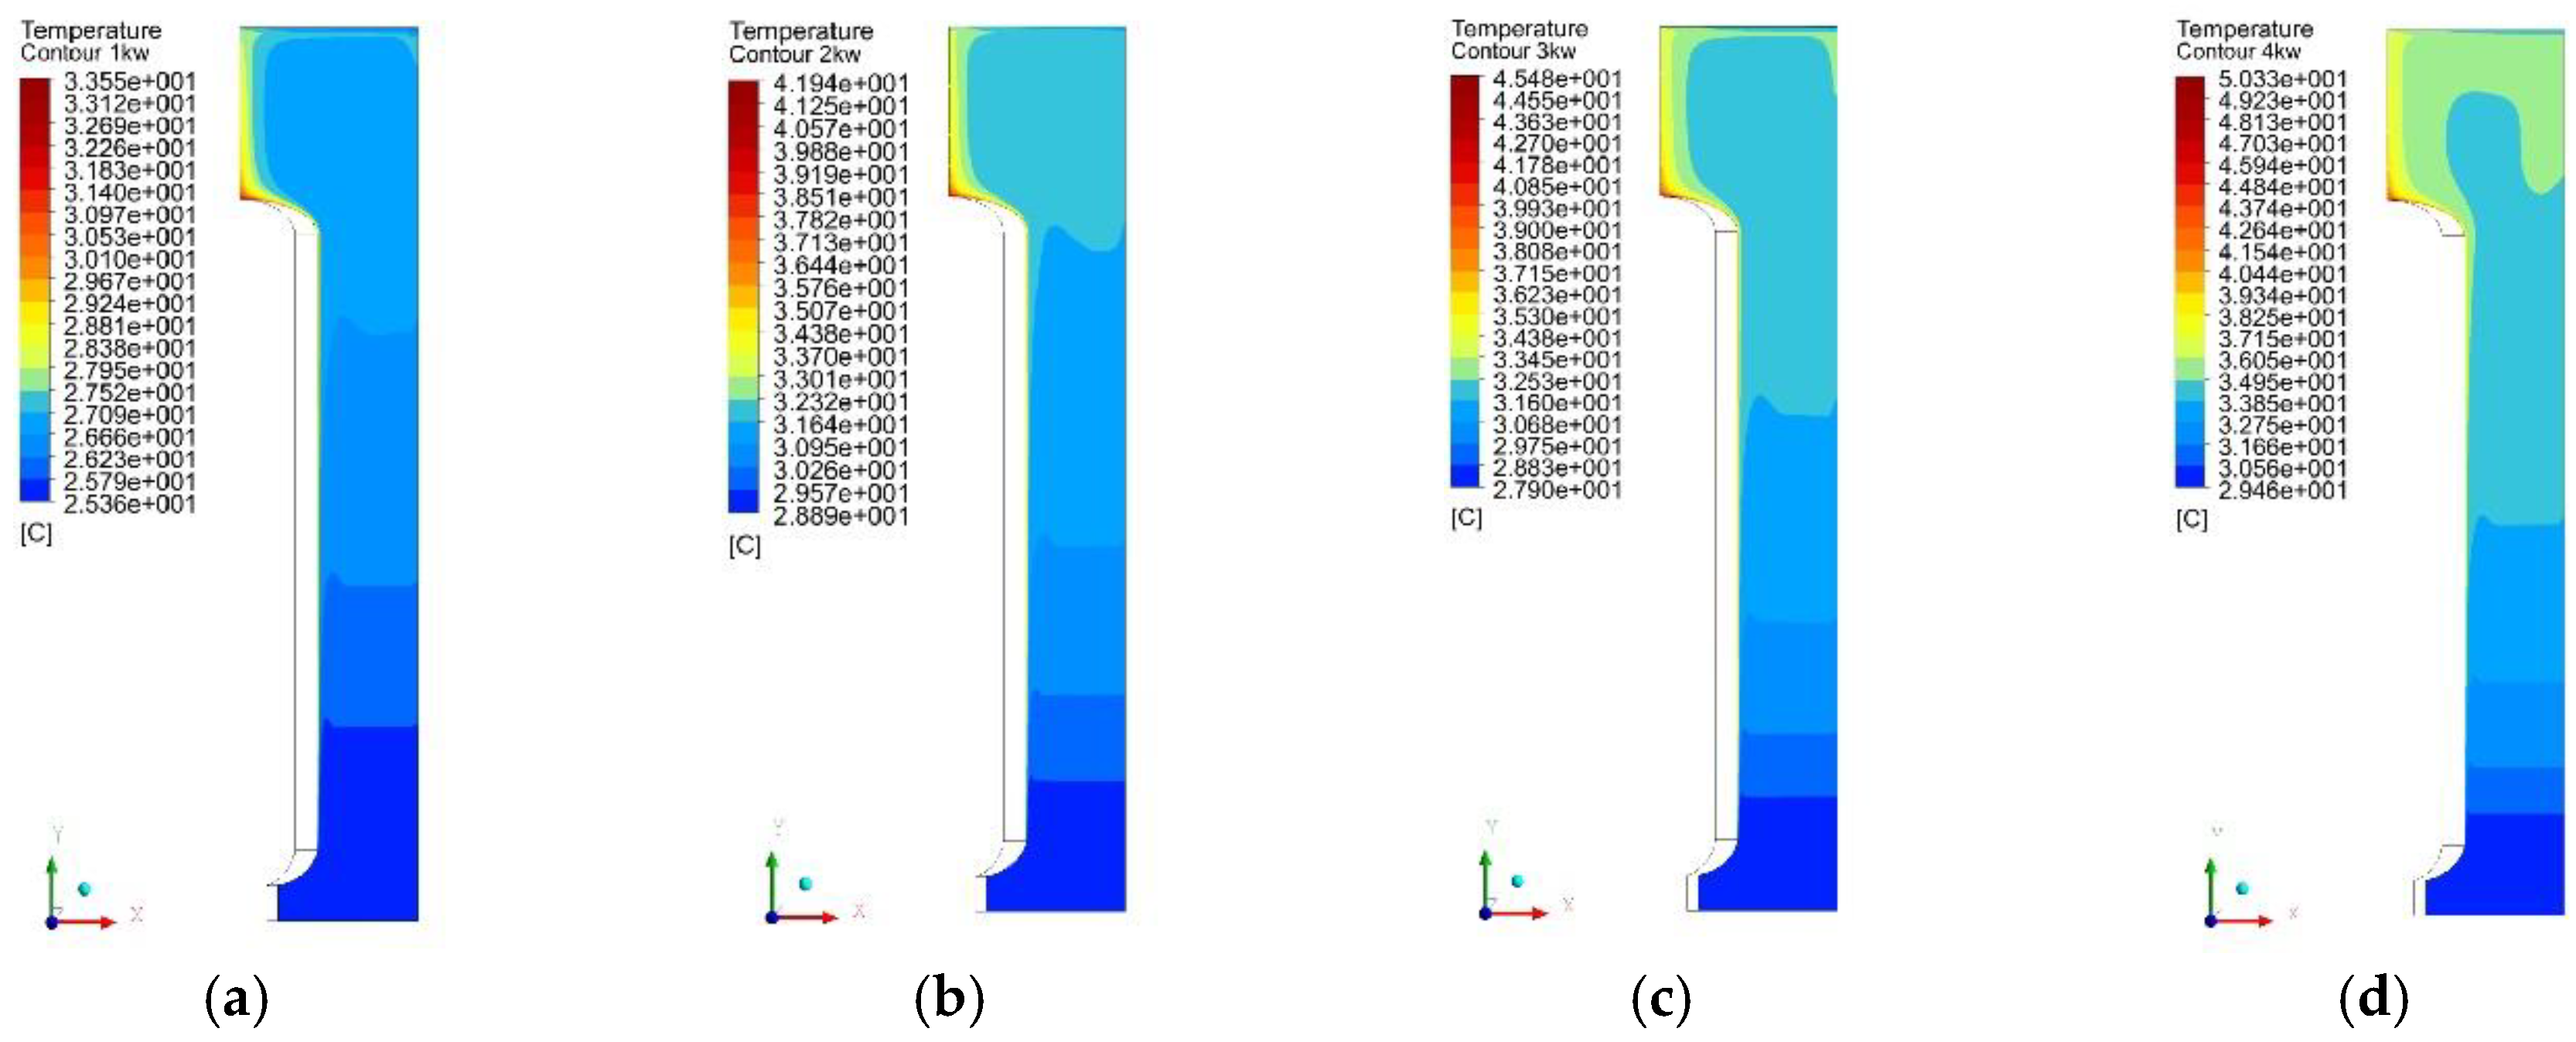
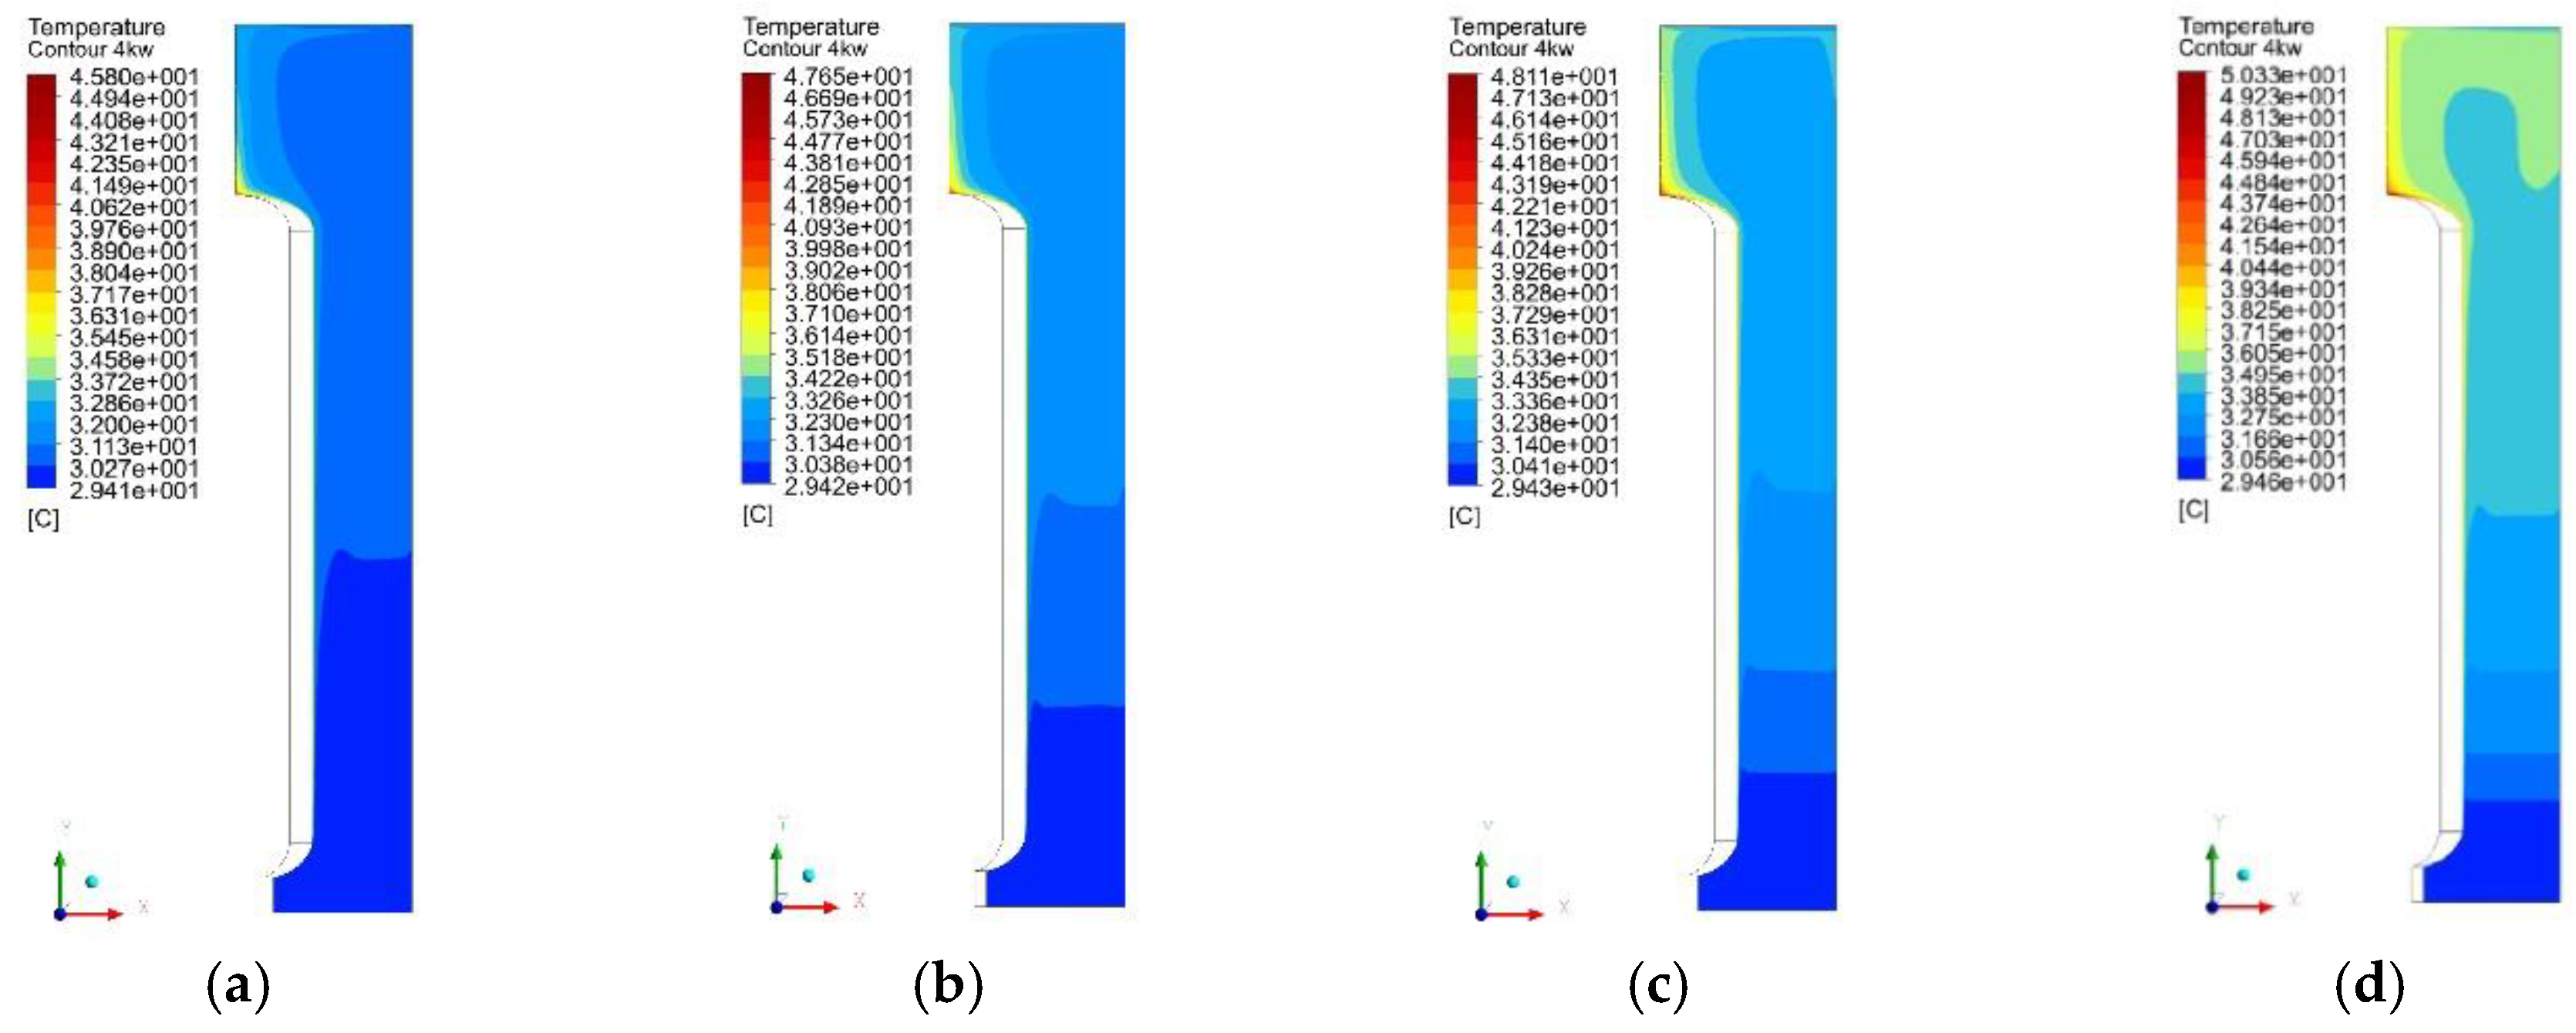
Temperature contours depicted in
Figure 5 and
Figure 6 show that the water temperature increases in the positive y-direction and formed thermal stratification in the y direction. The temperature of fluid at the bottom of the pool is the smallest and its density is largest. Therefore, fluid density leads the pool water to stay in stratified layers above each other. In
Figure 5a–d, with the power increase, the temperature difference increases and induces developed thermal stratification. Contours of
Figure 6a–d reflect the influence of time in the temperature distribution and stratification with the condition of the 4 kW power case. Long term natural convection increases the water pool stratification and the gradient of temperature increases as well.
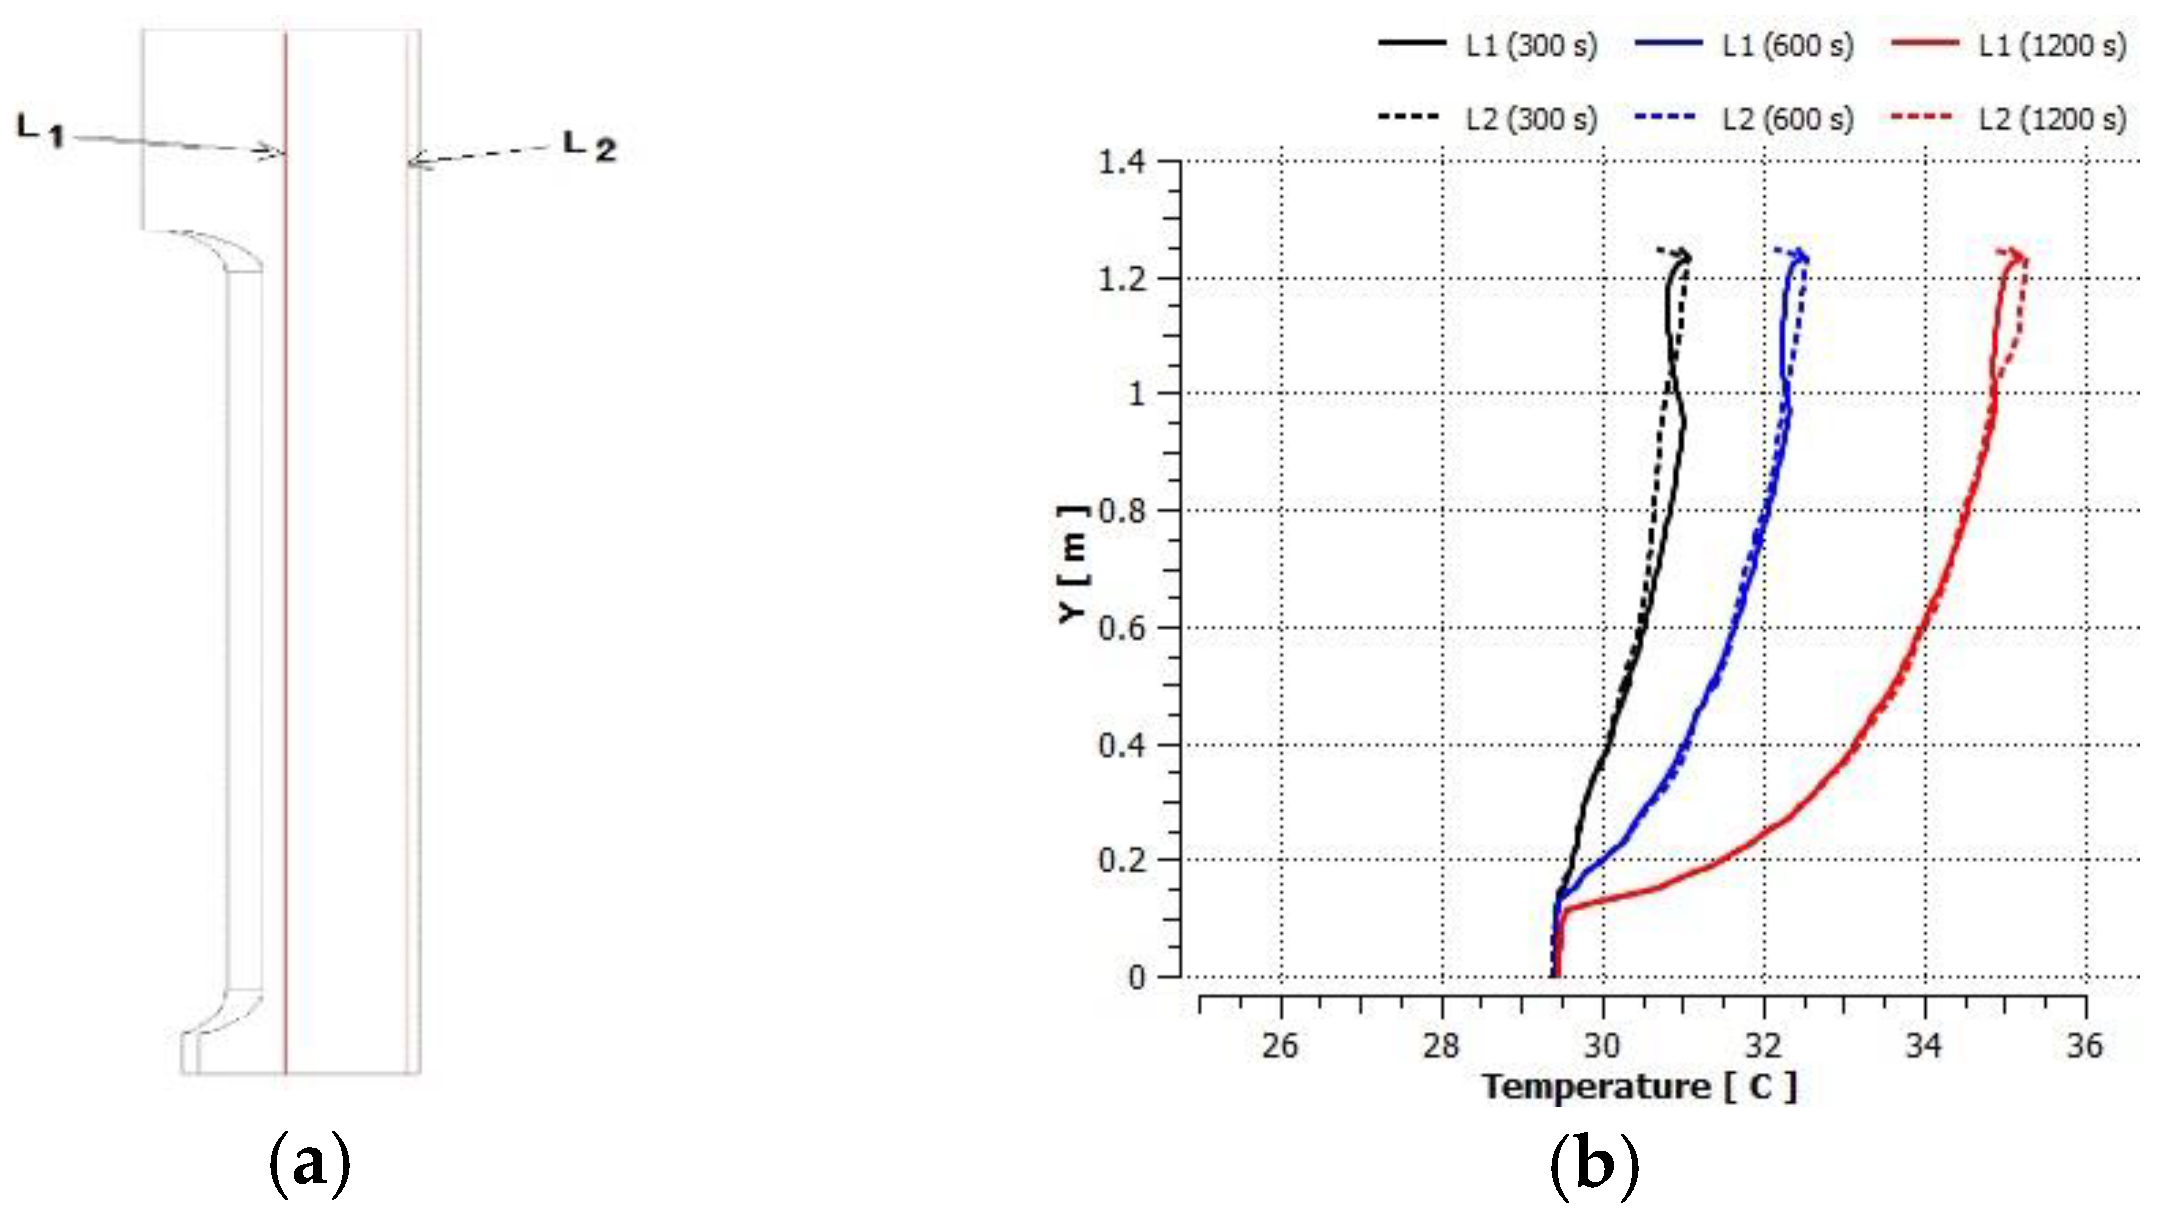
By monitoring the temperature along the y-direction between the two vertical lines 1 and 2 shown in
Figure 7a at different times and powers,
Figure 7b shows the vertical temperature distribution under the condition of 4 kW power case at three different times. With the different time, the temperature of line 1 and line 2 is nearly the same in the stratified area, and the temperature of line 2 is a little higher than line 1 in the mixing area.
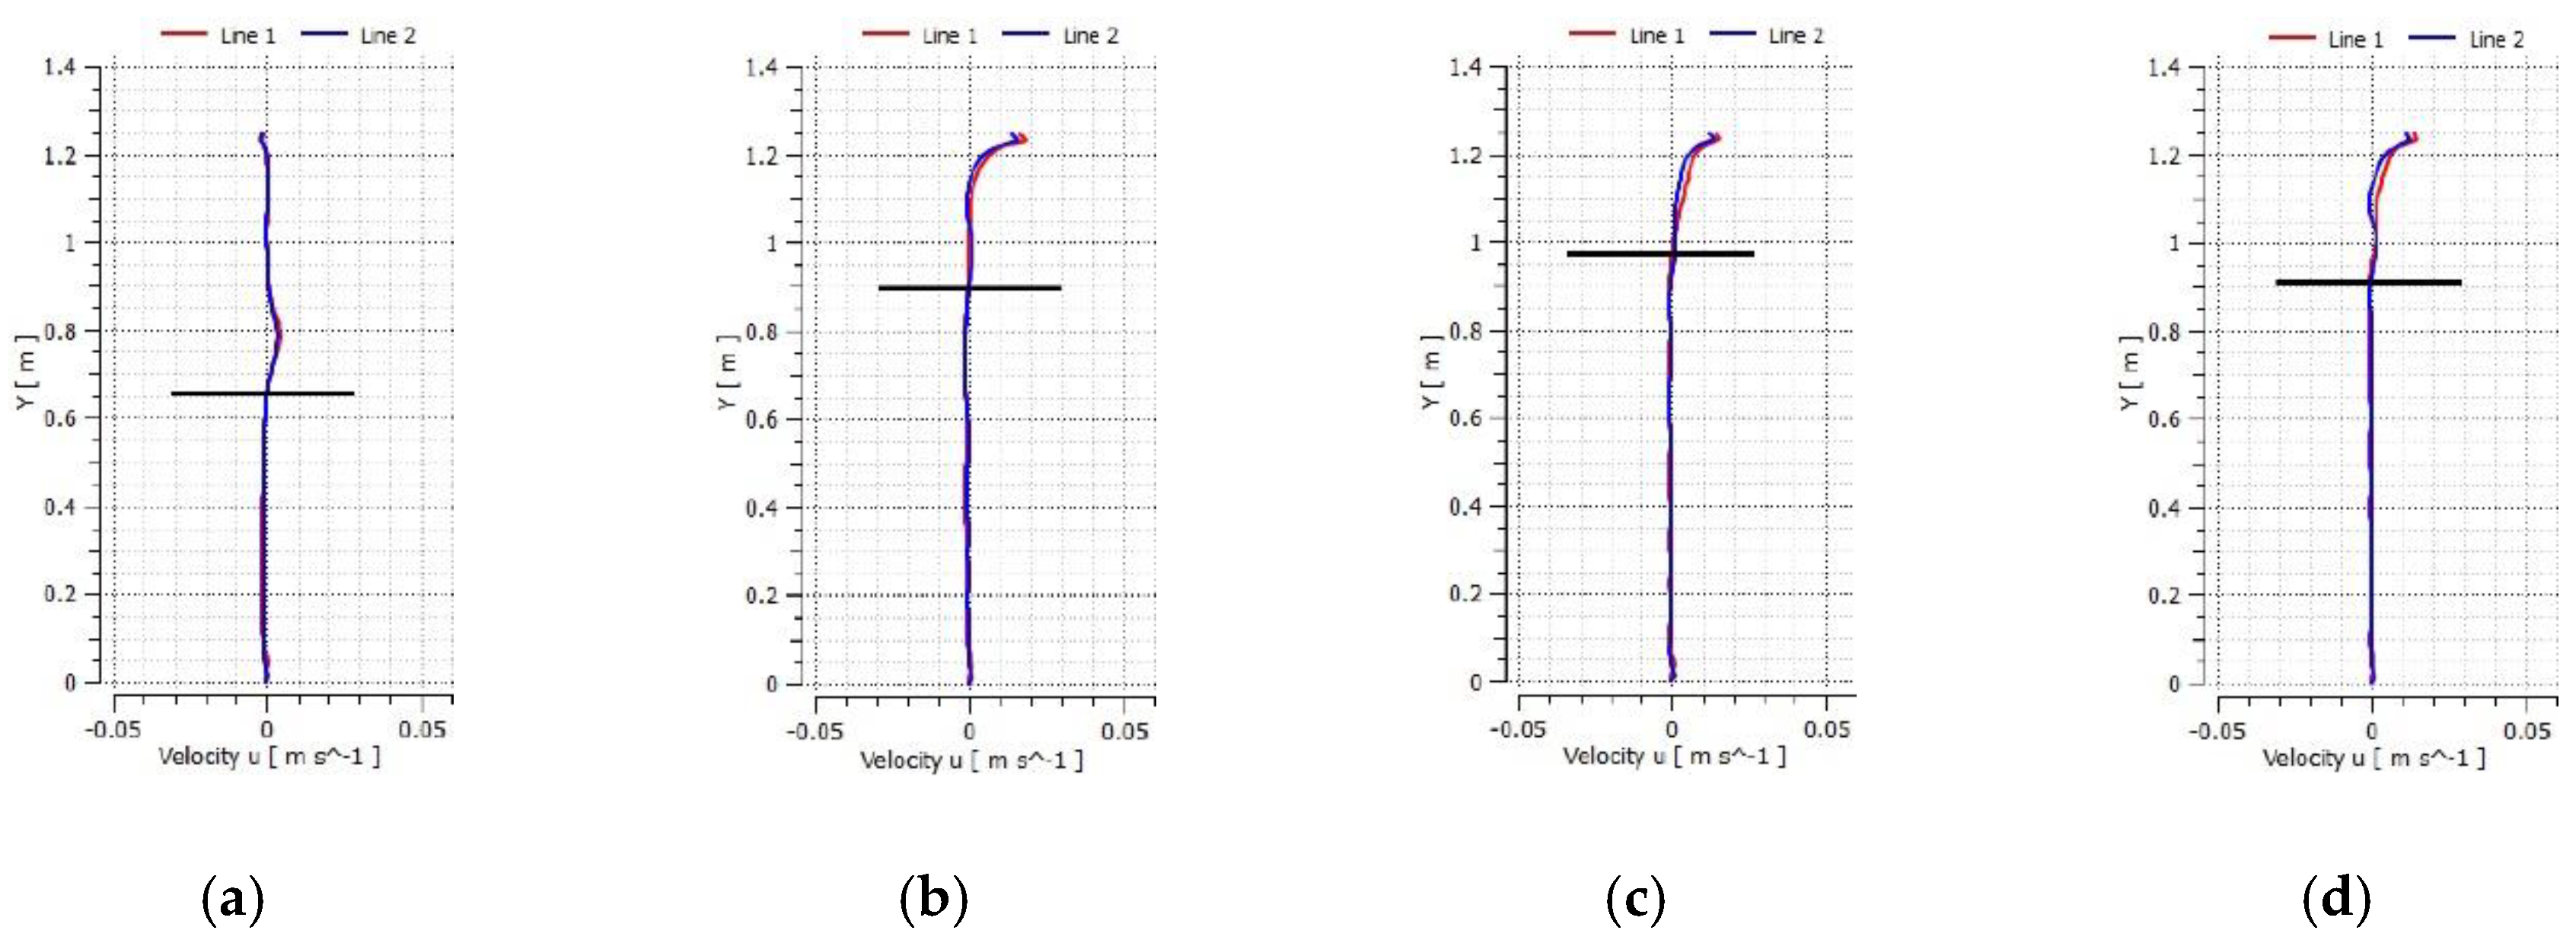
The vertical velocity profile of 4 kW at line 1 and 2, drawn in
Figure 8a–d, shows the position of the interface between the mixing and stratified area by monitoring the horizontal velocity, which has to be approximately zero in the stratified area. The black horizontal line is the mixing interface position which is moving up and down according to the mixing and stratification conditions with the different time.
Flow patterns can be classified into three types based on the buoyancy–momentum relationship: momentum is stronger than buoyancy (mixing), momentum is similar to the buoyancy (Gradual thermal stratification), and buoyancy is stronger than the momentum (Developed thermal stratification):
7. Conclusions
In this study, an experiment of a small steel containment vessel immersed in a pool of water with (1 kW, 2 kW, 3 kW, and 4 kW) thermal powers and CFD simulation using ANSYS FLUENT were conducted to study the mechanism of thermal stratification in the reactor pool.
The formulation of thermal stratification in the reactor pool is explained. The fluid adjacent to the heated wall moves upward at the beginning of the LOCA accident. When it reaches the water surface, it turns horizontally and stays on the top. When a hotter layer is generated again at the top, the older layer will move downward due to the density difference. Thermal stratification is gradually formed.
According to the characteristics of heat transfer, thermal stratification conditions can be divided into three stages: full mixing, gradual thermal stratification, and developed thermal stratification.
Comparing the CFD results which used the stand k-ε model and the experimental results, it can be seen that the two results are similar. It is shown that the stand k-ε model is suitable for calculating thermal stratification in the pool outside the containment.
Author Contributions
S.W. devised and designed the project and article. X.C. and G.A. performed the experiment. G.A. made the CFD simulations, analyzed the data, and wrote the article.
Funding
This research is supported by the Major National Science and Technology Program (NO. 2015 ZX06002007-001) sponsored by the Ministry of Science, National Natural Science Foundation of China (11635005) and Technology of People’s Republic of China and Fundamental Research Funds for the Central Universities (2018ZD10).
Conflicts of Interest
The founding sponsors had no role in the design of the study, in the collection, analyses, or interpretation of data, in the writing of the manuscript, or in the decision to publish the results.
References
- Locatelli, G.; Boarin, S. Load following with Small Modular Reactors (SMR): A real options analysis. Energy 2015, 80, 41–45. [Google Scholar] [CrossRef]
- Nawaz Butt, H.; Ilyas, M. Assessment of passive safety system of a Small Modular Reactor (SMR). Ann. Nucl. Energy 2016, 98, 191–199. [Google Scholar] [CrossRef]
- Reyes, J.N., Jr. NuScale Plant Safety in Response to Extreme Events. Nucl. Technol. 2012, 178, 153–163. [Google Scholar] [CrossRef]
- NuScale Plant Design Overview. Available online: https://www.nrc.gov/docs/ML1221/ML12216A392.pdf (acccessed on 3 July 2018).
- Basu, D.N.; Bhattacharyya, S. A review of modern advances in analyses and applications of single-phase natural circulation loop in nuclear thermal hydraulics. Nucl. Eng. Des. 2014, 280, 326–348. [Google Scholar] [CrossRef]
- Choi, J.-H.; Cleveland, J. Improvement in understanding of natural circulation phenomena in water cooled nuclear power plants. Nucl. Eng. Des. 2011, 241, 4504–4514. [Google Scholar] [CrossRef]
- Kumar, S.; Grover, R.B. Numerical investigation on the effect of shrouds around an immersed isolation condenser on the thermal stratification in large pools. Ann. Nucl. Energy 2017, 110, 109–125. [Google Scholar] [CrossRef]
- Song, D.; Erkan, N. Relationship between thermal stratification and flow patterns in steam-quenching suppression pool. Int. J. Heat Fluid Flow 2015, 56, 209–217. [Google Scholar] [CrossRef]
- Bieniussa, K.W.; Reck, H. Piping specific analysis of stresses due to thermal stratification. Nucl. Eng. Des. 1999, 190, 239–249. [Google Scholar] [CrossRef]
- Opanasenko, A.N.; Sorokin, A.P. Coolant stratification in nuclear power facilities. At. Energy 2012, 111, 172–178. [Google Scholar] [CrossRef]
- International Atomic Energy Agency. Natural Circulation in Water Cooled Nuclear Power Plants Phenomena, Models, and Methodology for System Reliability Assessments; IAEA: Vienna, Austria, 2005; pp. 143–144. ISBN 92-0-110605-X. [Google Scholar]
- Yu, J.; Jia, B. PCCSAC: A Three-Dimensional Code for AC600 Passive Containment Cooling System Analysis. Nucl. Sci. Eng. 2002, 142, 230–236. [Google Scholar] [CrossRef]
© 2018 by the authors. Licensee MDPI, Basel, Switzerland. This article is an open access article distributed under the terms and conditions of the Creative Commons Attribution (CC BY) license (http://creativecommons.org/licenses/by/4.0/).


