Article

Copula-Based Joint Probability Analysis of Compound Floods from Rainstorm and Typhoon Surge: A Case Study of Jiangsu Coastal Areas, China

1
College of Hydrology and Water Resources, Hohai University, Nanjing 210098, China
2
College of Computer and Information, Hohai University, Nanjing 211100, China
*
Author to whom correspondence should be addressed.
Sustainability 2018, 10(7), 2232; https://doi.org/10.3390/su10072232
Submission received: 13 May 2018 / Revised: 20 June 2018 / Accepted: 24 June 2018 / Published: 28 June 2018
(This article belongs to the Special Issue Conflict Analysis and Sustainable Management of Water Resources)

Abstract

:
Coastal areas are vulnerable to floods caused by rainstorms and typhoons. It is necessary to ascertain the risk of floods caused by both of these extreme weather events. A conceptual risk model is proposed to evaluate the rainstorm risk, typhoon surge risk, and the compound risk in the coastal areas of Jiangsu Province during the period of 1960–2012. The results of the model show that the typhoon surge risk in the study region is greater than the rainstorm risk. Three Archimedean copulas were used to fit the joint probability distributions of the compound events. The Frank copula and the Gumbel copula proved to be the best-fitting joint distribution function for the Huaibei plain district and the Lixiahe district, respectively. The probability of the extreme compound events not happening is less than 90% in the study region. This means that the flood risk is mainly subject to the encounter of a low-level rainstorm and a low-level typhoon surge. The study shows that the northern region of Jiangsu Province is more vulnerable to the compound risk, and that we should pay more attention to the floods caused by the compound events of rainstorm and typhoon surge.

1. Introduction

Violent tropical cyclones that develop in the western of North Pacific Ocean and move towards the west or northwest, landing in Japan, Korea, and the southwestern coast of China, are usually called typhoons. A strong typhoon often generates winds and rainfall [1]. The coastal areas are more vulnerable to specific hazards due to the development of the national economy [2], as an overwhelming part of the population is concentrated along or near the coasts, facing a high risk of coastal floods [3]. China is a country subject to frequent natural hazards and their impacts, including lives lost and property damaged. Among such hazards, floods are the most serious disasters [4]. Typhoon-related coastal floods are mainly caused by heavy rainfall and high sea levels due to a combination of rainstorms and typhoon surges [5]. When a typhoon approaches China, its strong winds and low atmospheric pressure often generate rainfalls and typhoon surges, which can lead to floods in coastal areas [6]. According to the typhoon track data from the China Meteorological Administration (CMA), China suffers an average of seven or eight typhoons annually. Most typhoons hit China between June and October every year. During the period of 1983–2006, seven typhoons made landfall over mainland China and Hainan Island, leading to a direct economic loss of 28.7 billion yuan (CNY) and killing 472 people annually based on the Department of Civil Affairs of China’s statistical data [7]. Consequently, it is important to analyze the flood risk in coastal areas to reduce the damage, especially when a typhoon encounters a rainstorm.
As widely studied hydrological extreme events, floods are characterized by flood peak flow, flood volume, and flood duration. For most flood frequency analyses, considering one variable provides limited information [8,9] because univariate probability analysis cannot provide a perfect evaluation of the occurrence of extreme events, which are characterized by a series of associated random variables [10]. In fact, the correlation between environmental variables of extreme weather is usually important, considering that the characteristics of variables and their possible interdependence are the foundation of the design and safety assessment of coastal flood control projects [11]. Therefore, the analysis and evaluation of flood risk in the coastal area has become a very important topic nowadays. Rainstorms and typhoons are the main disaster-causing factors of floods in the coastal areas. It is meaningful work to determine the correlation between rainstorms and typhoons in flood risk, especially for floods caused by compound events of rainstorms and typhoons. The copula theory, first introduced by Sklar [12], provides an ideal function to represent the multivariate joint distribution from univariate margins based on the random variables’ multivariate dependence structures [13], and it has been extensively used in insurance and finance. A detailed and comprehensive copula theory was introduced by Nelsen [14]. The Archimedean copulas, which include Clayton, Frank, and Gumbel copula, are widely used in hydrology analysis, and they have been applied to model the dependence when the hydrologic variables have positive or negative correlations [15]. Hu et al. [16] used the Gumbel copula function to analyze the encounter frequency of typhoon and plum rain in Taihu Lake Basin. Shiau et al. [17] used the copula function to describe the joint distribution of depth and duration of rainfall, ultimately deriving a depth-duration-frequency model. Tao et al. [18] selected the Poisson bivariate compound maximum entropy distribution to establish the joint distribution of extreme water level and wave height in a typhoon period. Wahl et al. [19] ascertained the likelihood of compound events of storm surge and heavy precipitation for the coastal areas of the United States (US), and the results showed that the flood risk from compound events was higher in the Atlantic/Gulf coast. Kwon et al. [20] analyzed the correlation between annual maximum wind speed and rainfall by using the copula function in the typhoon danger zone. A new bivariate compound extreme value distribution was proposed by Dong [21] to describe the probability distribution of annual extreme wind speed and maximum rainfall intensity in the coastal areas that are affected by typhoons.
The simultaneous encounter of rainstorm and typhoon is more likely to cause severe floods in the coastal areas and often leads to huge catastrophic consequences [22]. In particular, the rise in sea level caused by typhoon surge has gradually become the main factor for the amplification of flood risk [23]. During the period of a rainstorm, the sluice gates need to open to drain floodwater, but during the period of a typhoon, the sluice gates need to close to prevent seawater intrusion. The main purpose of this work is to implement a copula-based methodology to analyze the frequency of the simultaneous encounter of rainstorms and typhoon surges. The primary objectives of this research can be summarized as follows: (1) to understand the causes and the implications of statistical features between rainstorms and typhoon surges in the research areas; (2) to identify the key risk factors of the compound events; (3) to investigate the relationship between rainstorms and typhoon surges, and to build a proper bivariate copula function for the simultaneous encounter of rainstorms and typhoon surges.
The rest of this paper is structured as follows: Section 2 provides the foundation of the case study, introducing the theory of copulas used in this study. Section 3 analyzes the characteristics of rainstorms, typhoons, and typhoon surges in the research areas. Section 4 discusses the marginal distribution and the return period of compound events of rainstorms and typhoon surges. Finally, Section 5 concludes the paper.

2. Materials and Methods

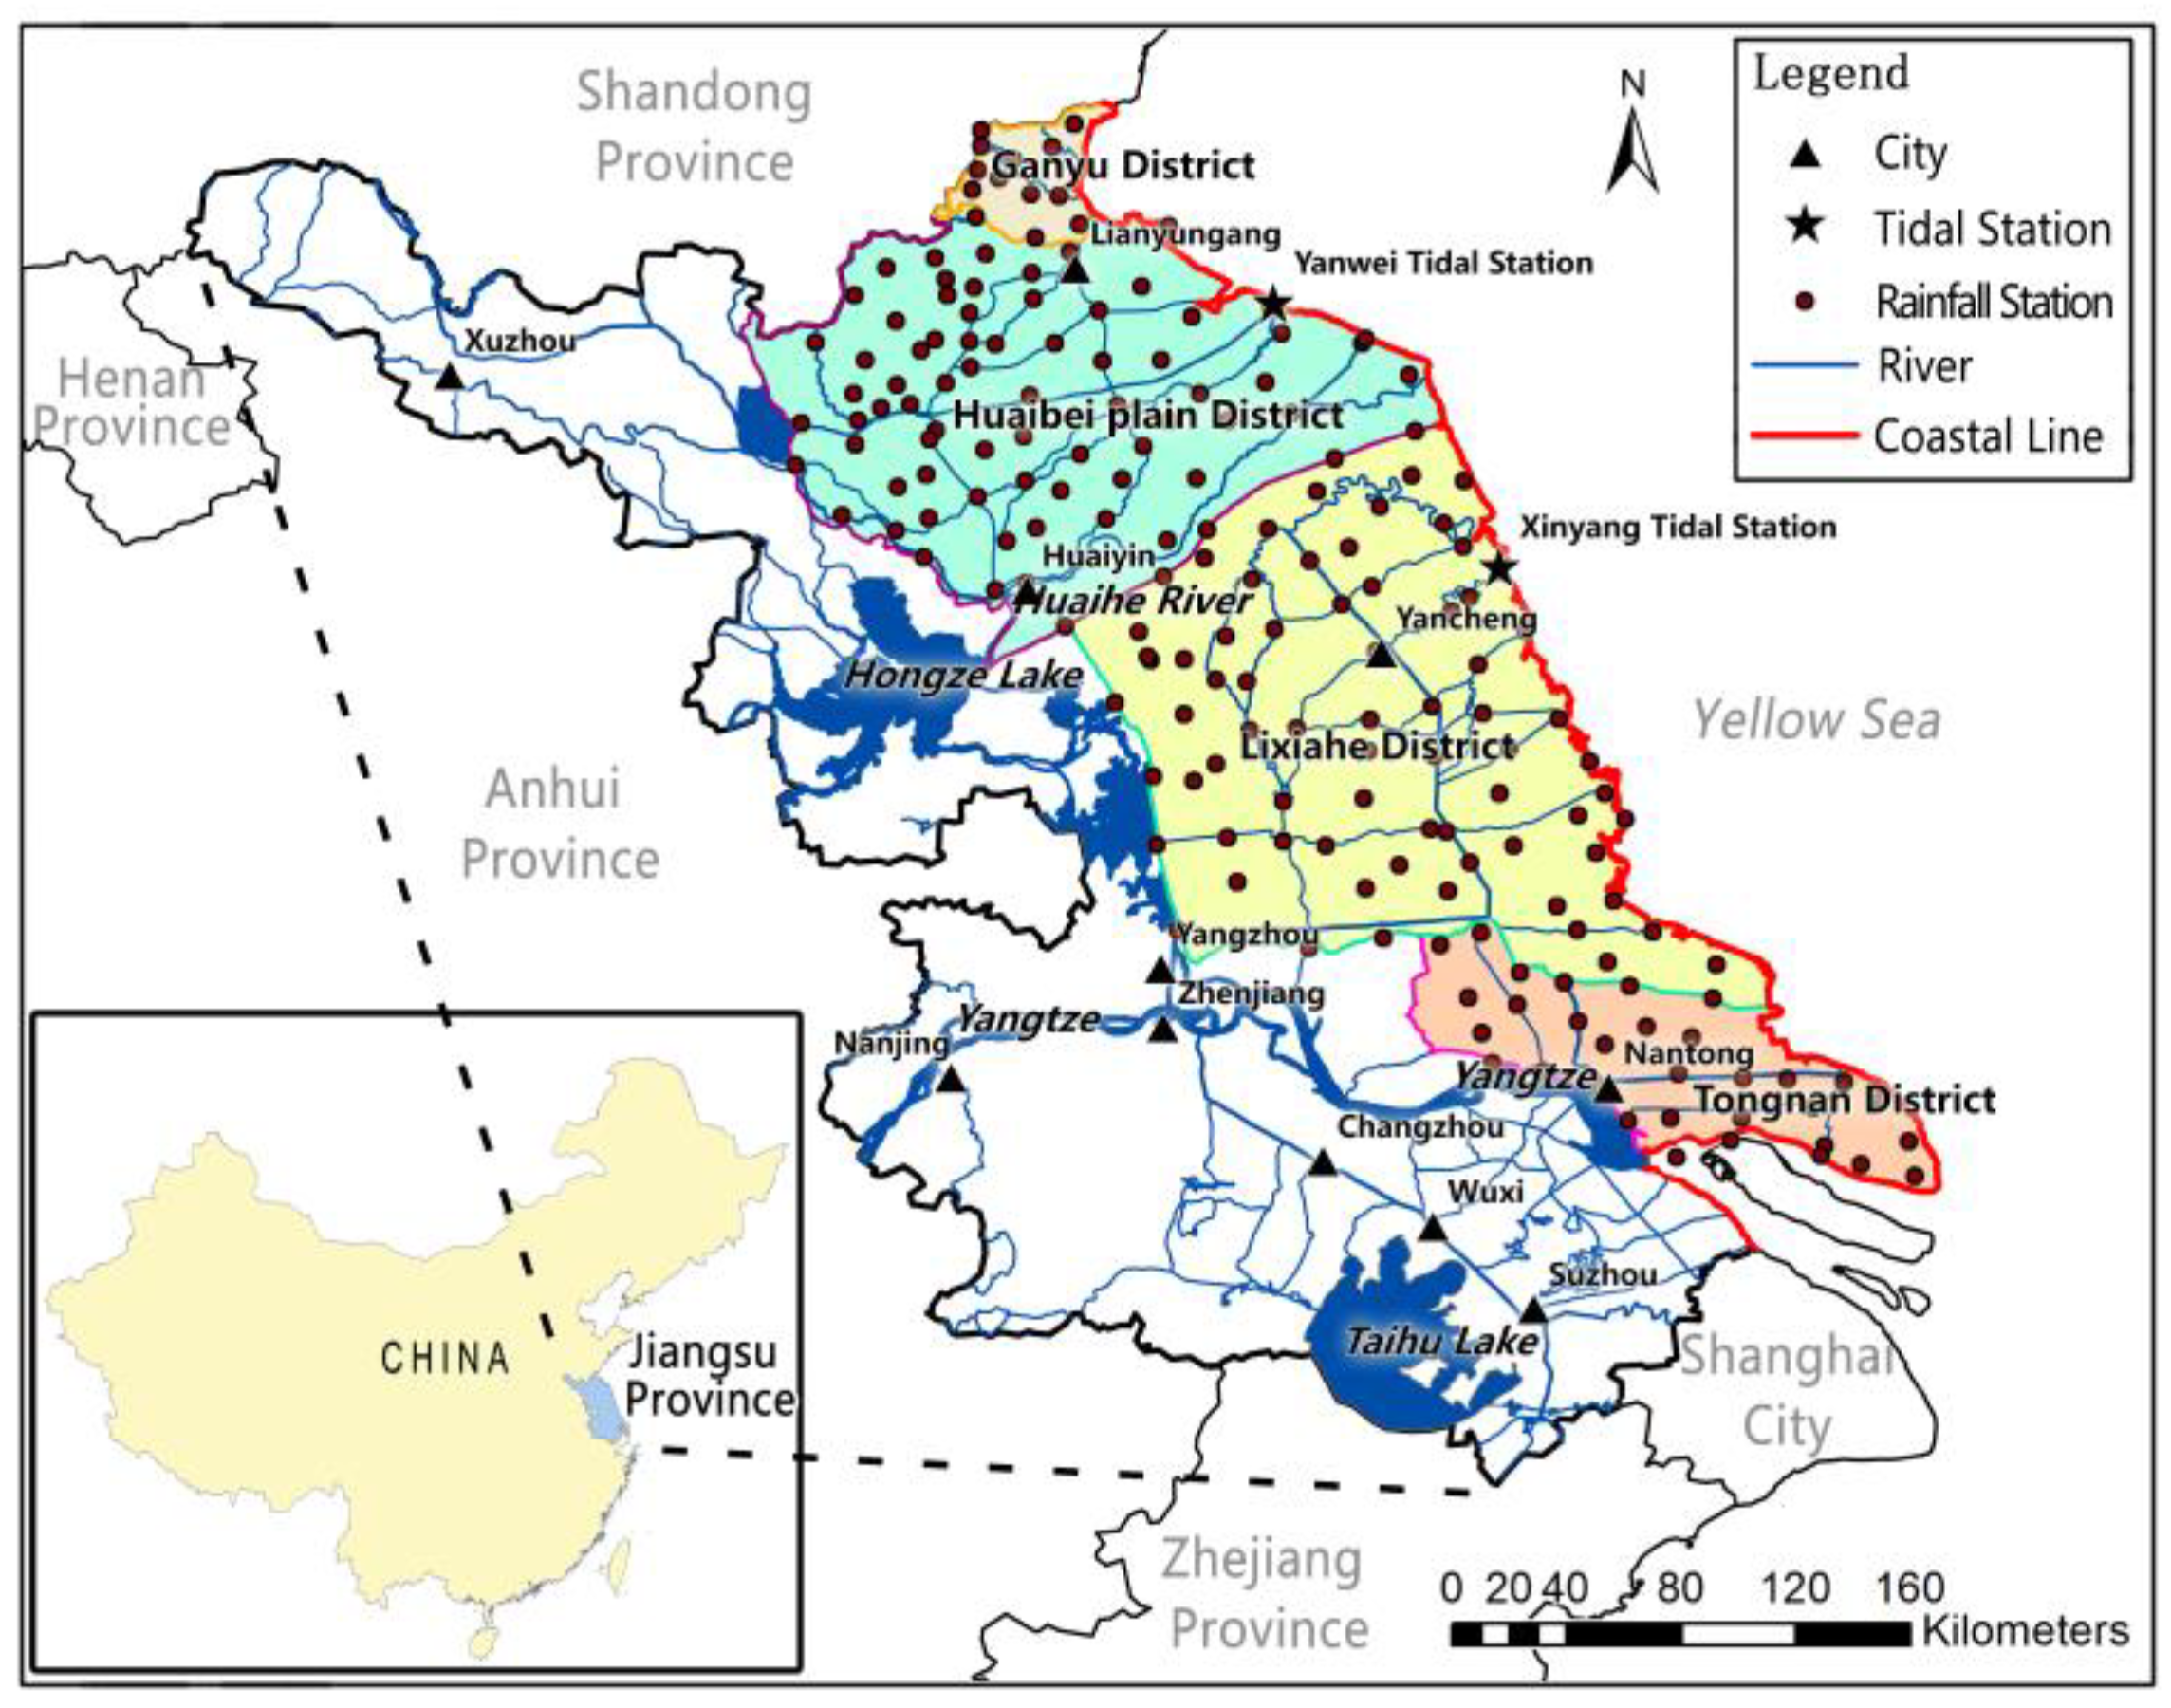
2.1. Study Area and Data

The study area (as shown in Figure 1) for this research is located in the east coastal areas of Jiangsu Province, China, from 116°18′ E to 121°57′ E and from 30°45′ N to 35°20′ N. It has a coastline of 954 km along the Yellow Sea. The Yangtze River passes through the southern part of Jiangsu Province, and the Huaihe River passes through the northern part. According to the geographical and hydrological conditions, the coastal areas of Jiangsu are usually divided into four districts: the Ganyu district, the Huaibei plain district, the Lixiahe district, and the Tongnan district.
The Huaihe River basin has always been a key area of flood risk research in China [24]. The Huaibei plain district, with fewer interfering factors, and the Lixiahe district, with a long coastline, are the two main research areas in this study. The total drainage area of the two regions is 4150 km2 and 21,497 km2; the Yanwei station is located at the main coastal port of the Huaibei plain district, and the Xinyang station is the main tidal station of the Lixiahe district. Both stations are strongly representative of these research areas due to their location, which are at the mouths of the main rivers.
The rainfall data and the typhoon track data [25] were provided by the National Meteorological Information Center of China Meteorological Administration (http://data.cma.cn, tcdata.typhoon.org.cn); The duration of the rainfall data is from the establishment of the station until 2012. The tidal data, provided by the State Oceanic Administration (http://ocean.cnss.com.cn/), has a time span from 1960 to 2012. In order to maintain the consistency of data with respect to time scale, the study period was established as 1960–2012. There are 191 rainfall stations that fall into the study period, and the area rainfall (average precipitation) of each research region was calculated with the Thiessen polygon method based on the selected stations. The intensity of typhoon surges depends on the level of typhoon, different from astronomical tides which have a periodic character of rising and falling. The typhoon surge deviation H ( t ) at time t can be expressed as the difference between the measured sea water level y ( t ) and the estimated astronomical tide level Y ( t ) [26], i.e.:
H ( t ) = y ( t ) Y ( t )

2.2. Marginal Distribution

The Pearson distribution is a family of continuous probability distributions, first published by Karl Pearson in 1895. The log–Pearson type III distribution curve method is recommended by the Water Resources Council of the United States, and it was fitted to the sample hydrological data by using the mean, standard deviation, and skewness coefficient of the logarithms [27,28]. This method is also widely used in the frequency analysis of extreme hydrology events in China [29,30]. In this study, we chose the Pearson type III (P-III) distribution curve to model the marginal distribution of rainstorms and typhoon surges, using Simpson’s Rule to reduce the error. The P-III probability density function can be expressed as:
f ( x ) = β α Γ ( α ) ( x α 0 ) α 1 e β ( x α 0 )   α > 0 , β > 0
where Γ ( α ) is the Gamma distribution of α , α is the shape parameter, β is the scale parameter, and α 0 is the minimum value of the α .

2.3. Copula Functions

The copulas link the univariate distribution functions of random variables to construct multivariate distribution functions, in which the domain is [0,1]. However, when two random variables are considered, based on Sklar’s theorem, if there is a two-dimensional joint cumulative distribution function F X , Y ( x , y ) , and F X ( x ) and F Y ( y ) are the marginal distribution functions of X and Y , then there exists a bivariate copula C , which can be written as the formula:
F X , Y ( x , y ) = C ( F X ( x ) , F Y ( y ) )   x , y R
The mapping function C : | 0 , 1 | 2 | 0 , 1 | is the copula function for two independent uniform distributions u, v in the domain of [0,1], and c is the density function of C, which can be defined as:
c ( u , v ) = 2 C ( u , v ) u v
In this study, we selected three widely used Archimedean copulas (Clayton, Frank, and Gumbel–Hougaard) as the candidate functions for modeling the joint probability distribution of compound events. The three Archimedean copula functions are defined in Table 1.

2.4. Parameter Estimations

The optimal copula function is determined by the appropriate parameters. Sadegh et al. [31] put forward a newly invented Multivariate Copula Analysis Toolbox, which employs the Bayesian framework to describe dependence and uncertainty of fitted copulas; it has been proved that it can be used to find the best copula family among 26 families. In addition, there are many methods to confirm the correlation between random variables: Pearson correlation coefficient ρ , Kendall rank correlation coefficient τ , Spearman rank correlation coefficient ρ s , and tail correlation coefficient λ . Other optimal criteria of the copula function, such as the least root-mean-square error (RMSE), Kolmogorov–Smirnov (K–S) test [32], Anderson–Darling (A–D) test [33], Jarque–Bera (J–B) test [34], Cramer–von Mises tests [35], Akaike information criterion (AIC) [36], ordinary least squares (OLS), and Bayesian information criterion (BIC), are usually used to estimate the goodness-of-fit (GOF) of copula families.
The nonparametric estimation method used to estimate the copula parameters in this study was put forward by Genest and Rivest [37]. It mainly depends on the relationships between the Kendall rank correlation τ and the corresponding copula parameter α . Kendall’s tau τ , which is used to determine the relevance of random variables, can be expressed as:
τ = 2 ( n c n d ) n ( n 1 )
where n c is the number of concordant pairs, n d is the number of discordant pairs (concordant: ordered in the same way; discordant: ordered differently).
The goodness-of-fit tests were mainly used to calculate the “distance” between data and distribution and compare the “distance” to the threshold value [38]. Various fitness tests are available for copula functions, and there was little difference between the results of different GOF tests due to the limited number of samples that were considered in this study. The fundamental purpose of this study is to determine whether the copula function can be used to describe the distribution of compound events of rainstorm and typhoon surge in these study areas. Therefore, several commonly used evaluation criteria met the needs of this study for selecting the optimal copula functions, such as the K–S test (Equation (6)), RMSE (Equation (7)), and AIC (Equation (8)).
D = max { | F 0 ( x i , y i ) m i 1 n | , | F 0 ( x i , y i ) m i n | }   ( 1 i n )
where ( x i , y i ) ( i = 1 , 2 , , n ) is the observation sample, F 0 ( x i , y i ) is the joint distribution of sample estimates, m i is the number of observed samples that satisfy the conditions of x x i , y y i , n is the total number of observed samples.
R M S E = 1 n 1 n ( P e i P i ) 2
A I C = n ln ( 1 n m 1 n ( P e i P i ) 2 ) + 2 m
where P e i and P i are empirical frequency and theoretical frequency of the i-th compound sample, respectively, m is the number of the joint distribution function parameters, n is the number of samples.

3. Statistical Features of Historical Typical Hydrological Events in the Study Areas during the Period of 1960–2012
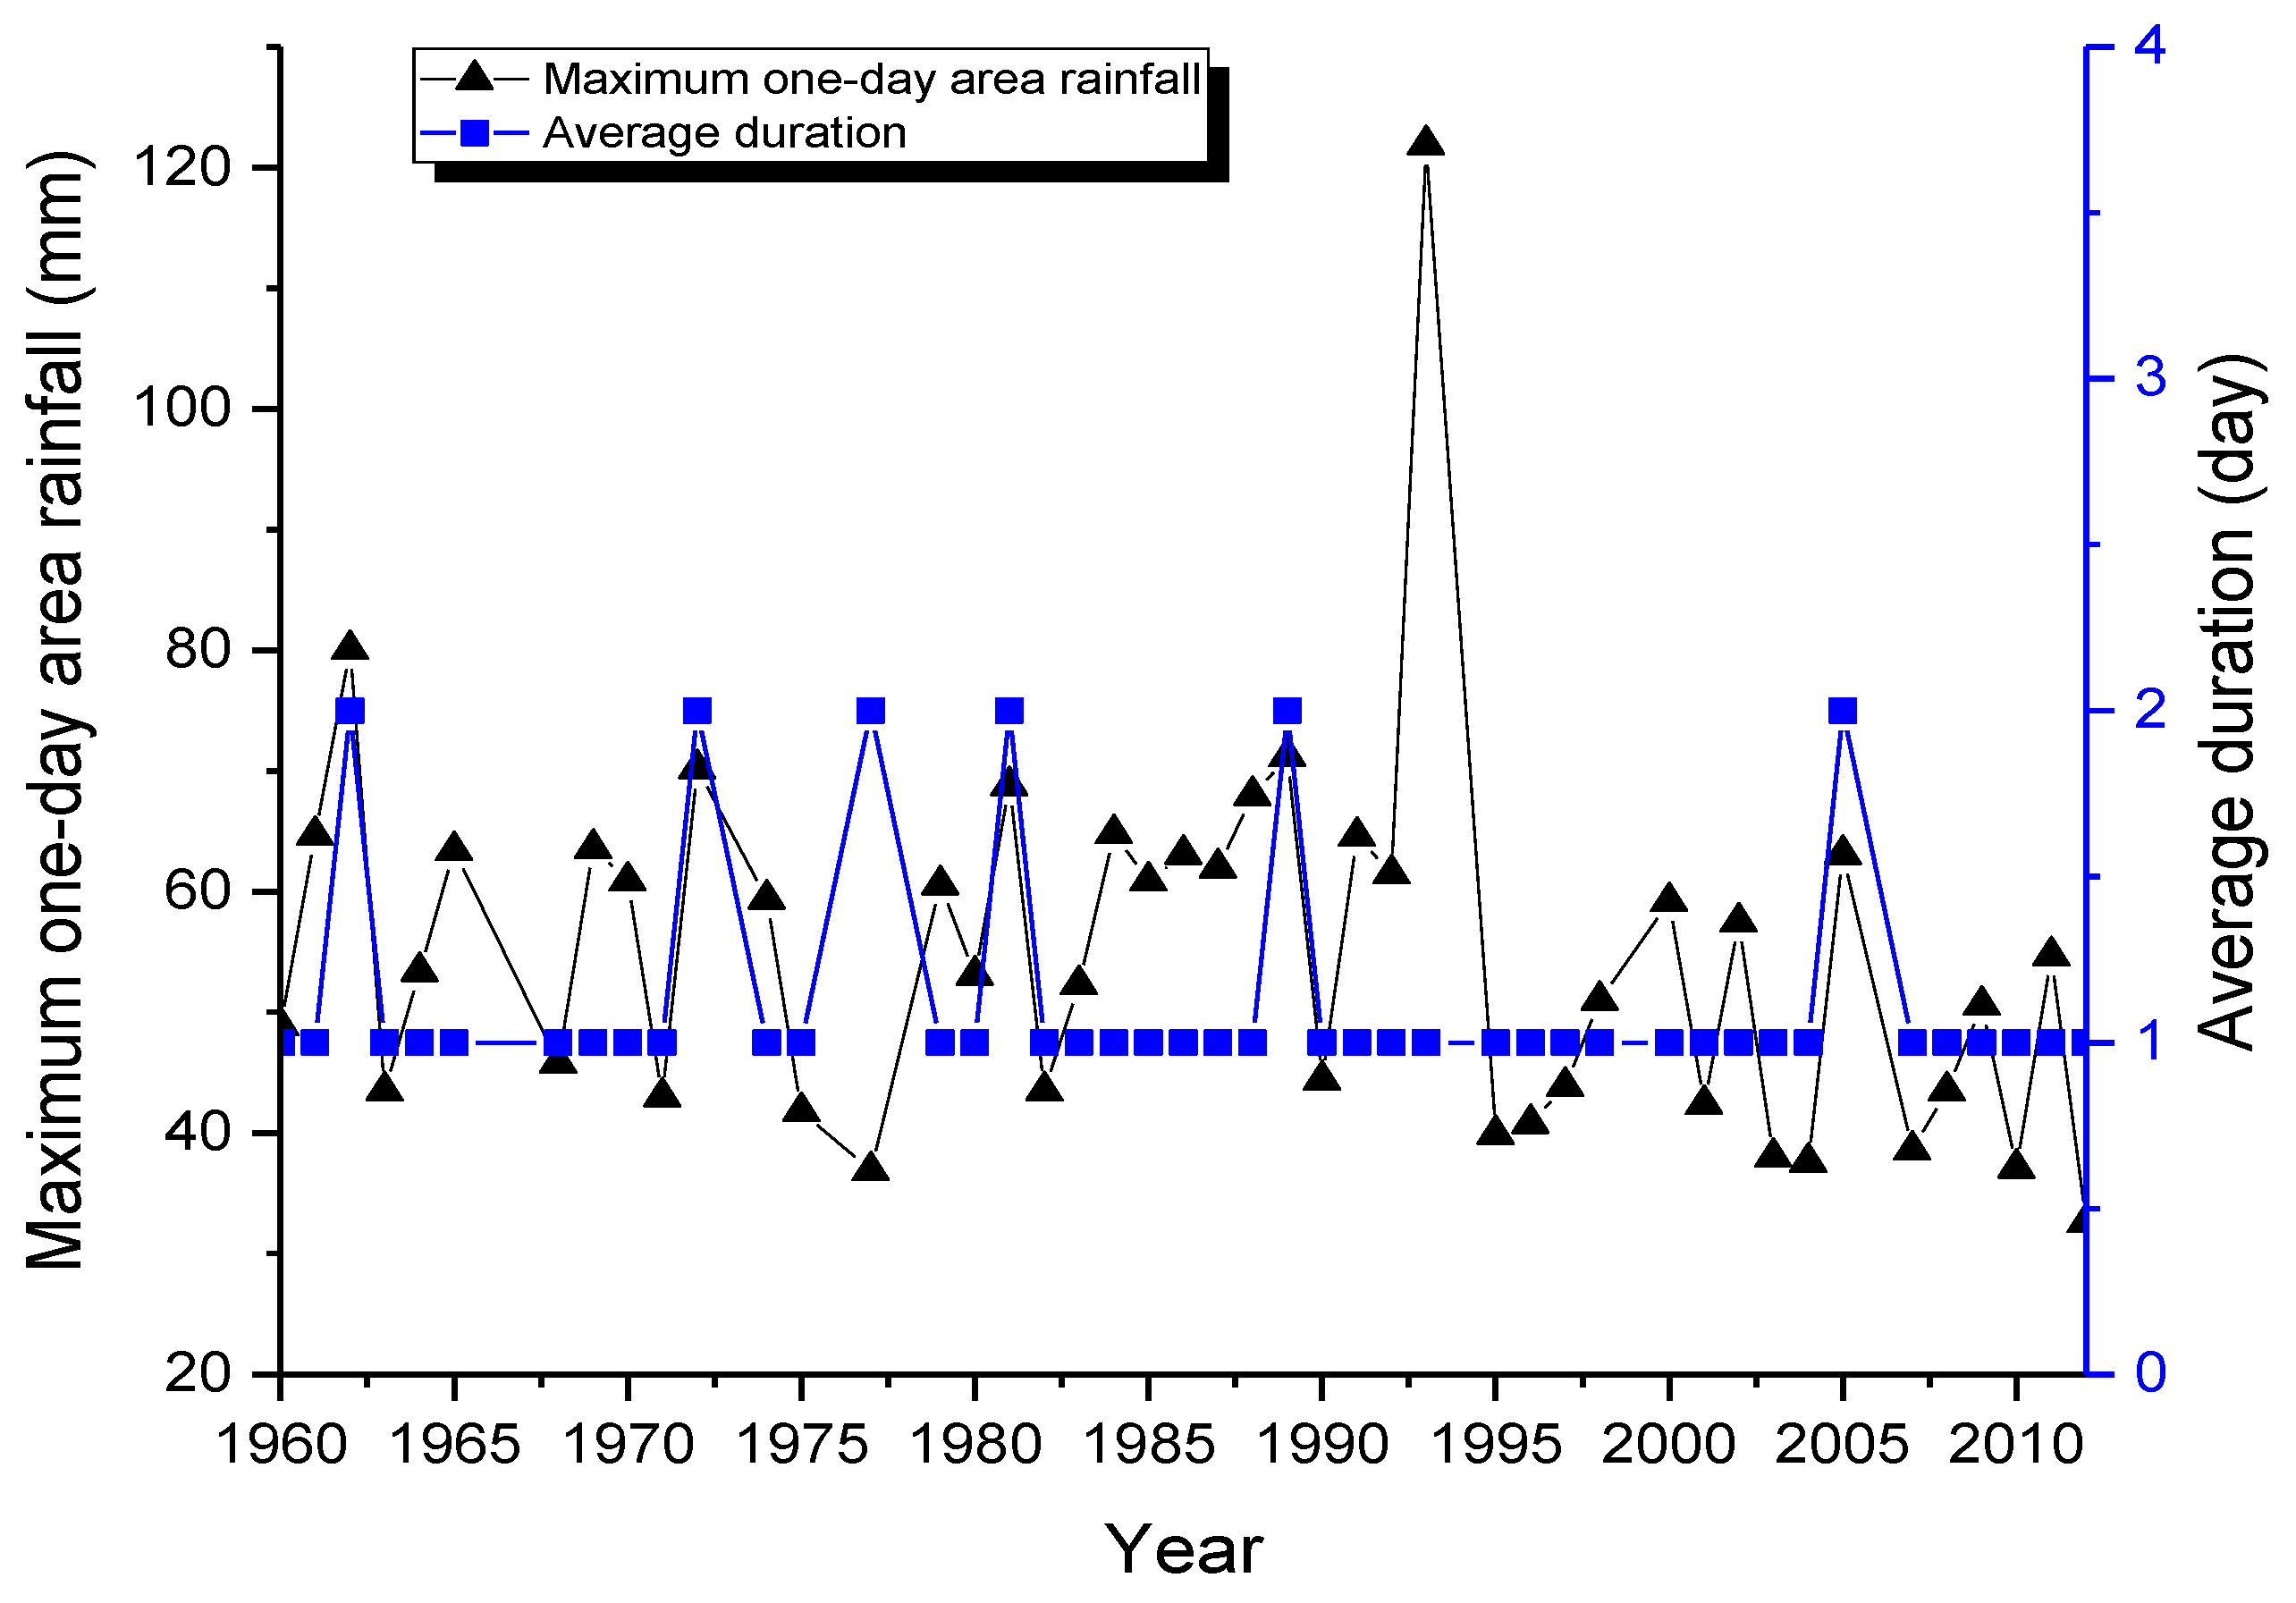
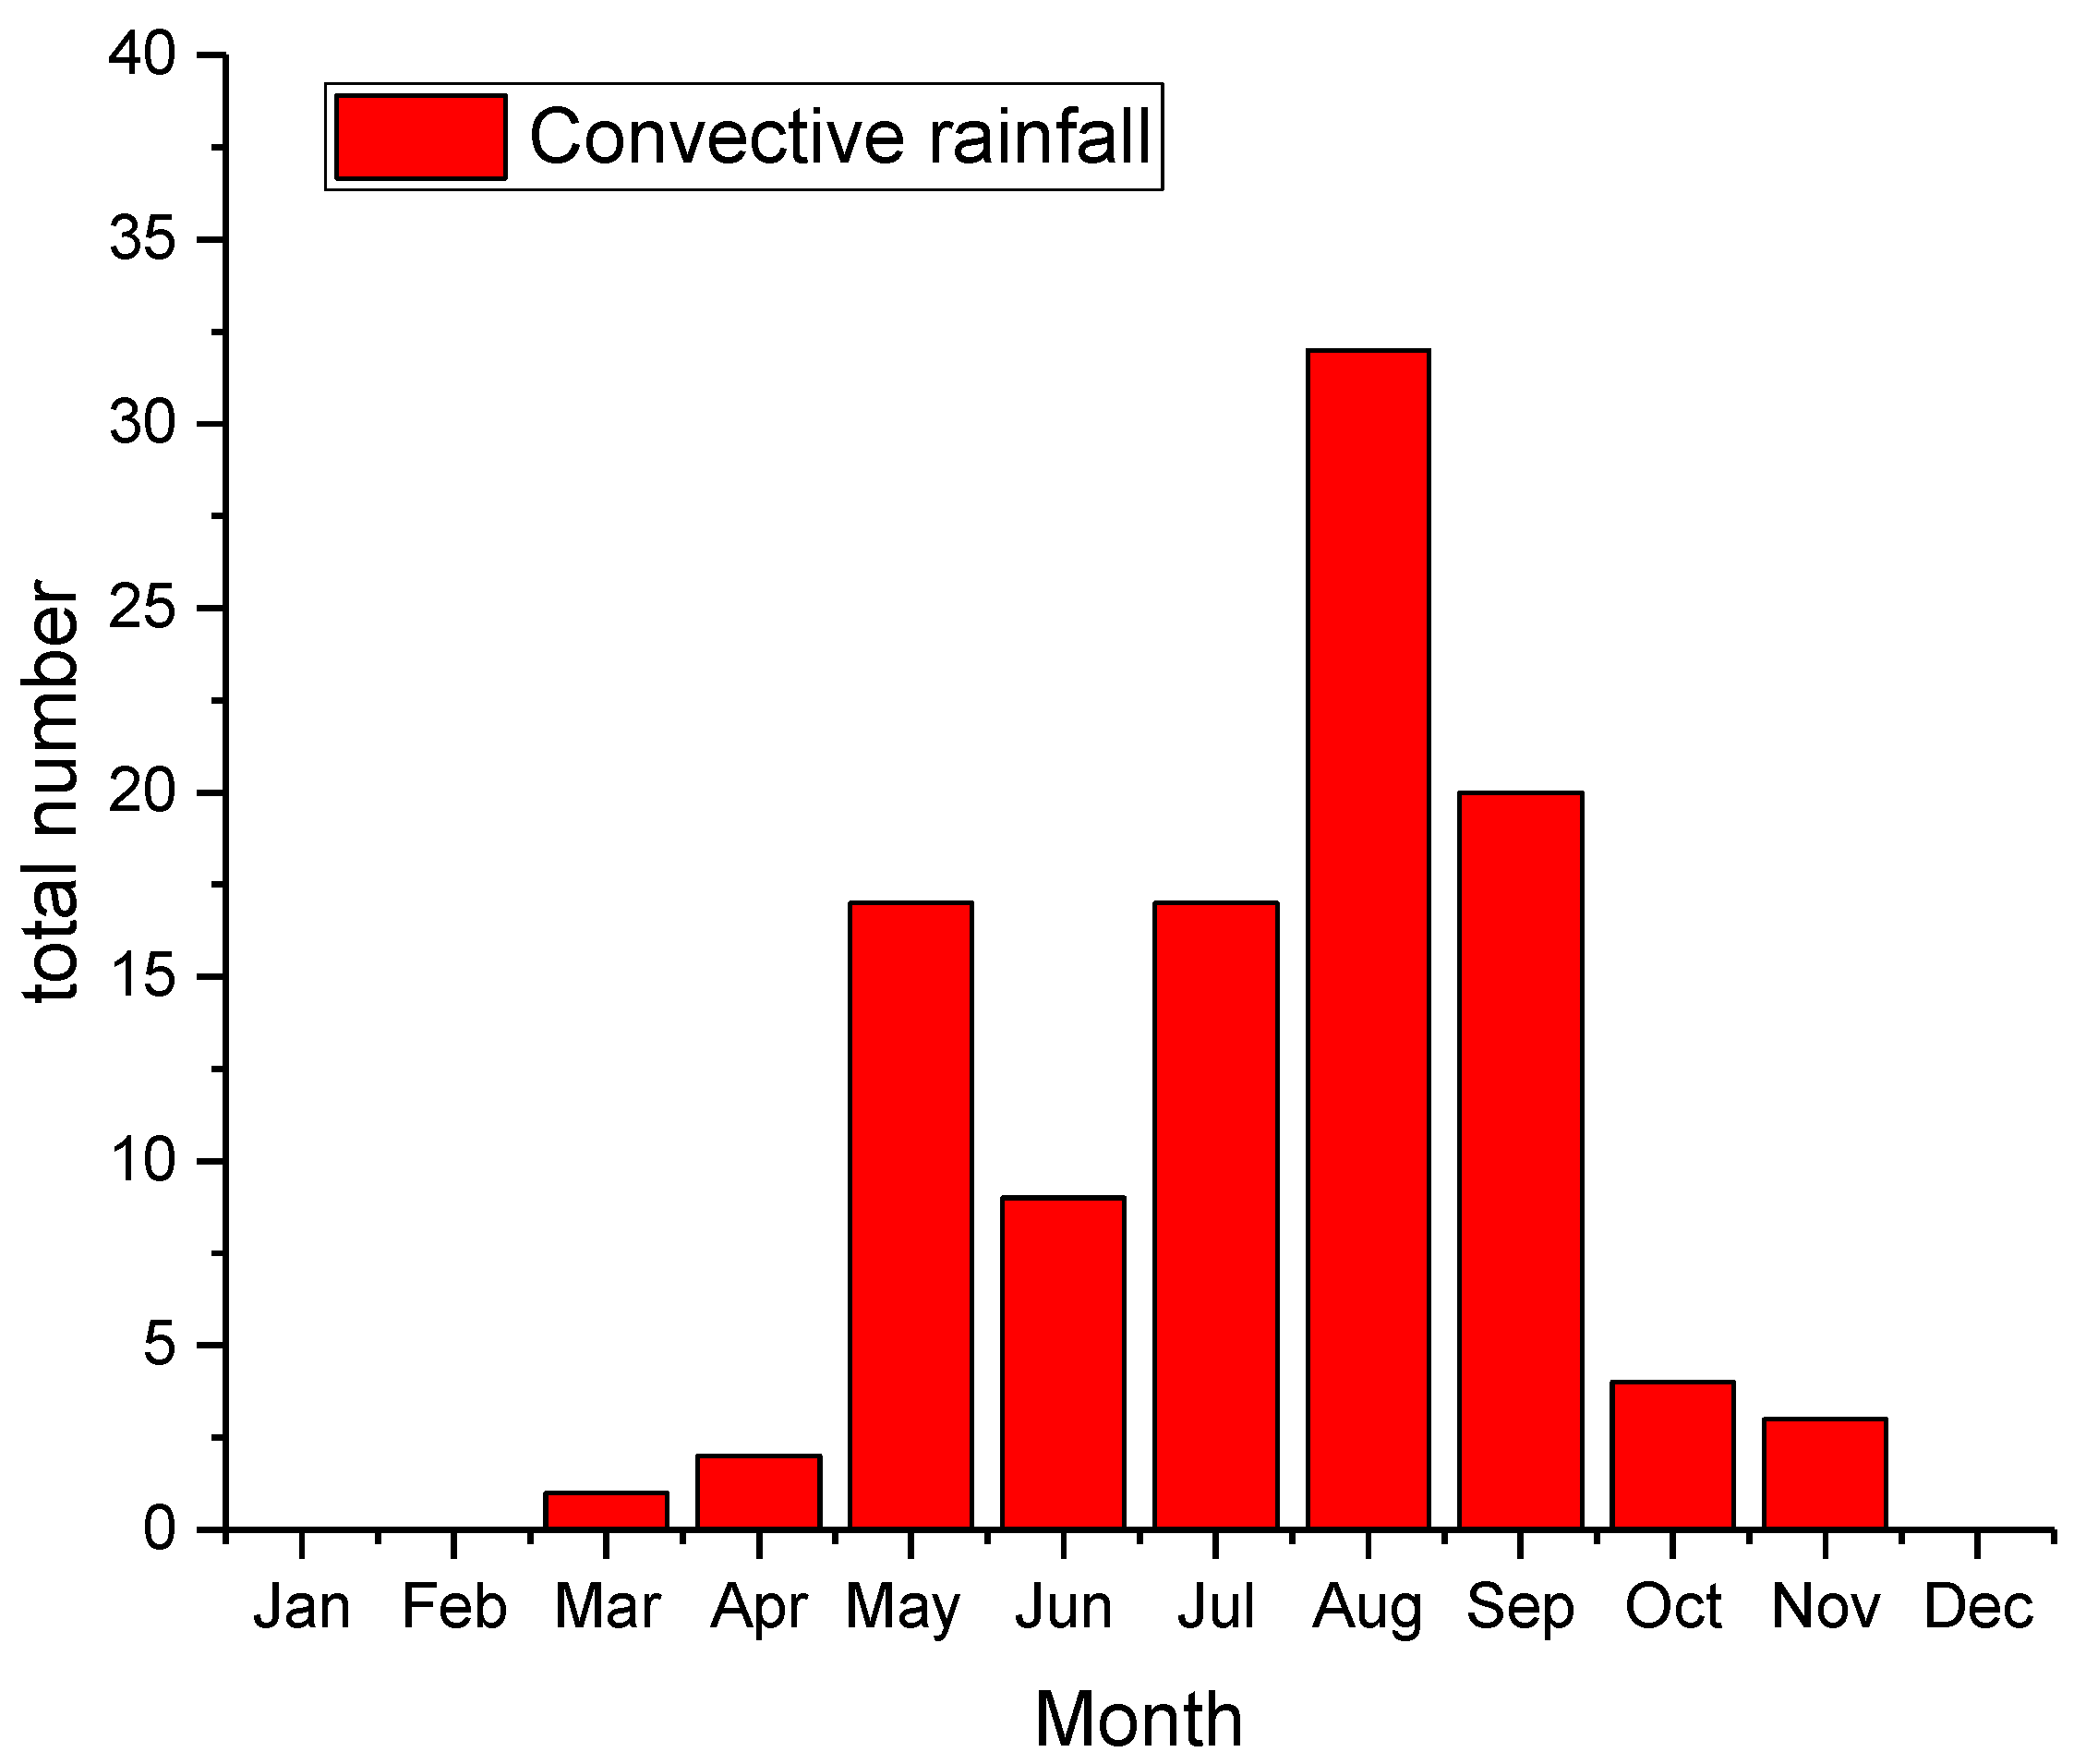
3.1. Rainstorms

The rainstorms in the coastal areas of Jiangsu Province mainly consist of three types: plum rain, heavy convective rainfall, and typhoon rain. The research regions are located in the lower-middle research area of the Yangtze River. Plum rain easily forms in late June and early July. Figure 2 shows a significantly positive correlation between precipitation level and duration of the plum rain season. With the annual plum rain statistical calendar from 1960 to 2012, it is shown that the season’s earliest plum rain started on 2 June (1972, 1995, 2000) and the season’s latest plum rain ended on 27 July (1987). The shortest plum rain only lasted 3 days in 1978, while the longest plum rain lasted 48 days in 1996. The average duration of the plum rain season was 24 days.
In addition to the rainy season of the Jiangsu coastal areas, convective weather systems, shear line weather regimes, and strong convective weather systems can cause heavy rainstorms. The heavy convective rainfall pattern is usually more intense with a shorter duration compared to plum rain. The average duration of the convective rainfall every year was 1–2 days for the study period (Figure 3). The average value of maximum 1-day area rainfall in the coastal areas of Jiangsu was 54.8 mm for the period of 1960–2012.
Monthly distribution of convective rainfall shows that it mainly concentrates in the flood season, which is between May and September. Convective rain is most likely to occur in August, after the plum rain season. Convective rainfall occurred in August 32 times during the study period (Figure 4).
Typhoons can also bring heavy rain to the coastal areas of Jiangsu, but the duration of typhoon rain is usually short due to the rapid movement of a typhoon. According to the schedule of when typhoons made landfall, there was a total of 22 occurrences of typhoon rain in the two districts (Figure 5). Due to the geographical specificity of the research areas, most typhoons landed in south-central Jiangsu coastal areas; therefore, the area rainfall of typhoon rain in the Lixiahe district was greater than in the Huaibei plain district, in most cases.
There are three types of rainstorms that occur at different times and are closely related to different meteorological conditions. Plum rain occurs in late June and early July, typhoon rain tends to occur in August and September of the typhoon period, and convective rainfall occurs when the earth’s surface is within a conditionally unstable or humid atmosphere that is hotter than the surrounding environment. Because of the different mechanisms of the three types of rainstorms, their durations are dissimilar. Plum rain has the longest duration—up to 20–30 days—nevertheless, the average daily rainfall caused by the typhoon is the highest (Table 2).

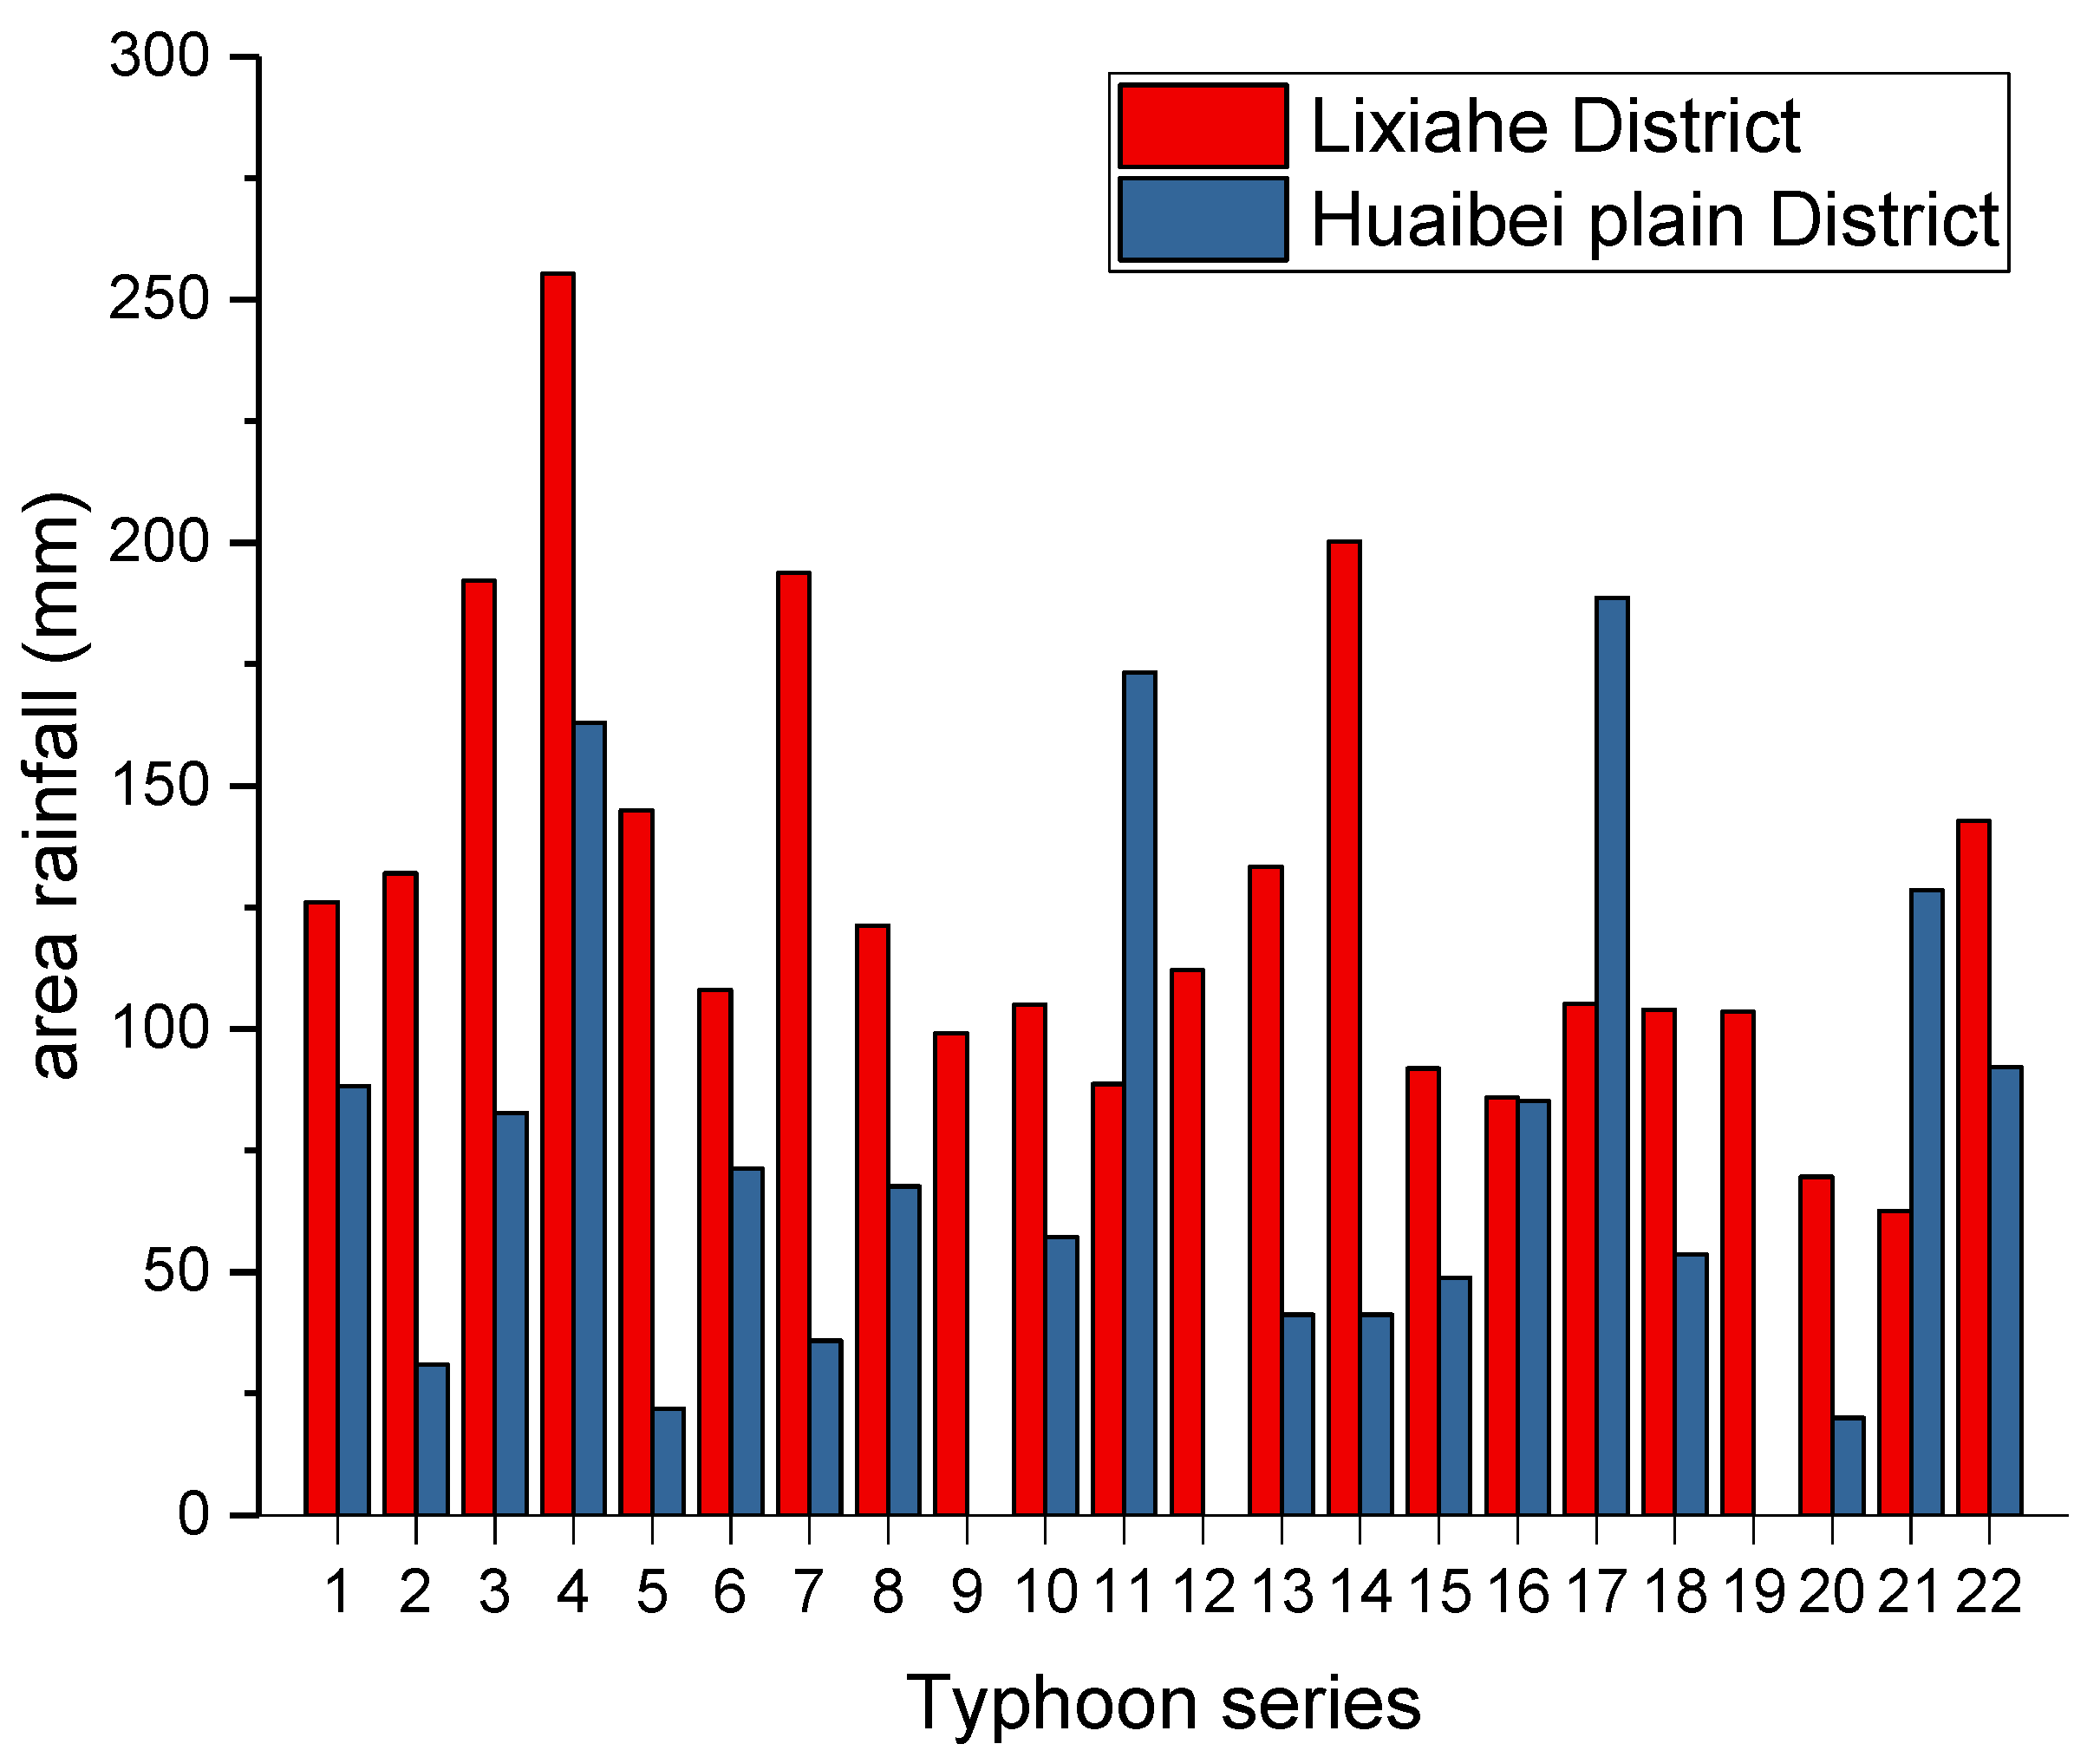
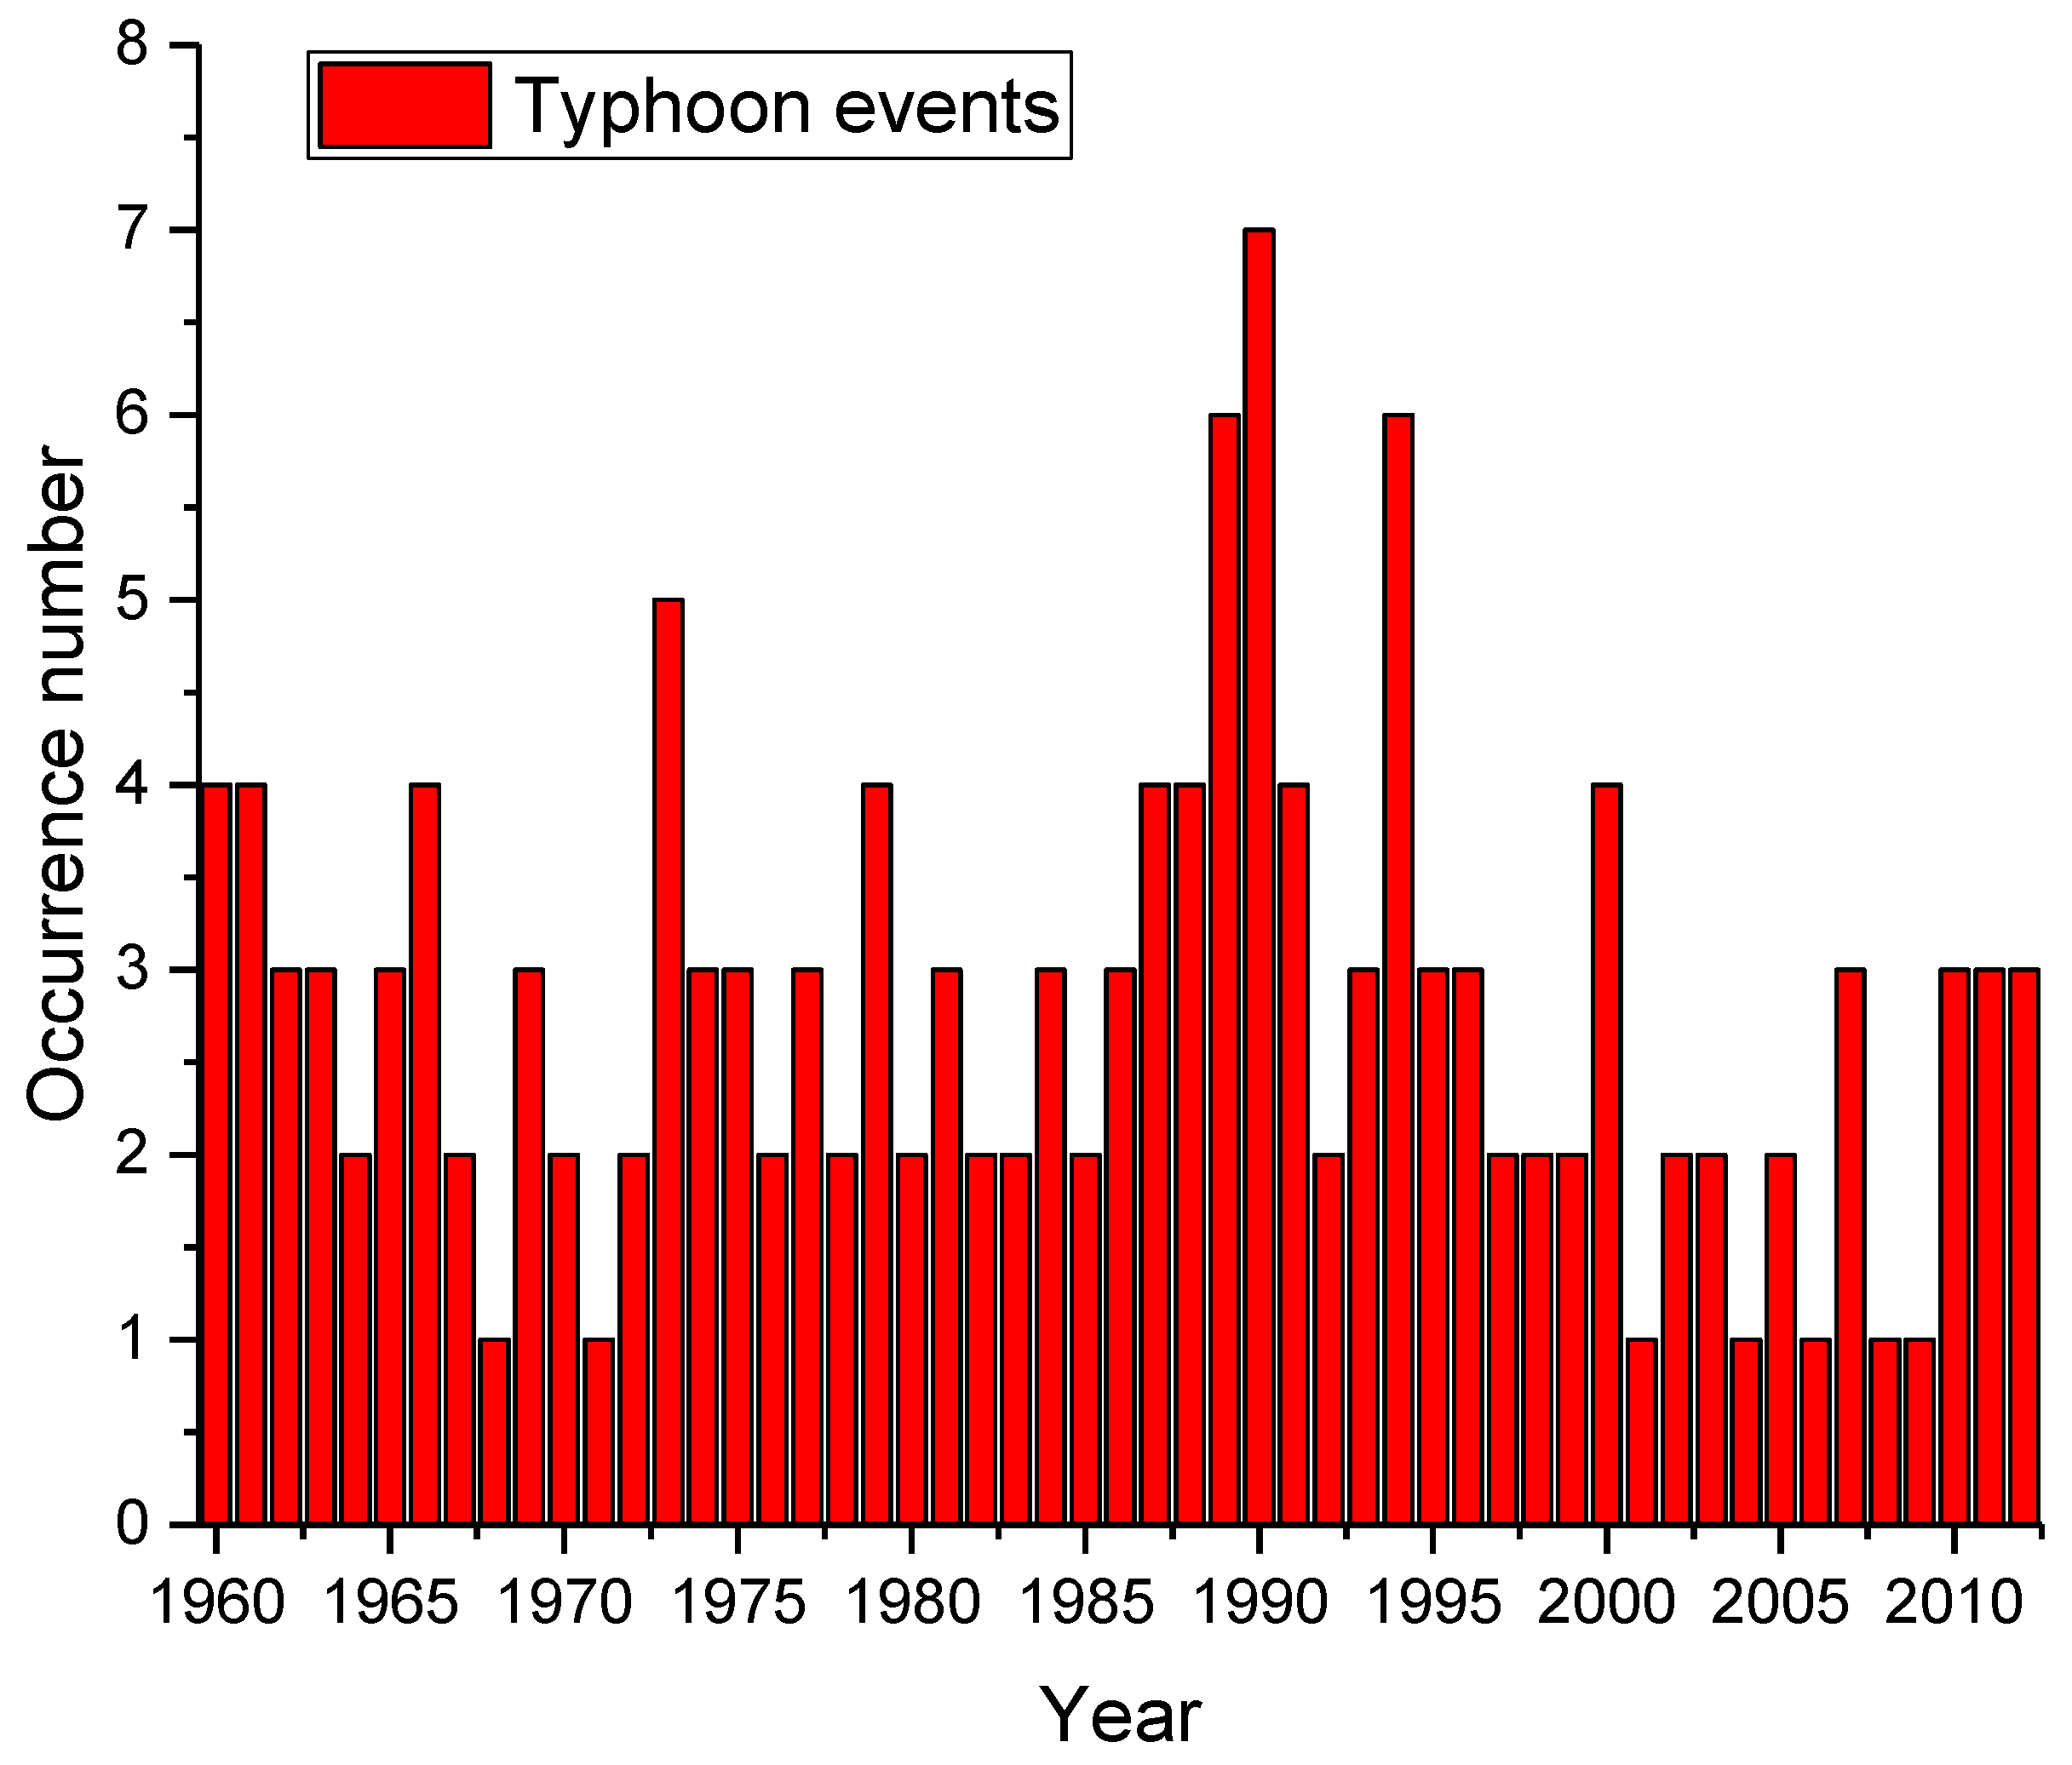
3.2. Typhoons and Typhoon Surges

The study areas are affected by typhoons frequently, about three times per year (Figure 6). The earliest typhoon hits Jiangsu in May, the latest hits in November. According to the Best Track Dataset of typhoons from 1949 to 2012 [25], there are mainly two paths of typhoons that occur in the study areas: (1) the typhoon that lands at the Yangtze River mouth, moving to the northwest; (2) the typhoon that arrives at 35 degrees north latitude of the Jiangsu coastline, then changes its path to the northeast, and lands at North Korea. The typhoon following the second path occurs the most in the coastal areas of Jiangsu, accounting for about 62%.
The coastal areas of Jiangsu are mainly controlled by two tidal wave systems: the East China Sea forward wave and the South Yellow Sea rotating wave. Observation of the tidal characteristics along the nearshore coast of the research areas reveals that the tides of the two tidal wave systems in the north and south basically intersect in the vicinity of Dongtai port. In order to distinguish the influence factors of tidal level change in these areas, we checked the typhoon track data and analyzed the tide levels of two stations. The results show that 148 typhoons affected the study areas: 88 were accompanied by rainfall in the Huaibei plain district, and 95 were accompanied by rainfall in the Lixiahe district. The minimum levels of typhoon surges at Yanwei station and Xinyang station were 32 cm and 31 cm, and the maximum typhoon surges at the two stations were 243 cm and 240 cm, respectively.

4. Results and Discussion

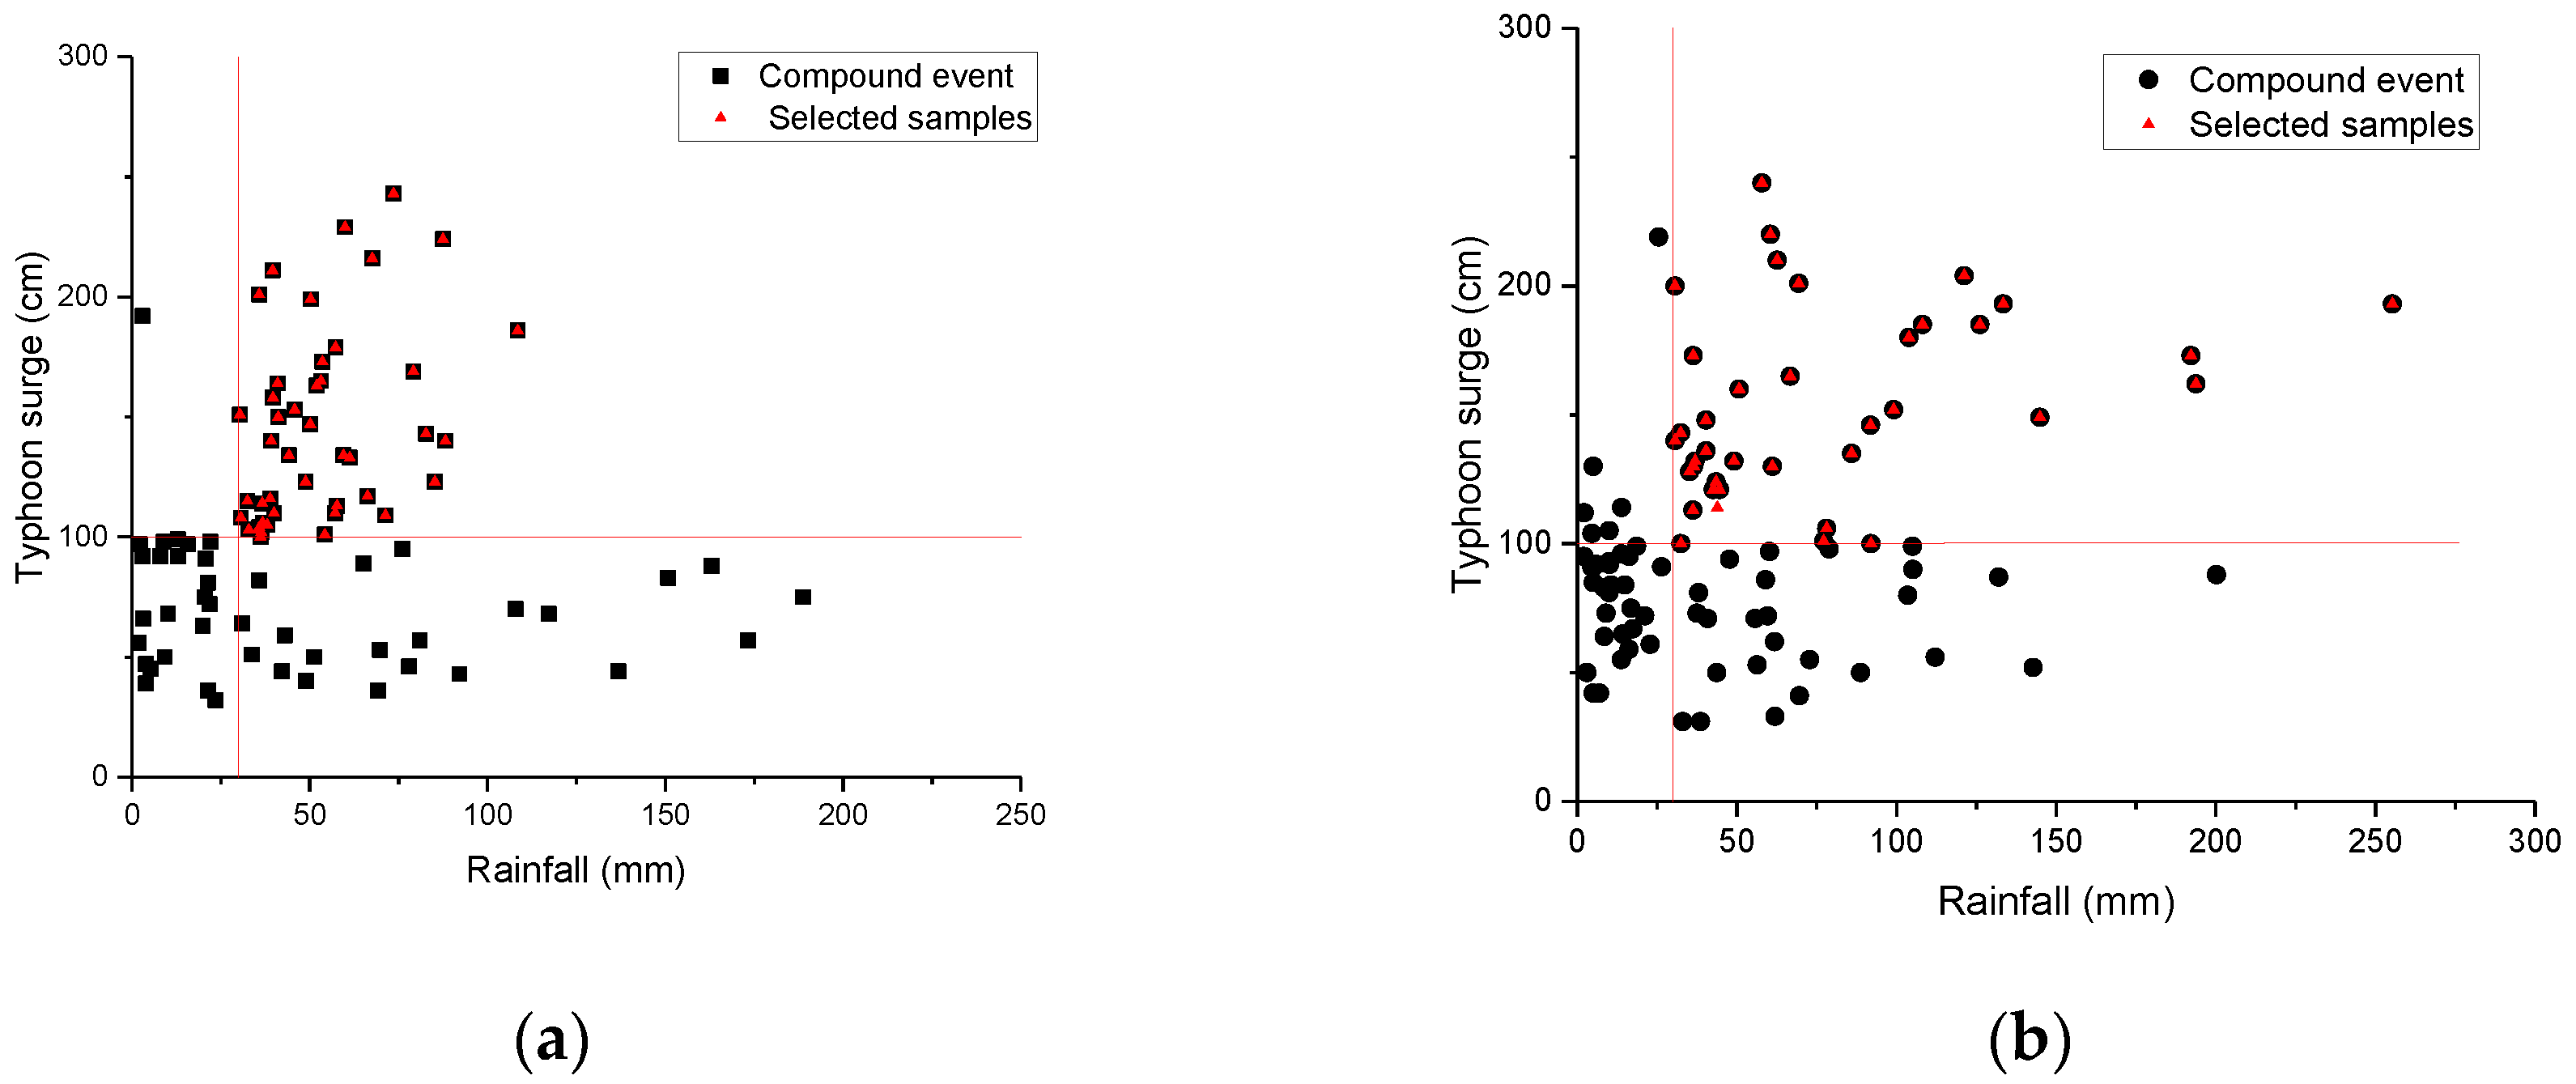
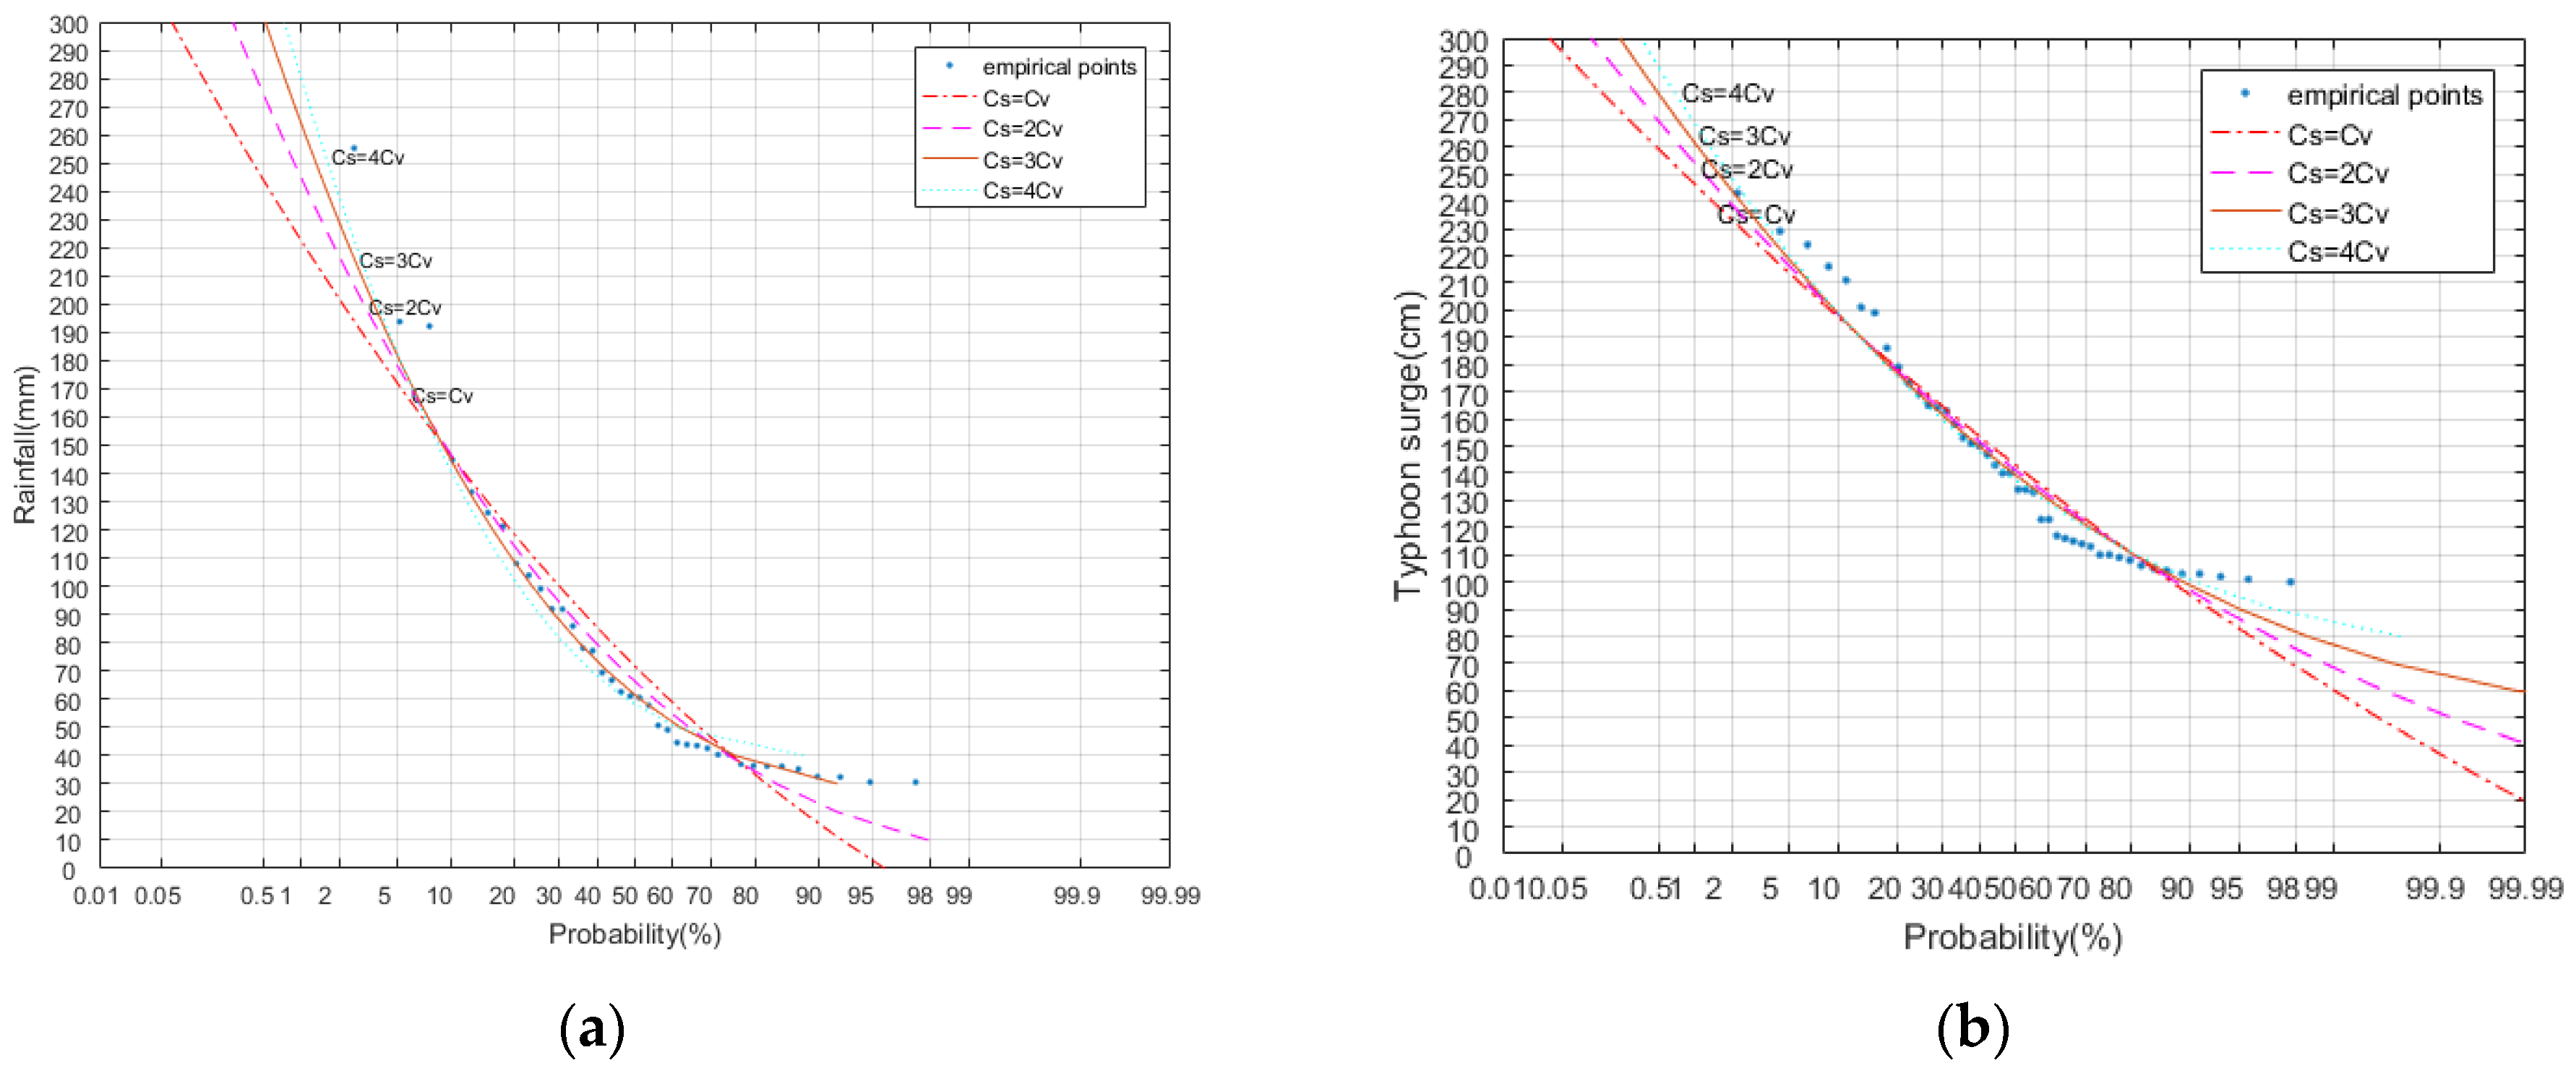
4.1. Marginal Distributions of Compound Events

According to the design standard of flood control projects along Jiangsu coastal cities, it is typical that when the typhoon surge is higher than 200 cm in the absence of rain, the city river discharge is affected. Daily average rainfall over 50 mm is treated as a rainstorm in China. However, when the rainstorm encounters a typhoon surge, the coastal areas are more prone to flooding. Based on the rainstorm features and typhoon surge features of these geographically distinctive areas, the criteria used to select the samples from the compound events were an area rainfall of a rainstorm greater than 30 mm and a typhoon surge greater than 100 cm. The results show that 44 of 88 compound events conformed to the sample criteria in the Huaibei plain district, and 38 of 95 compound events conformed to the sample criteria in the Lixiahe district during the study period (Figure 7). The rainstorm sample is recorded as x i , the typhoon surge sample is recorded as y i , and the real-number pair ( x i , y i ) is the i-th compound event that meets the sample criteria.
The P-III marginal distributions of rainstorms and typhoon surges with different Cs in the two research areas are shown in Figure 8 and Figure 9. The optimal parameters (Cv and Cs) of the P-III marginal distribution based on the joint samples ( x i , y i ) in the Huaibei plain district and the Lixiahe district are shown in Table 3.

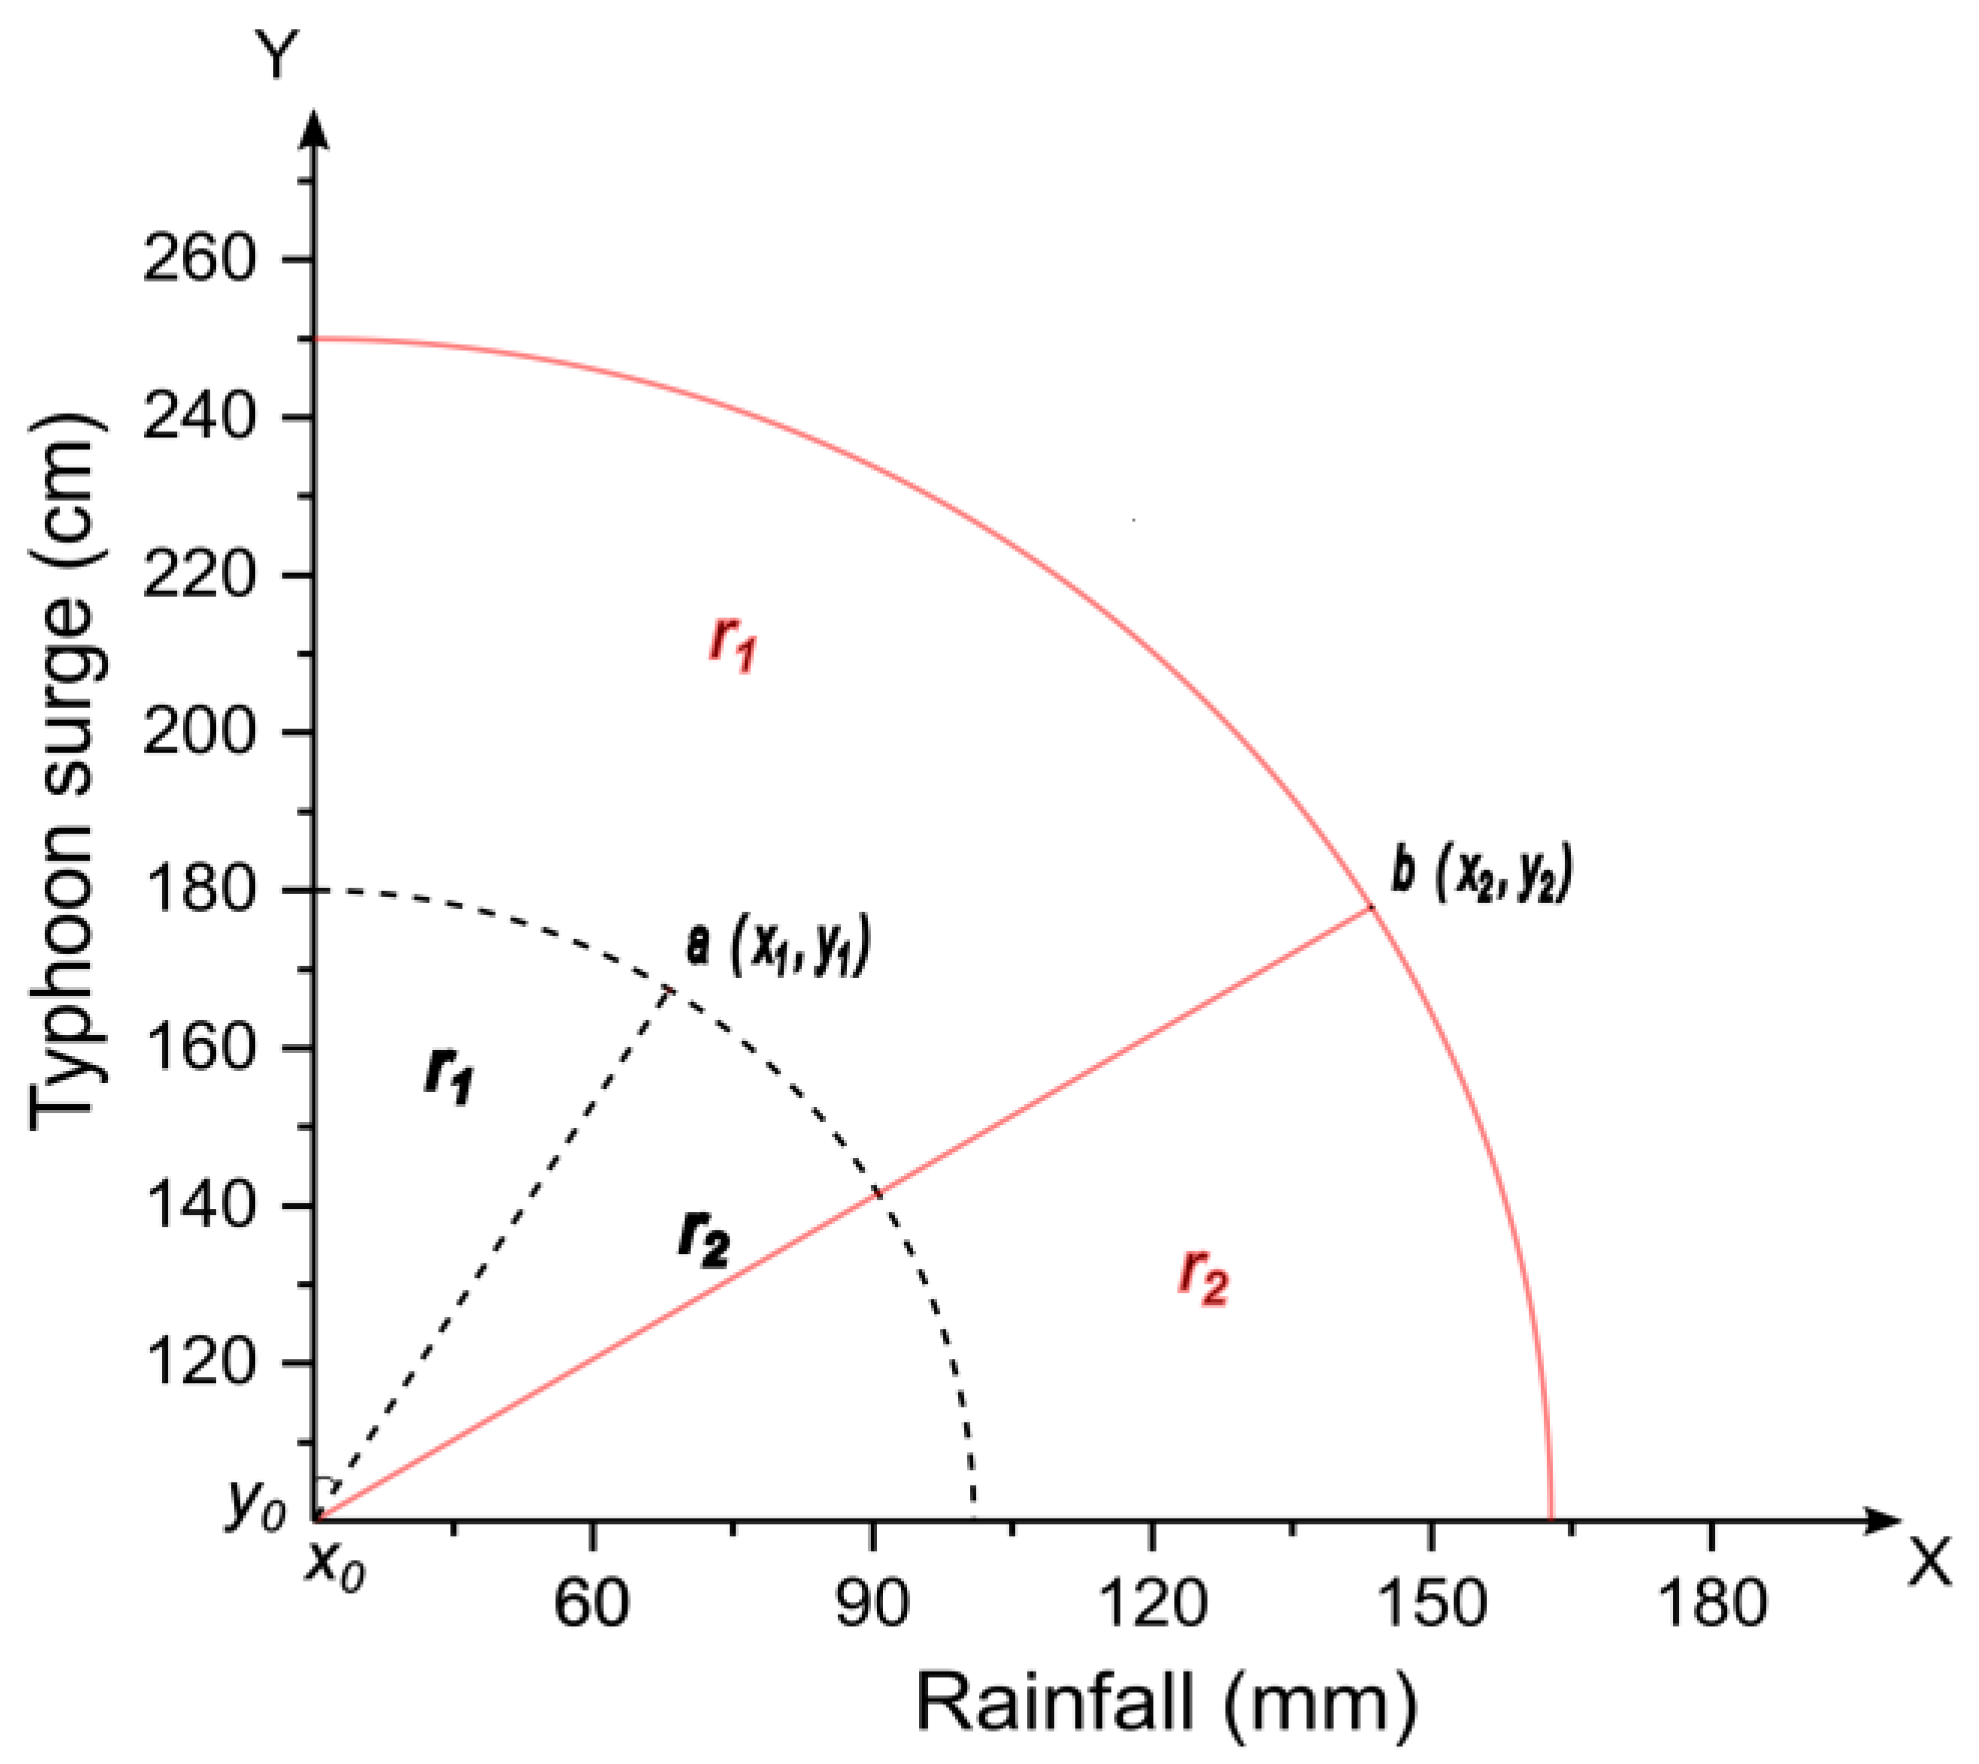
4.2. Determination of the Disaster Risk Model

Flood risk caused by compound events can be calculated as Risk = Severity × Frequency [39], where the severity of every compound event is determined by the severity of the rainstorm and typhoon surge. We hypothesized that rainstorms and typhoon surges have the same effect on the flood disaster. The distribution of the red selected sample in Figure 7 shows that the sample criteria are the origin of the risk evaluation model. This differs from the Euclidean distance between the compound event and the origin point as a measure of severity. We use the area of r 1 and r 2 in Figure 10 to describe the severity of the compound event. This can better distinguish the degree of influence of rainstorms and typhoon surges for the severity of compound events. The calculation formula of r 1 (rainstorm risk r 1 ) and r 2 (typhoon surge r 2 ) is as follows:
{ r 1 ( i ) = arctan ( x i x 0 y i y 0 ) 360 π ( ( x i x 0 ) 2 + ( y i y 0 ) 2 ) 2 r 2 ( i ) = π 4 ( ( x i x 0 ) 2 + ( y i y 0 ) 2 ) 2 r 1 ( i )
The frequency ( P ( i ) ) of the compound events are derived from the calculation results in Section 4.1 above. The disaster risk R i for this study is shown below:
R i = r 1 ( i ) P 1 ( i ) + r 2 ( i ) P 2 ( i )
where P 1 ( i ) is the frequency of rainstorm and P 2 ( i ) is the frequency of typhoon surge.
Due to the different extents of rainfall and typhoon, for a better comparative analysis, we used a linear normalization method to convert the risk into the range of [0,1]. The risk maps of rainstorm and typhoon surge in the Huaibei plain district and the Lixiahe district are shown in Figure 11. The results show that the risks of typhoon surge in the two research areas are greater than the rainstorm risks. The compound risks of rainstorm and typhoon surge are shown in Figure 12. The results show that the Huaibei plain district faces a higher average compound risk of rainstorm and typhoon surge than the Lixiahe district.

4.3. Selection of Copula Functions

The marginal distributions of two hazard contributing factors were calculated with the P-III method described in Section 4.1. Kendall’s tau is −0.43 and 0.75 in Huaibei plain and Lixiahe, respectively. The critical value of the K–S statistic in the Huaibei plain district and the Lixiahe district is 0.2120 and 0.2360, respectively, with a statistical significance level of 0.05. In this study, all the K–S values of the three copulas in the two areas conformed to the critical value. Based on the minimum value criterion of RMSE and AIC, the two values of the Frank and Gumbel copulas have little difference, but the Gumbel copula can only be used to describe the positive relationship of the compound events. Therefore, the Frank copula was selected to be the best-fitting copula in the Huaibei plain district. With the same criteria, the Gumbel copula is the best one for the Lixiahe district (the detailed parameters of the candidate copulas are shown in Table 4). The empirical probabilities and the theoretical probabilities (P-P) of the rainstorms and typhoon surges in the two areas are shown in Figure 13. It shows that the estimated cumulative probability is consistent with the empirical results.

4.4. Joint Probability Distribution of Compound Events and Their Return Period

Through the disaster risk model that is proposed in this study, we know that the compound risk is positively correlated with rainstorm and typhoon surge. Based on the marginal distributions of compound events and the parameters of the selected copula functions above, we constructed a joint probability distribution for compound events. The X-axis indicates the value of typhoon surge, the Y-axis indicates the value of area rainfall, and the Z-axis indicates the probability that the compound events do not happen. The results of the two copula functions are shown in Figure 14 as an intuitive visual. The joint probability of a 200 mm level rainstorm and 200 cm level typhoon surge is 10% in the Huaibei plain district, and the probability of 200 mm level rainstorm and 200 cm level typhoon surge is 24% in the Lixiahe district.
The return periods of the compound events in the two areas are plotted as contour lines in Figure 15, the intersection points of the curve with the X and Y axes are the surge value (typhoon surge: x i ) and rainfall value (rainfall: y i ) of the compound events, and the value of the curve is the return period of the compound event. For instance, the return period of compound events that are characterized by a 40 mm rainfall and a 112 cm typhoon surge is 1.1 years in the Huaibei plain district. We used the copula model to evaluate two historic floods (Dafeng flood on 19 August 1965, and Huaibei flood on 30 August 2000) in Jiangsu Province. The results are consistent with the historical assessment of the two floods.
The encounter probabilities of different levels of rainstorms and typhoon surges are listed in Table 5; the results show that a 50 cm level typhoon surge encounter with a 50 cm level rainstorm has a probability of 70% in the Huaibei plain district and a probability of 55% in the Lixiahe district, which means that the Huaibei plain district is more sensitive to rainstorms in the case of a 50 cm typhoon surge.
The results of the study confirm that the copula functions are feasible for coupling the risk of compound events in the east coastal areas of Jiangsu Province. Rainstorm and typhoon surge have a positive correlation with disaster risk. We used a conceptual model to evaluate the rainstorm risk, typhoon surge risk, and compound event risk in the two regions. However, the impacts of rainstorms and typhoon surges on compound risk are not consistent, so future research will focus on the impacts of rainstorms and surges on different degrees of risk. The risk maps show that the Huaibei plain district faces rainstorm risk, typhoon surge risk, and compound risk that are higher than these risks in the Lixiahe district due to the special geographical features of the Huaibei plain region. The joint probability distributions of the compound events show that high-risk compound events have a low joint co-occurrence probability, while low-risk compound events have a high joint co-occurrence probability in both areas. The Lixiahe district is more prone to heavy rainstorms than the Huaibei plain. On the other side, the encounter probability of different levels of rainstorms and typhoon surges shows that Huaibei plain is more easily faced with a high-level typhoon surge than the Lixiahe district. The different return periods for different levels of compound events mean that the Huaibei plain is more vulnerable to flooding caused by typhoon surges than southern Jiangsu, and we should use different methods to control the flood risk in these two areas.

5. Conclusions

The flood hazards in coastal areas are mainly caused by rainstorms and typhoons, and any one of these extreme weather events may lead to massive damages. Rainstorms increase the amount of water in floods, while typhoon surges affect flood discharge. It is essential to analyze the frequency of compound events of rainstorms and typhoon surges in the coastal areas, and it is also important to assess the impact of compound events on flood risk. The joint probability distribution of the compound events can be used to deduce the characteristics of the flood hazards and to predict the flood risk in the future, which is very significant for the future development of flood control strategies. In order to study the risk of floods caused by the compound events of rainstorm and typhoon surge in Jiangsu Province, this study proposes a conceptual risk model for the floods caused by rainstorm and typhoon surge, which was successfully used to evaluate the rainstorm risk, typhoon surge risk, and compound event risk in the Huaibei plain district and the Lixiahe district. We carried out an encounter joint probability analysis of rainstorms and typhoon surges in the two research areas using copula functions. The main conclusions of this paper are as follows:
(1) A conceptual disaster risk model for evaluating the risk of compound events of rainstorm and typhoon surge is proposed in the study, and it proved to be reasonable. We used the model to calculate the rainstorm risk, typhoon surge risk, and compound event risk. The results show that the risk of typhoon surge in the Huaibei plain district and the Lixiahe district is greater than the rainstorm risk, mainly because the coastal areas of Jiangsu are plain terrain and are prone to floods caused by typhoon surges.
(2) The area rainfall of rainstorms and the water level deviation of typhoon surge were used as the risk factors of compound events; these factors were used as inputs to the copula functions to establish the joint probability distributions. Based on the optimal parameters and evaluation criteria, the Frank copula proved to be the best-fitting joint distribution function for the Huaibei plain district, and the Gumbel copula is the most suitable function for the Lixiahe district.
(3) The joint probability distribution of compound events shows that the low risk of low-level rainfall and low-level surge compound events have a high frequency, while the high risk of high-level rainfall and high-level surge compound events have a low frequency in the two regions. For the same level of typhoon surge, lower intensity rainstorms happen more frequently in the Huaibei plain district than in the Lixiahe district. Under the same rainfall conditions, the Huaibei plain district is more likely to suffer from high-level typhoon surges.
(4) The co-occurrence return period of high-level rainstorms and high-level typhoon surges is longer than low-level compound events. The results of this study are consistent with the disaster grade after analyzing two typical flood disasters in the research areas. It turns out that the copula functions that were used to analyze the joint probability distribution of encounter risk between rainstorms and typhoon surges in the Jiangsu coastal areas are feasible. Furthermore, we should pay more attention to floods caused by the low-level compound events.

Author Contributions

This research was carried out in collaboration with all authors. The study was designed and the data were prepared by C.X. The analysis method was provided by P.A., C.X., and D.Y. The research area map was provided by D.Y. The manuscript was prepared by D.Y. and revised by P.A. and C.X.

Funding

This research is supported by ‘the Fundamental Research Funds for the Central Universities’ (Grant No. 2017B616X14) and ‘the National Natural Science Foundation of China’ (Grant No. 51420105014).

Acknowledgments

We would like to give our greatest gratitude to the academic editors and two anonymous reviewers for their helpful and constructive suggestions used to improve the quality of the manuscript, the help of language editing offered by Tim Michigan is also greatly appreciated.

Conflicts of Interest

The authors declare no conflict of interest.

References

  1. Tseng, C.M.; Jan, C.D.; Wang, J.S.; Wang, C.M. Application of artificial neural networks in typhoon surge forecasting. Ocean Eng. 2007, 34, 1757–1768. [Google Scholar] [CrossRef]
  2. Hallegatte, S.; Green, C.; Nicholls, R.J.; Corfeemorlot, J. Future flood losses in major coastal cities. Nat. Clim. Chang. 2013, 3, 802–806. [Google Scholar] [CrossRef]
  3. Adger, W.N.; Hughes, T.P.; Folke, C.; Carpenter, S.R.; Rockström, J. Social-Ecological Resilience to Coastal Disasters. Science 2005, 309, 1036–1039. [Google Scholar] [CrossRef] [PubMed] [Green Version]
  4. Wu, Y.; Zhong, P.A.; Zhang, Y.; Xu, B.; Ma, B.; Yan, K. Integrated flood risk assessment and zonation method: A case study in Huaihe River basin, China. Nat. Hazards 2015, 78, 635–651. [Google Scholar] [CrossRef]
  5. Wahl, T.; Mudersbach, C.; Jensen, J. Assessing the hydrodynamic boundary conditions for risk analyses in coastal areas: A stochastic storm surge model. Nat. Hazards Earth Syst. Sci. 2011, 11, 2925–2939. [Google Scholar] [CrossRef] [Green Version]
  6. Wang, J.; Gao, W.; Xu, S.; Yu, L. Evaluation of the combined risk of sea level rise, land subsidence, and storm surges on the coastal areas of Shanghai, China. Clim. Chang. 2012, 115, 537–558. [Google Scholar] [CrossRef]
  7. Qiang, Z.; Wu, L.G.; Liu, Q.F. Tropical cyclone damages in China 1983–2006. Am. Meteorol. Soc. 2009, 90, 489–495. [Google Scholar]
  8. Denny, J.L.; Yevjevich, V. Probability and Statistics in Hydrology. J. Am. Stat. Assoc. 1972, 68, 755. [Google Scholar] [CrossRef]
  9. Bras, R.L.; Rodríguez-Iturbe, I. Random Functions and Hydrology; Addison-Wesley: New York, NY, USA, 1984. [Google Scholar]
  10. Chebana, F.; Ouarda, T.B.M.J. Multivariate quantiles in hydrological frequency analysis. Environmetrics 2011, 22, 63–78. [Google Scholar] [CrossRef] [Green Version]
  11. Salvadori, G.; Durante, F.; Tomasicchio, G.R.; D’Alessandro, F. Practical guidelines for the multivariate assessment of the structural risk in coastal and off-shore engineering. Coast. Eng. 2015, 95, 77–83. [Google Scholar] [CrossRef]
  12. Sklar, M. Fonctions de Répartition À N Dimensions Et Leurs Marges; Publications de Institute de Statistique de l’Université de Paris: Paris, France, 1959; Volume 8, pp. 229–231. [Google Scholar]
  13. Sklar, A. Random Variables, Distribution Functions, and Copulas: A Personal Look Backward and Forward. Lect. Notes Monogr. Ser. 1996, 28, 1–14. [Google Scholar]
  14. Nelsen, B. An Introduction to Copulas; Springer: New York, NY, USA, 2006; p. 315. [Google Scholar]
  15. Zhao, P.; Lü, H.; Fu, G.; Zhu, Y.; Su, J.; Wang, J. Uncertainty of Hydrological Drought Characteristics with Copula Functions and Probability Distributions: A Case Study of Weihe River, China. Water 2017, 9, 334. [Google Scholar] [CrossRef]
  16. Hu, S.Y.; Wang, Z.Z.; Wang, Y.T.; Wu, H.Y.; Jin, J.L.; Feng, X.C.; Liang, C. Encounter probability analysis of typhoon and plum rain in the Taihu Lake Basin. Sci. China Technol. Sci. 2010, 53, 3331–3340. [Google Scholar] [CrossRef]
  17. Jenqtzong, S.; Wang, H.Y.; Changtai, T. Copula-based depth-duration-frequency analysis of typhoons in Taiwan. Hydrol. Res. 2010, 41, 414–423. [Google Scholar]
  18. Tao, S.; Dong, S.; Wang, N.; Soares, C.G. Estimating storm surge intensity with Poisson bivariate maximum entropy distributions based on copulas. Nat. Hazards 2013, 68, 791–807. [Google Scholar] [CrossRef]
  19. Wahl, T.; Jain, S.; Bender, J.; Meyers, S.; Luther, M. Increasing Risk of Compound Flooding from Storm Surge and Rainfall for Major US Coastal Cities. In Proceedings of the EGU General Assembly Conference, Vienna, Austria, 17–22 April 2016. [Google Scholar]
  20. Kwon, T.; Yoon, S. Analysis of extreme wind speed and precipitation using copula. In Proceedings of the EGU General Assembly Conference, Vienna, Austria, 23–28 April 2017. [Google Scholar]
  21. Dong, S.; Jiao, C.S.; Tao, S.S. Joint return probability analysis of wind speed and rainfall intensity in typhoon-affected sea area. Nat. Hazards 2017, 86, 1193–1205. [Google Scholar] [CrossRef]
  22. Woodruff, J.D.; Irish, J.L.; Camargo, S.J. Coastal flooding by tropical cyclones and sea-level rise. Nature 2013, 504, 44–52. [Google Scholar] [CrossRef] [PubMed]
  23. Buchanan, M.K.; Oppenheimer, M.; Kopp, R.E. Amplification of flood frequencies with local sea level rise and emerging flood regimes. Environ. Res. Lett. 2017, 12, 64009. [Google Scholar] [CrossRef] [Green Version]
  24. Wu, Y.; Zhong, P.A.; Xu, B.; Zhu, F.; Ma, B. Changing of flood risk due to climate and development in Huaihe River basin, China. Stoch. Environ. Res. Risk Assess. 2017, 31, 935–948. [Google Scholar] [CrossRef]
  25. Ying, M.; Zhang, W.; Yu, H.; Lu, X.; Feng, J.; Fan, Y.; Zhu, Y.; Chen, D. An Overview of the China Meteorological Administration Tropical Cyclone Database. J. Atmos. Ocean. Technol. 2014, 31, 287–301. [Google Scholar] [CrossRef]
  26. Pugh, D.T. Tides, Surges and Mean Sea-Level; John Wiley & Sons, Inc.: New York, NY, USA, 1987; pp. 53–56. [Google Scholar]
  27. Srikanthan, R.; Mcmahon, T.A. Log Pearson III distribution—An empirically-derived plotting position. J. Hydrol. 1981, 52, 161–163. [Google Scholar] [CrossRef]
  28. Singh, V.P. Entropy-Based Parameter Estimation in Hydrology; Kluwer Academic: Dordrecht, The Netherlands, 1998. [Google Scholar]
  29. Liu, D.; Guo, S.; Lian, Y.; Xiong, L.; Chen, X. Climate-informed low-flow frequency analysis using nonstationary modelling. Hydrol. Process. 2015, 29, 2112–2124. [Google Scholar] [CrossRef]
  30. Li, J.; Chen, Y.; Pan, S.; Pan, Y.; Fang, J.; Sowa, D.M.A. Estimation of mean and extreme waves in the East China Seas. Appl. Ocean Res. 2016, 56, 35–47. [Google Scholar] [CrossRef]
  31. Sadegh, M.; Ragno, E.; Aghakouchak, A. Multivariate Copula Analysis Toolbox (MvCAT): Describing dependence and underlying uncertainty using a Bayesian framework. Water Resour. Res. 2017. [Google Scholar] [CrossRef]
  32. Fasano, G.; Franceschini, A. A multidimensional version of the Kolmogorov–Smirnov test. Mon. Not. R. Astron. Soc. 1987, 225, 9–20. [Google Scholar] [CrossRef]
  33. Stephens, M.A. Anderson–Darling Test for Goodness of Fit; John Wiley & Sons, Inc.: New York, NY, USA, 2005. [Google Scholar]
  34. Hafner, C.M.; Manner, H. Dynamic stochastic copula models: Estimation, inference and applications. J. Appl. Econom. 2012, 27, 269–295. [Google Scholar] [CrossRef]
  35. Genest, C.; Quessy, J.F.; Rémillard, B. Asymptotic Local Efficiency of Cramér-Von Mises Tests for Multivariate Independence. Ann. Stat. 2007, 35, 166–191. [Google Scholar] [CrossRef]
  36. Omelka, M.; Gijbels, I.; Veraverbeke, N. Improved Kernel Estimation of Copulas: Weak Convergence and Goodness-of-Fit Testing. Ann. Stat. 2009, 37, 3023–3058. [Google Scholar] [CrossRef]
  37. Genest, C.; Rivest, L.-P. Statistical Inference Procedures for Bivariate Archimedean Copulas. Publ. Am. Stat. Assoc. 1993, 88, 1034–1043. [Google Scholar] [CrossRef]
  38. Fermanian, J.D. Goodness-of-Fit Tests for Copulas; Academic Press, Inc.: New York, NY, USA, 2005; pp. 119–152. [Google Scholar]
  39. Zheng, F.; Leonard, M.; Westra, S. Application of the design variable method to estimate coastal flood risk. J. Flood Risk Manag. 2017, 10, 522–534. [Google Scholar] [CrossRef]
Figure 1. Location of the research areas.
Sustainability 10 02232 g001
Figure 2. Plum rain in the coastal areas of Jiangsu Province.
Sustainability 10 02232 g002
Figure 3. Heavy convective rainfall in the coastal areas of Jiangsu Province.
Sustainability 10 02232 g003
Figure 4. The total numbers for monthly convective rainfall in the coastal areas of Jiangsu from 1960 to 2012.
Sustainability 10 02232 g004
Figure 5. The typhoon rain series according to the order of occurrence over time.
Sustainability 10 02232 g005
Figure 6. The number of typhoons landing on the coastal areas of Jiangsu every year.
Sustainability 10 02232 g006
Figure 7. The distribution of the compound events in the research areas: (a) Huaibei plain district; (b) Lixiahe district.
Sustainability 10 02232 g007
Figure 8. The marginal distributions of rainstorms and typhoon surges in the Huaibei plain district: (a) the probability curve of rainstorms during the typhoon period; (b) the probability curve of typhoon surges at the Yanwei tidal station.
Sustainability 10 02232 g008
Figure 9. The marginal distributions of rainstorms and typhoon surges in the Lixiahe district: (a) the probability curve of rainstorms during typhoon period; (b) the probability curve of typhoon surges at the Xinyang tidal station.
Sustainability 10 02232 g009
Figure 10. The damage evaluation model of compound events.
Sustainability 10 02232 g010
Figure 11. The risk maps of rainstorm and typhoon surge in the two research areas: (a) rainstorm risk in the Huaibei plain district; (b) typhoon surge risk in the Huaibei plain district; (c) rainstorm risk in the Lixiahe district; (d) typhoon surge risk in the Lixiahe district.
Sustainability 10 02232 g011aSustainability 10 02232 g011b
Figure 12. The compound risks of rainstorm and typhoon surge in the two research areas: (a) Huaibei plain district; (b) Lixiahe district.
Sustainability 10 02232 g012
Figure 13. The probability-probability plot of the compound events in the two research areas: (a) Huaibei plain district; (b) Lixiahe district.
Sustainability 10 02232 g013
Figure 14. The joint probability distribution of compound events not occurring in the two research areas: (a) Huaibei plain district; (b) Lixiahe district.
Sustainability 10 02232 g014
Figure 15. Joint co-occurrence return period of the best-selected copula based on the number of occurrences: (a) Huaibei plain district; (b) Lixiahe district.
Sustainability 10 02232 g015
Table 1. Function expressions of Archimedean copulas.
FamilyExpression Generator φ ( t ) Parameter SpaceRelationship between τ and α
Clayton ( u α + v α 1 ) 1 α 1 α ( t α 1 ) α 0 τ = α / ( α + 2 )
Frank 1 α ln ( 1 + ( e α u 1 ) ( e α v 1 ) e α 1 ) ln ( exp ( α t ) 1 exp ( α ) 1 ) α 0 τ = 1 4 α ( 1 1 α 0 α t e t 1 d t )
Gumbel exp ( [ ( ln u ) α + ( ln v ) α ] 1 / α ) ( ln t ) α α 1 τ = 1 1 / α
Table 2. Statistical results of the three types of rainstorms in the coastal areas of Jiangsu Province from 1960 to 2012.
TypePlum RainTyphoon RainConvective Rain
Number of occurrences6222105
Duration (days)20–301–41–2
Average area rainfall (mm)231.4104.154.8
Table 3. The P-III parameters of rainstorms and typhoons in the research areas.
AreasEventMean Value R ¯ Coefficient of Variation C v Skew Factor C s
Huaibei plain DistrictArea rainfall52.6 mm0.413.0 C v
Typhoon surge145.2 cm0.282.0 C v
Lixiahe DistrictArea rainfall77.5 mm0.673.0 C v
Typhoon surge153.8 cm0.244.0 C v
Table 4. The parameters of the candidate copulas.
AreasCopulaParameterK–SRMSEAIC
Huaibei plain DistrictClayton−0.3620.10650.0365−322.65
Frank2.2630.14540.0309−369.14
Gumbel0.9300.15970.0321−365.06
Lixiahe DistrictClayton4.500.19350.0332−323.40
Frank6.420.17910.0354−338.73
Gumbel3.310.12240.0323−336.69
Table 5. The encounter probability of different levels of rainstorms and typhoon surges.
Surge50 cm100 cm150 cm200 cm250 cm
Rainstorm
Huaibei Plain District50 mm70%60%30%20%9%
100 mm35%25%25%20%8%
150 mm20%15%15%10%6%
200 mm10%7%7%5%3%
Lixiahe District50 mm55%30%15%8%
100 mm50%30%15%8%
150 mm40%30%15%8%
200 mm30%15%10%6%
250 mm12%10%6%5%

