Article

Coal Power Environmental Stress Testing in China

1
School of Economics and Management, North China Electric Power University, Beijing 102206, China
2
Beijing Key Laboratory of New Energy and Low-Carbon Development, North China Electric Power University, Beijing 102206, China
*
Author to whom correspondence should be addressed.
Sustainability 2018, 10(7), 2151; https://doi.org/10.3390/su10072151
Submission received: 17 May 2018 / Revised: 15 June 2018 / Accepted: 17 June 2018 / Published: 25 June 2018

Abstract

:
The development of China’s coal power industry is accompanied by various environmental risks. In this paper, typical coal power enterprises are taken as examples to establish a tool for environmental cost internalization and environmental risk analysis under the risk constraints of energy efficiency standards, environmental protection tax, national carbon market, water resources tax, overcapacity and renewable energy substitution. The study considered the impact on the value of coal power companies under different stress scenarios and constructed a stress testing framework for environmental risks that affect financial costs. The results show that the impacts of overcapacity and carbon market on enterprise value for individual risks are the main risk drivers that most regions face in different scenarios. In the comprehensive risk stress test, the enterprise value of the 1000 MW ultra-supercritical units in each region was found to have a small difference from the corporate value of the reasonable return in the optimistic and pessimistic scenarios, while the 300 MW and 600 MW sub critical units were more likely to deviate from the reasonable return due to low energy efficiency and high operating costs. With continuous increase in the severity of environmental risks, the environmental stress test helps coal power companies and financial institutions understand the impact of environmental risks on the financial status of the company and thus influence investment decisions.

1. Introduction

Extreme weather and global warming is becoming more obvious. They seriously affect people’s lives, property security, and sustainable development of the economy and society, and have posed serious challenges to the survival and development of several countries. Human activity is the main cause of global warming. The international community is taking positive actions to scientifically deal with climate change. On December 2015, nearly 200 nations adopted and signed the Paris Agreement, aiming to strengthen global response to the threat of climate change by keeping a global temperature rise well below 2 °C above pre-industrial levels by the end of this century and to pursue efforts to limit temperature increase even further to 1.5 °C [1]. To achieve sustainable development, China must actively respond to a series of major resource and environmental issues such as resource shortages, environmental degradation, marine development, and climate change. As a market-oriented institutional arrangement, green finance plays a very important role in promoting the construction of ecological civilization, low carbon development, and environmental protection. China’s green finance has a short history, and existing problems are prominent. Due to the lack of information and incomplete assessment methods, many financial institutions are afraid to enter the green industry, because they are concerned about the uncontrollable green financial risks. In order to form a good green financial development environment, it is necessary to establish public environmental data platforms and environmental stress-testing systems; those that can break the green investment and financing bottleneck caused by information asymmetry. The focus of China’s green financial development is on how to quantify environmental risk. Environmental stress testing is an environmental risk analysis tool that identifies risk and quantifies risk factors. It helps financial institutions to understand the impact of climate and environment policy changes on the financial situation of an enterprise, and guide them to reduce investments with enterprises that have high environmental risks [2].
Since the 1990s, stress testing has been widely used by international banks and financial institutions to estimate economic losses under abnormal market conditions. Fender et al. [3] believed that stress tests can help financial institutions assess liquidity needs under extreme market conditions and prepare for liquidity risk management under stressful conditions. Alexander and others [4] applied a risk model to a stress test, covering risk clusters and thick tail phenomena in the financial market. Blashke [5] and Goldstein [6] used a stress testing tool to study the stability of the financial system. Peura and Jokivuolle [7] introduced a simulated method of stress tests that contain periodic factors, which can simultaneously simulate real bank capital and minimum capital requirements to determine the capital adequacy of the bank. In June 2017, 34 major banks in the United States, including Bank of America, Citibank, and Wells Fargo, passed stress tests and all the capital’s pressure-resisting capabilities were met in the hypothetical extremely-unfavorable economic environment.
In recent years, China has also conducted the exploration and practice of stress testing. The authors of [8] have summarized and analyzed the advantages and disadvantages of stress testing, discussing the practical details of stress testing and how to effectively implement the stress test in developing countries with a lack of data. The author of [9] conducted deeply analysis of the construction and common methods for macro stress testing, and compared a typical stress testing system. In 2015, ICBC [10] first studied the impact of the internalization of corporate environmental costs on the risk of commercial banks, and conducted stress tests on two key polluting industries, including thermal power and cement. In March 2017, ICBC further cooperated with Trucost Corporation to quantify the environmental risks in the aluminum industry and analyze the impact of internalization of environmental costs on project finance under different scenarios [11]. In April 2017, the International Institute of Green Finance released the environmental stress test method of the fund and insurance asset management industry. On the basis of environmental risk and climate risk factors; conduct scenario analysis and sensitivity analysis on stocks, bonds, equity investments and real estate held by the asset management industry was studied and found to affect investment returns [12]. In September 2017, Trucost used the coal chemical industry as an example to assess China’s potential environmental risks and its impact on financial markets, helping market participants to weigh environmental risks and use them for financial analysis [13]. At present, the financial industry environmental stress test mainly focuses on the analysis of the banking industry and credit risk; the environmental risk stress test for coal power companies is still blank. The author of [14] applied the method of choice experiments (CE) and the 411 questionnaires with 2466 data points, and found that the environmental cost of coal power plants in China is 0.30 yuan per kWh. The author of [15] found that the increasing share of renewable energies decreased full load operating hours, especially of coal fired and gas power plants, and coal fired power plants are faced with new economic challenges.
After China’s economic development entered a new normal, macroeconomic growth slowed markedly, and the growth rate of power consumption dropped. As a result, the nation’s electricity supply capacity was generally affluent. Ref. [16] applied the co-integration theory to find the relationship between real Gross Domestic Product (GDP) and electricity consumption for China. The author of [17] found that energy consumption will peak at 5200–5400 million tons coal equivalent (Mtce) in 2035–2040. Since the approval authority for coal power projects was decentralized from the central government to the provincial government in November 2014, coal power investment has fallen into a frenzy and existing coal power plants have far exceeded domestic power demand. In response, the Chinese government issued a number of restrictions from 2015 to 2017 to urge local governments and enterprises to slow down the construction of coal power plants [18,19]. Since 2016, a total of 444 GW of coal-fired power plant projects in various stages of construction have been suspended [20]. The author of [21] quantified the rational capacity and potential investment of coal power in China during the 13th FYP period (2016–2020) and found that if all the coal power projects submitted for Environmental Impact Assessment (EIA) approval were put into operation in 2020, capacity excess would reach 200 GW. Under such a big background, environmental governance has been repeatedly emphasized by the central government. The 19th Party Congress report clearly put forward “accelerating the structural reform of ecological civilization and building a beautiful China”. The development of the coal power industry is accompanied by various environmental risks. The author of [22] and the author of [23] have conducted related research on the risks faced by coal power companies. This article uses the newly built coal-fired units in 2017 as an example to set pressure scenarios for risk factors. The DCF method is used to build a stress test model that takes into account the impact on business costs and revenue under different stress scenarios. Ultimately, the impact of price changes caused by environmental risks on the value of the company is found. The innovation in this paper is based on a series of risk factor changes to set pressure scenarios and exploration of the pressure transmission path of environmental risk to the value of coal power companies.

2. Research Methods and Data Description

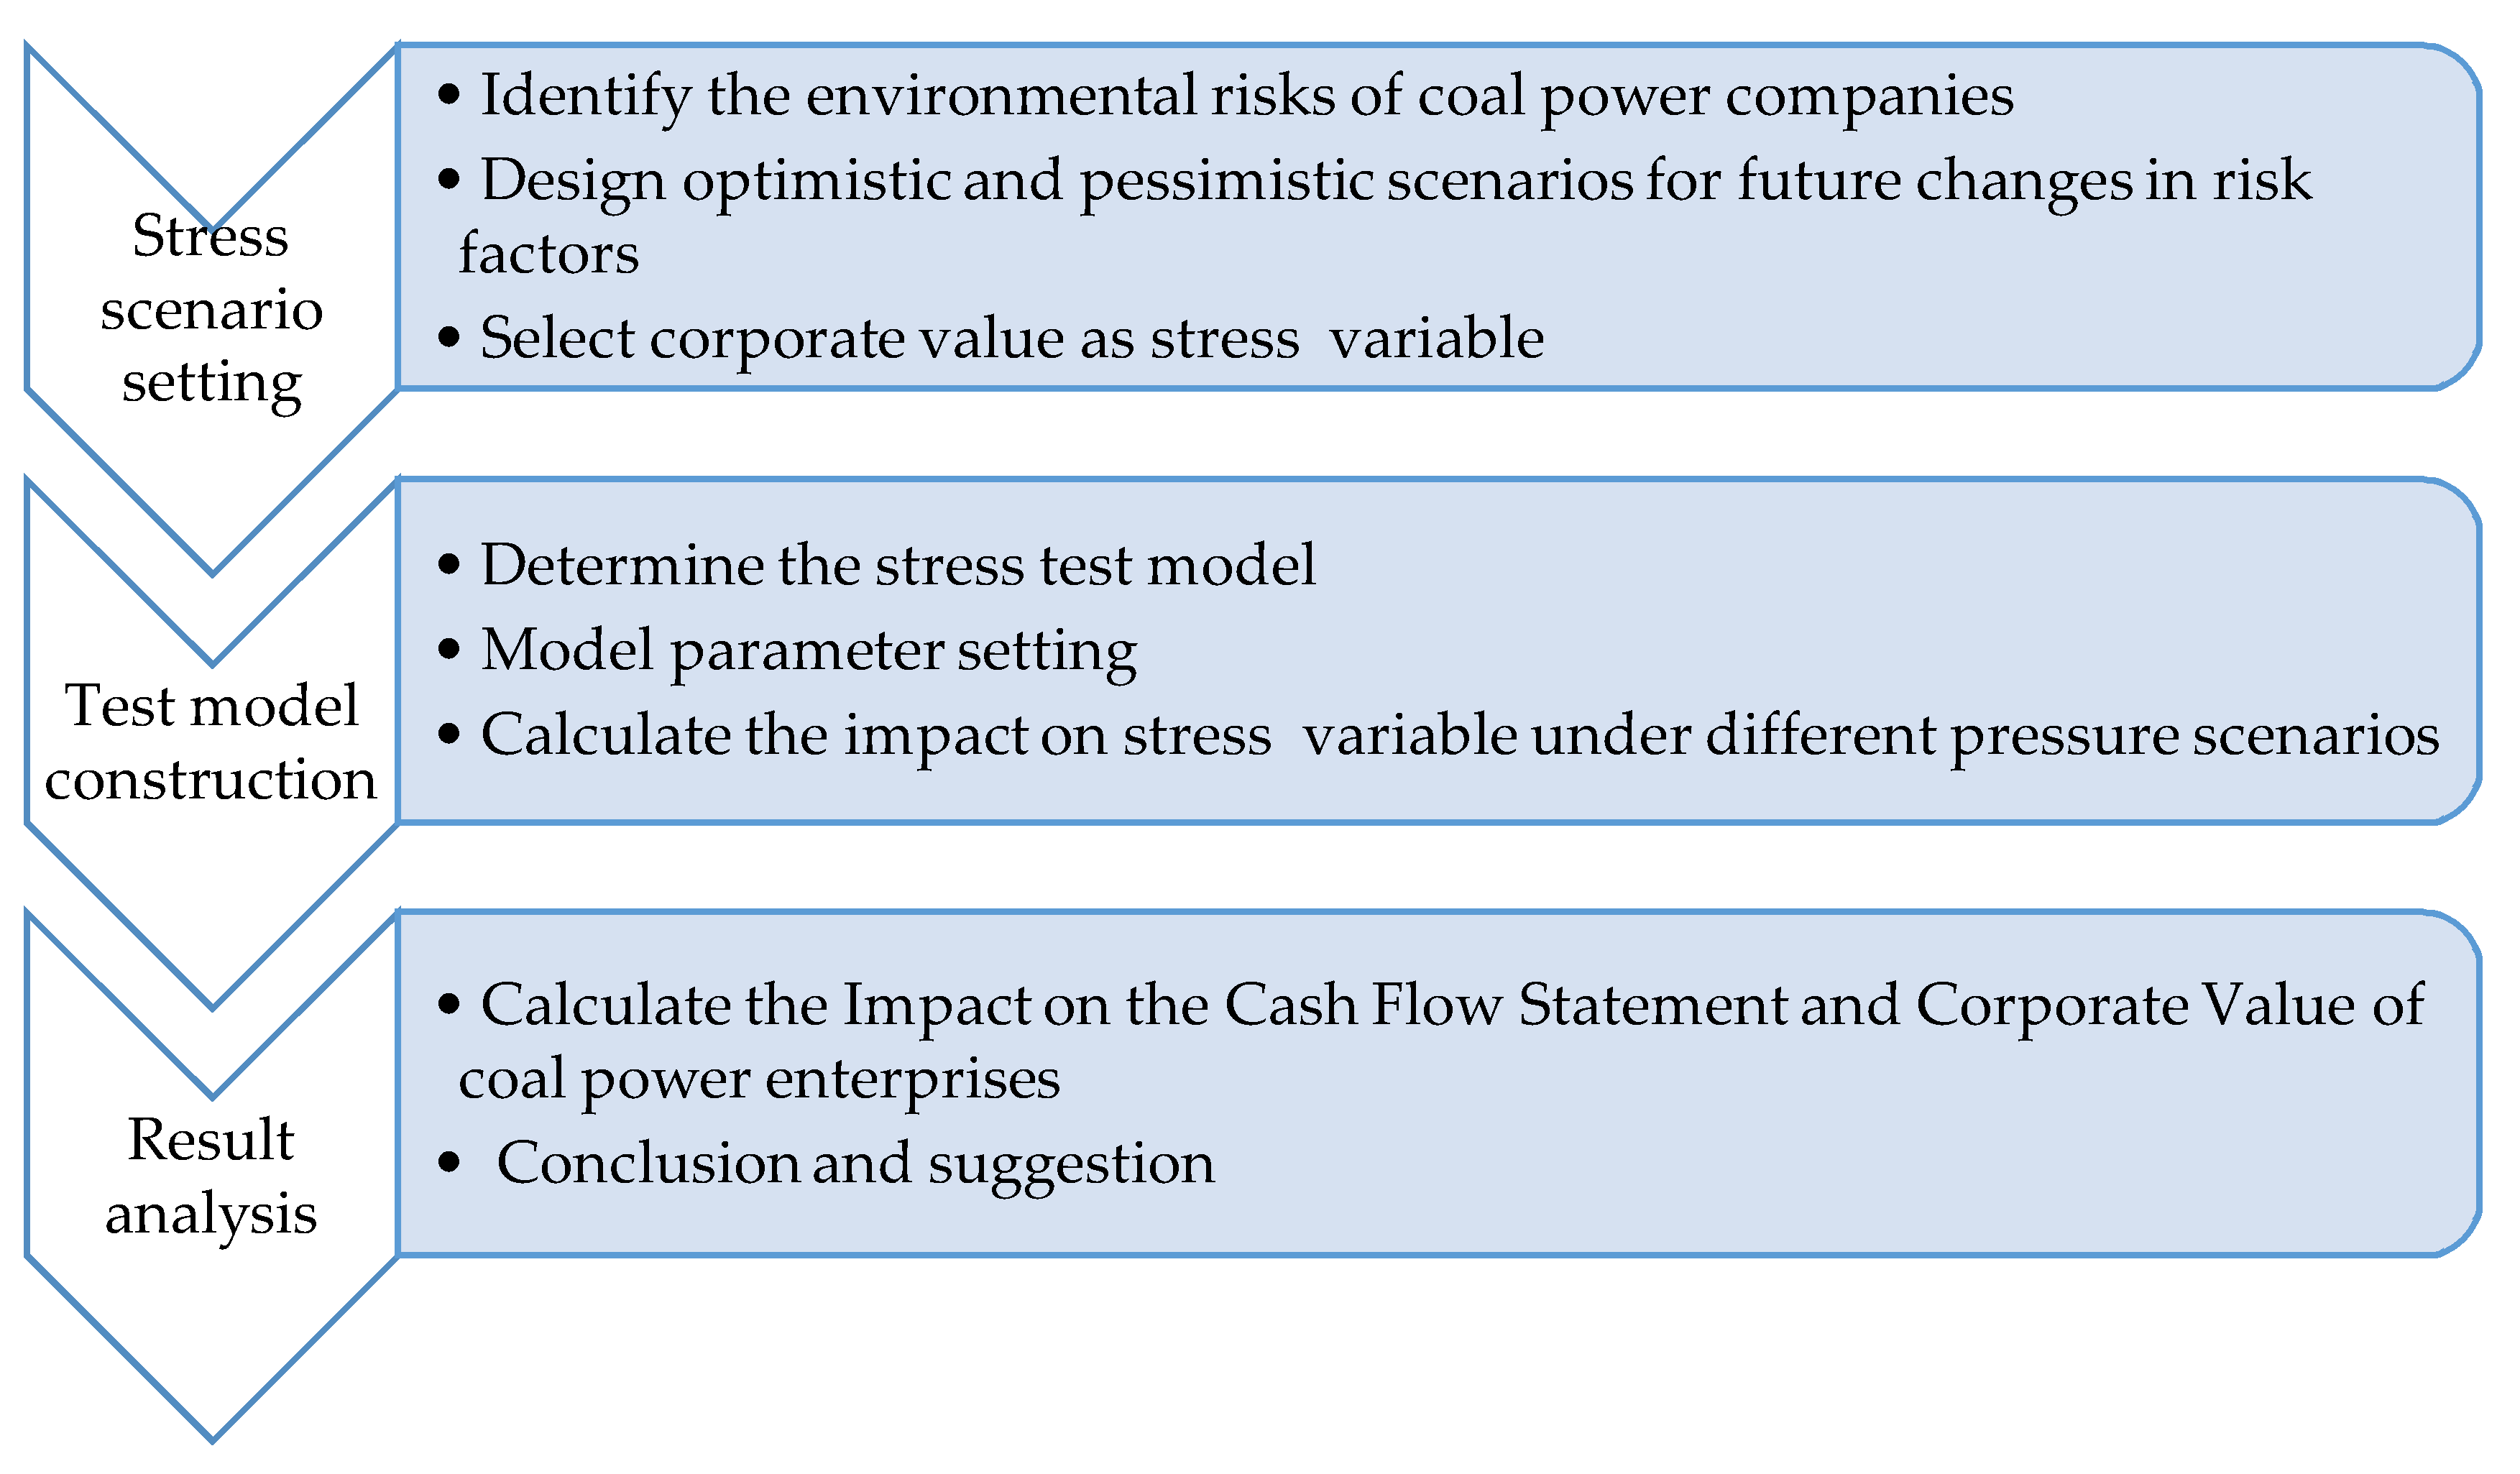
2.1. Stress Testing Model

This paper uses the financial system stress test theory and analysis framework, combines the characteristics of the coal-fired power industry, assesses the ability of coal power companies to withstand changes in the external environment, and quantifies potential risks. The pressure object of environmental risk refers to the subject under test, which is the focus of the stress test, i.e., coal and electricity enterprises. The pressure index refers to the performance of the pressure object in a certain respect, i.e., the enterprise value. The coal power environmental stress test flow chart is shown in Figure 1. The conduction model of environmental stress testing is the core of stress testing. Figure 2 comprehensively considers the impact of various environmental risk factors on the main business income and main business expenses of coal power companies, and quantitatively analyzes the impact of environmental risks on the value of coal power companies.
This paper screens out six risk factors that directly affect coal and electricity companies’ financial impact. For a typical unit, the scenario analysis focuses on the combined effects of a single factor (or multiple stress factors) on the subject’s pressure variables to assess the event’s ability to face uncertainties that can occur. After determining the method for quantifying risk factors, two scenarios were designed for future changes in risk factors, namely optimistic and pessimistic scenarios, as shown in Table 1.

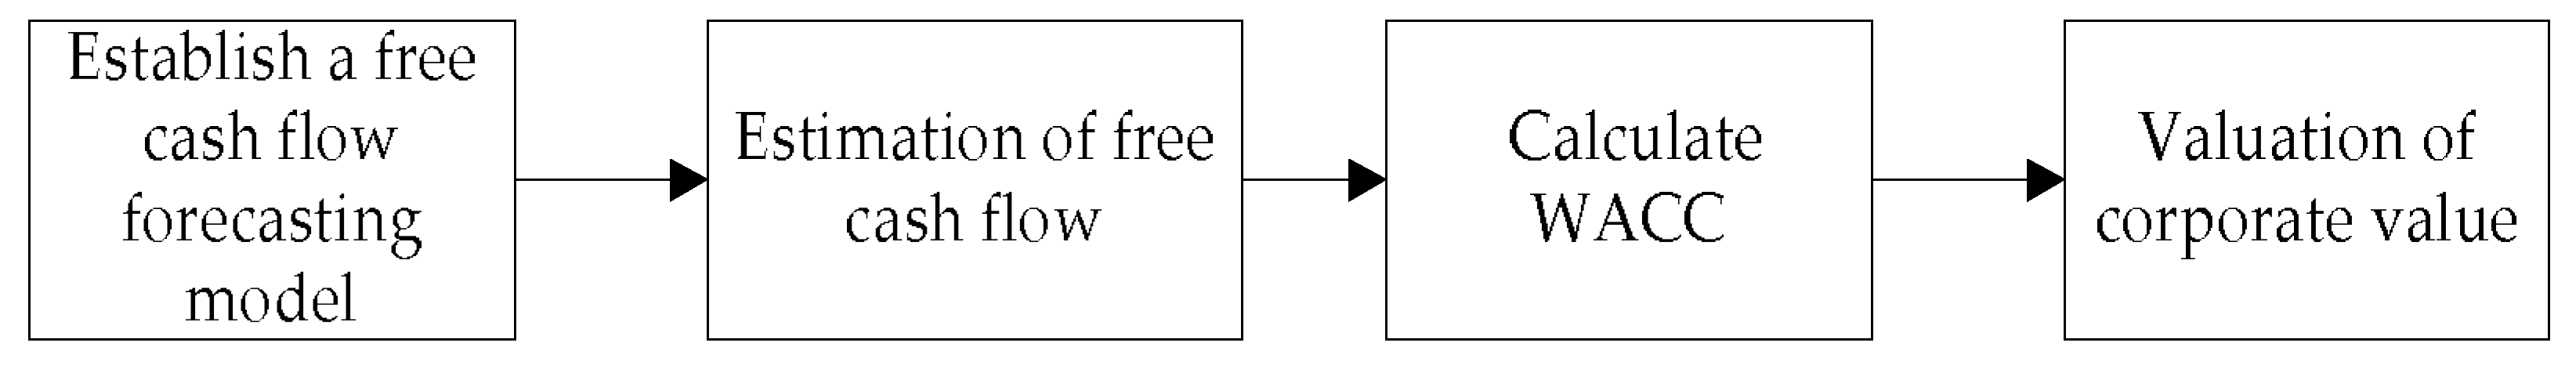
2.2. Discounted Cash Flow Model

The value of an enterprise refers to the valuation of future profitability, and related rights and interests of a company at a specified time in terms of currency. Refs. [25,26] defined the company’s value from the perspective of cash flow. They believe that cash flow created by the company and its return on investment determines the value of the company, that is, the current value of the company’s expected cash flow. The authors of [27,28] conducted relevant research on the discounted cash flow model, which has certain reference value for standardizing enterprise value evaluation methods. In theory, the methods for assessing alternative corporate values include cost addition method, present value of income method, and market method. This paper applies the weighted cost method of the free cash flow discount method to evaluate the value of coal power companies. The company’s future annual free cash was calculated using the weighted average cost of capital (WACC) as the discount rate. The discounted present value is the value of the company (Figure 3 shows the process of enterprise value estimation).
C o r p o r a t e   c a s h   f l o w = E B I T × ( 1   i n c o m e   t a x   r a t e )   +   d e p r e c i a t i o n     c a p i t a l   e x p e n d i t u r e s   I n c r e a s e d   w o r k i n g   c a p i t a l   =   N e t   c a s h   a f t e r   t a x   p r o f i t     n e t   i n v e s t m e n t
WACC = K e × W e + K d × W d × ( 1 T )
where K e is the cost of equity capital of the enterprise, W e is the ratio of the capital cost of the enterprise’s equity capital under the market value, K d is the debt capital cost of the company, W d is the ratio of corporate debt capital costs in the capital structure in the market value, and T is corporate income tax.
The author of [29] used the capital asset pricing model (CAPM) to find that weighted average capital cost is very important for enterprise investment. In this paper, the CAPM model is used to determine the cost of equity capital ( K e ). The capital asset pricing model reflects the higher returns required by the investor to increase the risk through the equity risk premium adjusted by the β coefficient. However, the β coefficient only theoretically measures the system risk of a particular company, but does not reflect the non-systematic risk. Therefore, a revised Capital Asset Pricing Model (MCAPM) is needed to reflect non-systematic risks in order to increase the accuracy of the expected rate of return. The revised capital asset pricing model formula is as follows:
  M K e = R f + β × ( R ¯ m R f ) + S C R P
where M K e is the corrected equity capital expected return, R f is the risk-free return, R ¯ m is the market expected return, β is the extent to which the yield of securities reacts to changes in market returns and SCRP is a specific corporate risk premium.
  V = t = 1 n F C F F ( 1 + r ) t
where V is the value of the enterprise, n is the life of the asset, FCFF is the cash flow of the enterprise during the t period, r is the discount rate.

2.3. Data Sources and Indicators Selection

The parameters involved in the free cash flow forecasting model are shown in Table 2. Other data refers to the public data of the National Energy Administration, China Electric Power Enterprise Association, Polaris Power Network, etc. Where the project data was incomplete, it was supplemented by a coefficient adjustment method.

3. Empirical Results

3.1. Reasonable Return of Enterprise Value

Through the free cash flow discount model, the reasonable return of enterprise value of different types of coal enterprises in different regions can be calculated. The enterprise value of each area is different because of the different costs of unit capacity projects. Among them, 300 MW, 600 MW and 1000 MW coal-generating units are expected to have the highest value in the Northeast Power Grid, North China Power Grid, and Northwest Power Grid. The details are in the following Table 3.
Figure 4, Figure 5 and Figure 6 show the deviation of the company’s value from the establishment of 300 MW subcritical, 600 MW subcritical and 1000 MW ultra-supercritical real enterprise value in 2017 and reasonable return in each region ((reasonable return − actual return)/reasonable return; a negative value represents an actual return higher than reasonable return expected). The figure shows that the actual corporate value of only 1000 MW ultra-supercritical units in Xinjiang, Guangdong, Anhui, Hainan, Inner Mongolia, Hebei, Jiangsu and Shanghai exceeds the corporate value of reasonable return. The deviation of actual corporate value and reasonable return enterprise value from the 300 MW and 600 MW units in these areas is also relatively small. The reason for this is that the economic development in these areas has brought about a higher demand for electricity, and the enterprise has certain profitability.

3.2. Environmental Stress Test Results

The development of the coal power industry faces several changes. Under excess power generation capacity and high coal prices, the coal power industry suffers losses, and many coal thermal power plants struggle with capital chain breaks. With improving energy efficiency standards, environmental protection taxes, national carbon markets, water resources taxes, overcapacity, and non-water renewable energy planning goals, the value of coal-fired power companies will inevitably change. This paper selected typical new coal power companies from each region in 2017 as the representative for the analysis. Firstly, based on the actual corporate value in 2017 as a baseline scenario, optimistic and pessimistic scenarios were set for individual environmental risks. The performance of enterprises under the pressure of sudden changes in these key variables was tested. Individual provinces are not shown in the figure due to large differences in data. Comprehensive risk stress tests are then conducted on the coal power company to reflect deviation from the reasonable return of the company’s value.

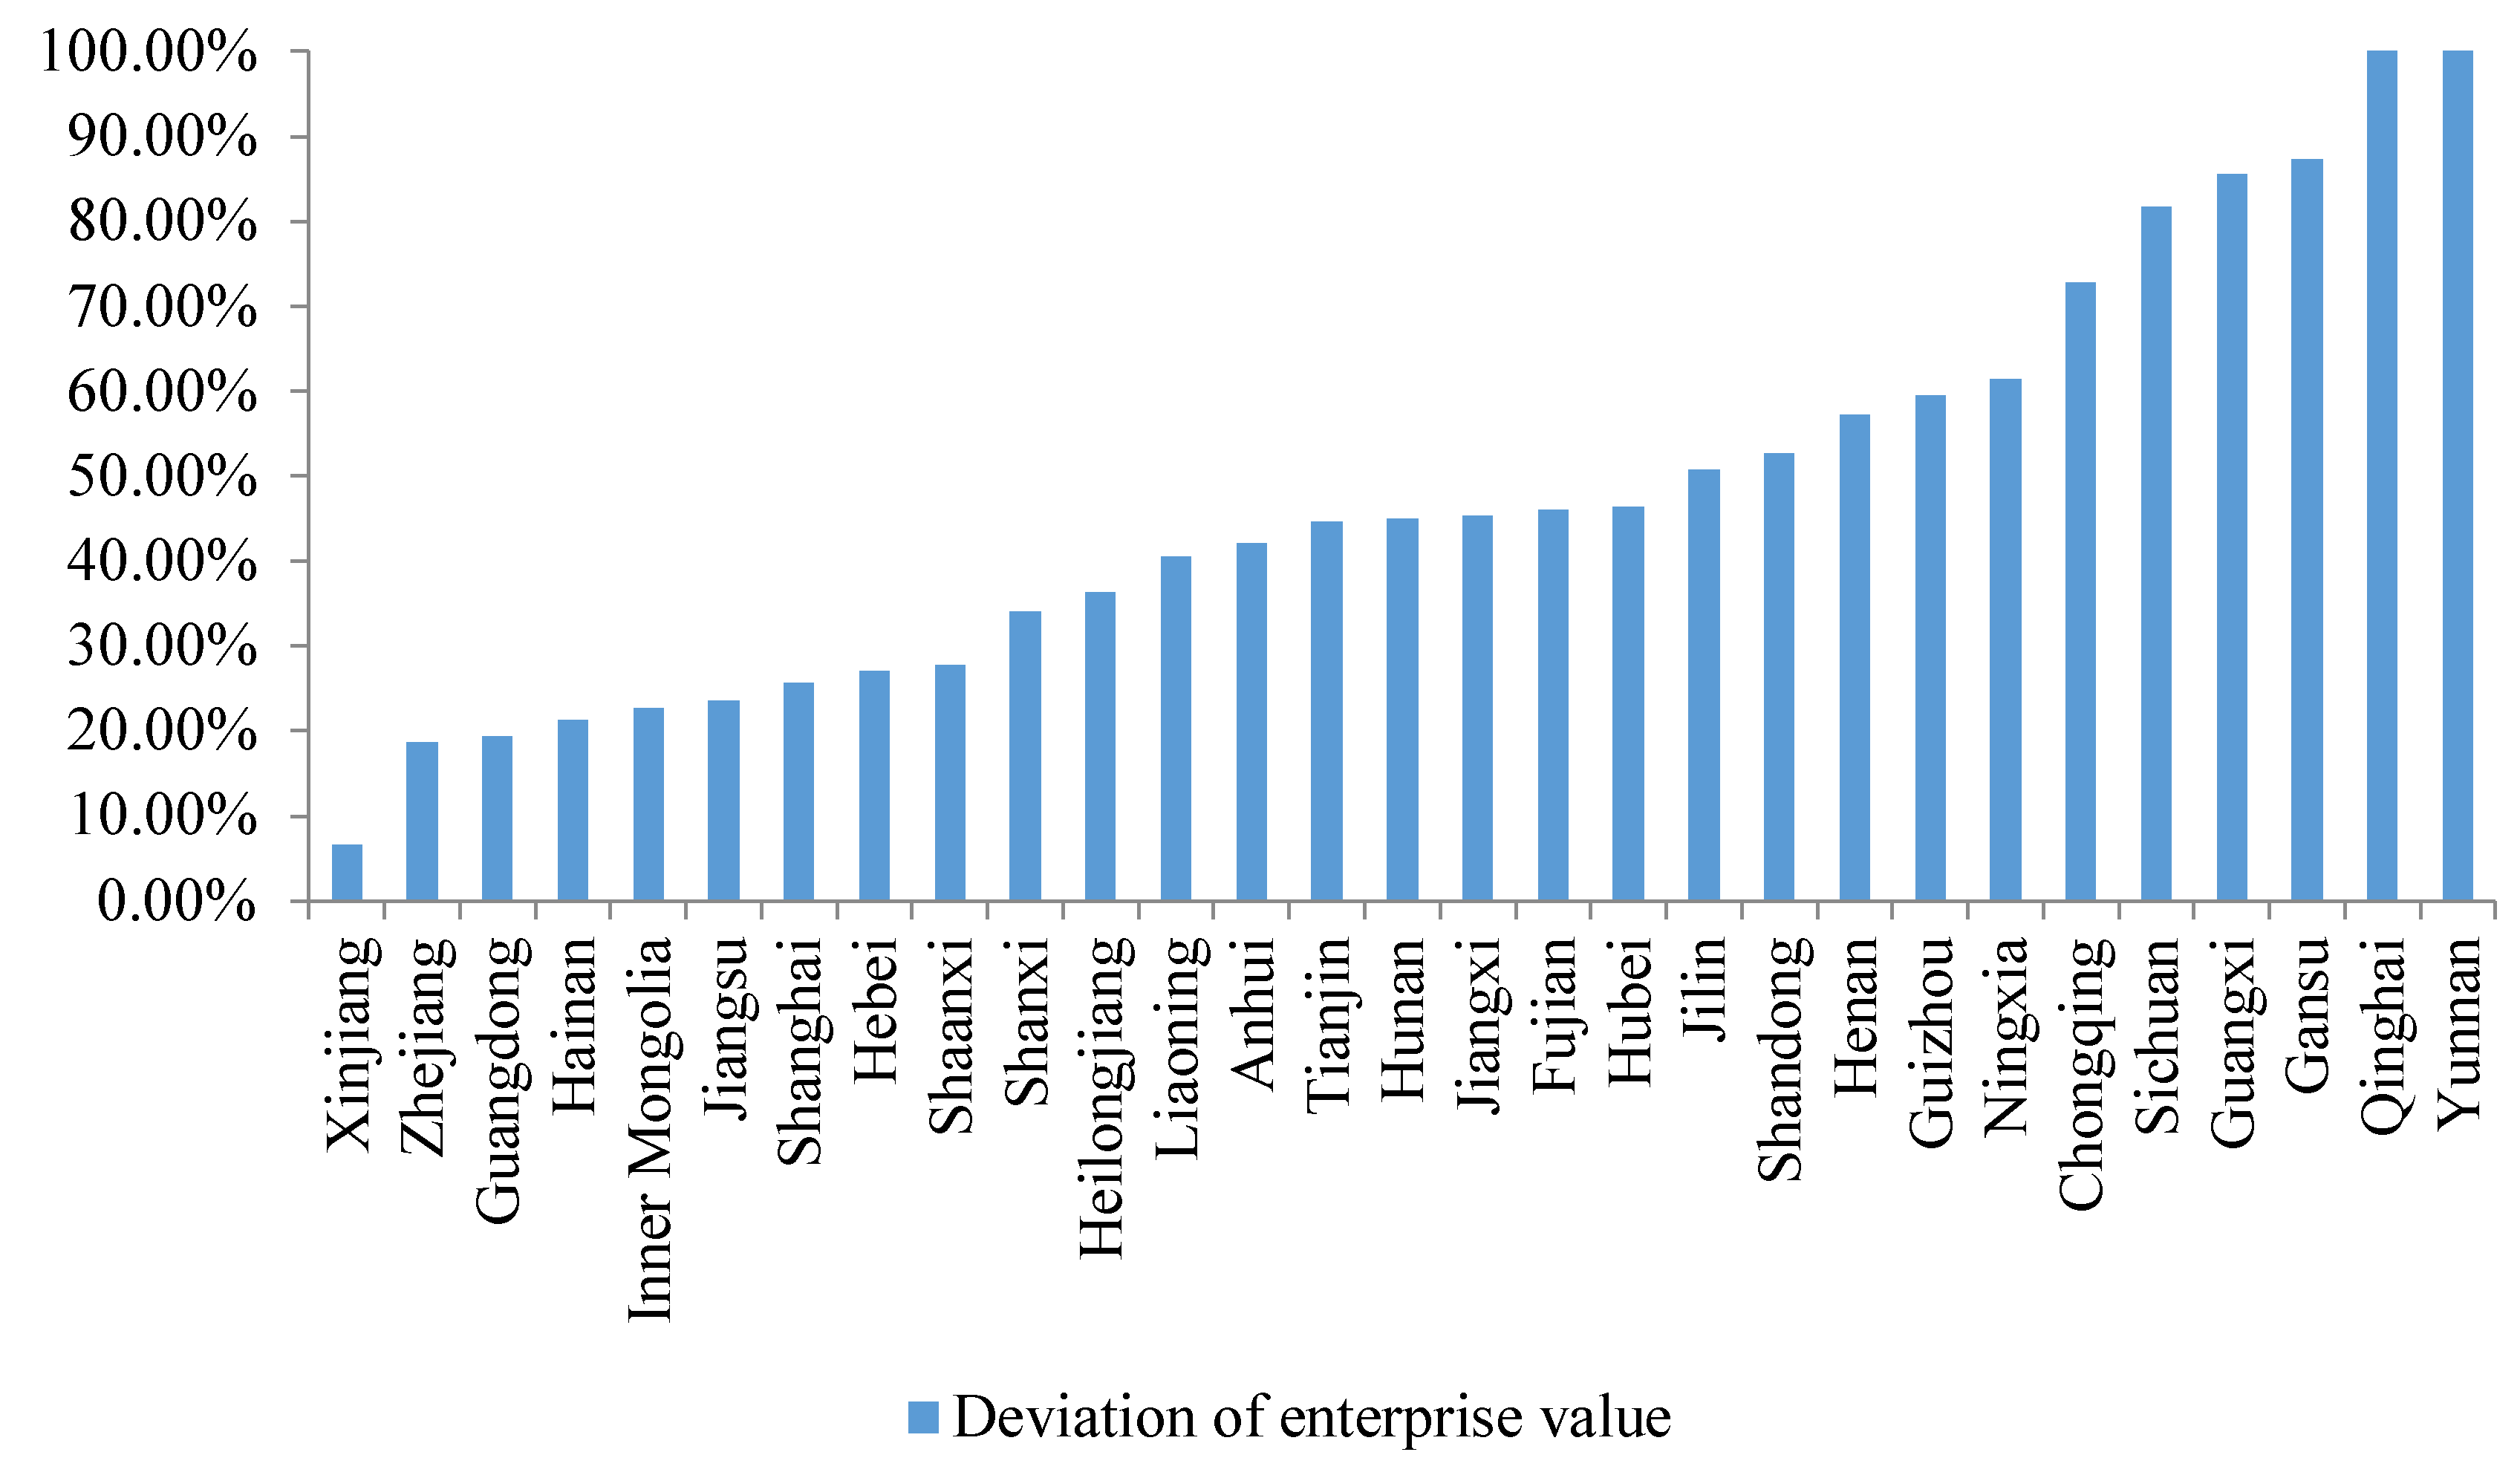
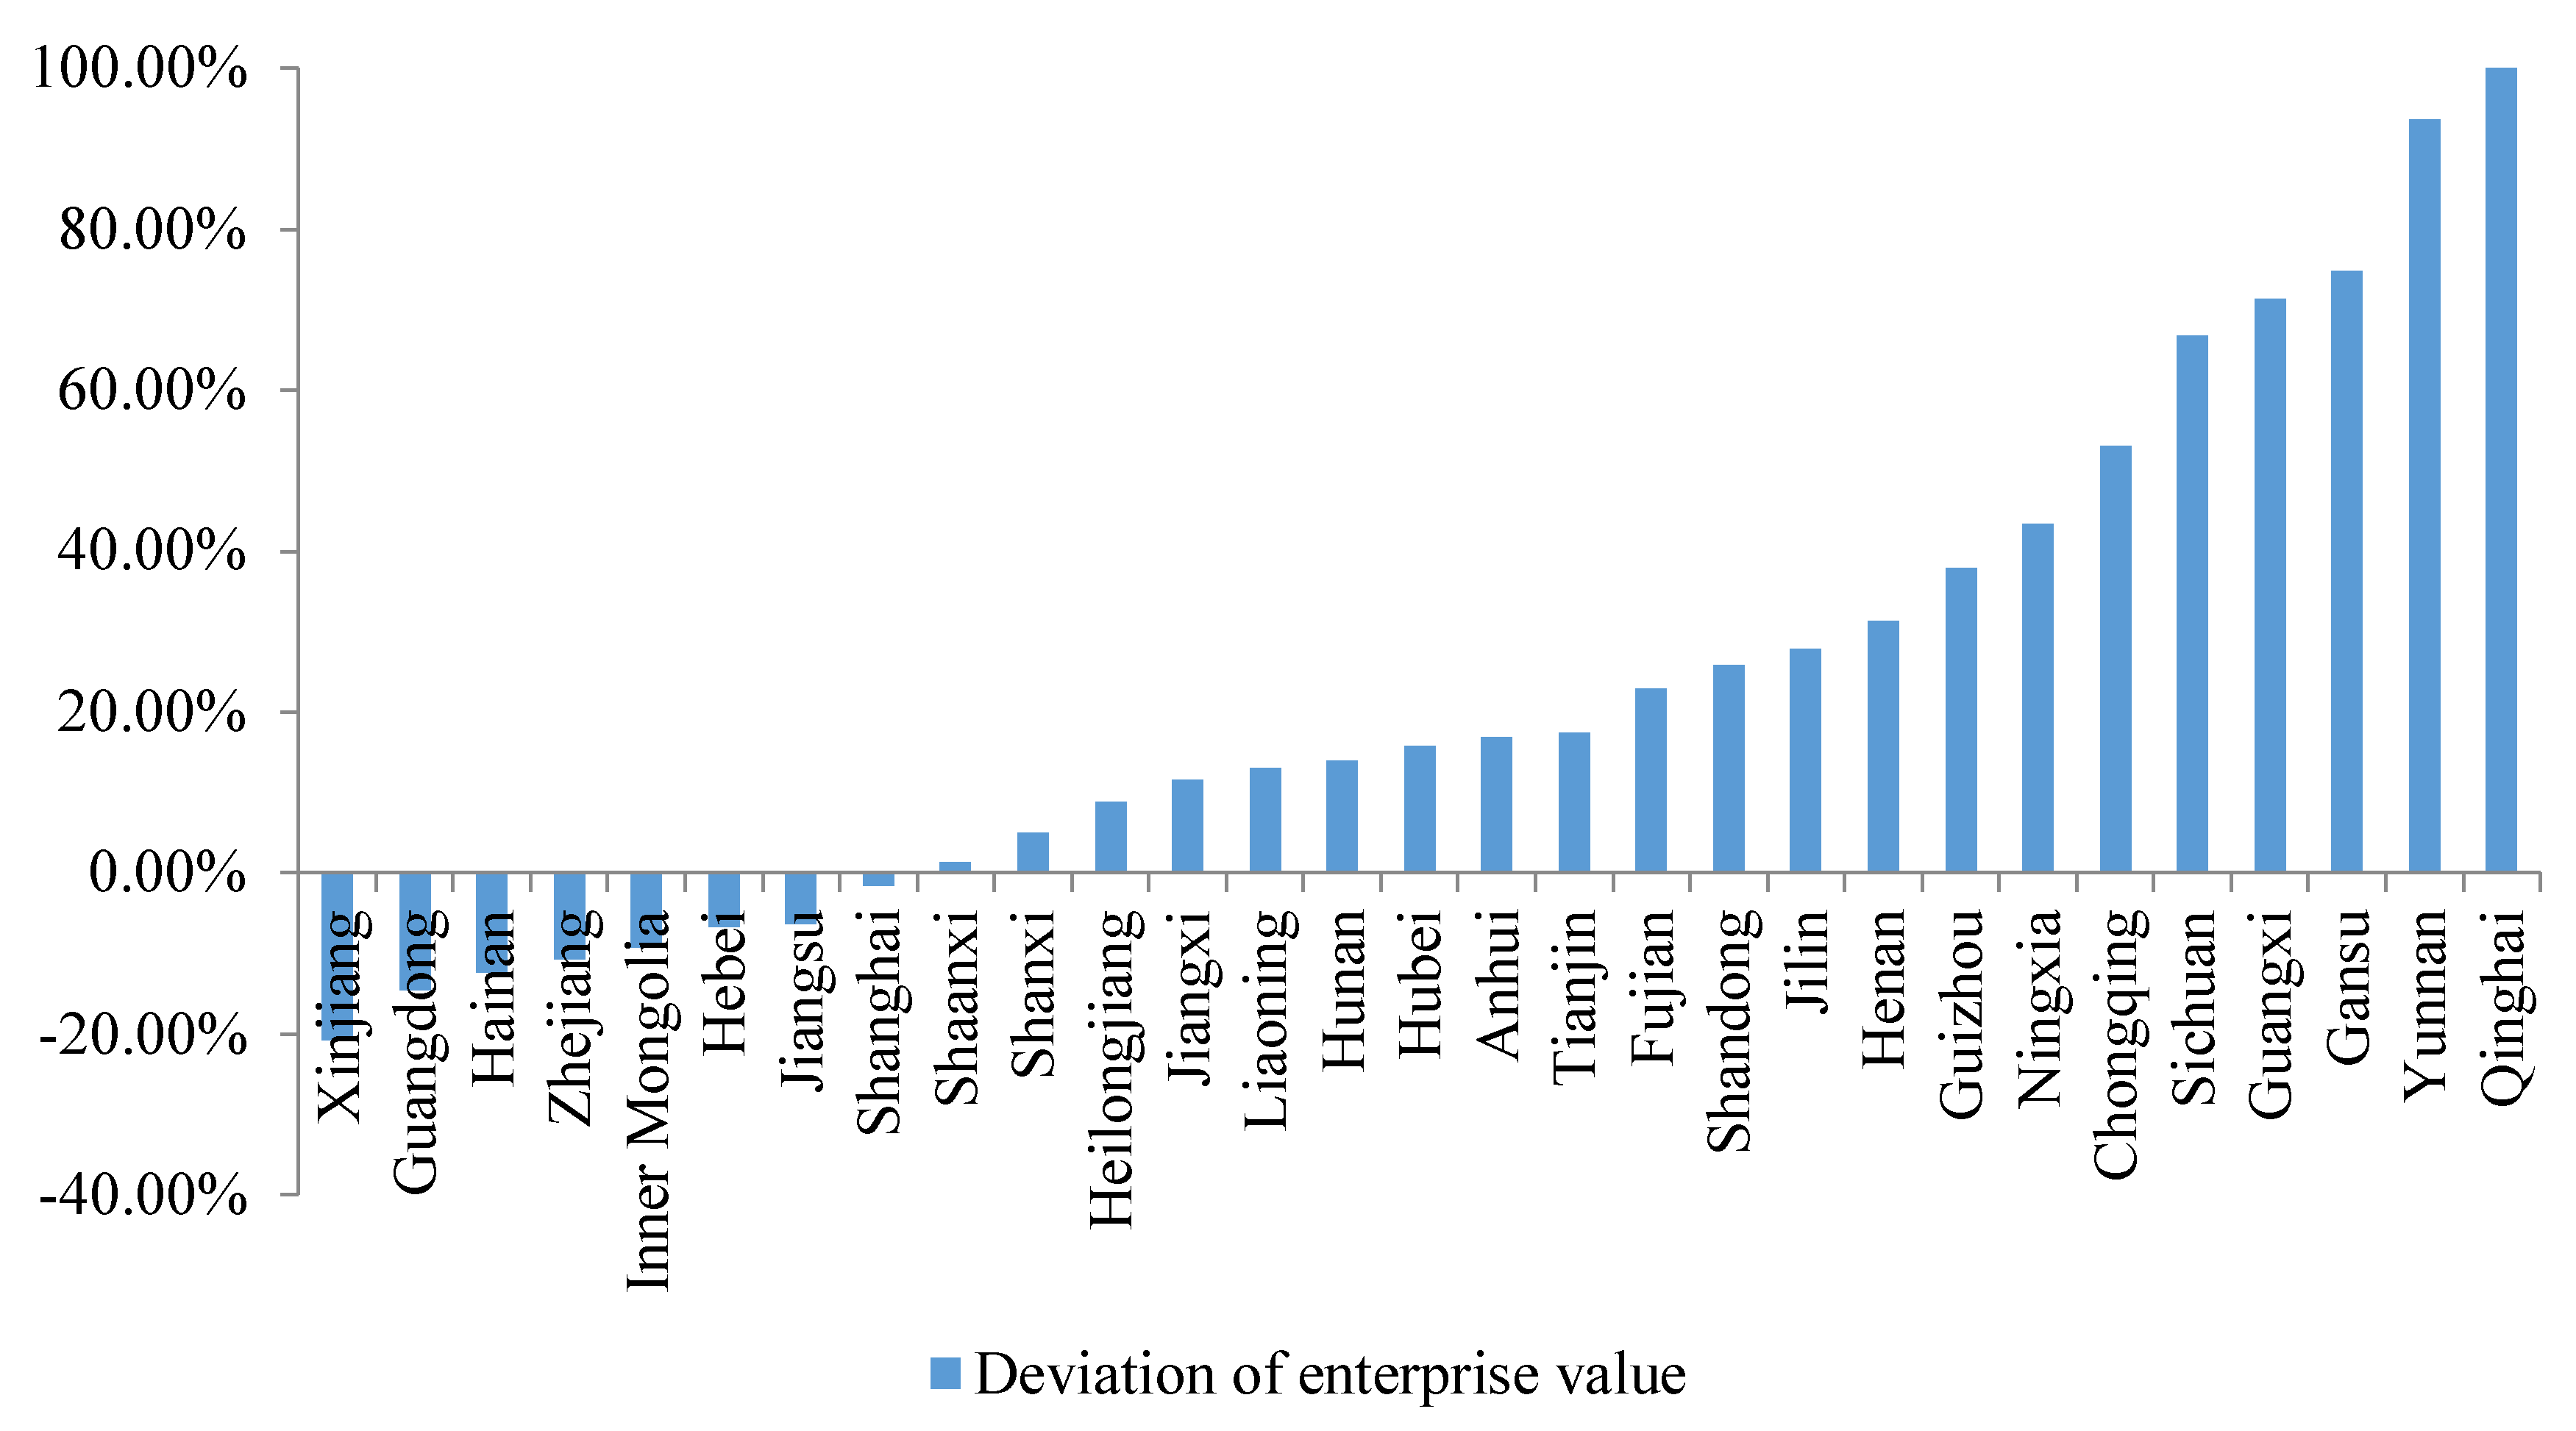
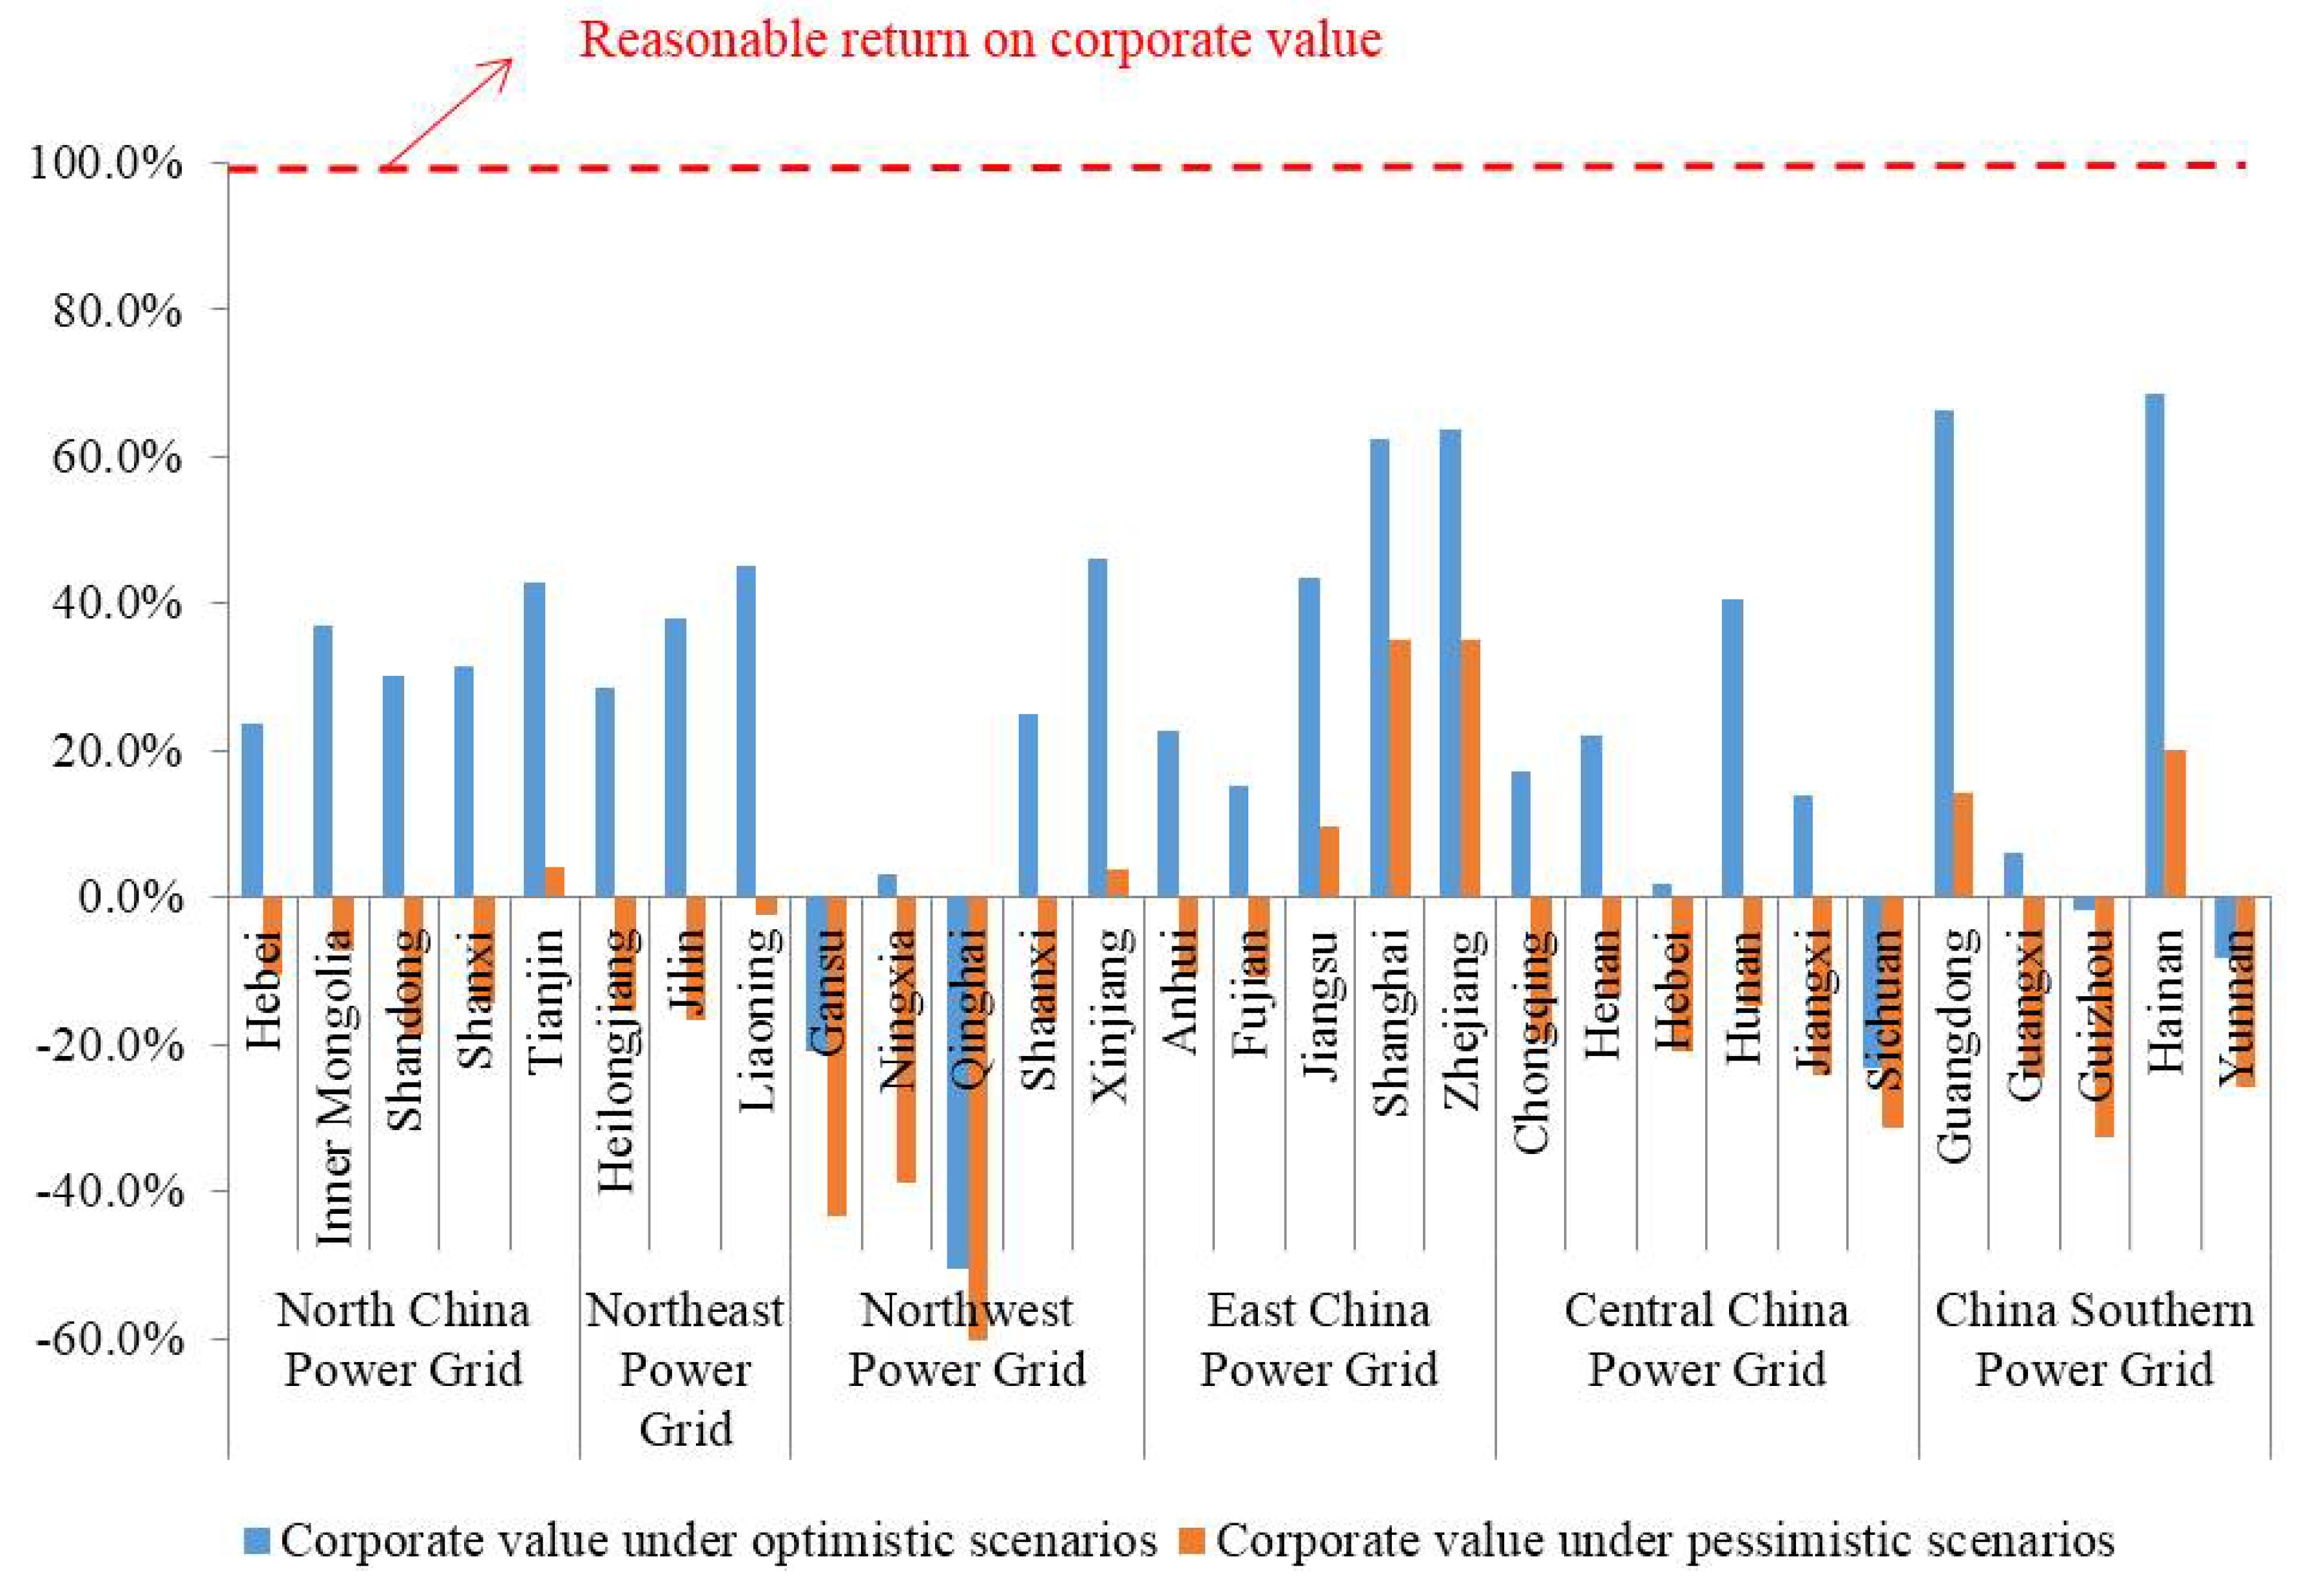
3.2.1. Single Risk Stress Test Results

In 2014, the Coal Energy Saving and Emission Reduction Upgrade and Reform Action Plan proposed that the average coal power consumption of coal power generation units after transformation be less than 310 g/kWh. By 2020, the average coal consumption for power supply of 600 MW and above (excluding air-cooled units) after transformation should be lower than 300 g/kWh [30]. The energy efficiency level of subcritical units is generally lower than the average energy efficiency level of national thermal power units. Figure 7 and Figure 8 show that after the energy-saving upgrading of 300 MW coal power generation units in each region, the cost reduction, due to a small increase in steam-input parameters input, is low. The optimistic scenario is higher than the value of the pessimistic one. The 600 MW coal power companies in different regions have different performances under optimistic and pessimistic scenarios. Coal power companies in Anhui, Guangdong, Hebei, Jiangsu, Shandong, Jiangxi, Zhejiang, Hainan and Qinghai have higher values than optimistic scenarios. That indicates that the reduction in coal consumption and reduction of fuel costs and pollutant discharge costs can largely offset the cost-reduction investment. In general, the improvement of energy efficiency is beneficial to the corporate value of high-efficiency coal power plants.
With the acceleration of industrialization and urbanization, and the continuous upgrading of consumption structures, China’s energy demand has increased rigidly. Resource and environmental issues are still one of the bottlenecks restricting China’s economic and social development. The situation of energy saving and emission reduction is still severe and the task is arduous. The Environmental Protection Tax Law of the People’s Republic of China has been formally implemented since 1 January 2018 [31]. Air pollutant tax is 1.2 yuan to 12 yuan per pollution equivalent. Considering the large differences in local conditions, the original pollutant discharge fees of various provinces are subject to different standards, ranging from high to low. Many provinces have “translated” the original emission standards to the environmental protection tax, and some provinces have raised the standard [32]. On implementation of the environmental protection tax, the increase in tax burden on air pollutants such as SO2 and NOX will increase the operating costs of coal power plants. Figure 9 shows that the value of the 600 MW coal power plant decreased with increase of environmental protection tax standards. Under the pessimistic scenario, the environmental protection tax is assumed to be the upper limit of 12 yuan/pollution equivalent. The value of the enterprise is currently the lowest. With the requirement of environmental protection and sustainable development, the emission of major pollutants such as SO2 and NOX will be effectively controlled. In Beijing, where environmental issues are more prominent, the applicable tax amount in the region was determined according to the upper limit of the tax amount. The upward adjustment of the tax amount in each region is an inevitable trend. Therefore, coal power unit needs to adhere to high-efficiency dust removal, flue gas desulphurization and denitrification equipment, and improve environmental bearing capacity.
With regard to the general trend of global low-carbon transition, China has clearly set emission reduction targets and has promised to reduce the country’s carbon intensity by 40–45% (as compared to 2005 levels) before 2020. Carbon dioxide emissions peak around 2030 and strive to peak as soon as possible [33]. China proposed to steadily undertake the construction of the carbon market in three phases. This indicates that the carbon emissions trading system has completed an official launch of its overall design. The power generation industry was the breakthrough in the launch of the nationwide carbon emissions trading system [34]. A preliminary analysis of this market covers approximately 1700 power generation companies, which emit approximately 3.5 billion tons of carbon dioxide annually, accounting for about one-third of the country’s carbon emissions [35]. This study assumes that the baseline method [36] is used to allocate allowances to coal-fired power companies. Different types of units have corresponding quota allocation values. Emissions per unit of product are above the baseline, indicating that the greater the carbon emission intensity of the company, the more the number of quotas used for compliance purchases will be. Conversely, corporate carbon emission intensity is below the benchmark, and companies can sell their remaining quotas. Figure 10 and Figure 11 show that after the implementation of the national carbon market for 300 MW and 600 MW subcritical units, the reduction in corporate value with increase in the carbon price and the proportion of paid distribution is significant. The 300 MW subcritical units have a greater impact. This is mainly due to the fact that the company’s energy-saving and emission reduction technologies have produced more carbon emissions. The 300 MW and 600 MW units in Guangdong, Xinjiang, Zhejiang, Hainan and Shanghai still have positive values under pessimistic scenarios, while other provinces have negative corporate values. From a long-term perspective, backward coal power plants with significantly higher carbon intensity than the benchmarks will be under greater pressure, and they are encouraged to achieve emission reduction targets by increasing production efficiency.
According to the national baseline water pressure map and forecasts of the distribution of coal power plants in China in 2020, most of China’s regions will face severe water shortage. Coal resources are scarcer in regions where water resources are scarce [37]. Figure 12 shows that the 600 MW coal power companies in each region increased the water resource tax to 0.005 yuan/kWh and 0.03 yuan/kWh, respectively, under the two scenarios. The increase in water charges reduces the value of coal and electricity enterprises, and the difference between the actual value and the actual value of enterprises is up to 0.47%. In the future, with the increase in water resources tax, the value of coal and electricity enterprises will be further reduced.
By 2017, the construction of coal power projects in the world had significantly reduced for two consecutive years, and China has scaled down to the largest scale. The main reason is that China strictly limits new coal power projects [38]. In 2017, the supply and demand of electric power in China was relaxed. The average utilization hours of thermal power equipment were 4209 h, a 23 h increase in the same year [39]. However, the current average utilization hours of thermal power are still far below the normal conditions of 5000 h, and the thermal power industry is still in excess. Based on actual electricity demand, the power and electricity balance model [40] is used to calculate the space of coal and electricity, and calculate reasonable utilization hours and actual utilization hours of coal and electricity in each area in 2020. In the stress test model, we compare the impact of overcapacity on enterprise value in two scenarios. Figure 13 shows that there is a serious overcapacity problem in China’s current coal and electricity industry. The utilization hours of coal and electricity in most provinces have not reached a reasonable level. Among them, Guangdong, Jilin, Shanxi, Zhejiang, Gansu, and other places have great differences in their optimistic values and pessimistic scenarios, and their excess production capacity is relatively serious.
In order to achieve the 2020 and 2030 national strategic objectives of non-fossil fuels accounting for 15% and 20% of primary energy consumption, respectively, the “Guiding opinions on establishing guiding system for the development and utilization of renewable energy resources” made it clear that the generation of non-hydroelectric renewable energy of each power generation enterprise in 2020 should reach more than 9% of the total power generation, and set the proportion of non-hydro renewable energy in the total electricity consumption of all regions [41]. According to a comparison of the proportion of non-water renewable energy and power consumption in 2020, the 12 provinces show a gap in energy consumption of non-water renewable energy. According to Figure 14, the completion of non-water renewable energy targets can reduce the asset value of coal power enterprises in these provinces. The difference of two scenarios is about 1.09–38.4%, and Guizhou has the greatest impact. As the proportion of renewable energy continues to grow, it will inevitably occupy the traditional coal and electricity market. Coal power plants will be squeezed and damaged by economic benefits.

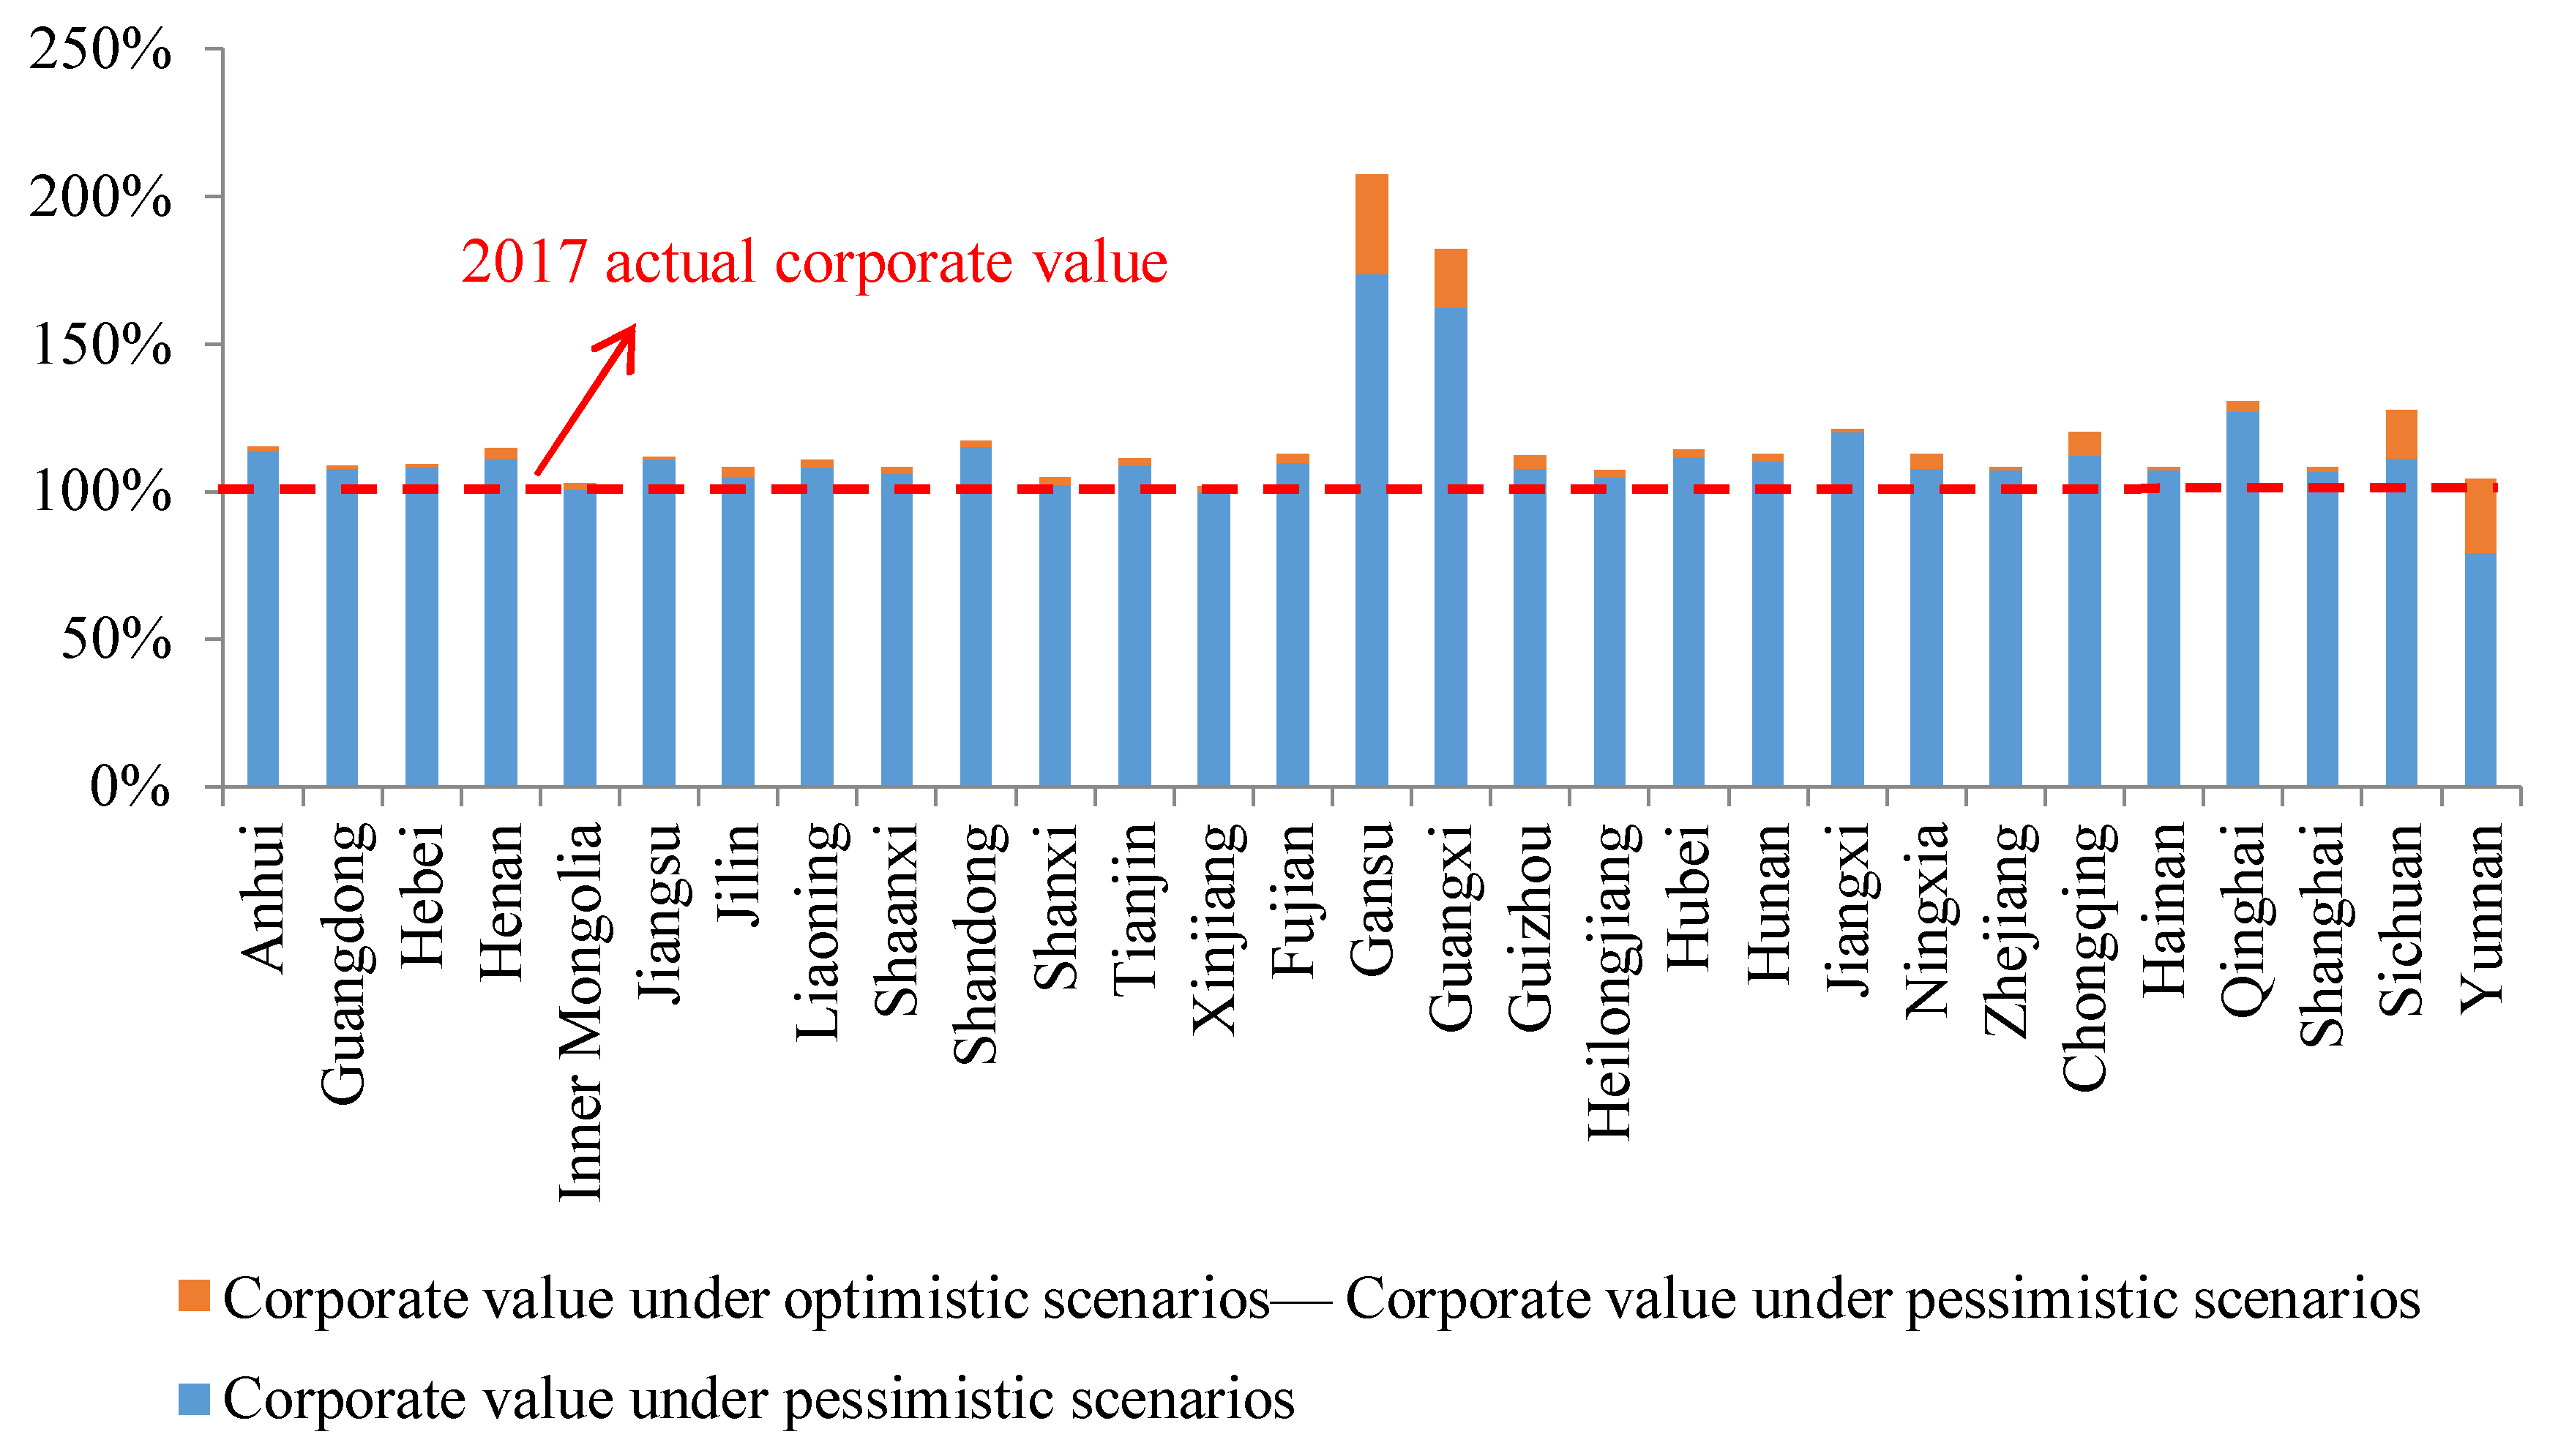
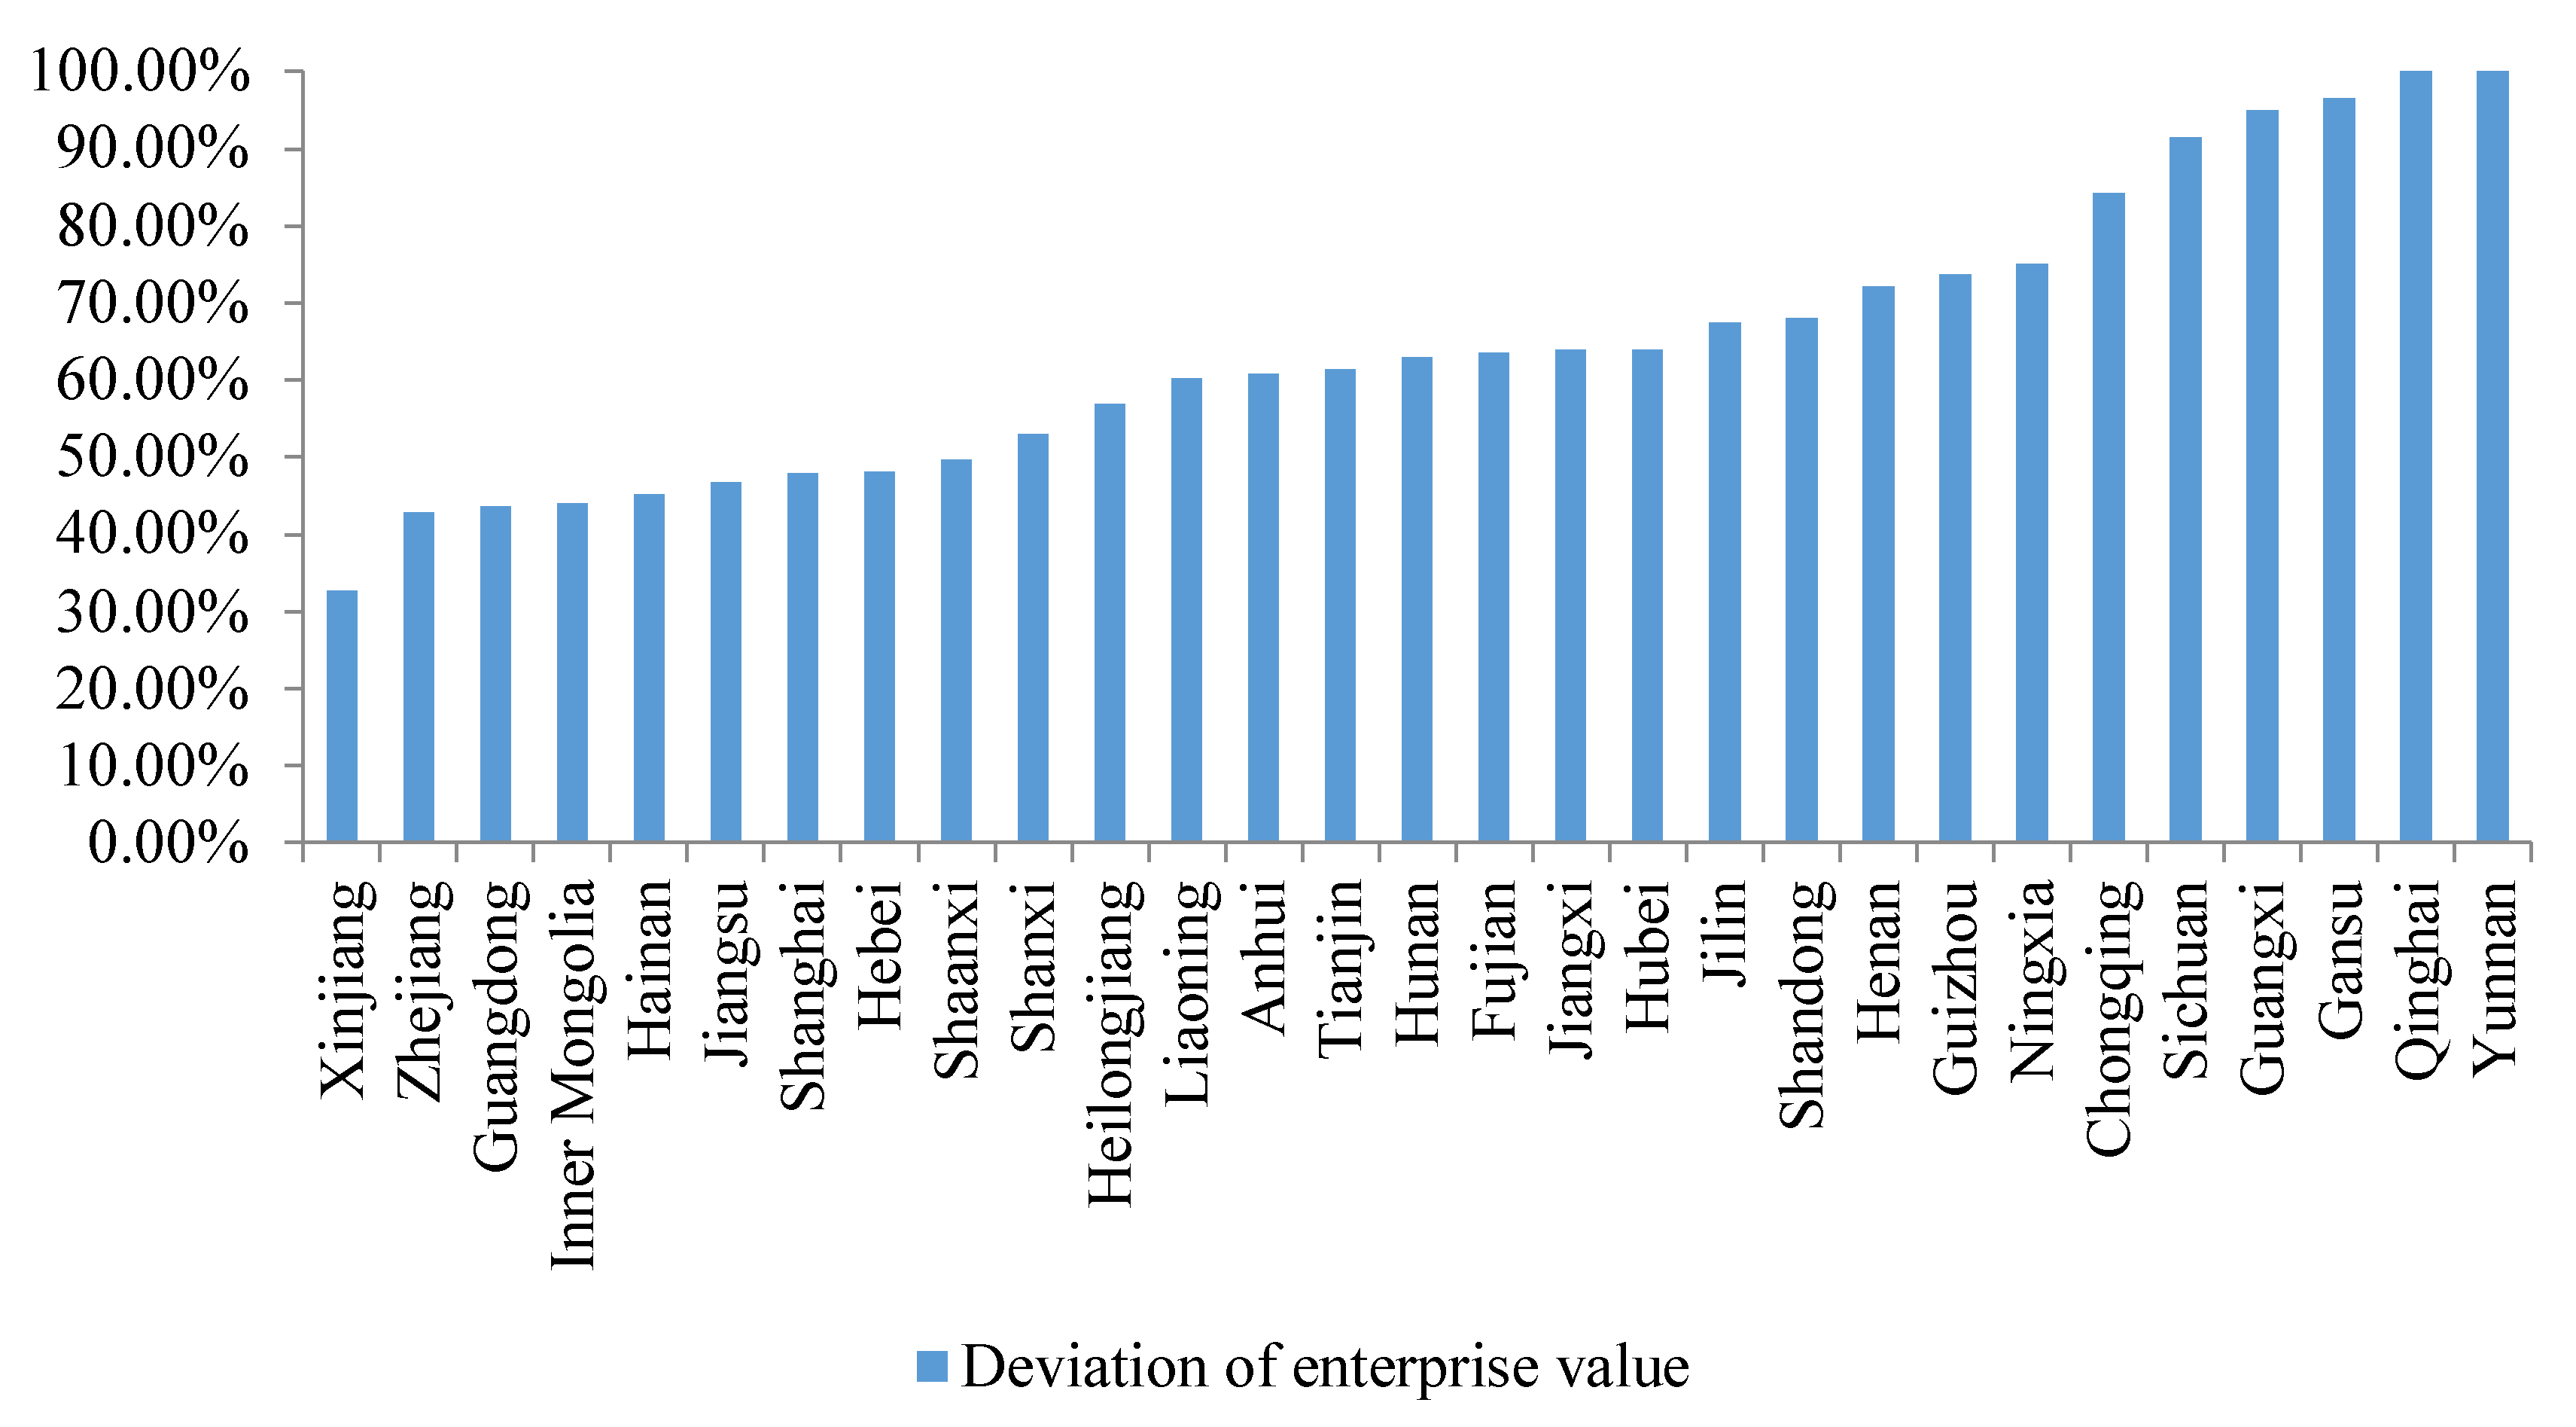
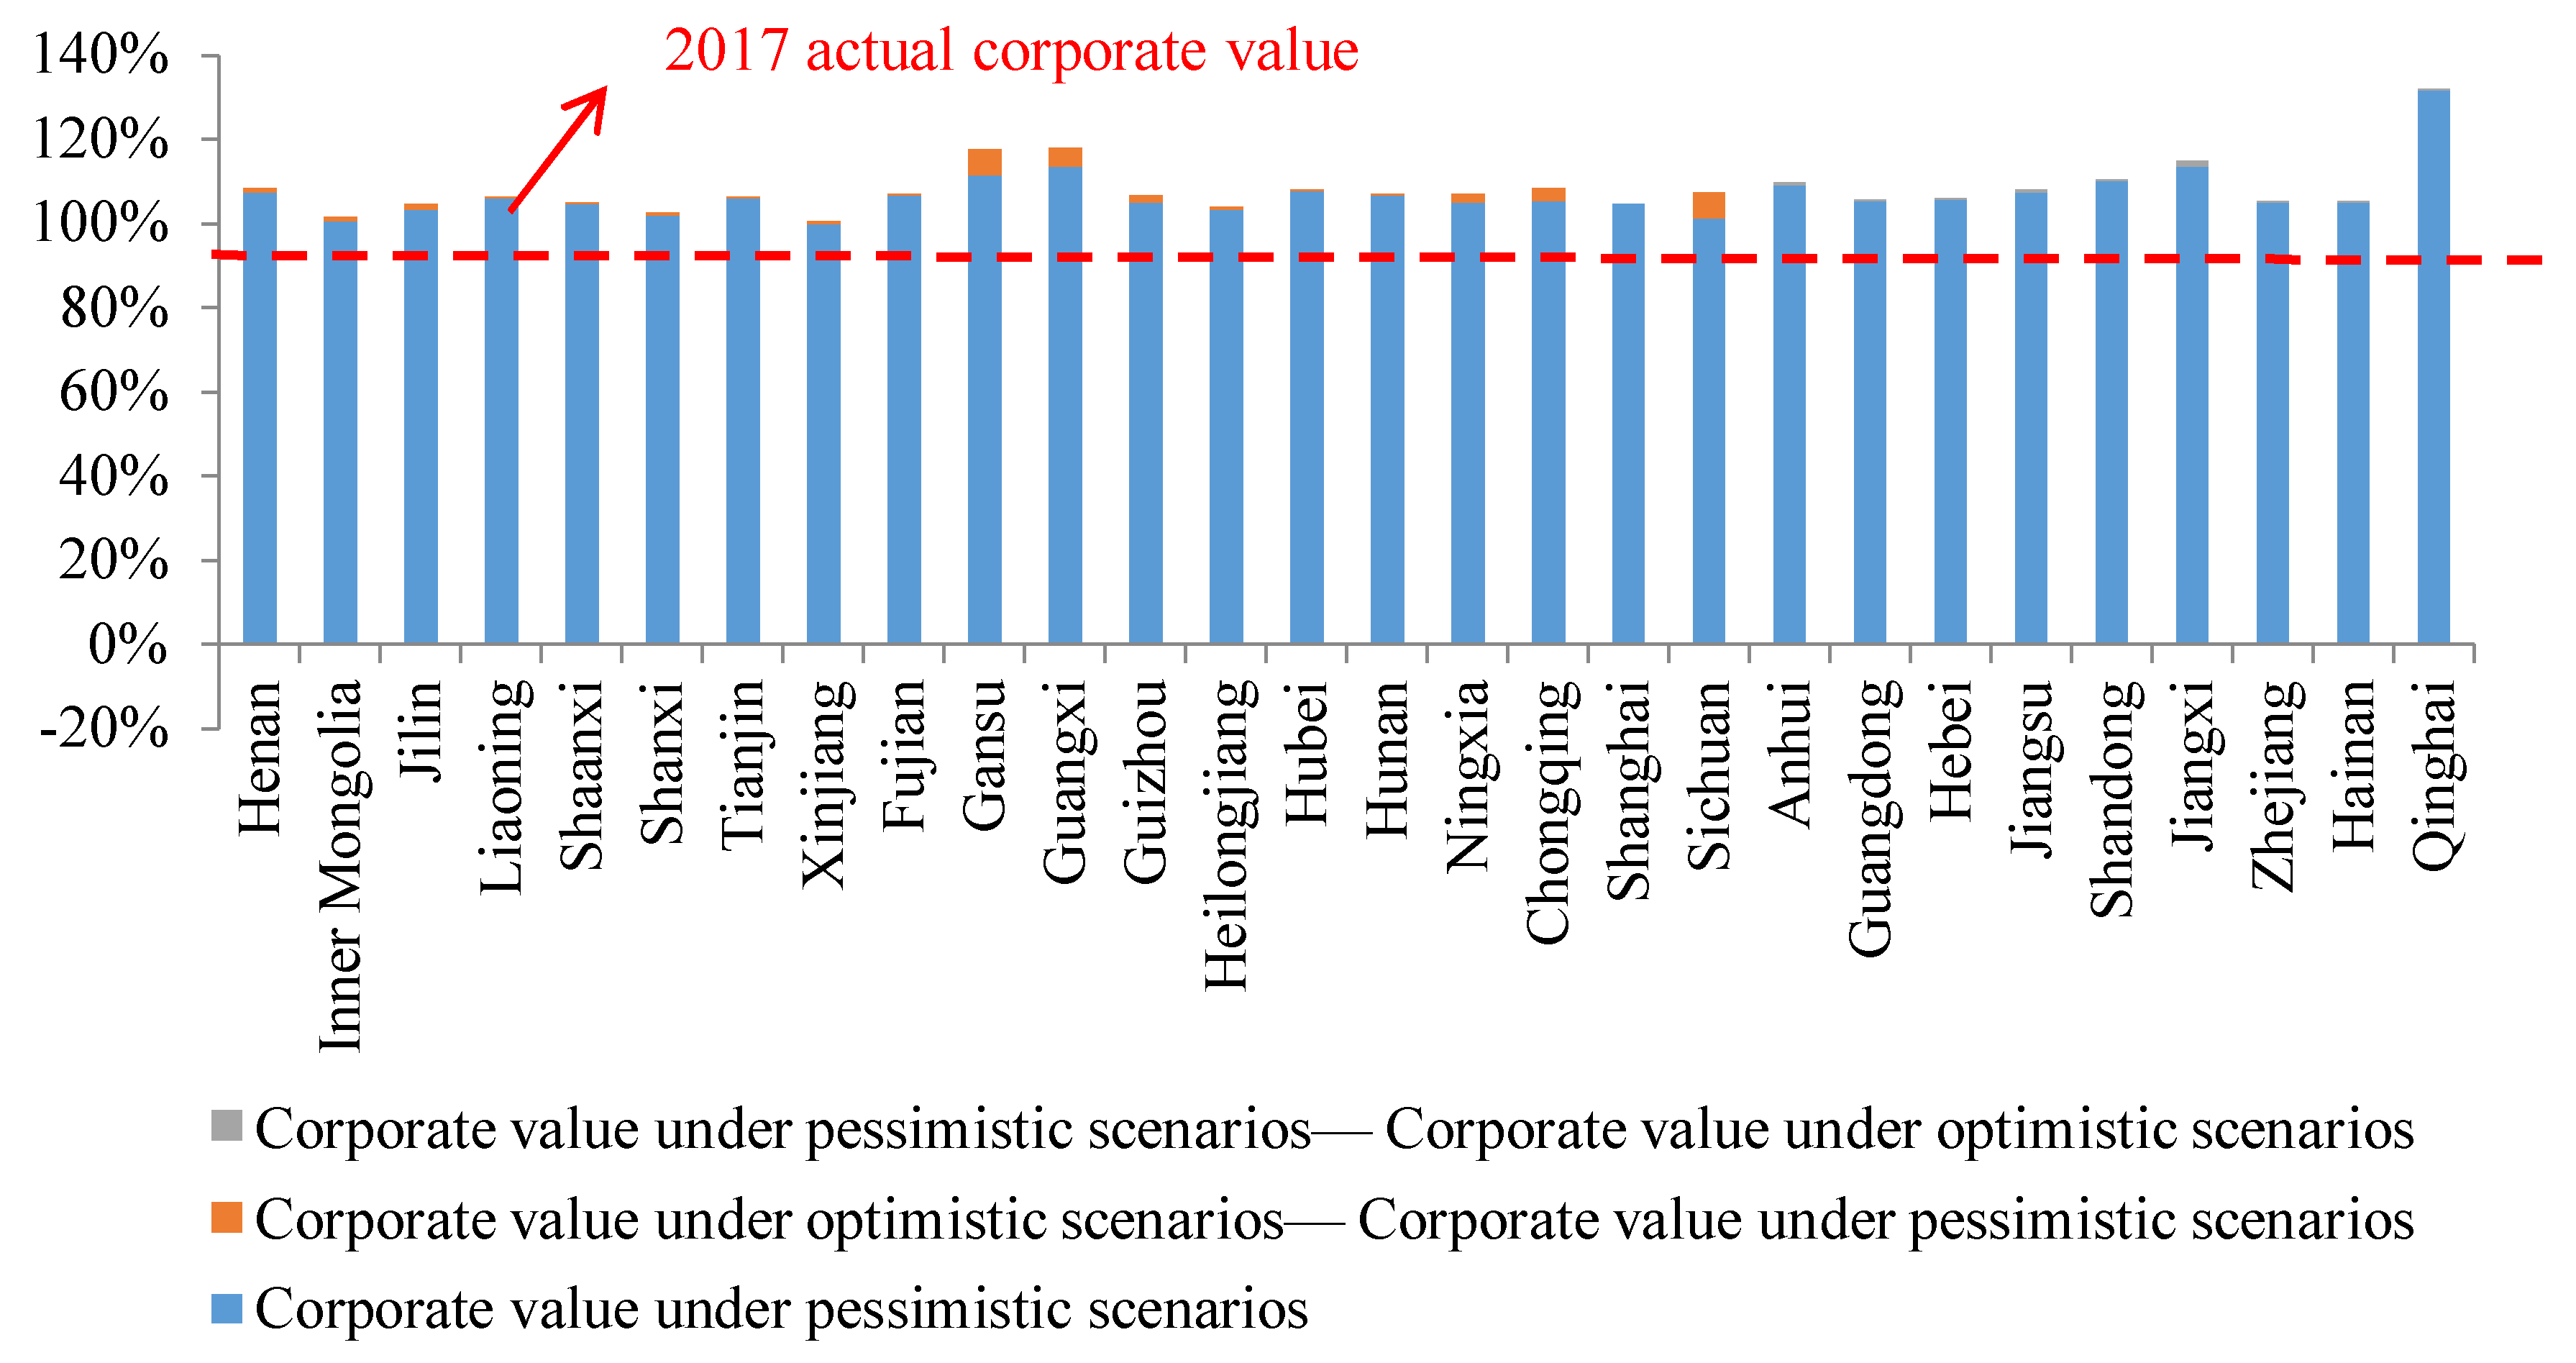
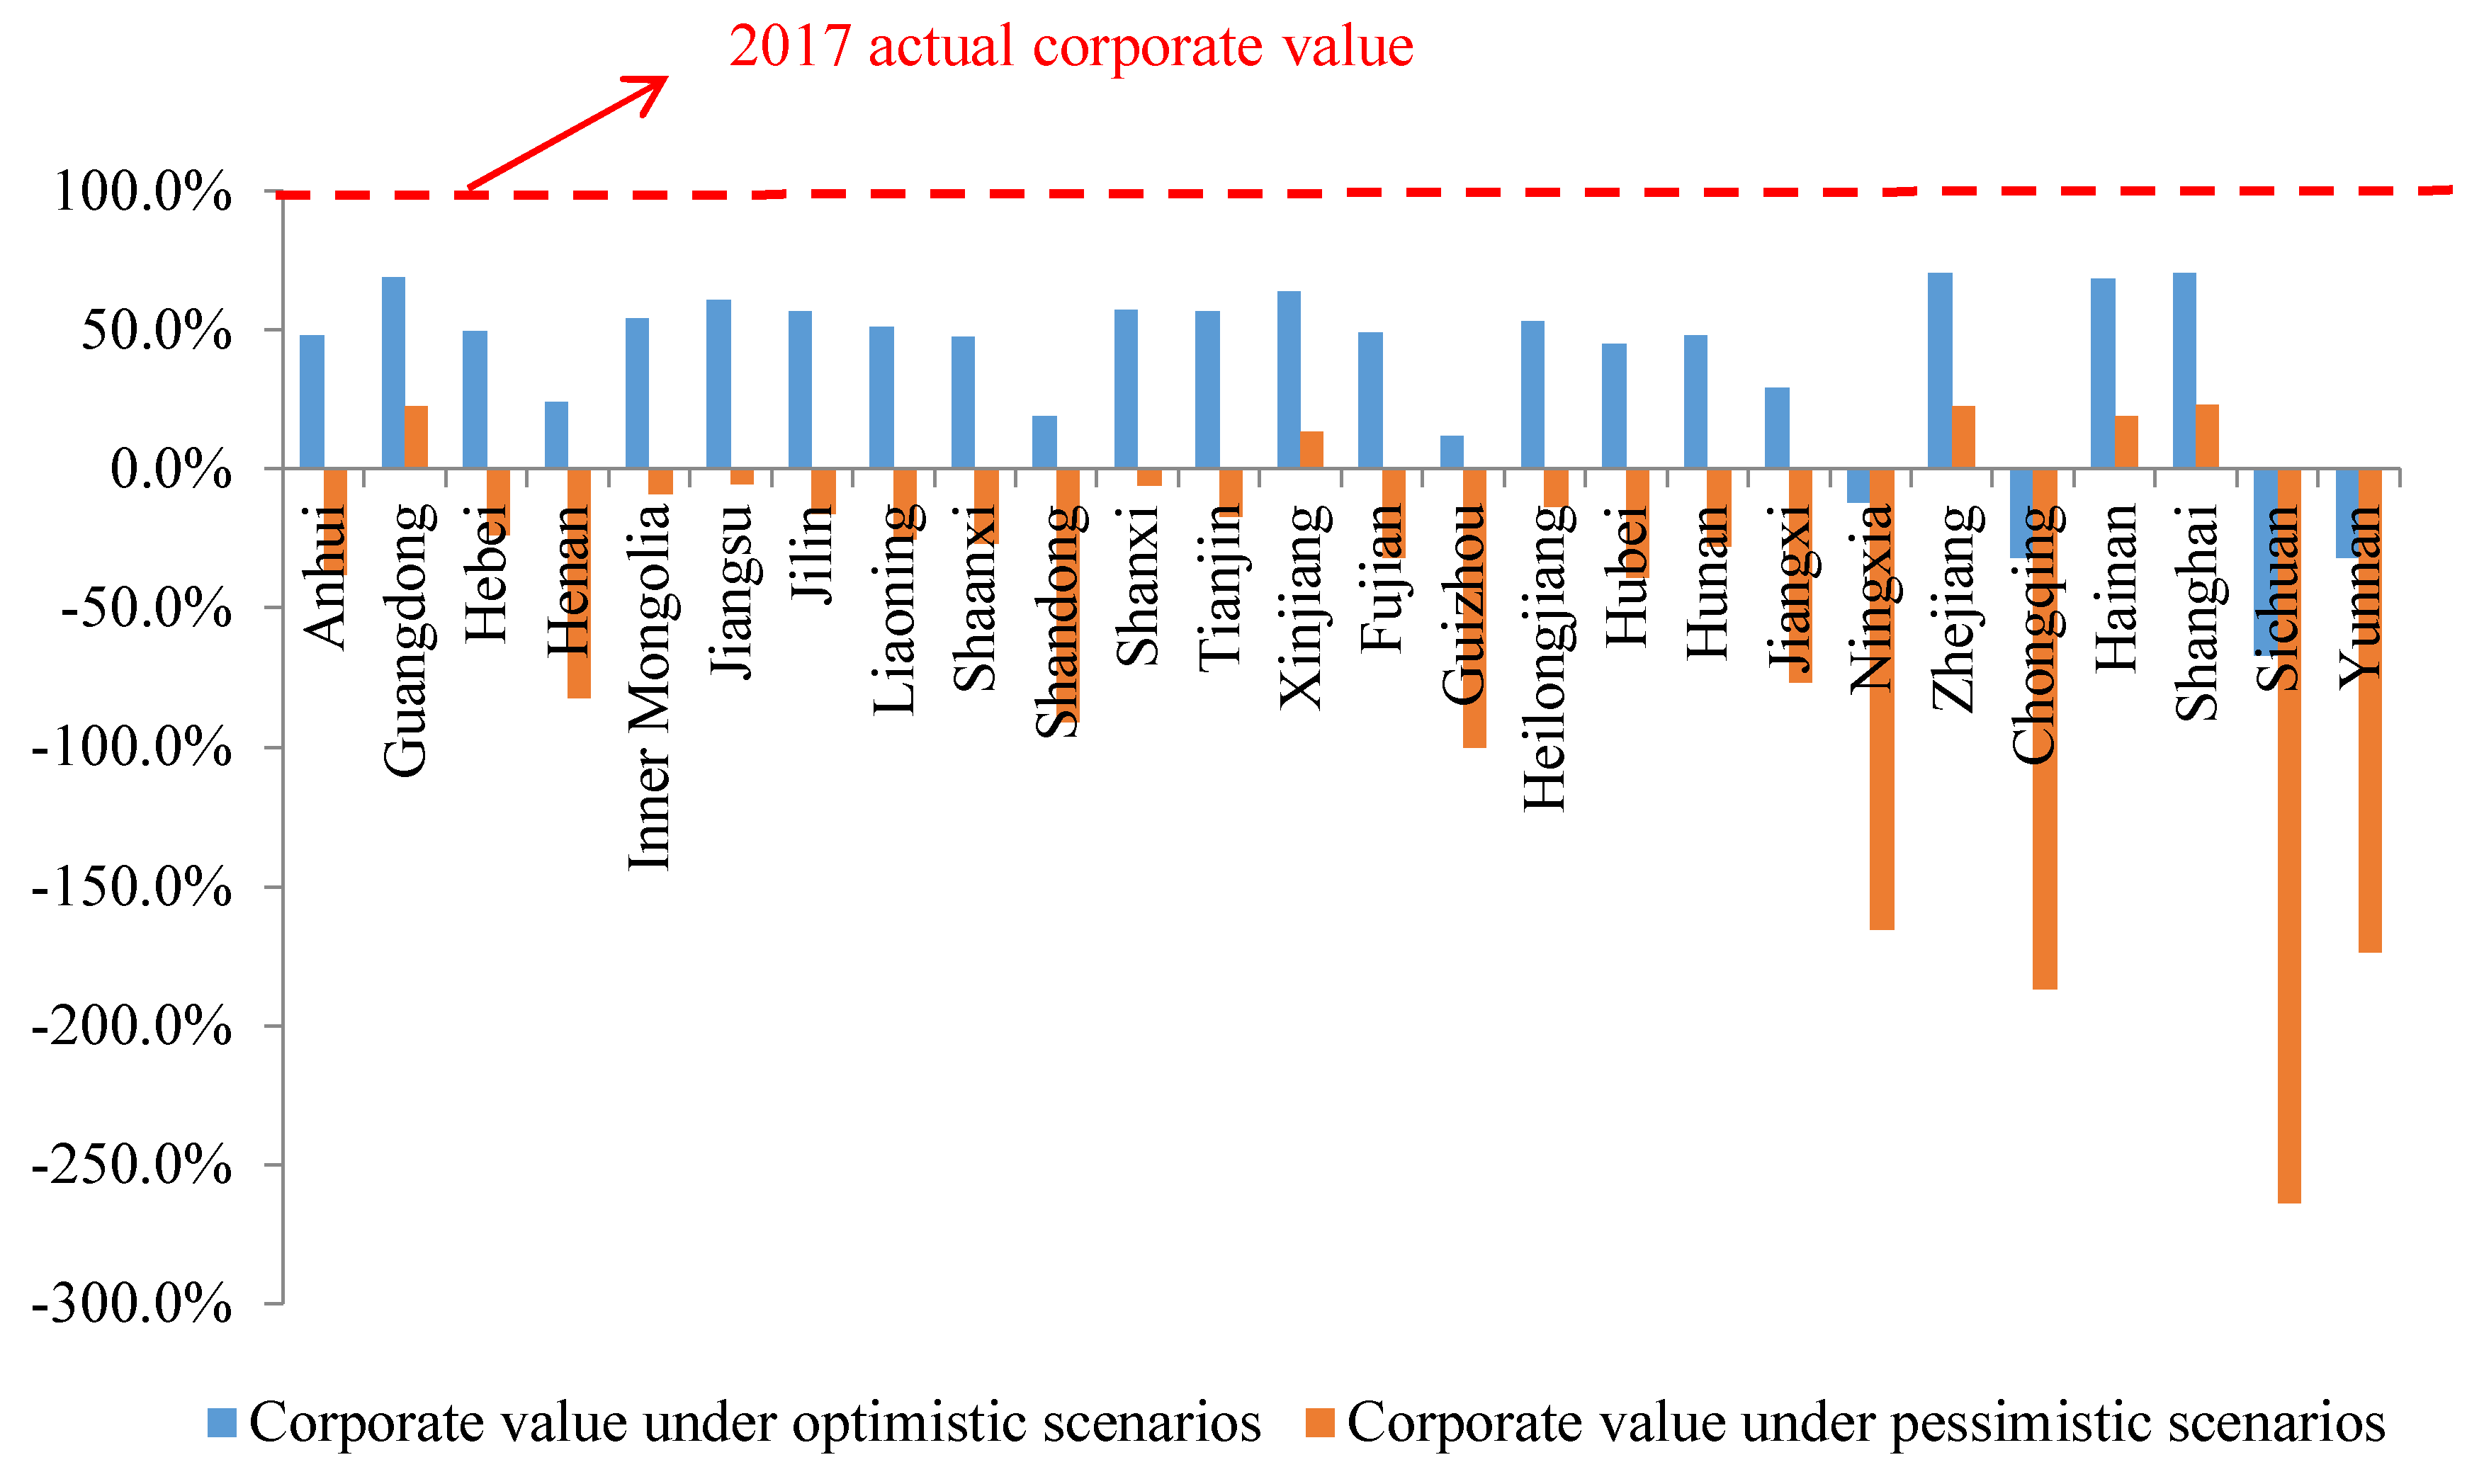
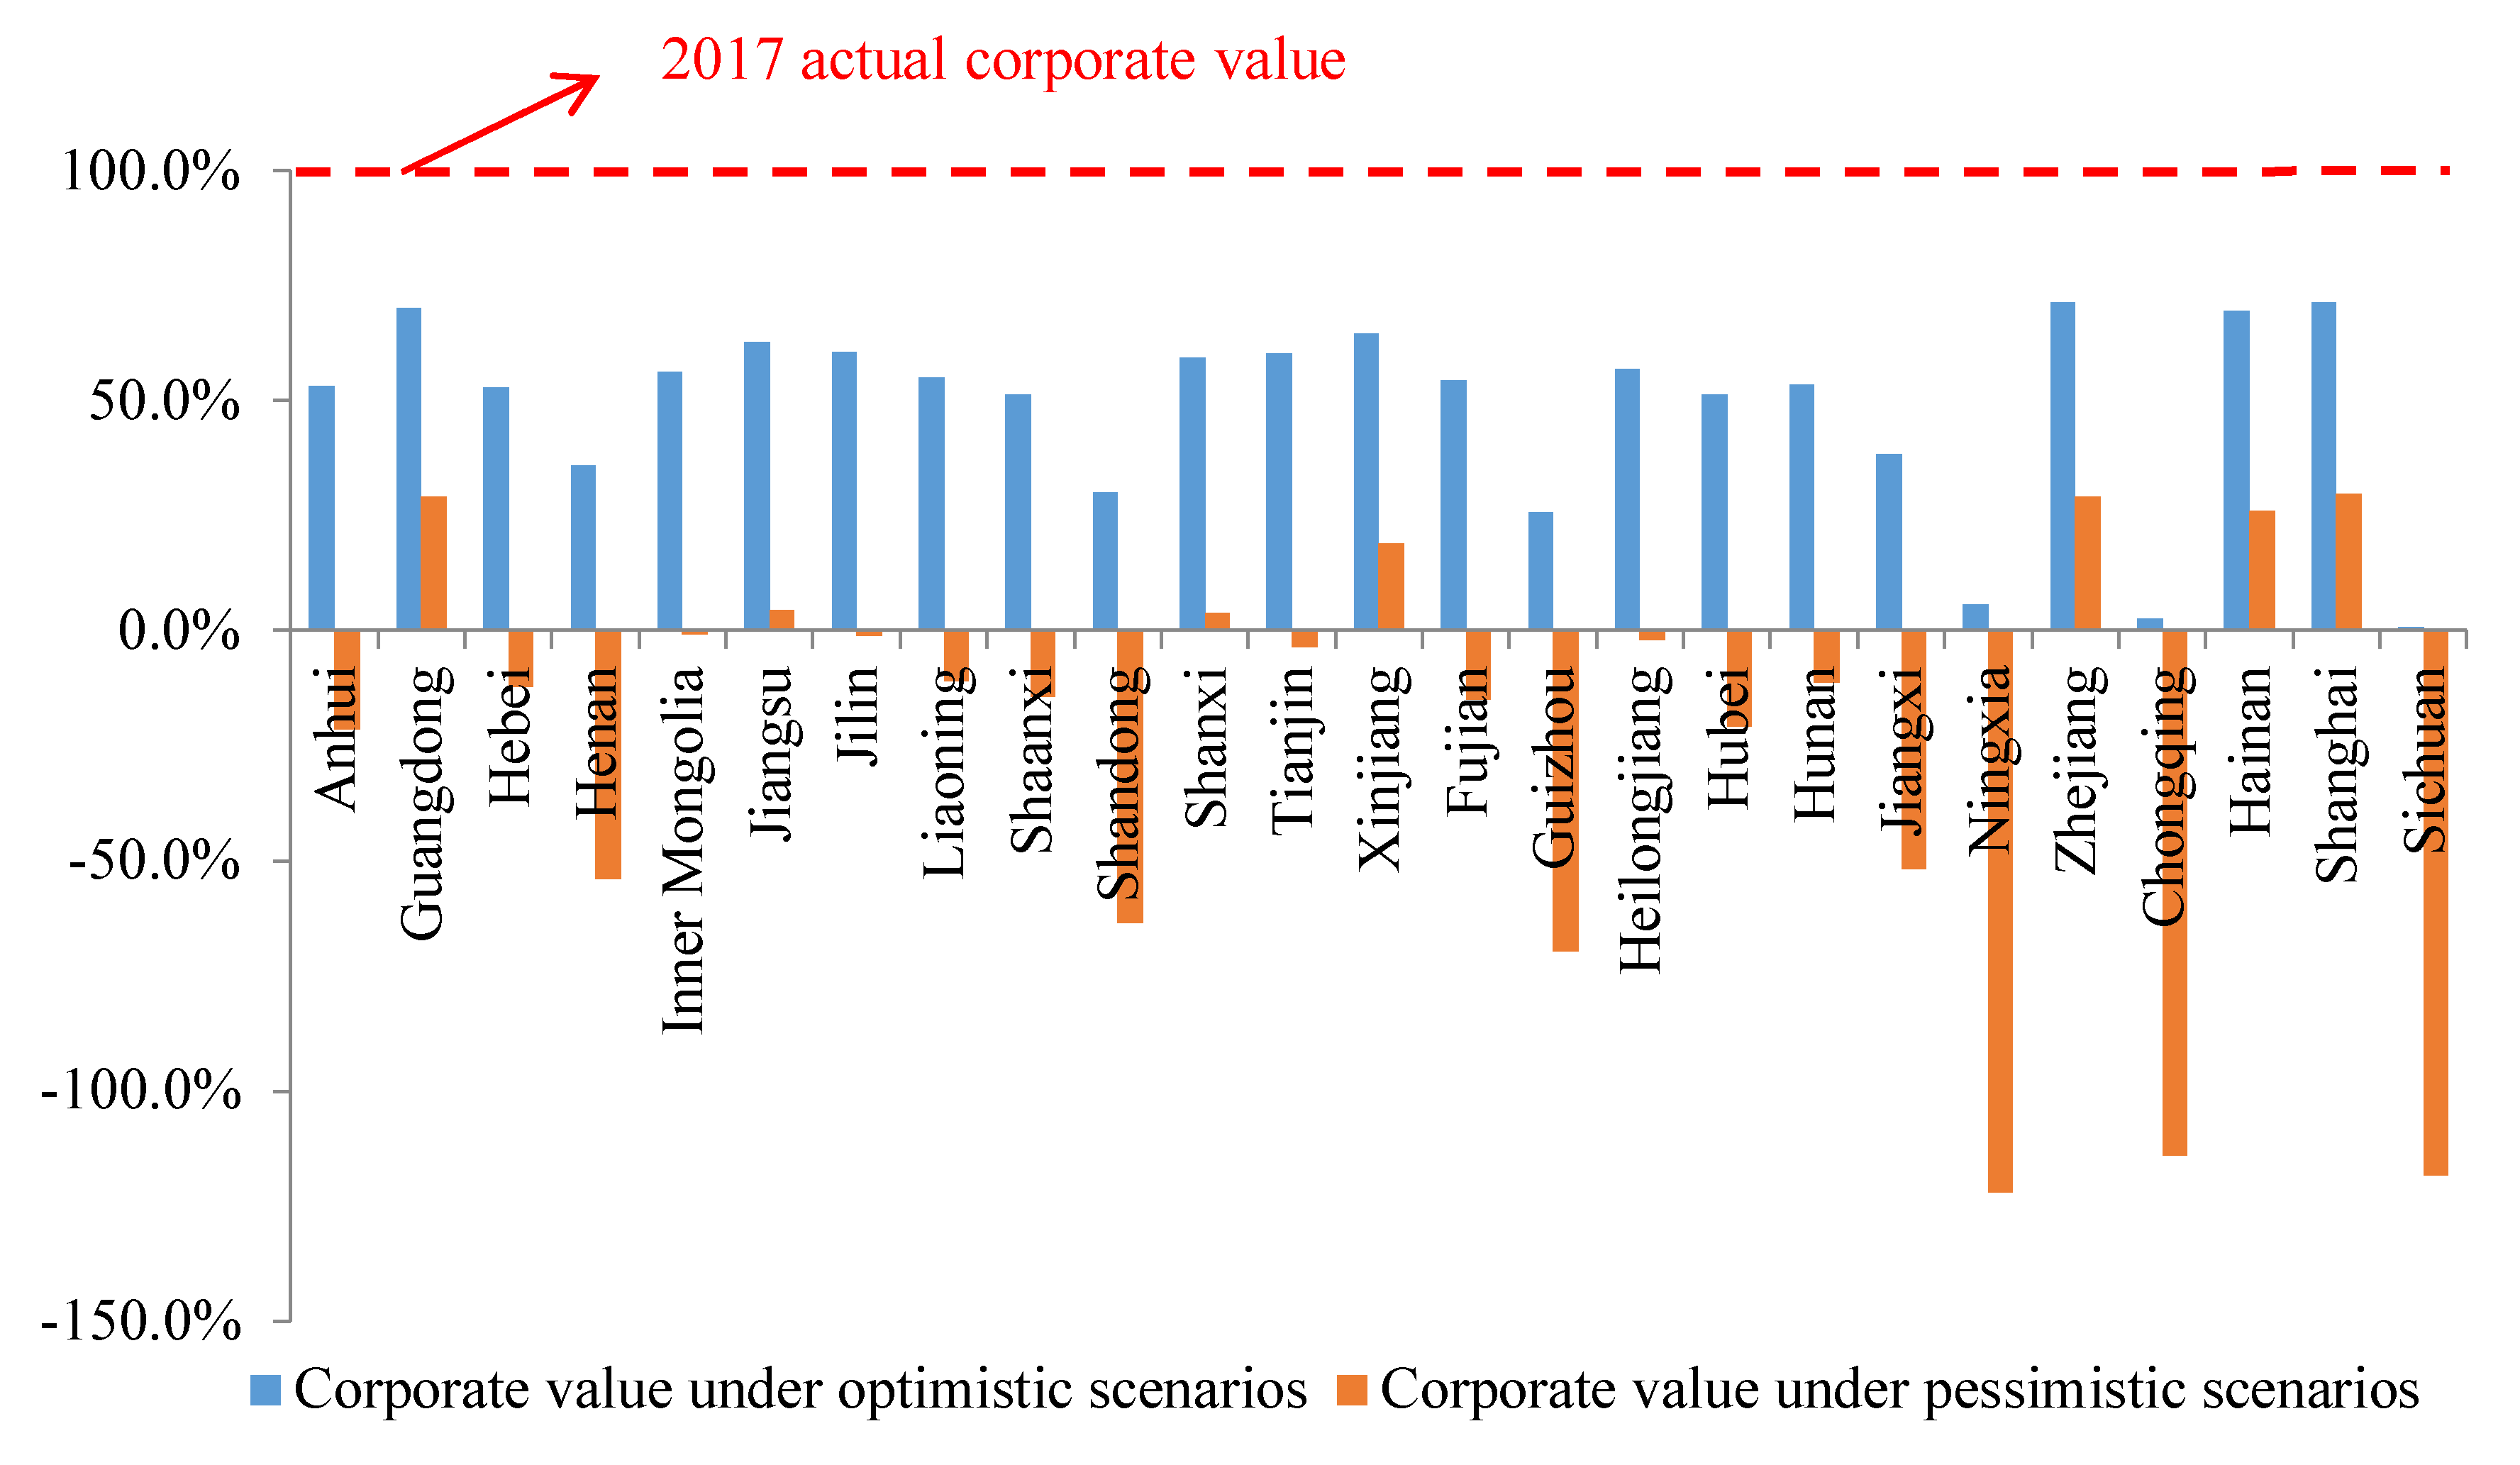
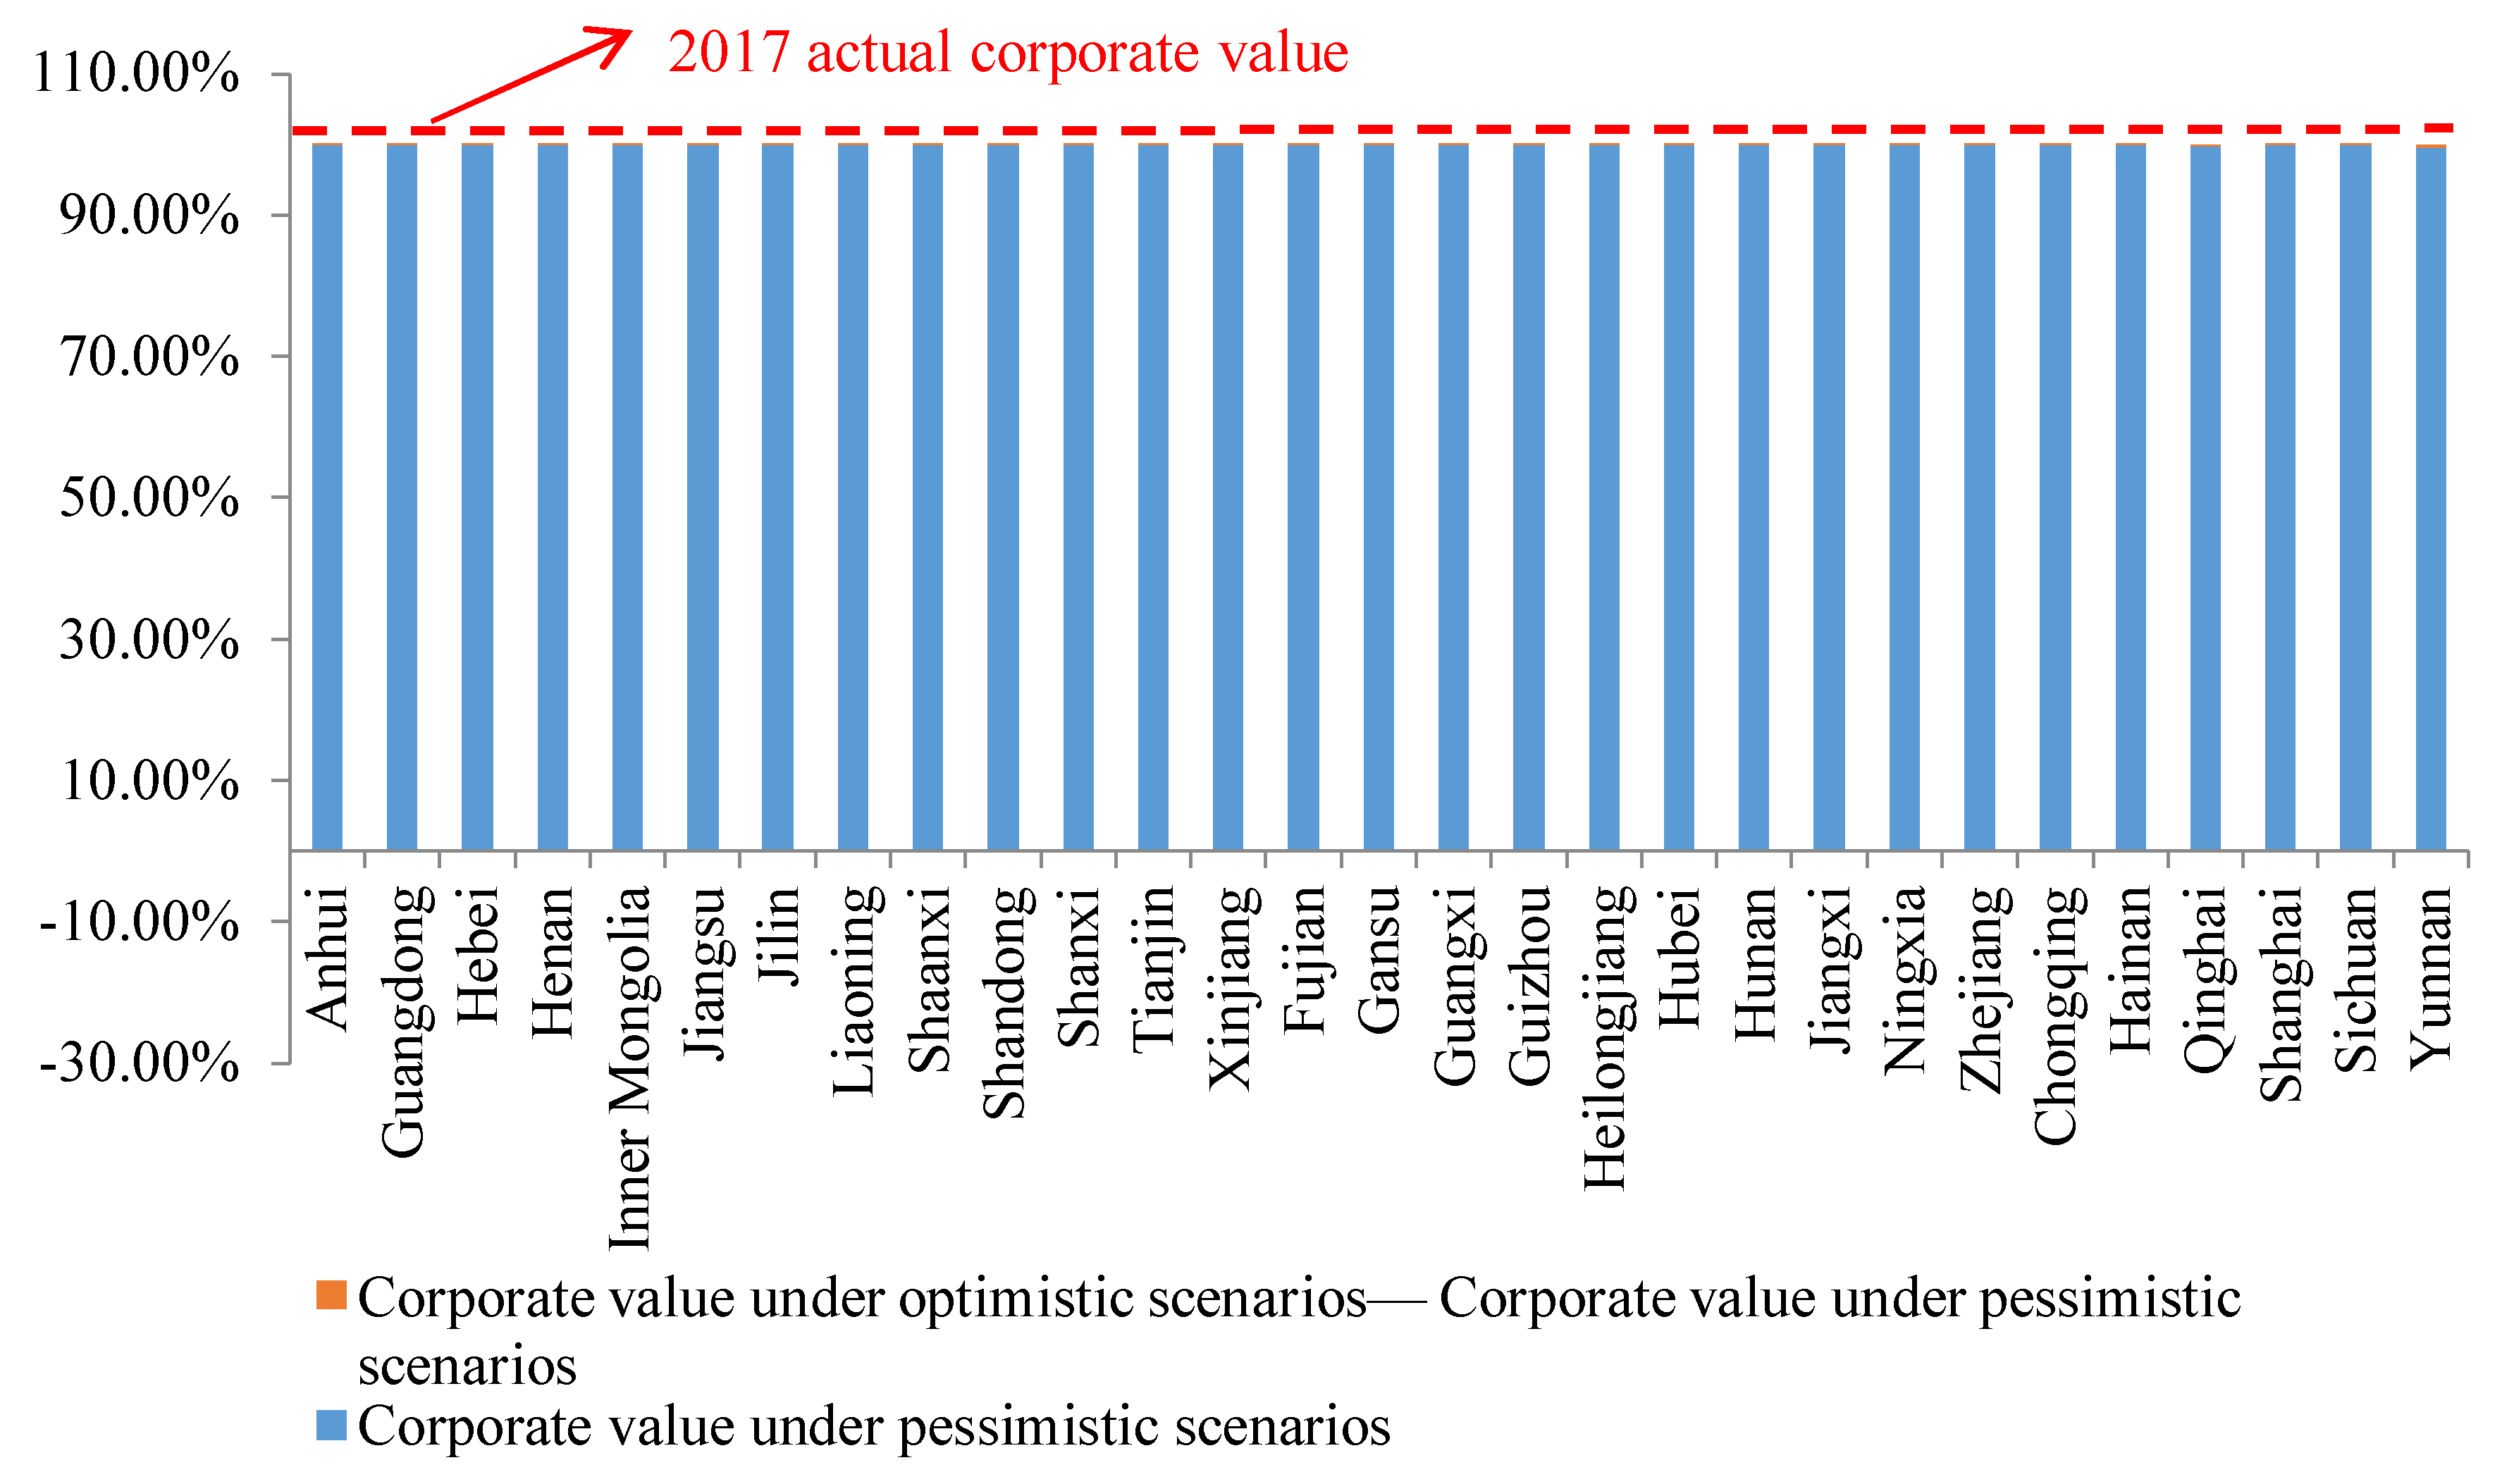
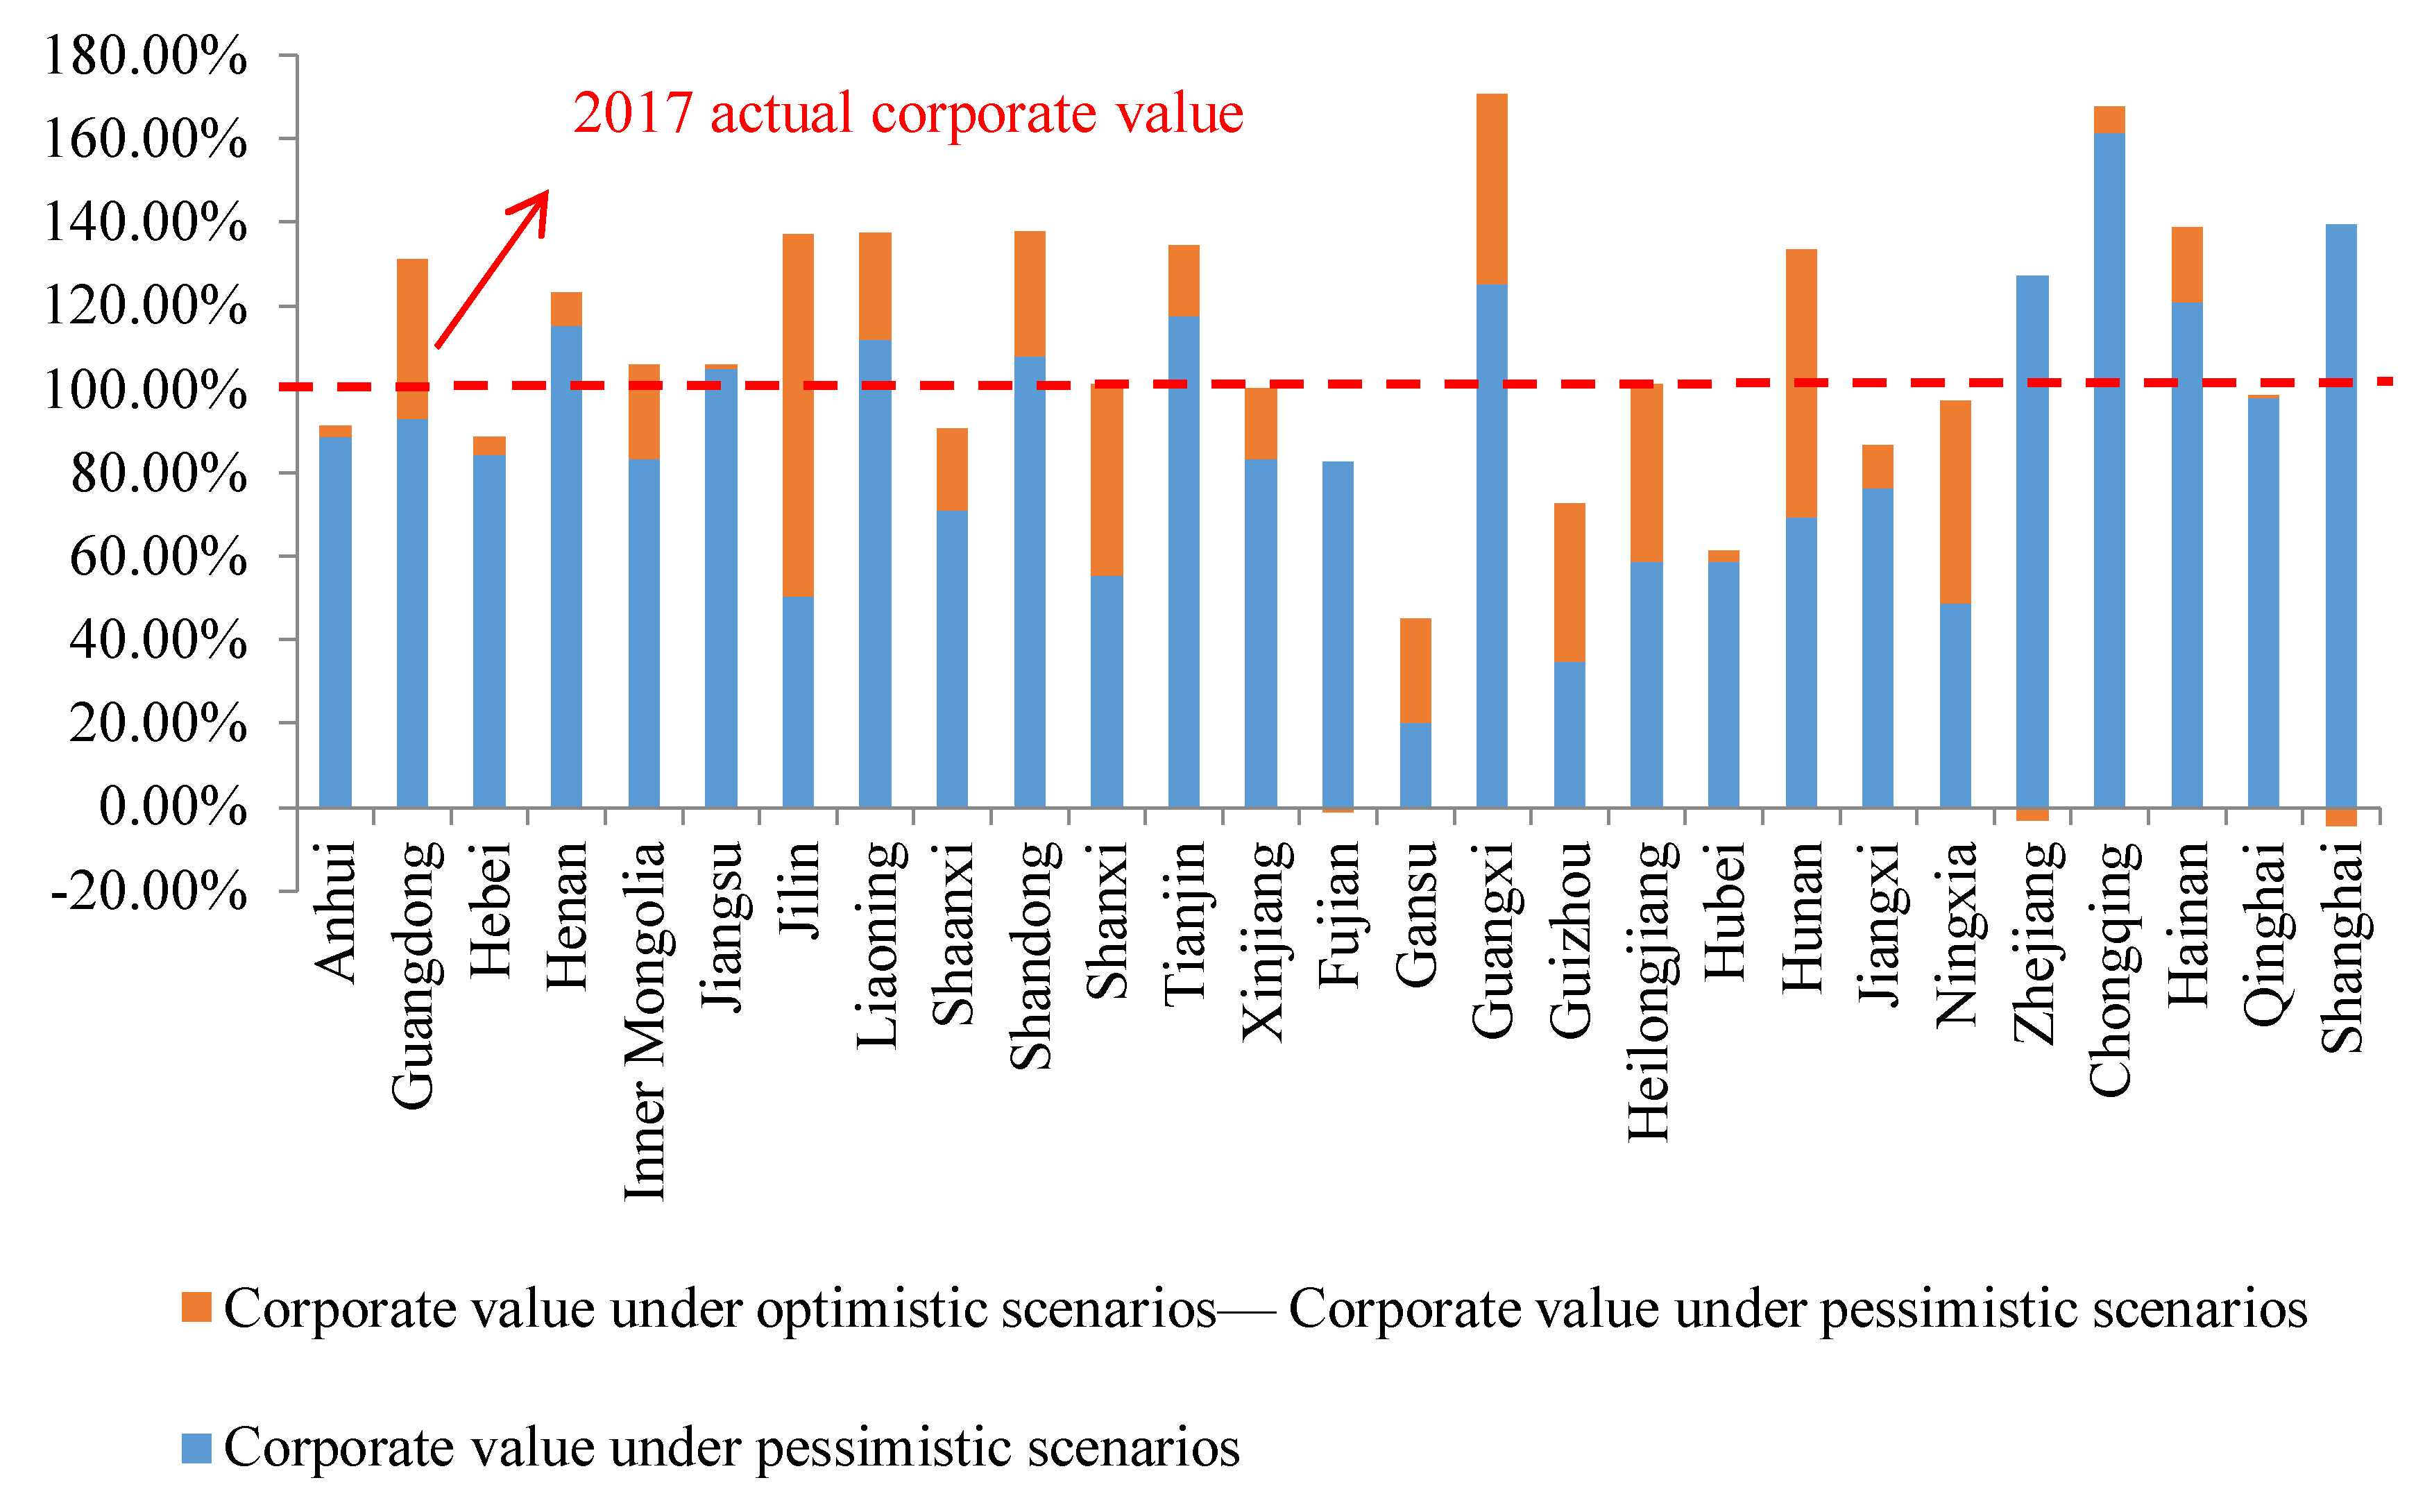
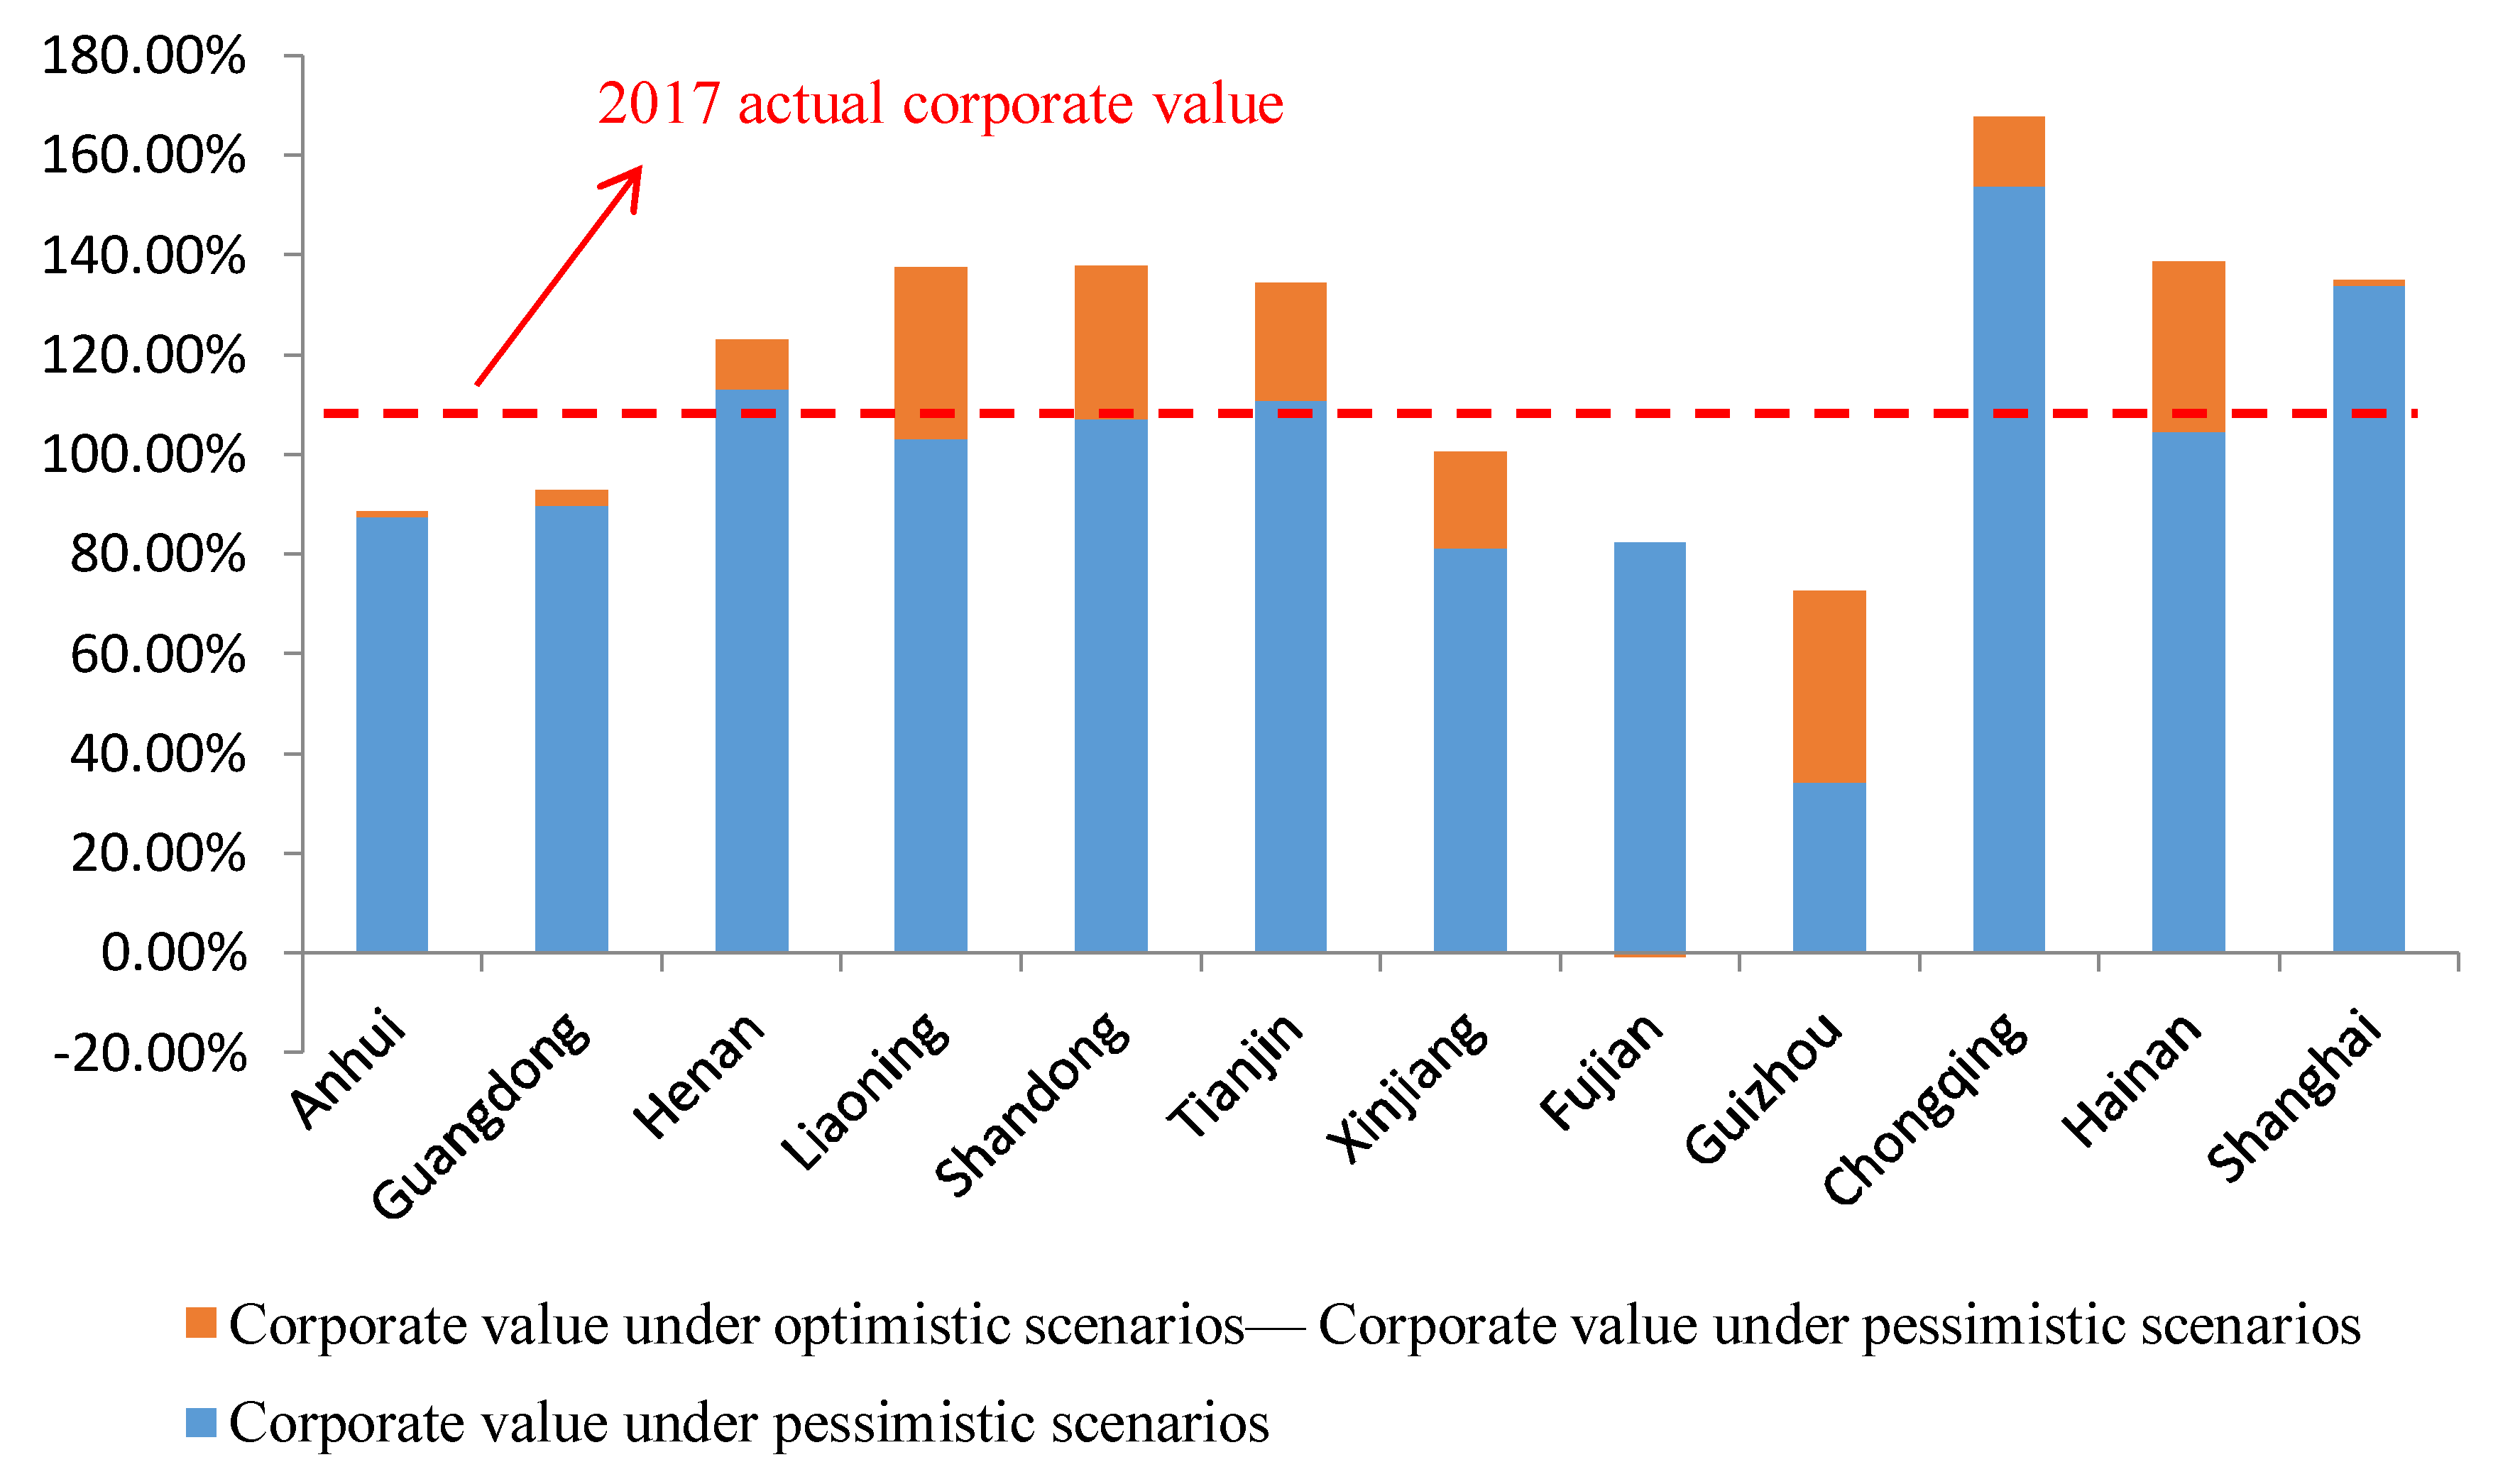
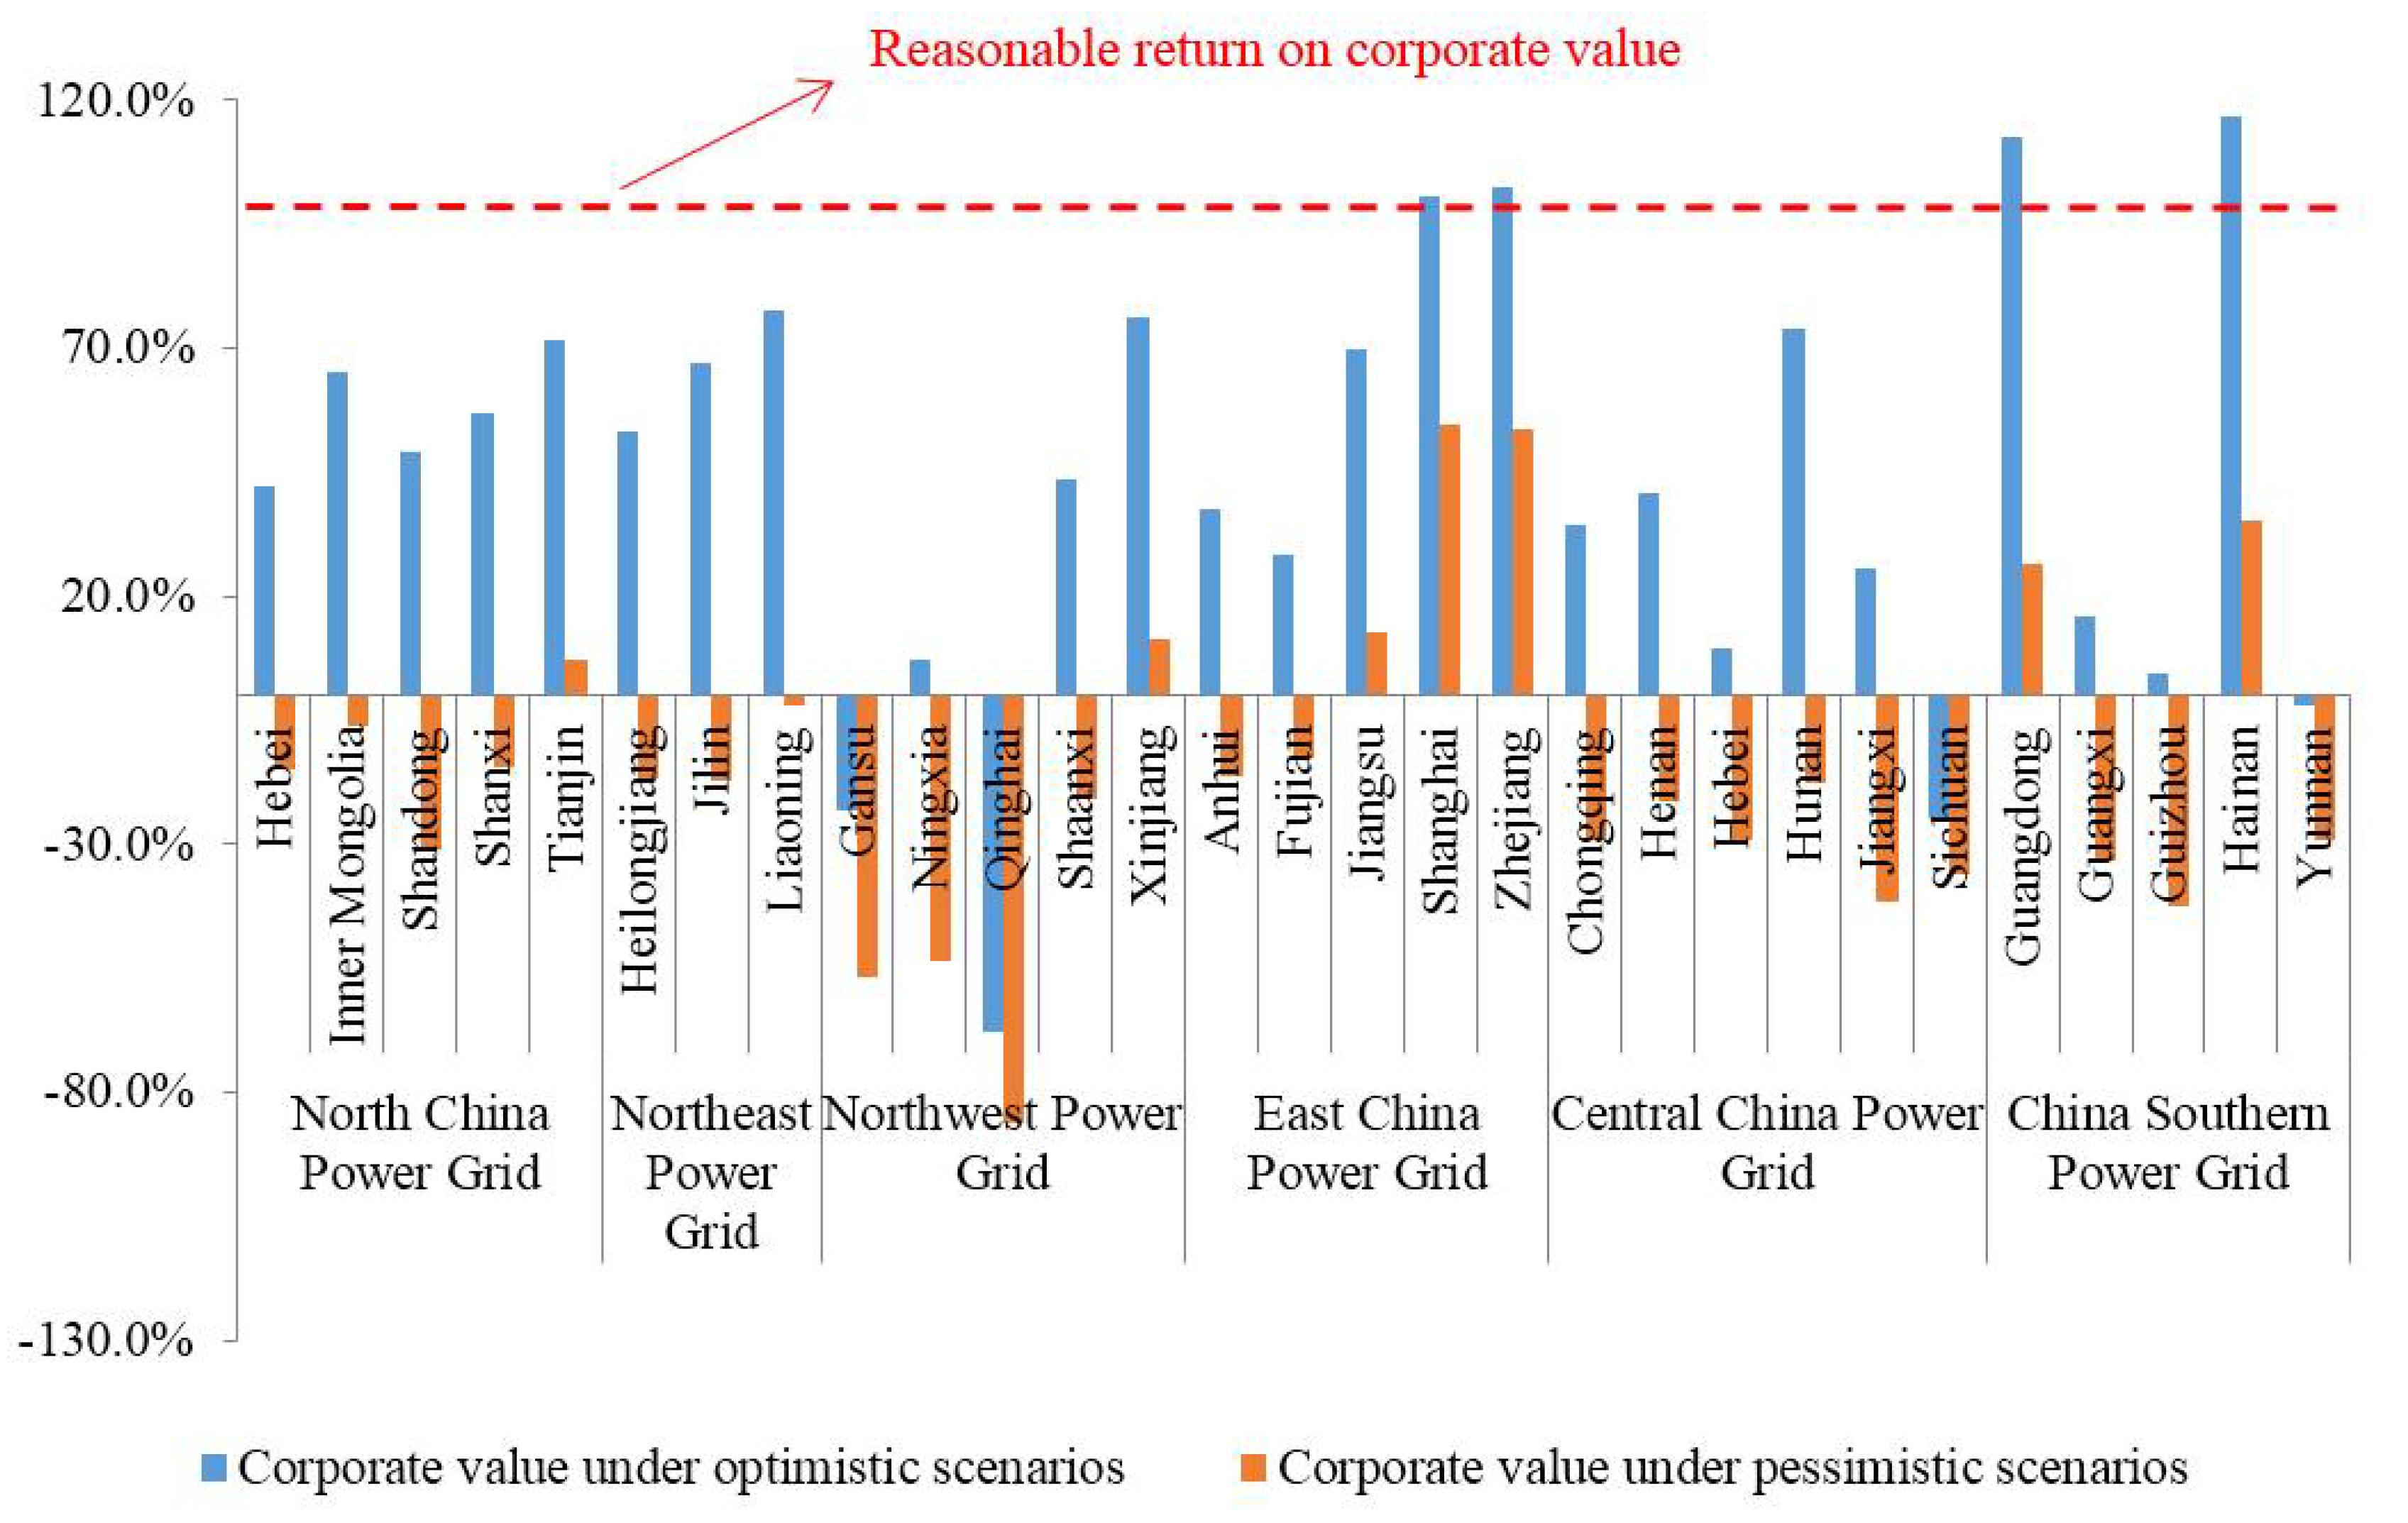
3.2.2. Comprehensive Risk Stress Test Results

The following is a comprehensive analysis of the environmental risks of newly-built 300 MW subcritical, 600 MW subcritical and 1000 MW ultra-supercritical units in various regions in 2017 (Figure 15, Figure 16 and Figure 17). It can be seen that the 1000 MW ultra-supercritical unit under the optimistic scenario and the pessimistic scenario has the smallest difference between the enterprise value and the reasonable return of corporate value. The 300 MW and 600 MW subcritical units have a serious deviation from the reasonable return due to low energy efficiency levels. From the perspective of the provinces, there is a big difference between the value of the enterprise under the two scenarios and the reasonable return of corporate value of different types of units in Gansu, Ningxia, Qinghai, Sichuan, Guizhou and Yunnan. This shows that with the deterioration of various types of environmental risks, enterprises in these areas are facing greater business pressure. In Jilin, Shanxi, Inner Mongolia, Heilongjiang and Guangdong, there is a great difference between the optimistic situation and the pessimistic situation. The main reasons are overcapacity and the pressure of the carbon market.
Since 2017, under the impact of multiple factors (such as continuous decline in the number of coal power utilization hours, gradual decline in coal power prices, collection of environmental tax and water resources tax, increase in the proportion of renewable energy and start of the national carbon market), the profitability of the coal and electricity enterprises has been low. In the long run, traditional coal power companies must adapt to the situation, and focus on the development of cleanliness, high efficiency, low carbonization, and environmental protection.

4. Conclusions and Policy Implications

4.1. Conclusions

This study establishes the research framework of the environmental stress test of coal power companies. Through the free cash flow discount model, we discuss various environmental risks faced by coal power companies and analyze the impact of specific risks on the value of coal power companies. The empirical results as follows:
In 2017, the basic risks of coal power enterprises were large without considering risk pressure factors; the actual value and value of reasonable return were seriously deviated. Only the actual corporate value of the 1000 MW ultra-supercritical units in Xinjiang, Guangdong, Anhui, Hainan, Inner Mongolia, Hebei, Jiangsu, and Shanghai exceeded reasonable return. The deviations between the actual value and the value of reasonable return of 300 MW and 600 MW units in these regions are also relatively small. The main reason for this is that economic development in these areas has brought about a high demand for electricity, and enterprises have certain profitability.
For a single risk stress test, the impact of overcapacity and carbon market risk on a firm’s value is the main risk driver that most regions face in different scenarios. Overcapacity in Jilin, Shanxi, Inner Mongolia, Heilongjiang and Guangdong is more serious, and the impact of the carbon market in the future will be enhanced. The improvement of energy efficiency levels is beneficial to the enterprise value of high-efficiency coal power plants. The risk of water resources tax and environmental protection tax will further reduce the value of coal power companies with increase of tax amounts. The provinces that have a non-water renewable energy consumption gap accomplish their goals, while also reducing the value of the assets of coal power companies.
For the comprehensive risk stress test, the enterprise value of the optimistic and pessimistic scenarios of 1000 MW ultra-supercritical units in each region has the smallest difference from the enterprise value of reasonable return. The 300 MW and 600 MW subcritical unit companies have a more serious deviation from the reasonable return value. In the two scenarios of the northwestern region, the value of the company’s return from a reasonable return differs greatly. With increase in the degree of environmental risk, the business will further deteriorate.

4.2. Implications

From the above research, environmental risk assessment and stress testing can help coal-fired power companies and financial institutions to understand the impact of environmental risks on the financial status of an enterprise and thus influence investment decisions. Based on these findings, this paper provides a number of recommendations for financial institutions, governments, investors, and power companies. Financial institutions are the core of the economy and play the role of financial intermediary. When making financial and investment decisions, financial institutions should require customers to provide environment-related information. They should put stress testing as a major component of financial business risk assessment. It can identify environmental factors that could lead to financial risks, and turn environmental factors into quantity and quality information. Environmental risks can then be incorporated into risk management and asset allocation decision systems. This study carries out environmental risk assessment at the level of coal power plants. It is recommended that financial institutions conduct environmental stress tests on coal power companies, groups, and asset portfolios based on this, and evaluate their environmental risks and their management capabilities, and consider them as major considerations in providing financial products and services. As financial institutions fully consider environmental factors, financial institutions and services will invest more in green fields and enterprises. It will be more difficult for enterprises with poor environmental performance to obtain financing. Currently environmental stress testing methods and tools are not mature. Most of them are sensitivity analysis and scenario analysis. The research of different institutions lacks comparability in scenario assumptions and statements. In the future, it is necessary to strengthen the cooperation between financial institutions and corporate stakeholders, and share methods, tools, and data for environmental risk analysis.
The report of the Nineteenth Party Congress marked the ‘beautiful ecology’ into the important goal of the building of a powerful modern socialist country. It clearly stated that we must develop green finance and promote green development. The government should speed up the construction of a green financial security system, and start the green financial reform as soon as possible. It is advised that the key tasks of the green financial reform during the 13th Five-Year Plan period be clarified. It is also advised that the priority breakthroughs in key areas should be promoted, including the construction of green banks, development of green bonds, and establishment of green funds. At the same time, the government should strengthen macro-control and include environmental cost information disclosure in corresponding laws and regulations. Relevant policies should be formulated to encourage companies to disclose specific environmental information. The key information such as major pollution emission indicators must be disclosed on a regular basis, so that companies, especially listed companies, can disclose their environmental information. With increasing pressure on environmental risks, the government should encourage companies to conduct stress tests on environmental risks on a regular basis, develop compliance inspection and audit procedures, and consider penalties for companies with poor environmental performance. This will motivate the company to strengthen its own reforms, raise the level of risk management, and effectively assume responsibility for risk management.
Investors in financial markets can use this stress testing framework to establish an appropriate risk assessment model. It can consider the types of environmental risks and levels of risks of various financial investment products, and conduct comprehensive assessments of physical risks, transition risks, and policy risks. According to the financial investment risk assessment results, the risk and benefits arising from the financial investment process are rationally allocated. For different financial investments, it is necessary to carry out classified control, and make investment portfolios that are conducive to their own development and that can minimize the risk of financial investment. Investors need to firmly establish risk awareness, clarify their responsibilities and obligations, and continue to track and study the evolution of potential portfolio investment risks, and effectively avoid investment risks.
The most important environmental risk assessment is the availability and accuracy of environmental information. Power companies need to disclose not only financial information, but also social responsibility data (which include details that pertain to climate and the environment). It is recommended that enterprises further establish and improve an environmental information database to ensure transparency. As market competition and environmental risks intensify, power companies should conduct comprehensive risk management in light of the actual situation of the company, and enhance the ability to prevent and respond to environmental risks. It should establish a risk responsibility system, clear incentives and penalties, and clarify responsibilities and obligations. It also should incorporate environmental risks into the overall macro decision-making system to comprehensively improve the level of environmental risk governance.

Author Contributions

J.Y. designed the research framework; M.W. conducted the analysis and drafted the paper; W.Z. and Y.G. collected the data for analysis and polished the manuscript; M.X. provided valuable opinions during the revision.

Acknowledgments

The paper is supported by the National Natural Science Foundation of China (71673085), the Fundamental Research Funds for the Central Universities (2018ZD14), the research on the forming mechanism of clean energy price and the finance and taxation policy in Beijing (2016BJ0283) and the 111 Project (B18021). We also appreciate the funding by Energy Foundation to support the work reported in this paper.

Conflicts of Interest

The authors declare no conflict of interest. Finance and Taxation Policy.

References

  1. United Nations Framework Convention on Climate Change (UNFCCC). Intended Nationally Determined Contributions (INDCs). 2015. Available online: http://www4.unfccc.int/submissions/indc/Submission%20Pages/submissions.aspx (accessed on 4 November 2017).
  2. G20 Green Finance Study Group. G20 Green Finance Synthesis Report; G20 Green Finance Study Group: Hamburg, Germany, 2017. [Google Scholar]
  3. Fender, I.; Gibson, M.S.; Mosser, P.C. An International Survey of Stress Tests. Curr. Issues Econ. Financ. 2001, 7, 233–246. [Google Scholar]
  4. Alexander, C.; Sheedy, E. Developing a stress testing framework based on market risk models. J. Bank. Financ. 2008, 32, 2220–2236. [Google Scholar] [CrossRef]
  5. Blashke, W.; Jones, M.T.; Majnoni, G.; Peria, S.M. Stress Testing of Financial Systems: An Overview of Issues, Methodologies, and FSAP Experiences; IMF WP, No. 88; IMF: Washington, DC, USA, 2001. [Google Scholar]
  6. Goldstein, M. Bank Stress Tests and Financial Stability: Lessons from the 2009-14 US and EU_Wide Tests for Asian Emerging Economics; Peterson Institute for International Economics Working Paper; Peterson Institute for International Economics: Washington, DC, USA, 2015. [Google Scholar]
  7. Peura, S.; Jokivuolle, S. Simulation based stress tests of banks’ regulatory capital adequacy. J. Bank. Financ. 2004, 28, 1801–1824. [Google Scholar] [CrossRef]
  8. Ba, S.S.; Zhu, Y.Q. Application of Stress Test in Bank Risk Management. Economist 2010, 2, 70–79. [Google Scholar]
  9. Xu, M.D.; Liu, X.X. Financial system stability assessment: An international comparison based on macro stress testing methods. Int. Financ. Res. 2008, 2, 39–46. [Google Scholar]
  10. ICBC of China Environmental Stress Test Group; Zhang, H.L.; Zhou, Y.Q.; Ma, J.; Yin, H.; Ma, S.H.; Le, Y.; Yang, X.; Qiu, M.Y. Influence of environmental factors on credit risk of commercial banks—Research and application of stress test based on industrial and commercial bank of China. Financ. Forum 2016, 21, 3–16. [Google Scholar]
  11. TRUCOST, ICBC. Environmental Cost Internalization and Environmental Risk Analysis: A Case Study of Aluminum Industry in China; TRUCOST, ICBC: Beijing, China, 2017. [Google Scholar]
  12. International Institute of Green Finance. Asset Management Industry Environmental Stress Test Research Report; International Institute of Green Finance: Beijing, China, 2017. [Google Scholar]
  13. TRUCOST. Potential Costs of China’s Coal Chemical Industry: Pressure Testing Framework for Environmental Risk Investment; TRUCOST: London, UK, 2017. [Google Scholar]
  14. Zhao, X.L.; Cai, Q.; Ma, C.; Hu, Y.; Luo, K.; Li, W. Economic evaluation of environmental externalities in China’s coal-fired power generation. Energy Policy 2017, 102, 307–317. [Google Scholar] [CrossRef]
  15. Krautz, H.-J.; Lisk, A.; Posselt, J.; Katzer, C. Impact of renewable energies on the operation and economic situation of coal fired power stations: Actual situation of coal fired power stations in Germany. Front. Energy 2017, 11, 119–125. [Google Scholar] [CrossRef]
  16. Yuan, J.H.; Zhao, C.H.; Yu, S.; Hu, Z. Electricity consumption and economic growth in China: Cointegration and co-feature analysis. Energy Econ. 2007, 29, 1179–1191. [Google Scholar] [CrossRef]
  17. Yuan, J.H.; Xu, Y.; Hu, Z.; Zhao, C.; Xiong, M.; Guo, J. Peak energy consumption and CO2 emissions in China. Energy Policy 2014, 68, 508–523. [Google Scholar] [CrossRef]
  18. National Development and Reform Commission (NDRC). Notice on Doing well the Work of Planning and Construction after Decentralization of Power Project Approval. 2015. Available online: http://www.nea.gov.cn/2015-11/26/c_134856367.htm (accessed on 4 November 2017).
  19. NDRC. Notice on Promoting Orderly Development of Coal Electricity in China. 2016. Available online: http://www.ndrc.gov.cn/zcfb/zcfbtz/201604/t20160425_798979.html (accessed on 17 March 2016).
  20. Polaris Power Net. Global Coal-Fired Power Plant Tracking 2018: China Continues to Rank First in the World in the Construction of Coal-Fired Power Capacity (95 GW) and There Are Still 116 GW of Planned Production Capacity! 2018. Available online: http://news.bjx.com.cn/html/20180327/888023.shtml (accessed on 27 March 2018).
  21. Yuan, J.H.; Li, P.; Wang, Y.; Liu, Q.; Shen, X.; Zhang, K.; Dong, L. Coal power overcapacity and investment bubble in China during 2015–2020. Energy Policy 2016, 97, 136–144. [Google Scholar] [CrossRef]
  22. Zhao, C.H.; Zhang, W.R.; Wang, Y.; Liu, Q.; Guo, J.; Xiong, M.; Yuan, J. The economics of coal power generation in China. Energy Policy 2017, 105, 1–9. [Google Scholar] [CrossRef]
  23. Yuan, J.H.; Wang, Y.; Zhang, W.R.; Zhao, C.H.; Liu, Q.; Shen, X.; Zhang, K.; Dong, L. Will recent boom in coal power lead to a bust in China? A micro-economic analysis. Energy Policy 2017, 108, 645–656. [Google Scholar] [CrossRef]
  24. Polaris Power Net. Current Situation and Development Trend of Energy Saving Technology in Coal Power Plants. 2016. Available online: http://huanbao.bjx.com.cn/news/20160321/717860.shtml (accessed on 21 March 2016).
  25. Copeland, T.; Koller, T.; Murrin, J. Valuation: Measuring and Managing the Value of Companies; John Wiley & Sons: New York, NY, USA, 2000; pp. 212–214. [Google Scholar]
  26. Copeland, T.; Koller, T.; Murrin, J. Valuation; John Wiley & Sons: New York, NY, USA, 1990. [Google Scholar]
  27. Shiller, R.J. Do stock prices move too much to be justified by subsequent changes in dividends. Am. Econ. Rev. 1981, 71, 421–436. [Google Scholar]
  28. Yao, J.-S.; Ouyang, L.-Y.; Chang, H.-C. Models for a fuzzy inventory of two replaceable merchandises without backorder based on the signed distance of fuzzy sets. Eur. J. Oper. Res. 2003, 150, 601–616. [Google Scholar] [CrossRef]
  29. Frank, M.Z.; Shen, T. Investment and the weighted average cost of capital. J. Financ. Econ. 2016, 119, 300–315. [Google Scholar] [CrossRef]
  30. NDRC. Coal Energy Saving and Emission Reduction Upgrade and Transformation Action Plan (2014–2020). 2014. Available online: http://www.ndrc.gov.cn/gzdt/201409/t20140919_626240.html (accessed on 12 September 2014).
  31. Ministry of Ecology and Environment of the People’s Republic of China. People’s Republic of China Environmental Protection Tax Law. 2017. Available online: http://www.zhb.gov.cn/gzfw_13107/zcfg/fl/201704/t20170417_411610.shtml (accessed on 17 April 2017).
  32. Polaris Power Net. What Is the Operation of the “Countdown” to “Tax” in the Countdown of Environmental Taxes? 2017. Available online: http://huanbao.bjx.com.cn/news/20171103/859464.shtml (accessed on 3 November 2017).
  33. NDRC. China Submits National Independent Contribution Document to Address Climate Change. 2015. Available online: http://zys.ndrc.gov.cn/xwfb/201506/t20150630_710182.html (accessed on 30 June 2015).
  34. NDRC. Notice on Printing and Distributing the “National Carbon Emission Trading Market Construction Plan (Power Generation Industry)”. 2017. Available online: http://www.ndrc.gov.cn/gzdt/201712/t20171220_871134.html (accessed on 18 December 2017).
  35. Sohu net. Suggestions on the National Carbon Market: Reference and Significance of RGGI. 2017. Available online: http://www.sohu.com/a/211684932_289755 (accessed on 20 December 2017).
  36. Polaris Power Net. National Carbon Trading Quota Allocation Plan (Discussion Draft) Announced. 2017. Available online: http://news.bjx.com.cn/html/20170511/824893.shtml (accessed on 11 May 2017).
  37. Greenpeace. China Coal Power Overcapacity and Water Resources Pressure Study Report; Greenpeace: Amsterdam, The Netherlands, 2017. [Google Scholar]
  38. Greenpeace; Sierra Club; Coal Swarm. Boom and Bust 2018: Tracking the Global Coal Plant Pipeline. 2018. Available online: https://endcoal.org/global-coal-plant-tracker/reports/boom-bust-2018/ (accessed on 8 March 2018).
  39. China Electricity Council. Preventing Overcapacity and Overcapacity and Continuously Optimizing Thermal Power Structure. 2018. Available online: http://www.cec.org.cn/xinwenpingxi/2018-02-08/177882.html (accessed on 8 February 2018).
  40. Yuan, J.H.; Zhang, W.H. Research on the scale of coal and electricity surplus and the path of capacity reduction in China. Energy China 2017, 39, 14–20. [Google Scholar]
  41. National Energy Administration. Guiding Opinions on Establishing Guiding System for Target Development of Renewable energy Development. 2016. Available online: http://zfxxgk.nea.gov.cn/auto87/201603/t20160303_2205.htm (accessed on 29 February 2016).
Figure 1. Flow chart of environmental stress test.
Sustainability 10 02151 g001
Figure 2. Pressure transfer map of coal power companies.
Sustainability 10 02151 g002
Figure 3. The process of estimating corporate value.
Sustainability 10 02151 g003
Figure 4. Deviation of actual and reasonable corporate value from 300 MW coal power enterprises in each region.
Sustainability 10 02151 g004
Figure 5. Deviation of actual and reasonable corporate value from 600 MW coal power enterprises in each region.
Sustainability 10 02151 g005
Figure 6. Deviation of actual and reasonable corporate value from 1000 MW coal power enterprises in each region.
Sustainability 10 02151 g006
Figure 7. The impact of improving energy efficiency standards on the value of 300 MW coalpower enterprises.
Sustainability 10 02151 g007
Figure 8. The impact of improving energy efficiency standards on the value of 600 MW coal power enterprises.
Sustainability 10 02151 g008
Figure 9. The impact of the increase of air pollutant emission tax on the value of 600 MW coal power enterprises.
Sustainability 10 02151 g009
Figure 10. Impact of the national carbon market on the value of 300 MW coal power enterprises.
Sustainability 10 02151 g010
Figure 11. Impact of the national carbon market on the value of 600 MW coal power enterprises.
Sustainability 10 02151 g011
Figure 12. The effect of the increase of water resources tax on the value of 600 MW coal power enterprises.
Sustainability 10 02151 g012
Figure 13. Effect of overcapacity on the value of 600 MW coal power enterprises.
Sustainability 10 02151 g013
Figure 14. The effect of renewable energy consumption on the value of 600 MW coal power enterprises.
Sustainability 10 02151 g014
Figure 15. Corporate value of 300 MW coal power unit under optimistic scenarios and pessimistic scenarios in each province
Sustainability 10 02151 g015
Figure 16. Corporate value of 600 MW coal power unit under optimistic scenarios and pessimistic scenarios in each province.
Sustainability 10 02151 g016
Figure 17. Corporate value of 1000 MW coal power unit under optimistic scenarios and pessimistic scenarios in each province.
Sustainability 10 02151 g017
Table 1. Stress test scenario settings.
Risk FactorsOptimistic ScenarioPessimistic Scenario
Energy efficiency level [24]Slightly improves inlet parametersGreatly improves inlet parameters
Environmental protection tax (SO2, NOX)Raise 3 yuan/pollution equivalent on the basis of provincial air pollutant taxUpper limit of air pollution tax (12 yuan/equivalent)
National carbon marketThe price of carbon was 30 yuan/ton, and gradually increased to around 200 yuan per ton in 2030. Free allocation of quotas, 2025 paid distribution, the proportion of 20%The price of carbon was 30 yuan/ton, and gradually increased to around 300 yuan per ton in 2030. Free allocation of quotas, 2025 starting distribution
Water resources taxAccording to the pilot project in Hebei, suppose the national water resources tax is implemented (0.005 yuan/kWh.Appropriately raise the water resources tax ($0.03/kWh) in an optimistic situation.
OvercapacityReasonable coal electricity utilization hoursActual coal electricity utilization hours
Non-water renewable energy planning goalsActual coal electricity utilization hoursConsidering the impact of non-water renewable energy consumption targets by 2020 on the basis of actual utilization hours
Table 2. Key common parameters for the stress testing model.
Common ParametersValueCommon ParametersValue
Proprietary Funds Ratio (%)30Vat (%)17
Term of Loan (Year)15Income Tax (%)25
Annual Interest Rate (%)6Housing Property Tax (%)1.2
Operation Life (Year)30Urban Maintenance and Construction Tax (%)5
Ratio of Residual Value of Asset (%)5Education Surcharge (%)0.5
Depreciation Rate (%)5VAT for Water and Fuel (%)13
Reduction Rate of Coal Consumption in Generation (%)0.10VAT for Materials (%)17
Water Consumption Rate in Generation (kg/kWh)1.6Overhaul Fee Rate (%)2
Pollution Control Costs (yuan/kWh) 0.006Premium Rate (%)0.25
Escalation Rate of Employees’ Salary (%)6Materials Costs and Other Expenses (yuan/kWh)0.02
Welfare labor coefficient60%Escalation Rate of Materials Costs and Other Expenses (%)2
Table 3. Reasonable Return of Corporate Value (Unit: Yuan).
RegionProvince300 MW600 MW1000 MW
North China Power GridHebei2,977,768,4845,080,932,0437,278,743,505
Inner Mongolia
Shandong
Shanxi
Tianjin
Northeast Power GridHeilongjiang3,024,162,1104,929,560,9097,208,636,172
Jilin
Liaoning
Northwest Power GridGansu2,844,098,1554,767,211,4277,347,820,102
Ningxia
Qinghai
Shaanxi
Xinjiang
East China Power GridAnhui2,811,042,6004,700,843,2567,144,251,168
Fujian
Jiangsu
Shanghai
Zhejiang
Central China Power GridChongqing2,837,242,3824,721,853,1896,584,387,717
Henan
Hubei
Hunan
Jiangxi
Sichuan
China Southern Power GridGuangdong3,006,060,4434,986,860,7267,279,010,069
Guangxi
Guizhou
Hainan
Yunnan

