Article

Development of a Streamlined Environmental Life Cycle Costing Model for Buildings in South Korea

1
Sustainable Building Research Center, Hanyang University, 55 Hanyangdaehak-ro, Sangnok-gu, Ansan 15588, Korea
2
Department of Architecture & Architectural Engineering, Hanyang University, 55 Hanyangdaehak-ro, Sangnok-gu, Ansan 15588, Korea
3
Architectural Engineering, Hanyang University, 55 Hanyangdaehak-ro, Sangnok-gu, Ansan 15588, Korea
*
Authors to whom correspondence should be addressed.
Sustainability 2018, 10(6), 1733; https://doi.org/10.3390/su10061733
Submission received: 11 May 2018 / Revised: 22 May 2018 / Accepted: 22 May 2018 / Published: 25 May 2018
(This article belongs to the Special Issue Sustainability in the Built Environment and Climate Change)

Abstract

:
In the building construction industry, simultaneous and integrated evaluation of a building’s environmental and economic performance in the early planning stage greatly facilitates stakeholders’ decision-making for sustainable building construction. This study aimed to develop a streamlined Environmental Life Cycle Costing (ELCC) model for buildings, applicable to the early planning stage of construction projects. To this end, we selected three of the private cost-related life cycle cost categories that are determinants of stakeholders’ decision-making in the early planning stage of construction and extracted 10 major building materials that account for over 95% of the total direct construction cost. Then, we developed a streamlined ELCC model for buildings by combining the monetary value-based life cycle analysis model, KOLID (Korean Life Cycle Impact Assessment Method Based on Damage-Oriented Modeling), and the present worth method. Finally, we conducted a case study to empirically verify the applicability of the proposed model.

1. Introduction

Sustainable development has become necessary in all industries [1,2,3,4,5]. Sustainable development is an ideology that strives to solve environmental problems and to pursue balanced social development simultaneously. Its core aspects are environmental, economic, and social [6,7,8]. In the pursuit of this ideology, an increasing number of businesses, industries, and sectors are stepping up their efforts to assess and improve the environmental, economic, and social performance of their products and services, drawing upon a technological framework known as Life Cycle Sustainability Assessment (LCSA). [9,10,11]. LCSA is a technique for sustainable assessment based on the concepts and practices of Life Cycle Assessment (LCA); specifically, it assesses the sustainable core area of LCA, which is composed of Environmental LCA (ELCA), Environmental Life Cycle Costing (ELCC), and Social Life Cycle Assessment (S-LCA), taking into account the lifespan of a product or service (e.g., production, use, and end-of-life) [12,13].
Of these components of LCA’s core area, ELCC evaluates the economic performance of a product or service. This concept came to the fore with a paper published in 2008 by the Society of Environmental Toxicology and Chemistry (SETAC), entitled “Environmental Life Cycle Costing” [14]. Unlike conventional life cycle costing, ELCC assesses both private costs directly incurred throughout the life cycle of a product or service and external costs related to environmental impacts, and presents the sum of all direct costs and at least one external cost. Owing to its advantage of integrated computation of all the costs related to the environmental and economic performance of a product or service, ELCC has been extensively studied and applied in many industries [14,15].
The building construction industry is also keenly interested in ELCC [16,17,18,19,20]. Unlike other products and services, buildings are characterized by the huge space required, cost-intensive construction and operation/maintenance over a long utilization period, and enormous environmental impacts [21,22]. Therefore, if the costs for a building’s economic performance and environmental performance, which are usually inversely proportional, can be estimated in an integrated and equally weighted manner, all stakeholders can use the results in their decision-making for sustainable building construction. Since the mid-1980s, the building construction industry, spurred by this necessity, has been extensively researching the development of building-level ELCC methods in which carbon emission trading prices are regarded as external costs and are integrated into the conventional life cycle costing applied to long lifespan buildings and infrastructures [18,23,24]. However, this endeavor is hampered by the fact that carbon credits are not generally traded on a scale of a single building unit and because their prices are extremely sensitive to national policies, economic situations, and business fluctuations [22,25,26,27,28]. Moreover, despite various types of environmental impact stemming from a building throughout its life cycle, carbon pricing considers only the indirect economic value of carbon emissions that cause global warming, which makes it difficult to apply emission trading prices to the external costs for ELCC for buildings. Therefore, research is needed to develop a method for computing reasonable external costs on the scale of a single building unit as well as an ELCC model for buildings containing such a scheme.
In the building construction industry, the early planning stage is the stage with the highest life cycle cost reduction potential, and the estimation of the life cycle cost required in this stage plays a pivotal role in the success or failure of the whole building construction industry [23,29,30,31]. It is thus of crucial importance to enhance the efficiency of ELCC for buildings, focusing on the major cost categories in the early planning stage that are determinants of stakeholders’ decision-making and simplifying the related assessment data.
Against this background, this study aims to develop a streamlined ELCC model for buildings, applicable to the early planning stage of construction projects.

2. Environmental Life Cycle Costing

Life Cycle Costing (LCC) is classified into conventional, environmental, and societal life cycle costing depending on the cost category and scope of assessment [14]. Figure 1 illustrates these three types of LCC by category and scope. Conventional life cycle costing assesses all costs incurred directly from the production to the utilization and end-of-life stages. ELCC considers at least one external cost in addition to those assessed by conventional life cycle costing. Thus, it consists of private costs corresponding to conventional life cycle costing and external costs related to environmental impacts. Societal life cycle costing considers all present and future external costs that are considered by the ELCC. At present, only its conceptual definition and scope are presented.
On the other hand, the term ELCC, which was first used in 2005 by Reich [32], began to be known and gradually accepted after the publication of “Environmental Life Cycle Costing” [14] in 2008 by the SETAC. The concept of ELCC emerged by extending the related concepts presented in earlier works, such as “Integrating Life Cycle Cost Analysis and Life Cycle Assessment Presented” by Norris [33,34], “LCA-based Life Cycle Costing” by Rebitzer et al. [35], and “Life Cycle Costing as Part of Design for Environment” by Schmidt [36]. Its detailed and standardized assessment method was released in “Environmental Life Cycle Costing: A Code of Practice” [15] in 2011, which was published by the SETAC.
A standard ELCC assessment system includes four phases: goal and scope definition, Life Cycle Inventory (LCI) analysis, life cycle interpretation, and reporting and review [14,15]. In the goal and scope definition phase, the study’s goal and the target system’s scope are defined, specifying the study’s rationale, intended application, subject function, system boundaries, functional units, allocation procedure, data requirements, hypotheses, and limitations. In the LCI analysis phase, data collection and allocation should be carried out concretely within the system boundaries specified in the definition phase, and the future values should be converted into present values using the present worth method, thereby applying an appropriate discount rate for the conversion. In the life cycle interpretation phase, the ELCC evaluation results derived from the LCI analysis phase are evaluated, and the final results are derived by determining the principal factors of ELCC and subjecting the ELCC evaluation results to consistency, completeness, and sensitivity analyses. In the reporting and review phase, expert review is performed to determine the validity of the ELCC evaluation results by examining the goal and scope, functional units, system boundaries, allocation procedure and method, discount rate application method, and conclusion.

3. Model Development

In this study, we developed a streamlined ELCC model for buildings, applicable to the early planning stage of construction projects, by drawing upon the ELCC method provided by the SETAC [14,15]. First, we investigated the cost categories related to the private costs for construction from the LCA perspective and selected major cost categories involved in the early planning stage that are determinants of stakeholders’ decision-making. Then, we extracted the major building materials that account for a high proportion of the direct construction costs in terms of economic importance and developed a streamlined ELCC model for buildings, consisting of private external construction costs, by combining the monetary value-based life cycle analysis model, KOLID (Korean Life Cycle Impact Assessment Method Based on Damage-Oriented Modeling) [37] and the present worth method.

3.1. Selection of Major Cost Categories

As outlined in Table 1, the private costs for construction in LCC were broken down into initial investment, operation costs, destruction, and other costs. Initial investment costs were subdivided into planning and design costs and direct construction costs, and operation costs were subdivided into operation energy, maintenance, and general management costs [38].
To simplify the ELCC method, we selected the major cost categories that are determinants of stakeholders’ decision-making in the early planning stage of construction. In the selection process, we excluded the categories that do not directly incur material costs but are only related to business operation and management, such as planning and design costs, general management costs, and support funds. Destruction costs were also excluded from the major cost categories because they cannot be accurately estimated in the early planning stage of construction, and their contribution is negligible from the LCC perspective. Direct construction, operation energy, and maintenance costs were thus selected as the major cost categories.

3.2. Selection of Major Building Materials

Simplifying the input data list for the LCI stage helps in simplifying the LCC assessment process conducted in the early planning stage of construction. The construction work process is more complicated than the production process of general products. In general, more than 1000 building materials are required, and an LCC assessment that considers all items is excessively time- and work-intensive [39]. Therefore, we analyzed the itemized direct construction costs using a bill of materials, and extracted major building materials in terms of economic importance—specifically, materials for which the total contribution to the direct construction costs for a construction project exceeded 95%.
Table 2 presents an overview of the buildings selected for the direct construction cost analysis in this study. They were all apartment building complexes with reinforced concrete structures (RC structure) in Seoul, Korea. To reflect various structure types in the cost analysis, we selected three structure types (wall type, rigid-frame, and flat plate) and two target buildings per type. Based on the quantities of building material specified in each building’s bill of materials and the 2017 H2 price information for construction costs released by the Korean Public Procurement Service [40], we estimated the direct construction costs, including material costs, labor costs, and miscellaneous expenses, and analyzed the mean contribution of each type of building to each building material. It was assumed that all building materials were used for construction as specified in the bill of materials in terms of type and quantity, and the waste disposal costs related to discount rate application were not considered. Equation (1) is the formula for the direct construction cost calculation.
DCC = i = 1 n ( Q i × C i × UP i ) ,
where DCC denotes the direct construction cost, Qi denotes the quantity of building material (i), Ci denotes the unit conversion coefficient applied to quantity of building material and unit direct construction cost, and UPi denotes the unit direct construction cost of building material (i).
Figure 2 presents the results of the analysis of the major building materials for each structure type in terms of economic importance. The results show that the percentages of rebar and ready-mixed concrete slightly varied according to structure type, but the major building materials for which the total contribution exceeded 95% of the direct construction costs were ready-mixed concrete, rebar, glass, concrete brick, insulation, gypsum board, window frame, stone, tile, and paint in all three structure types.
According to Roh et al. [41], the six major building materials for which the total contribution exceeded 95% in terms of environmental impact were ready-mixed concrete, rebar, glass, concrete brick, insulation, and gypsum board, which were also included in our 10 major building materials in terms of economic importance.

3.3. Development of ELCC Model

An ELCC model should consider at least one external cost in addition to the private costs considered in conventional life cycle costing [14]. To meet this requirement, we defined the major cost categories selected above (i.e., direct construction, operation energy, and maintenance costs) as pertaining to private costs, and the corresponding costs in the construction (building material production and construction work) and operation energy consumption stages and the Marginal Willingness To Pay (MWTP) for environmental impacts incurred in the maintenance stage as external costs. Then, we constructed a streamlined ELCC model for buildings which combined the private and external costs using the present worth method. Figure 3 is a schematic representation of the streamlined ELCC model for buildings developed in this study.

3.3.1. Calculation of Private Costs

The private costs, consisting of direct construction, annual operation energy, and maintenance costs, were calculated in a similar way as conventional life cycle costing. That is, direct construction costs were calculated by multiplying the input quantity of the 10 major building materials (ready-mixed concrete, rebar, glass, concrete brick, insulation, gypsum board, window frame, stone, tile, and paint) and the unit price of each building material. Annual operation energy costs were calculated by multiplying the annual energy consumption and energy unit price, and maintenance costs by calculated by multiplying the input quantity of the building materials, repair rate, and unit prices. Equations (2)–(4) are the formulas for calculating the private costs for direct construction, annual operation energy, and maintenance costs, respectively.
PC I = i = 1 10 ( Q m , i × UP m , i ) ,
PC R = i = 1 n ( Q e , i × UP e , i ) ,
PC N = i = 1 10 ( Q m , i × UP m , i × R m , i ) ,
where PCI denotes the direct construction costs (private costs), Qm,i denotes the input quantity of major building materials (i), and UPm,i denotes the unit price of major building materials (i). PCR denotes the operation energy costs (private costs), Qe,i denotes the annual consumption of energy sources (i), and UPe,i denotes the unit prices of energy sources (i). Meanwhile, PCN denotes the maintenance costs (private costs), and Rm,i denotes the repair rate of the major building materials (i).

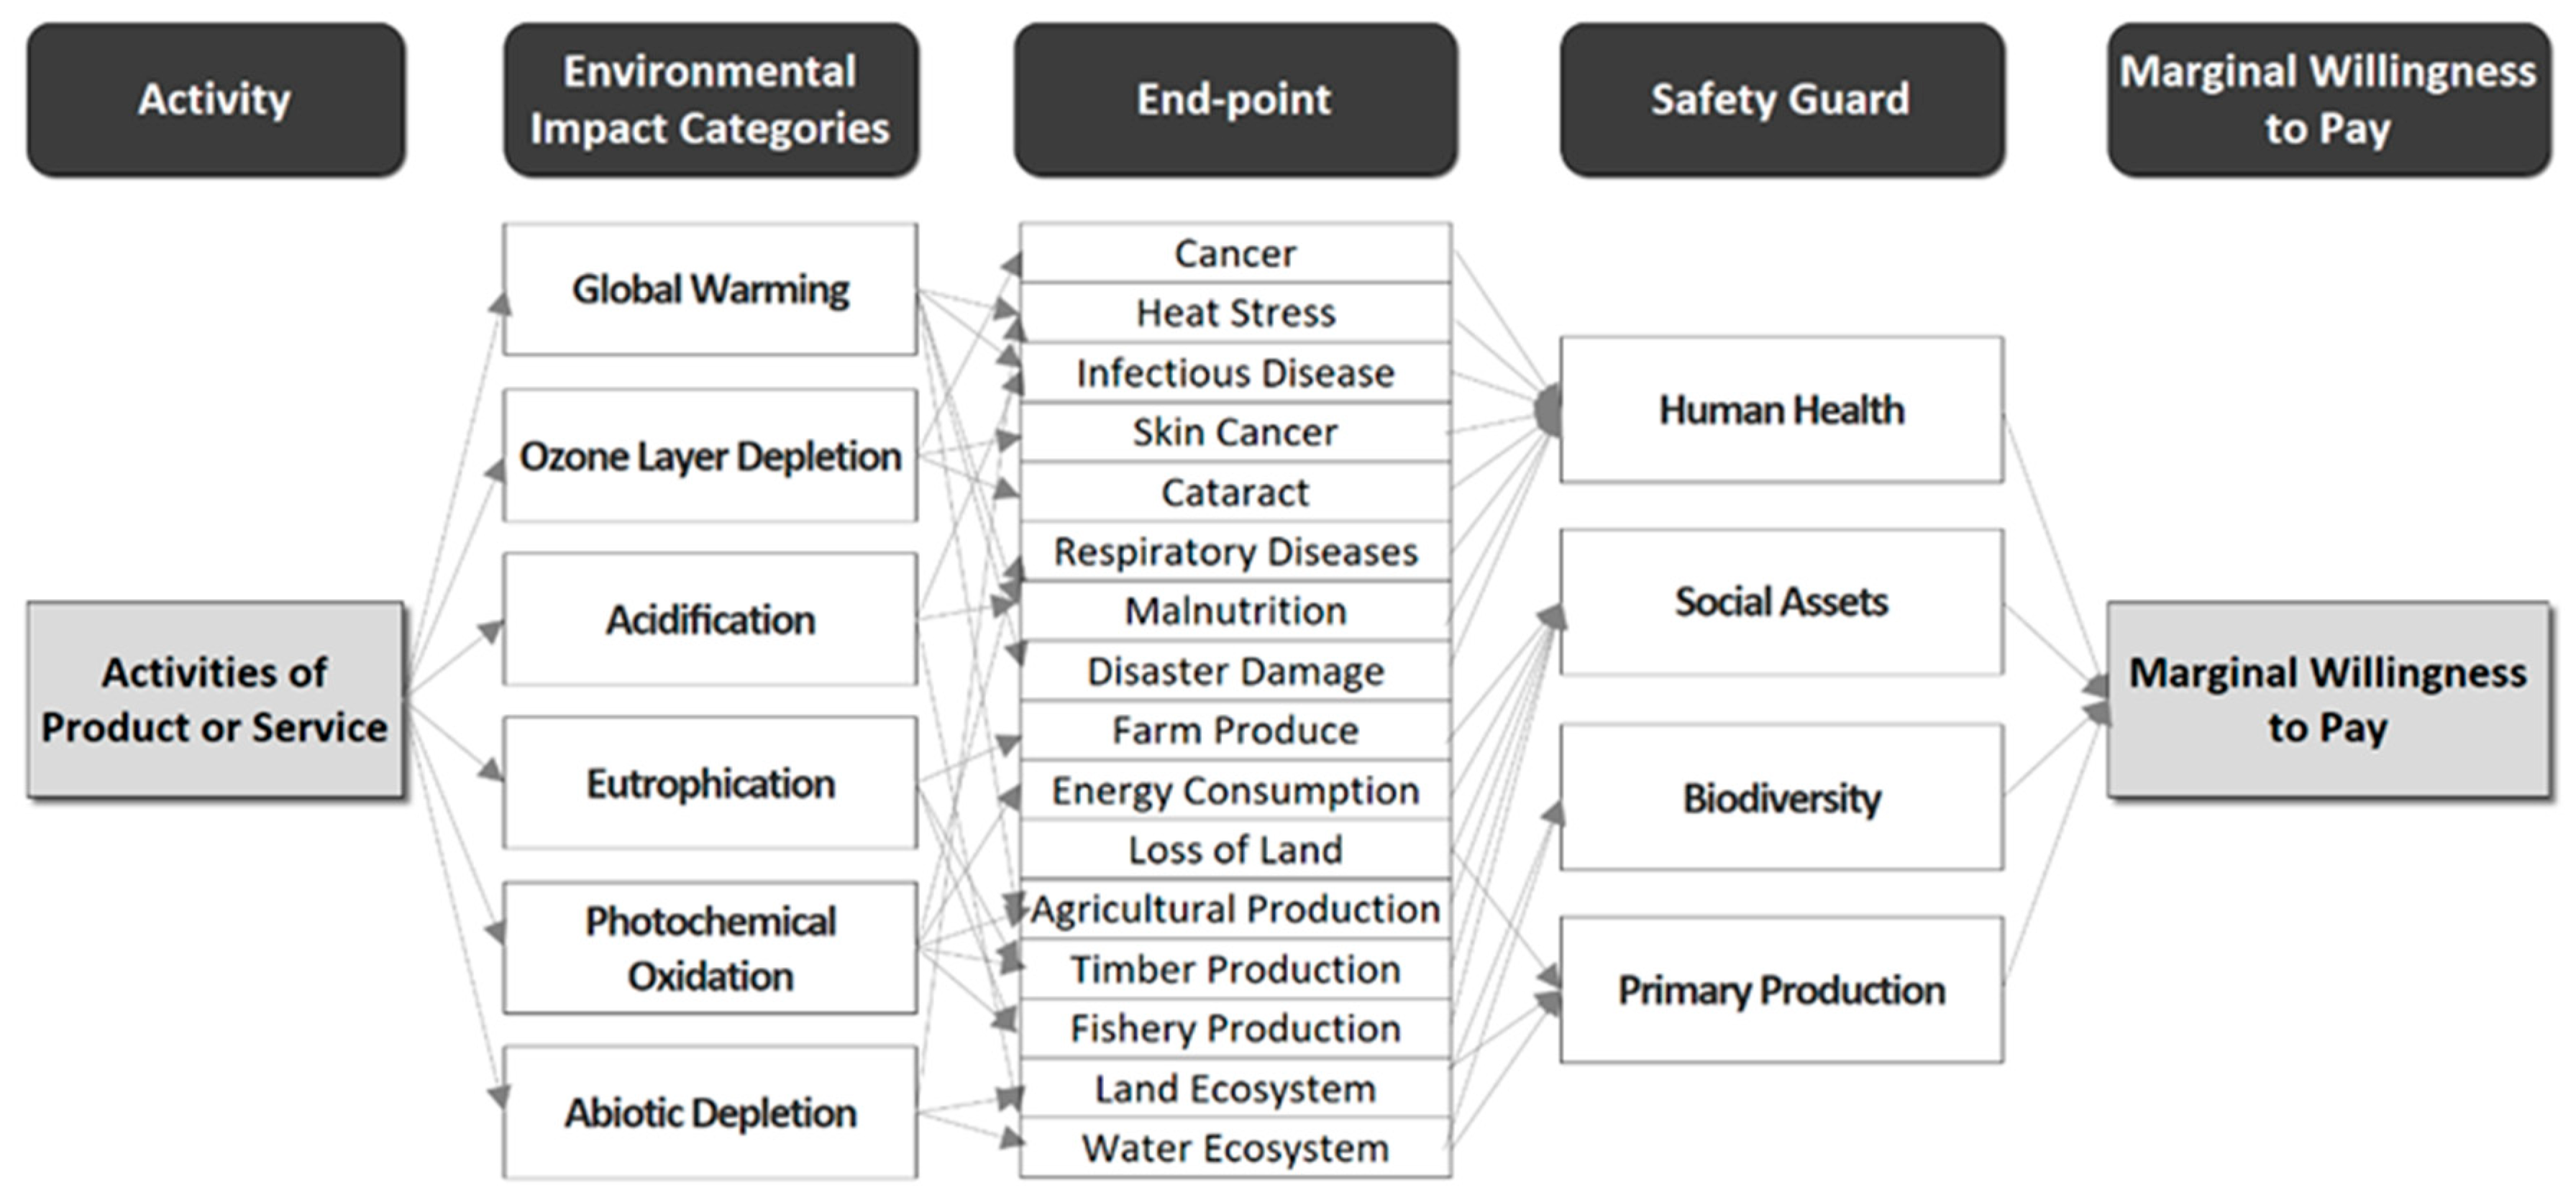
3.3.2. Calculation of External Costs

As methods for reflecting external costs in ELCC, SETAC [14] presented the concepts of “Willingness To Pay” (WTP) and “damage cost” at the endpoint level. WTP is a contingent valuation method reflecting the threshold price that consumers are willing to pay in a virtual market for a given material type, and the damage cost at the endpoint level is an approach to monetizing environmental impacts by integrating the economic valuation theory established in environmental economics into the ELCA. We applied the economic valuation costs of the KOLID, calculated by analyzing the values of the four safety guards (human health, social assets, biodiversity, and primary production) against environmental impacts, using the MWTP based on the damage cost at the endpoint level. Figure 4 is the conceptual diagram of the KOLID [37]. The KOLID quantifies 16 types of endpoint damage, including cancer, infectious disease, and cataracts, which are attributable to six environmental impact categories (global warming, ozone layer depletion, acidification, eutrophication, photochemical oxidation, and abiotic depletion) triggered by products and services, The four safety guard objects are also evaluated and can be monetized using the MWTP for each safety guard established by the questionnaire survey.
To put it differently, the MWTP in the construction, operation energy consumption, and maintenance stages can be calculated by multiplying the input quantities of the major building materials or the energy consumption of each energy source, factor of each safety guard, and MWTP of each safety guard. Equations (5)–(7) are the formulas for calculating the MWTP in the construction, operation energy consumption, and maintenance stages, respectively. Table 3 outlines the safety guard factors of major building materials and energy sources based on the Korean LCI database, and Table 4 outlines the MWTP for the safety guards provided by the KOLID.
EC I = i = 1 10 ( Q m , i × SF m , i , j × MW j ) ,
EC R = i = 1 n ( Q e , i × SF e , i , j × MW j ) ,
EC N = i = 1 10 ( Q m , i × SF m , i , j × MW j × R m , i ) ,
where ECI denotes the MWTP in the construction stage (external cost), Qm,i denotes the input quantity of major building material (i), SFm,i,j denotes the factor for safety guard (j) with respect to major building material (i), and MWj denotes the MWTP for safety guard (j). Meanwhile, ECR denotes the MWTP in the operation energy consumption stage (external cost), Qe,i denotes the annual energy consumption of energy source (i), and SFe,i,j denotes the factor for safety guard (j) with respect to energy source (i). ECN denotes the MWTP in the maintenance stage (external cost), and Rm,i denotes the repair rate for major building material (i).

3.3.3. Application of the ELCC Model Equation

The primary goal of LCC is the identification of an economically advantageous design option by computing the total costs of various design options in the early planning stage of a construction project. During the computation process, it is of crucial importance to use an appropriate method to ensure the temporal synchronization of current and future costs, given that costs change over time. In this study, we applied the present worth method to convert all costs into current values using discount rates.
In the present worth method, costs are categorized into initial, recurring, and non-recurring costs [38]. Initial costs are the costs required in the initial business stage, recurring costs are the costs incurred in an annual cycle during the utilization period of a project, and non-recurring costs are the costs incurred sporadically during the utilization period of a project. Therefore, we set up an equation for the streamlined ELCC model for buildings, in which the direct construction costs required for construction work were applied as initial costs, the annually occurring operation energy costs as recurring costs, and the maintenance costs for repair as non-recurring costs (Equation (8)). Additionally, we used the real interest rate, which represented the actual monetary value change by combining the fixed deposit interest rate and the inflation rate (Equation (9)), as the discount rate to convert the costs incurred at different points in time into the same-criteria values:
ELCC = ( PC I + EC I ) + n = 1 n ( PC R + EC R ) × ( 1 + i ) n 1 i × ( 1 + i ) n + k = 1 k ( PC N + EC N ) ( 1 + i ) ak ,
i = 1 + j 1 + k 1 .
In Equation (8), ELCC represents the environmental life cycle cost; PCI and ECI denote direct construction costs (private costs) and the MWTP (external costs) for the environmental impacts incurred in the construction stage, respectively; PCR and ECR denote the annual operation energy costs (private costs) and the MWTP (external costs) for the environmental impacts incurred in the operation energy consumption stage, respectively; and PCN and ECN denote the maintenance costs (private costs) and the MWTP (external costs) for the environmental impacts incurred in the maintenance stage, respectively. i, n, k, and a denote the real interest rate lifespan of the building, the repair frequency during the building lifespan, and the repair cycle of building materials, respectively. Meanwhile, in Equation (9), i, j, and k denote the market interest (fixed deposit interest rate), and inflation rate, respectively.

4. Case Study

To investigate the applicability of the streamlined ELCC model for buildings developed in this study, we performed ELCC on two apartment buildings with different structure types using the evaluation model shown in Figure 3, and we compared the results of the evaluation.

4.1. Target Selection

Table 5 presents the basic characteristics of the buildings in the case study. The building selected for evaluation (evaluated building) was a 15-story, plate-type, flat plate, RC structure apartment building with four units per story, located in Seoul. The building selected for comparison with the ELCC evaluation results (referenced building) was a 15-story, plate-type, wall-type, RC structure apartment building with four units per story. The per unit exclusive areas of the evaluated and referenced buildings were 59.77 m2 and 59.99 m2, respectively. The wall-type RC structure is the most widely applied building type in Korea. It was assumed that these two buildings were identical in conditions and functions except for the structure type (flat plate vs. wall type).

4.2. Evaluation Scope

The evaluation scope of the set for this case study was as follows: private costs, consisting of direct construction; operation energy; and maintenance costs, selected as major cost categories and external costs corresponding to the private costs in the construction, operation energy consumption, and maintenance stage stages. Given that this case study aimed to perform a relative comparison of ELCC between two apartment buildings with different structure types, we excluded the construction processes from the scope of evaluation, which incurred direct construction costs but were not part of the construction work, such as infrastructure construction and machinery equipment construction.

4.3. Data Collection

For the application of the proposed streamlined ELCC model for buildings, it is necessary to obtain the data for the input quantities of the 10 major building materials selected previously and the annual operation energy consumption. Therefore, we collected the input quantities of the 10 major building materials per unit exclusive area based on the bill of materials for each building and estimated the annual operation energy consumption per unit exclusive area using the operation energy consumption estimation model equation suggested in a previous study [42] by statistically analyzing the typical energy consumption patterns of Korean apartment buildings. Table 6 presents the collected input quantities of the major building materials and the estimated annual operation energy consumption of the evaluated and referenced buildings.

4.4. Evaluation

We calculated the private and external costs of the evaluated and referenced buildings using the collected data. For the private cost calculation, we applied the unit of each of the major building materials released in the 2017 H2 price information for construction costs provided by the Korean Public Procurement Service [40], the unit prices for electricity and city gas provided by the Korea Energy Economics Institute [43], and the repair rate of each building material based on the long-term repair planning standards stipulated in the Enforcement Decree of the Housing Act [44] for direct construction, operation energy, and maintenance costs, respectively. External costs were evaluated by applying the safety guard factors and the MWTP for each safety guard, presented in Table 3 and Table 4, respectively.
The private and external costs of the evaluated and referenced buildings evaluated were then subjected to ELCC evaluation using Equation (8). The lifespan of each building was set at 40 years, adapting the standards stipulated in the Enforcement Decree of the Corporate Tax Act [45], and the discount rate was set as the mean real interest rate of the preceding 10 years calculated on the basis of the market interest and inflation rates released by the Bank of Korea [46] (refer to Table 7).

4.5. Evaluation Results

We analyzed the case study results of the evaluated and referenced buildings in terms of private costs, external costs, and ELCC.

4.5.1. Private Costs

Figure 5 illustrates the LCC evaluation results for the private costs of the evaluated and referenced buildings. The results show that the private costs per unit exclusive area of the evaluated and referenced buildings during their lifespan were 1127.16 USD/m2 and 1126.36 USD/m2, respectively, with the cost for the referenced building lower by about 0.8 USD/m2 per unit area. In particular, the unit direct construction cost of the evaluated building was higher by about 4.0 USD/m2 because of the higher input quantity of rebar, despite the lower input quantity of ready-mixed concrete due to the higher unit price of rebar compared with that of concrete. On the other hand, the referenced building had about 3.0 USD/m2 higher unit maintenance cost, due to the higher input quantities of gypsum board and paint, which need to be replaced in the maintenance stage. From these private cost evaluation results, the referenced building is considered to have better economic performance than the evaluated building.

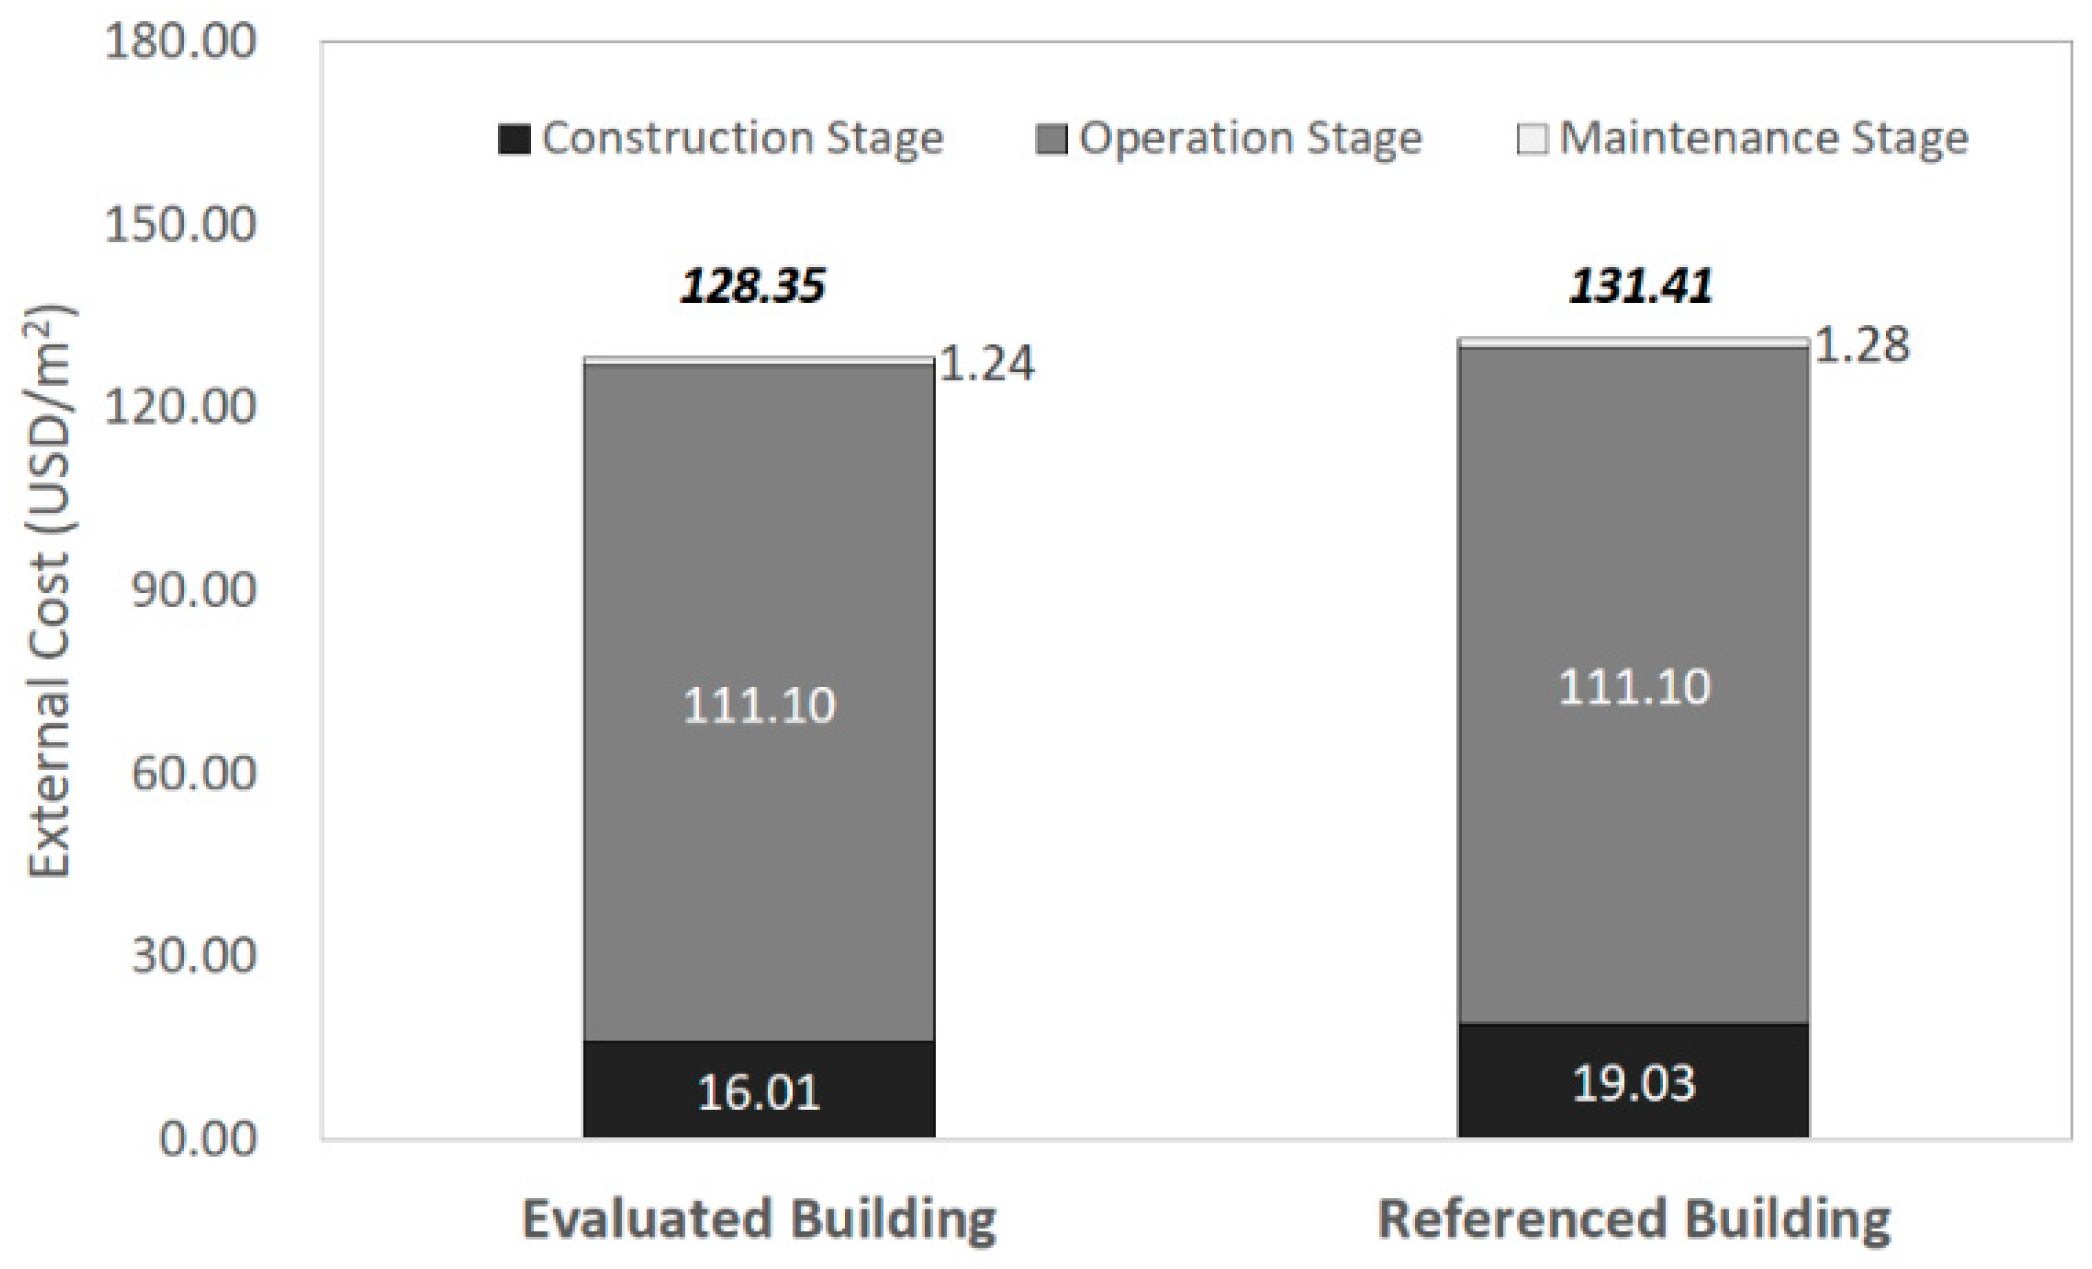
4.5.2. External Costs

Figure 6 illustrates the LCC evaluation results for the external costs of the evaluated and referenced buildings. The results show that the external costs for the environmental impacts per unit exclusive area of the evaluated and referenced buildings during their lifespan were 128.35 USD/m2 and 131.41 USD/m2, respectively, with the evaluated building showing a value lower by about 3.0 USD/m2 per unit area, due to the increased external costs in the construction stage from the high input quantity of ready-mixed concrete, which has a higher environmental impact than other materials, although the input quantity of rebar was lower than in the referenced building. On the other hand, the external costs in the maintenance stage were very similar for both buildings. Based on these external cost evaluation results, the evaluated building is considered to have a better economic performance than the referenced building.

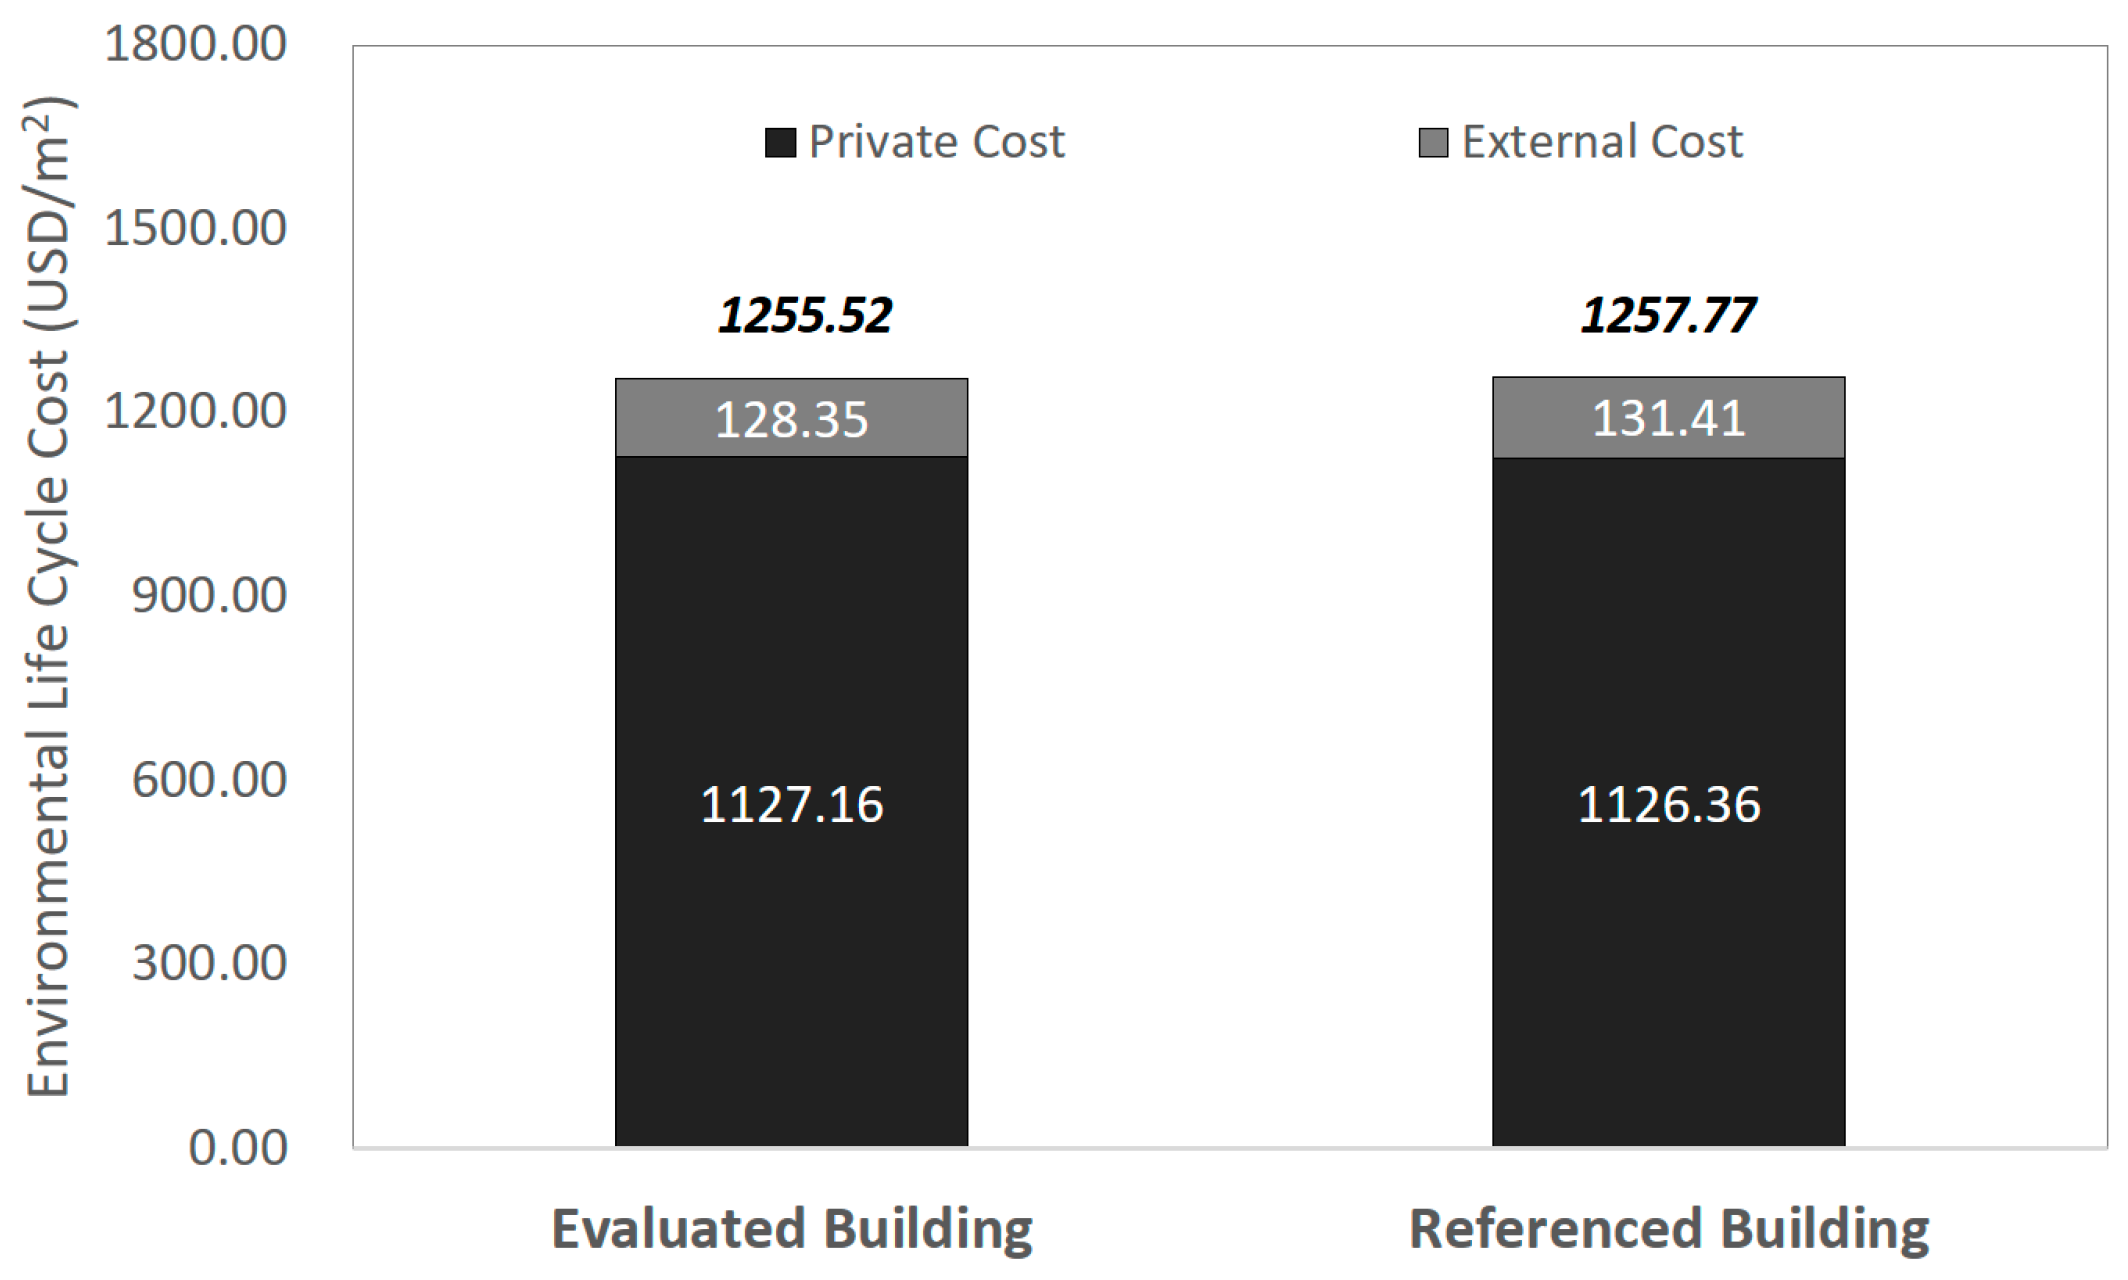
4.5.3. Environmental Life Cycle Cost

Figure 7 illustrates the ELCC evaluation results for the private and external costs of the evaluated and referenced buildings. It shows that the ELCC per unit exclusive area of the evaluated and referenced buildings during their lifespan were 1255.52 USD/m2 and 1257.77 USD/m2, respectively, with the evaluated building showing a value lower by about 2.0 USD/m2 per unit area. Above all, although the LCC evaluation results for the private and external costs of the evaluated and referenced buildings showed discrepancies, we were able to perform an analysis concurrently considering both economic and environmental performance through simple addition of these evaluation results to the same-criteria values, thus confirming the applicability of the proposed evaluation model along with the need for external cost evaluation. Furthermore, the external costs within the scope of this case study exceeded the ELCC calculated as the final result by slightly over 10%.

5. Discussion

Compared with general products, buildings require huge space and costs for construction and operation over a long period of time and have a large environmental impact. Therefore, evaluating the economic and environmental performance simultaneously in the early planning stage, which has the greatest reduction potential in terms of life cycle cost and environmental impact, plays a pivotal role in the success or failure of the entire building construction industry.
This study aimed to present a technical option, capable of supporting stakeholders’ decision-making for sustainable building construction by developing a streamlined ELCC model for buildings applicable to the early planning stage of a construction project. The significance of the streamlined ELCC model for buildings developed in this study lies in the fact that the simplified LCC assessment involves the extraction of major building materials that account for over 95% of the total direct construction costs, thus facilitating ELCC assessment and improving its applicability. Not only can the proposed model efficiently support stakeholders’ decision-making to enhance the sustainability of buildings in the early planning stage of construction, it is also expected to serve as a reference model for judging sustainable buildings in government tender, for example, for a government that places a high value on buildings’ environmental performances.
Furthermore, this case study is significant in that its results demonstrated that economic performance evaluation can change through the inclusion of external costs triggered by environmental impacts in the LCC evaluation, unlike the conventional life cycle costing which only consists of private costs. Although no statistically significant differences were observed in the ELCC between the evaluated and referenced buildings in this case study, the approach it adopted is expected to help extend the decision-making method and scope when judging a sustainable building’s economic performance.

6. Conclusions

In this study, we developed a streamlined ELCC model for buildings applicable to the early planning stage of construction projects. The following is a summary the study’s main achievements:
  • We established an equation for the systematic evaluation of ELCC in the early planning stage of a construction project by considering the MWTP of the KOLID as external costs, and developed a streamlined ELCC model for buildings.
  • As the major cost categories for the streamlined ELCC model for buildings in the early planning stage of a construction project, we selected direct construction, operation energy, and maintenance costs as the scope of the private cost evaluation, and the corresponding costs in the construction, operation energy consumption, and maintenance stages as the scope of the external cost evaluation.
  • By analyzing the direct construction costs of six buildings constructed in Korea, we extracted 10 building materials that accounted for over 95% of the total direct construction cost: concrete, rebar, glass, concrete brick insulation, gypsum board, window frame, stone, tile, and paint.
  • We verified the applicability of the streamlined ELCC model for buildings developed in this study by performing quantitative ELCC evaluations on two apartment buildings with different structure types and compared their private and external costs in a case study.

Author Contributions

All authors contributed substantially to all aspects of this article.

Funding

This research was funded by the Ministry of Land, Infrastructure, and Transport of the Korean government.

Acknowledgments

This research was supported by a grant (17CTAP-C114806-02) from the Technology Advancement Research Program (TARP).

Conflicts of Interest

The authors have no conflict of interest to declare.

References

  1. Bagheri, A.; Hjorth, P. Planning for Sustainable Development: A Paradigm Shift towards a Process-Based Approach. Sustain. Dev. 2007, 15, 83–96. [Google Scholar] [CrossRef]
  2. Gorobets, A. Eco-centric policy for sustainable development. J. Clean. Prod. 2014, 64, 654–655. [Google Scholar] [CrossRef]
  3. Braganca, L.; Mateus, R.; Koukkari, H. Building Sustainability Assessment. Sustainability 2010, 2, 2010–2023. [Google Scholar] [CrossRef]
  4. Castro Marins, K. Comparative assessment of sustainability strategies applied to urban neighbourhoods in Brazil, Germany and Sweden. Int. J. Sustain. Build. Technol. Urban Dev. 2017, 8, 195–207. [Google Scholar]
  5. Vrieze, R.; Moll, H. An analytical approach towards sustainability-centered guidelines for Dutch primary school building design. Int. J. Sustain. Build. Technol. Urban Dev. 2017, 8, 93–124. [Google Scholar]
  6. The World Commission on Environment and Development (WCED). Our Common Future: Report of the World Commission on Environment and Development. Available online: http://www.un-documents.net/our-common-future.pdf (accessed on 26 April 2018).
  7. Georgiadou, M.; Hacking, T.; Guthrie, P. A conceptual framework for future-proofing the energy performance of buildings. Energy Policy 2012, 47, 145–155. [Google Scholar] [CrossRef]
  8. Hacking, T.; Guthrie, P. A framework for clarifying the meaning of Triple Bottom-Line, Integrated, and Sustainability Assessment. Environ. Impact Assess. Rev. 2008, 28, 73–89. [Google Scholar] [CrossRef]
  9. Hu, M.; Kleijn, R.; Bozhilova-Kisheva, K.; Maio, F.D. An approach to LCSA: The case of concrete recycling. Int. J. Life Cycle Assess 2013, 18, 1793–1803. [Google Scholar] [CrossRef]
  10. Foolmaun, R.; Ramjeawon, T. Life cycle sustainability assessments (LCSA) of four disposal scenarios for used polyethylene terephthalate (PET) bottles in Mauritius. Int. J. Life Cycle Assess 2013, 15, 783–806. [Google Scholar] [CrossRef]
  11. Vinyes, E.; Oliver-Solà, J.; Ugaya, C.; Rieradevall, J.; Gasol, C. Application of LCSA to used cooking oil waste management. Int. J. Life Cycle Assess 2013, 18, 445–455. [Google Scholar] [CrossRef]
  12. Finkbeiner, M.; Schau, E.; Lehmann, A.; Traverso, M. Towards Life Cycle Sustainability Assessment. Sustainability 2010, 2, 3309–3322. [Google Scholar] [CrossRef]
  13. UNEP. Towards a Life Cycle Sustainability Assessment; UNEP: Nairobi, Kenya, 2011. [Google Scholar]
  14. Hunkeler, D.; Lichtenvort, K.; Rebitzer, G.; Ciroth, A.; Huppers, G.; Klopffer, W.; Rudenauer, I.; Steen, B.; Swarr, T. Environmental Life Cycle Costing; SETAC: New York, NY, USA, 2008. [Google Scholar]
  15. Swarr, T. Environmental Life Cycle Costing: A Code of Practice; SETAC: New York, NY, USA, 2011. [Google Scholar]
  16. Rodrigues, C.; Freire, F. Building retrofit addressing occupancy: An integrated cost and environmental life-cycle analysis. Energy Build. 2017, 140, 388–398. [Google Scholar] [CrossRef]
  17. Robati, M.; McCarthy, T.J.; Kokogiannakis, G. Integrated life cycle cost method for sustainable structural design by focusing on a benchmark office building in Australia. Energy Build. 2018, 166, 525–537. [Google Scholar] [CrossRef]
  18. Chou, J.S.; Yeh, K.C. Life cycle carbon dioxide emissions simulation and environmental cost analysis for building construction. J. Clean. Prod. 2015, 101, 137–147. [Google Scholar] [CrossRef]
  19. Islam, H.; Jollands, M.; Setunge, S. Life cycle assessment and life cycle cost implication of residential buildings—A review. Renew. Sustain. Energy Rev. 2015, 42, 129–140. [Google Scholar] [CrossRef]
  20. Kim, T.H.; Tae, S.H. Proposal of environmental impact assessment method for concrete in South Korea: An application in LCA (life cycle assessment). Int. J. Environ. Res. Public Health 2016, 13, 1074. [Google Scholar] [CrossRef] [PubMed]
  21. Zuo, J.; Zhao, Z.Y. Green building research–current status and future agenda: A review. Renew. Sustain. Energy Rev. 2014, 30, 271–281. [Google Scholar] [CrossRef]
  22. Shin, S. Environmental Performance Evaluation and Design Techniques for Environment Friendly Buildings; Kimoondang Publishing: Seoul, Korea, 2007. [Google Scholar]
  23. Lee, S.; Lee, B.; Kim, J.; Kim, J. A Financing Model to Solve Financial Barriers for Implementing Green Building Projects. Sci. World J. 2013, 2013, 240394. [Google Scholar] [CrossRef] [PubMed]
  24. Kim, S.; Lee, S.; Na, Y.; Kim, J.T. Conceptual model for LCC-based LCCO2 analysis of apartment buildings. Energy Build 2013, 64, 285–291. [Google Scholar] [CrossRef]
  25. Korea Exchange. Marketdata. Available online: http://marketdata.krx.co.kr/mdi#document=070301 (accessed on 26 April 2018).
  26. Anderson, B.; Maria, C. Abatement and Allocation in the Pilot Phase of the EU ETS. Environ. Res. Econ. 2011, 48, 83–103. [Google Scholar] [CrossRef]
  27. Hintermann, B. Allowance price drivers in the first phase of the EU ETS. J. Environ. Econ. Manag. 2010, 59, 43–56. [Google Scholar] [CrossRef] [Green Version]
  28. Blyth, W. Coevolution of policy, market and technical price risks in the EU ETS. Energy Policy 2011, 39, 4578–4593. [Google Scholar] [CrossRef]
  29. Marzouk, M.; Azab, S.; Metawie, M. BIM-based approach for optimizing life cycle costs of sustainable buildings. J. Clean. Prod. 2018, 188, 217–226. [Google Scholar] [CrossRef]
  30. Kovacic, I.; Zoller, V. Building life cycle optimization tools for early design phases. Energy 2015, 92, 409–419. [Google Scholar] [CrossRef]
  31. Barg, S.; Flager, F.; Fischer, M. An analytical method to estimate the total installed cost of structural steel building frames during early design. J. Build. Eng. 2018, 15, 41–50. [Google Scholar] [CrossRef]
  32. Reich, M. Economic assessment of municipal waste management systems—Case studies using a combination of life cycle assessment (LCA) and life cycle costing (LCC). J. Clean. Product. 2005, 13, 253–263. [Google Scholar] [CrossRef]
  33. Norris, G. Integrating Life Cycle Cost Analysis and LCA. Int. J. Life Cycle Assess 2001, 6, 118–120. [Google Scholar]
  34. Norris, G. Integrating Economic Analysis into LCA. Environ. Qual. Manag. 2001, 10, 59–64. [Google Scholar] [CrossRef]
  35. Rebitzer, G.; Hunkeler, D.; Jolliet, O. LCC-The Economic Pillar of Sustainability: Methodology and Application to Wastewater Treatment. Environ. Progr. 2003, 22, 241–249. [Google Scholar] [CrossRef]
  36. Schmidt, W. Life Cycle Costing as Part of Design for Environment. Int. J. Life Cycle Assess 2003, 8, 167–174. [Google Scholar] [CrossRef]
  37. Korea Environmental Industry & Technology Institute. Development of Integrated Evaluation Technology on Product Value for Dissemination of Environmentally Preferable Products; Korea Ministry of Environment: Sejong, Korea, 2009.
  38. Jeon, C. A Study on the Development of Life Cycle Cost Database in Buildings. Master’s Dissertation, Mokwon University, Daejeon, Korea, 2003. [Google Scholar]
  39. Roh, S.; Tae, S. Building Simplified Life Cycle CO2 Emissions Assessment Tool (B-SCAT) to Support Low-Carbon Building Design in South Korea. Sustainability 2016, 8, 567. [Google Scholar] [CrossRef]
  40. Korea Public Procurement Service. Korea ON-Line E-Procurement System. Available online: http://www.g2b.go.kr/pt/menu/selectSubFrame.do?framesrc=/pt/menu/framePrice.do?url=http://www.g2b.go.kr/ci/co/priceGuide.do&menuId=000001 (accessed on 26 April 2018).
  41. Roh, S.; Tae, S.; Suk, S.J.; Ford, G. Evaluating the embodied environmental impacts of major building tasks and materials of apartment buildings in Korea. Renew. Sustain. Energy Rev. 2017, 73, 135–144. [Google Scholar] [CrossRef]
  42. Yoo, J.; Shin, J. Method for Estimating Energy Consumption Units Derived from Statistic Document–Focused apartment house. Arch. Inst. Korea 2014, 30, 209–217. [Google Scholar] [CrossRef]
  43. Korea Energy Economics Institute. Korea Energy Statistical Information System. Available online: http://www.kesis.net (accessed on 26 April 2018).
  44. Korea Housing Act. Korea Ministry of Land, Infrastructure and Transport. Available online: http://elaw.klri.re.kr/kor_service/lawView.do?hseq=25579&lang=ENG (accessed on 26 April 2018).
  45. Korea Corporate Tax Act: Korea Ministry of Strategy and Finance. Available online: http://elaw.klri.re.kr/kor_service/lawView.do?hseq=28577&lang=ENG (accessed on 26 April 2018).
  46. Bank of Korea. Korean Stat 100 of Economic Statistics System (ECOS). Available online: http://ecos.bok.or.kr/jsp/vis/keystat/index_e.html#/key (accessed on 26 April 2018).
Figure 1. Scope of three kinds of life cycle costing [14].
Sustainability 10 01733 g001
Figure 2. Results of the analysis of major building materials.
Sustainability 10 01733 g002
Figure 3. Streamlined ELCC model for buildings.
Sustainability 10 01733 g003
Figure 4. Conceptual diagram of Korean Life Cycle Impact Assessment Method Based on Damage-Oriented Modeling (KOLID).
Sustainability 10 01733 g004
Figure 5. Evaluation results of private costs.
Sustainability 10 01733 g005
Figure 6. Evaluation results of external costs.
Sustainability 10 01733 g006
Figure 7. Evaluation results of environmental life cycle cost.
Sustainability 10 01733 g007
Table 1. Life cycle cost categories.
ClassificationItems
Initial investment costsPlanning & design costsPlanning costsBasic design costs
Design costsExecution design costs
Direct construction costsMaterial costsMaterials, equipment, others
Labor costsLabor costs included in construction costs
Miscellaneous expensesVarious indirect costs, supervision costs, etc.
Operation costsOperation energy costsElectricity billsElectricity bills for air conditioning/hot water supply
Gas billsGas bills for air conditioning/hot water supply
District heating & cooling billsDistrict heating & cooling bills
Water & sewage billsWater & sewage bills
Maintenance costsRepair parts costsRepair & consumable parts costs
Replacement costsReplacement costs, such as equipment & piping
General management costsTaxesAcquisition & registration taxes on buildings
Insurance premiumsFire insurance premium
Labor costsLabor costs for general management
Destruction costsDestruction costsDestruction costsDestruction costs of a building
Residual valuesResidual values of a building
Other costsSupport fundsVarious support fundsSupport funds for electricity provider, etc.
Table 2. Evaluation targets.
ClassificationBuilding “A”Building “B”Building “C”Building “D”Building “E”Building “F”
LocationSeoul, KoreaSeoul, KoreaSeoul, KoreaSeoul, KoreaSeoul, KoreaSeoul, Korea
Break groundJan. 2009Oct. 2009Jan. 2012Jan. 2012Oct. 2011Jun. 2011
CompletionJan. 2011Sep. 2011Jun. 2014Jun. 2014Jun. 2014Dec. 2013
StructureReinforced concrete (RC) structure,
(Wall type)
RC structure,
(Wall type)
RC structure,
(Rigid-frame)
RC structure,
(Rigid-frame)
RC structure,
(Flat plate)
RC structure,
(Flat plate)
Lot area10,780 m240,424 m275,115 m256,336 m272,608 m2108,163 m2
Building area2513 m210,210 m219,480 m216,320 m214,172 m218,658 m2
Gross floor area83,883 m268,612 m2227,466 m2208,393 m2190,866 m2267,015 m2
Building coverage ratio23%25%26%29%20%17%
Floor area ratio564%169%201%239%185%172%
Table 3. Safety guard factors of major building materials and energy sources.
ClassificationUnitSafety Guard
Human Health
(DALY/Unit)
Social Assets
(USD/Unit)
Biodiversity
(EINES/Unit)
Primary Production
(NPP/Unit)
Ready-mixed concretem32.47 × 10−45.31 × 1001.48 × 10−134.63 × 101
Rebarkg3.98 × 10−78.47 × 10−32.48 × 10−164.62 × 10⁻²
Glasskg1.44 × 10−63.00 × 10−27.01 × 10−161.74 × 10⁻¹
Gypsum boardkg2.09 × 10−74.52 × 10−39.70 × 10−172.57 × 10⁻²
ElectricitykWh2.72 × 10−75.92 × 10−32.86 × 10−163.26 × 10⁻²
DALY: disability adjusted life year; USD: United States dollar; EINES: expected increase in number of extinct species; NPP: net primary production; KRW: Korean Won; 1 USD = 1070 KRW.
Table 4. Marginal willingness to pay (MWTP) according to safety guard of KOLID.
Safety GuardDescriptionUnitMWTP (USD/Unit)
Human healthMortality, or diseases or disorders leading to mortalityDALY
(disability adjusted life year)
26,355.14
Social assetsAgricultural products, fishery resources, forestry resources, mineral resources, fossil fuel resourcesKRW
(Korean Won, economic costs)
0.000935
BiodiversityExtinction of vascular plant species water-borne plantsEINES
(expected increase in number of extinct species)
531.78
Primary productionLand plants and marine planktonNPP
(net primary production)
46.07
1 USD = 1070 KRW.
Table 5. Targets of case study.
ClassificationEvaluated BuildingReferenced Building
PurposeApartment buildingApartment building
StructureRC structure, flat plateRC structure, wall type
Plane formPlate-type, 4 units per storyPlate-type, 4 units per story
Exclusive area per unit59.7759.99
Total exclusive area3108.043119.48
Gross floor area4024.174039.56
Number of stories1515
Table 6. Data collection.
ClassificationUnitEvaluated BuildingReferenced Building
Input quantity of major building materialsReady-mixed concretem3/m20.680.92
Rebarkg/m2128.63108.54
Glasskg/m26.927.18
Concrete brickkg/m288.8786.24
Insulationkg/m21.681.65
Gypsum boardkg/m22.512.74
Window framekg/m25.515.46
Stonekg/m24.684.84
Tilekg/m25.165.08
Paintkg/m21.361.42
Annual operation energy consumptionElectricitykWh/m2, year27.5027.50
City gaskWh/m2, year99.4099.40
Table 7. Real interest rates.
YearFixed Deposit Interest Rate (%)Inflation Rate (%)Real Interest Rate (%)
20085.674.700.93
20093.232.800.42
20103.183.000.17
20113.694.00−0.30
20123.432.201.20
20132.731.301.41
20142.431.301.12
20151.740.701.03
20161.481.000.48
20171.561.90−0.33
Average2.912.290.61

