Energy and Exergy Analyses of Different Aluminum Reduction Technologies


Abstract
:1. Introduction
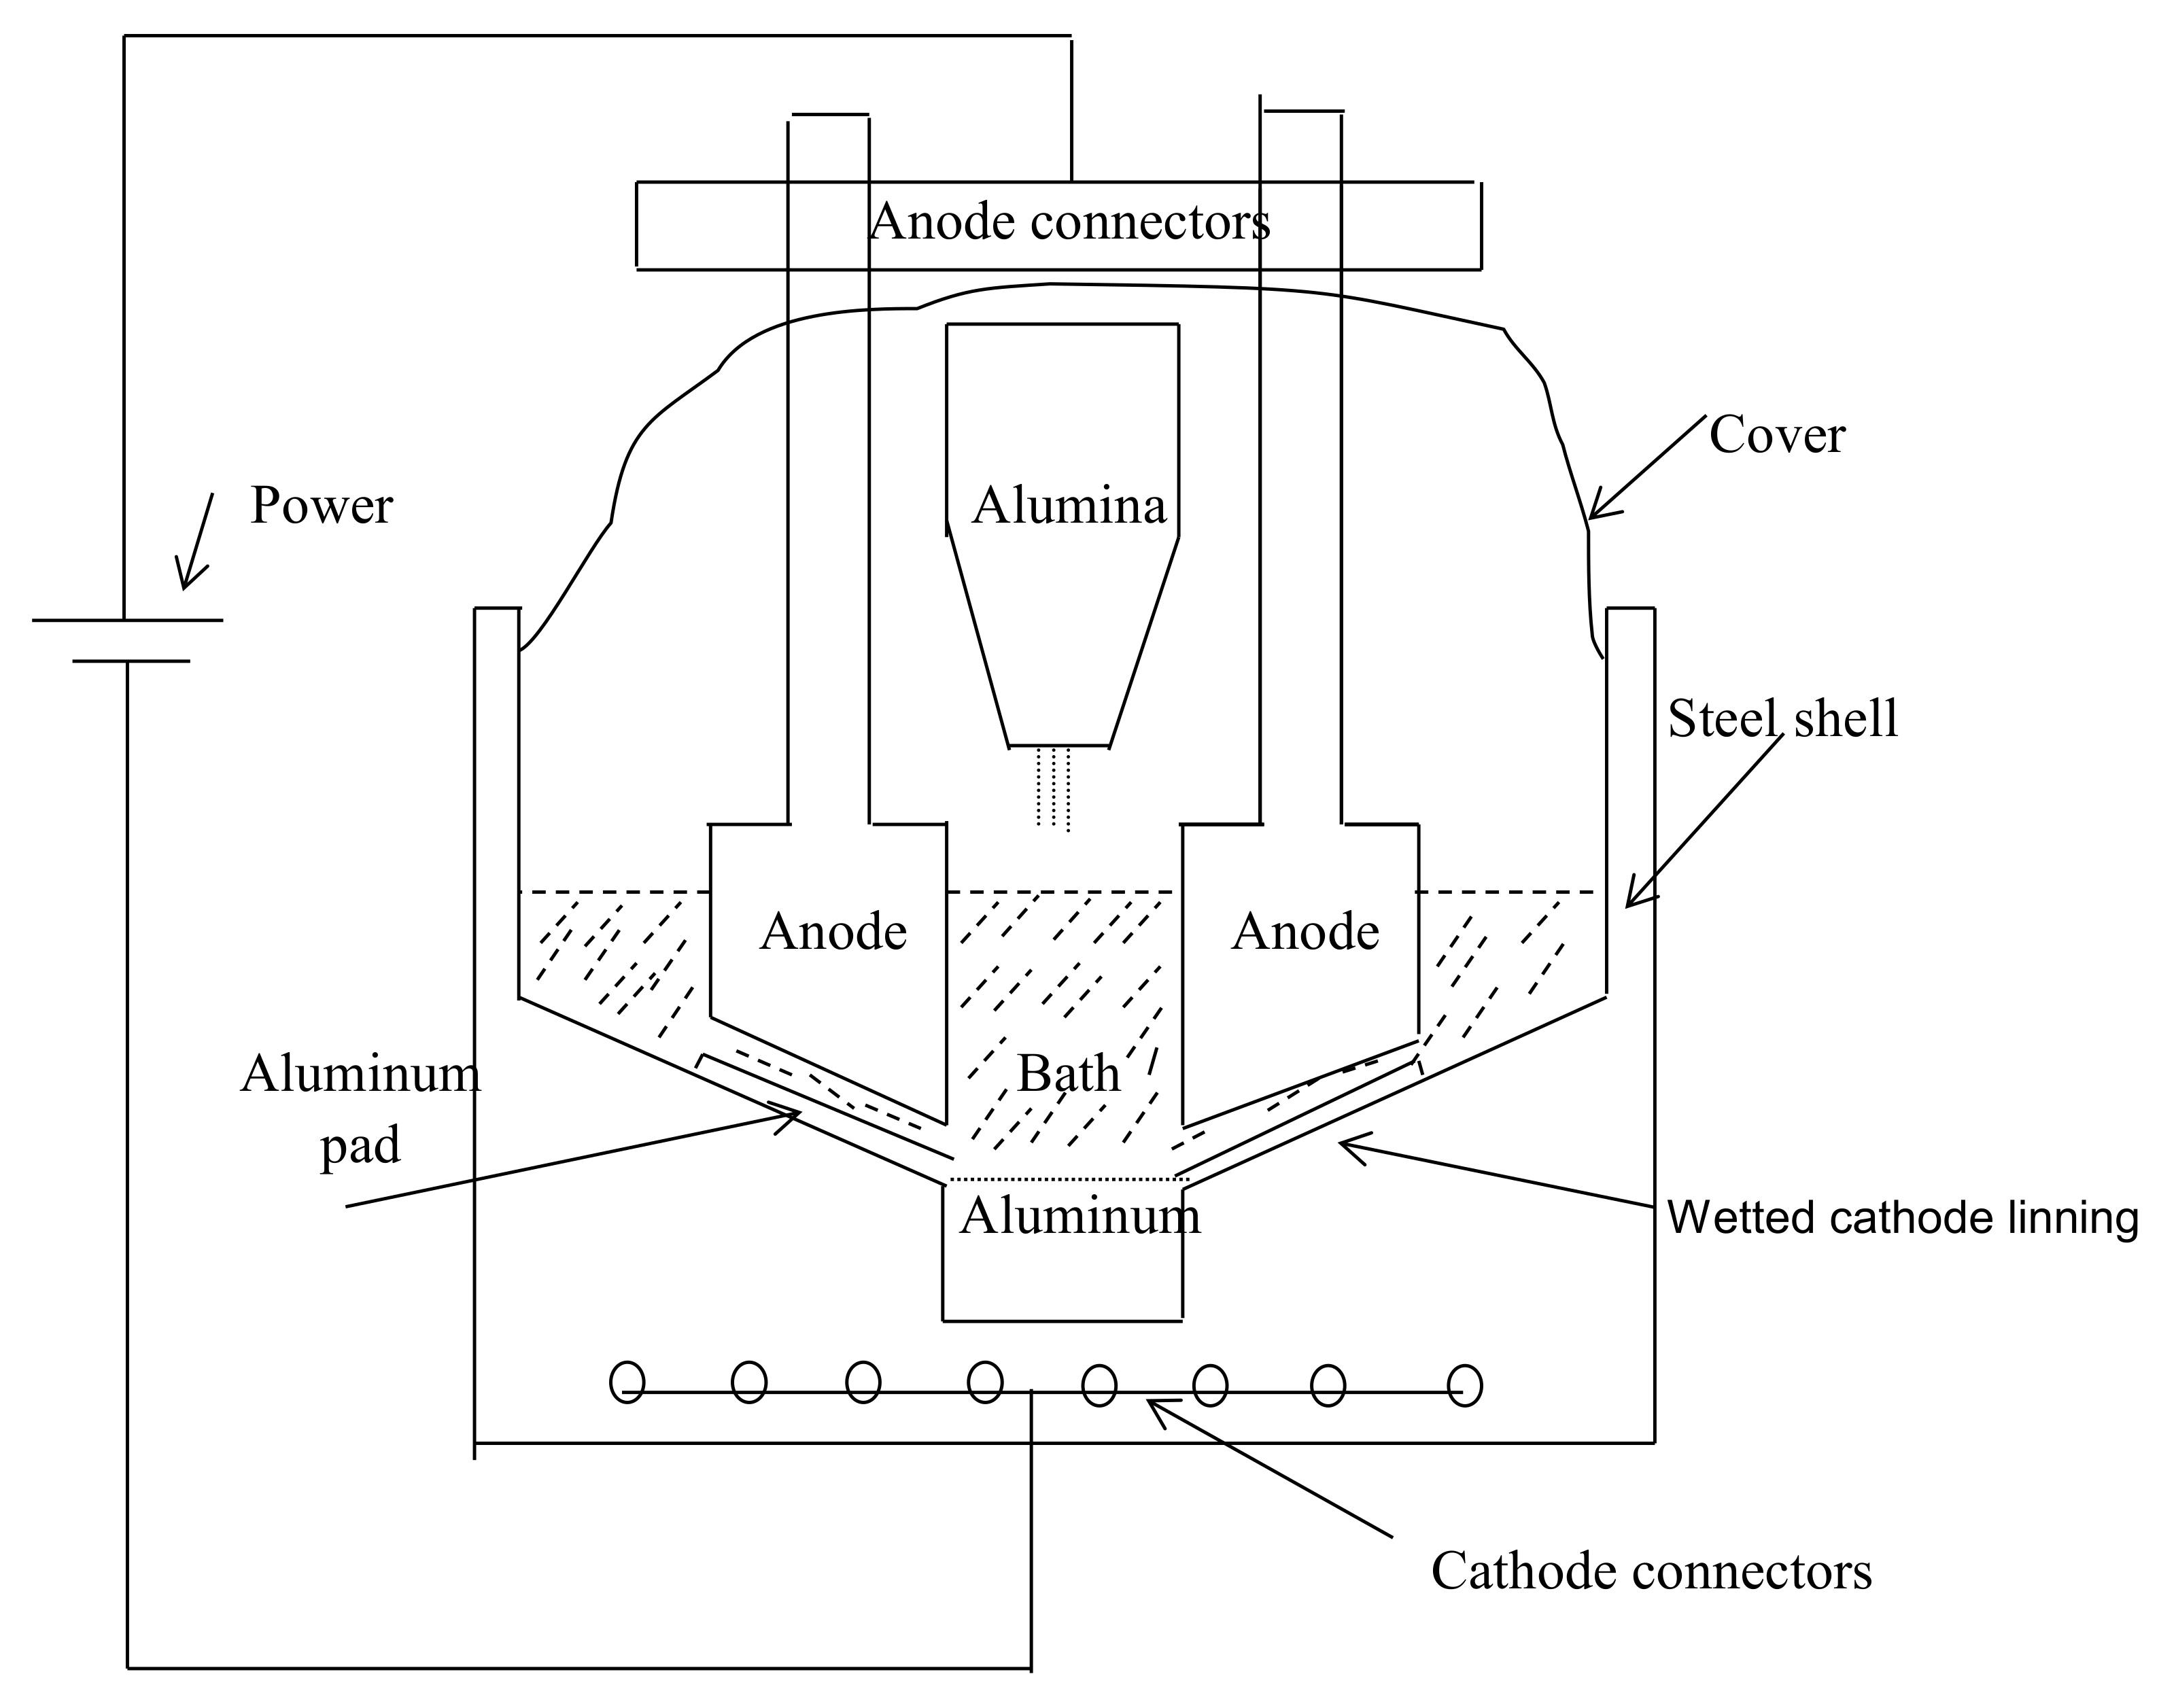
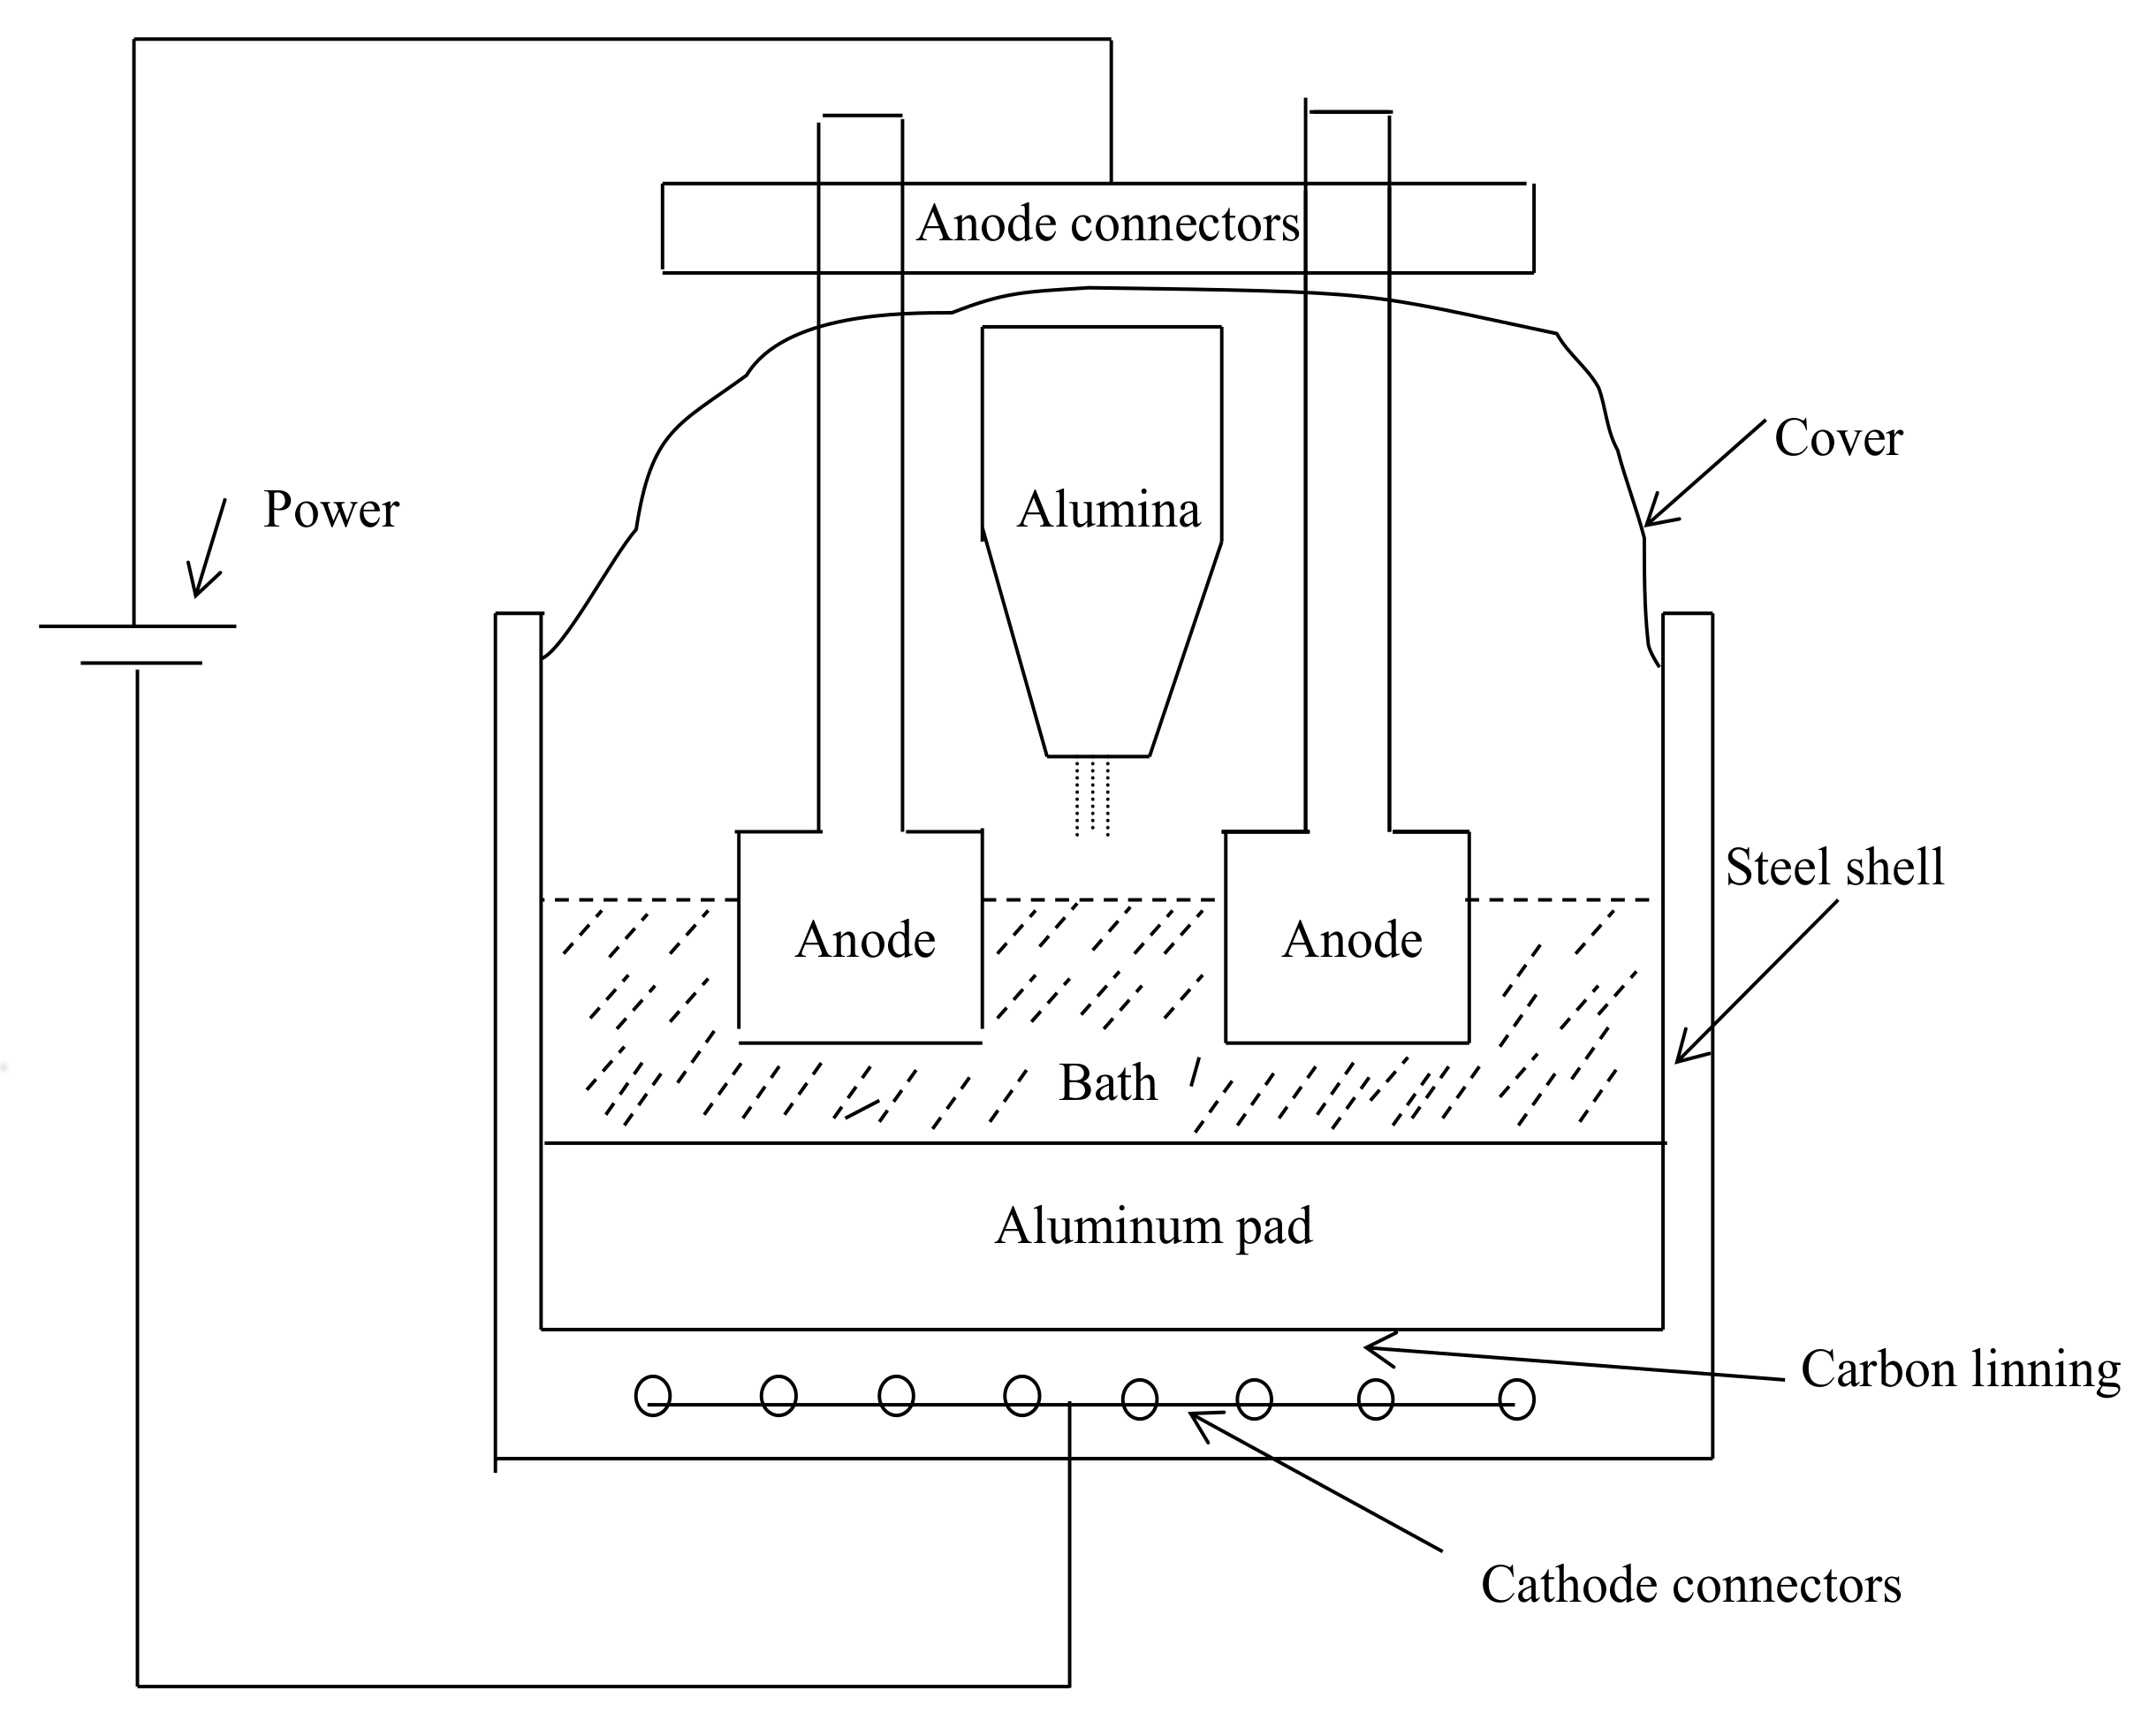
2. Hall–Heroult Technology
2.1. Main Inefficient Sources of the Current Hall–Heroult Technology
2.1.1. Carbon Anodes
2.1.2. Anode–Cathode Distance (ACD)
- (a)
- When current passes through the bath, it creates electromagnetic forces that cause the pad to rotate and deform. If the ACD is small, the molten aluminum pad can reach the anode and make a short circuit; therefore, the ACD is kept large enough to avoid this problem.
- (b)
- The aluminum reacts with the carbon lining of the cathode and forms aluminum carbide, which dissolves when exposed to electrolyte leaving a corroded cathode surface. Therefore, the aluminum pad rests on a thin sheet of the electrolytic bath, and this creates a gap between the aluminum pad and the carbon cathode (and hence, consumes more energy). To reduce this gap, the aluminum pad and cryolite bath are made to be heavy (and hence, the ACD increases) to tightly compress them together.
2.1.3. High Voltage
3. Analyses
3.1. Theoretical Energy
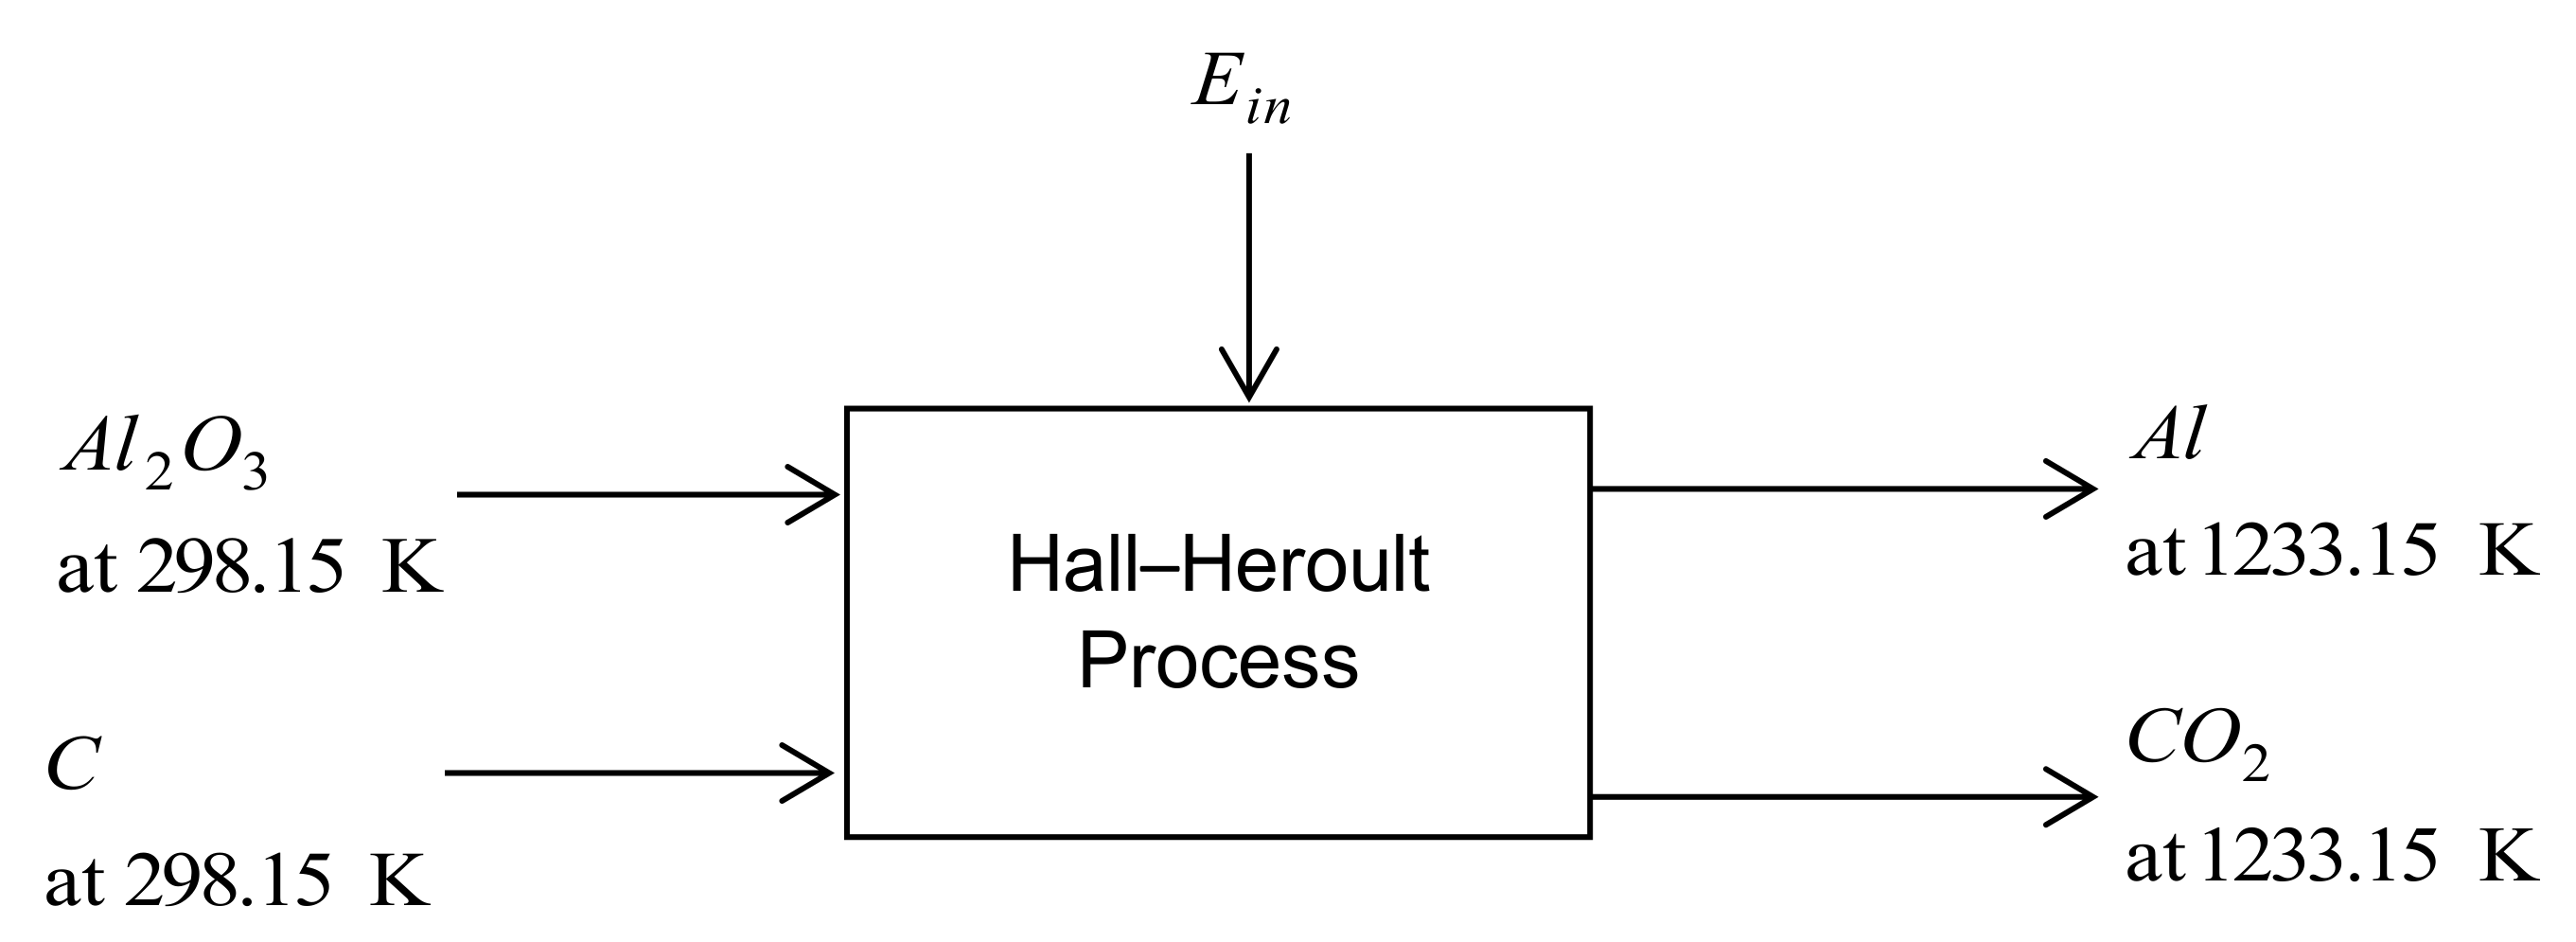
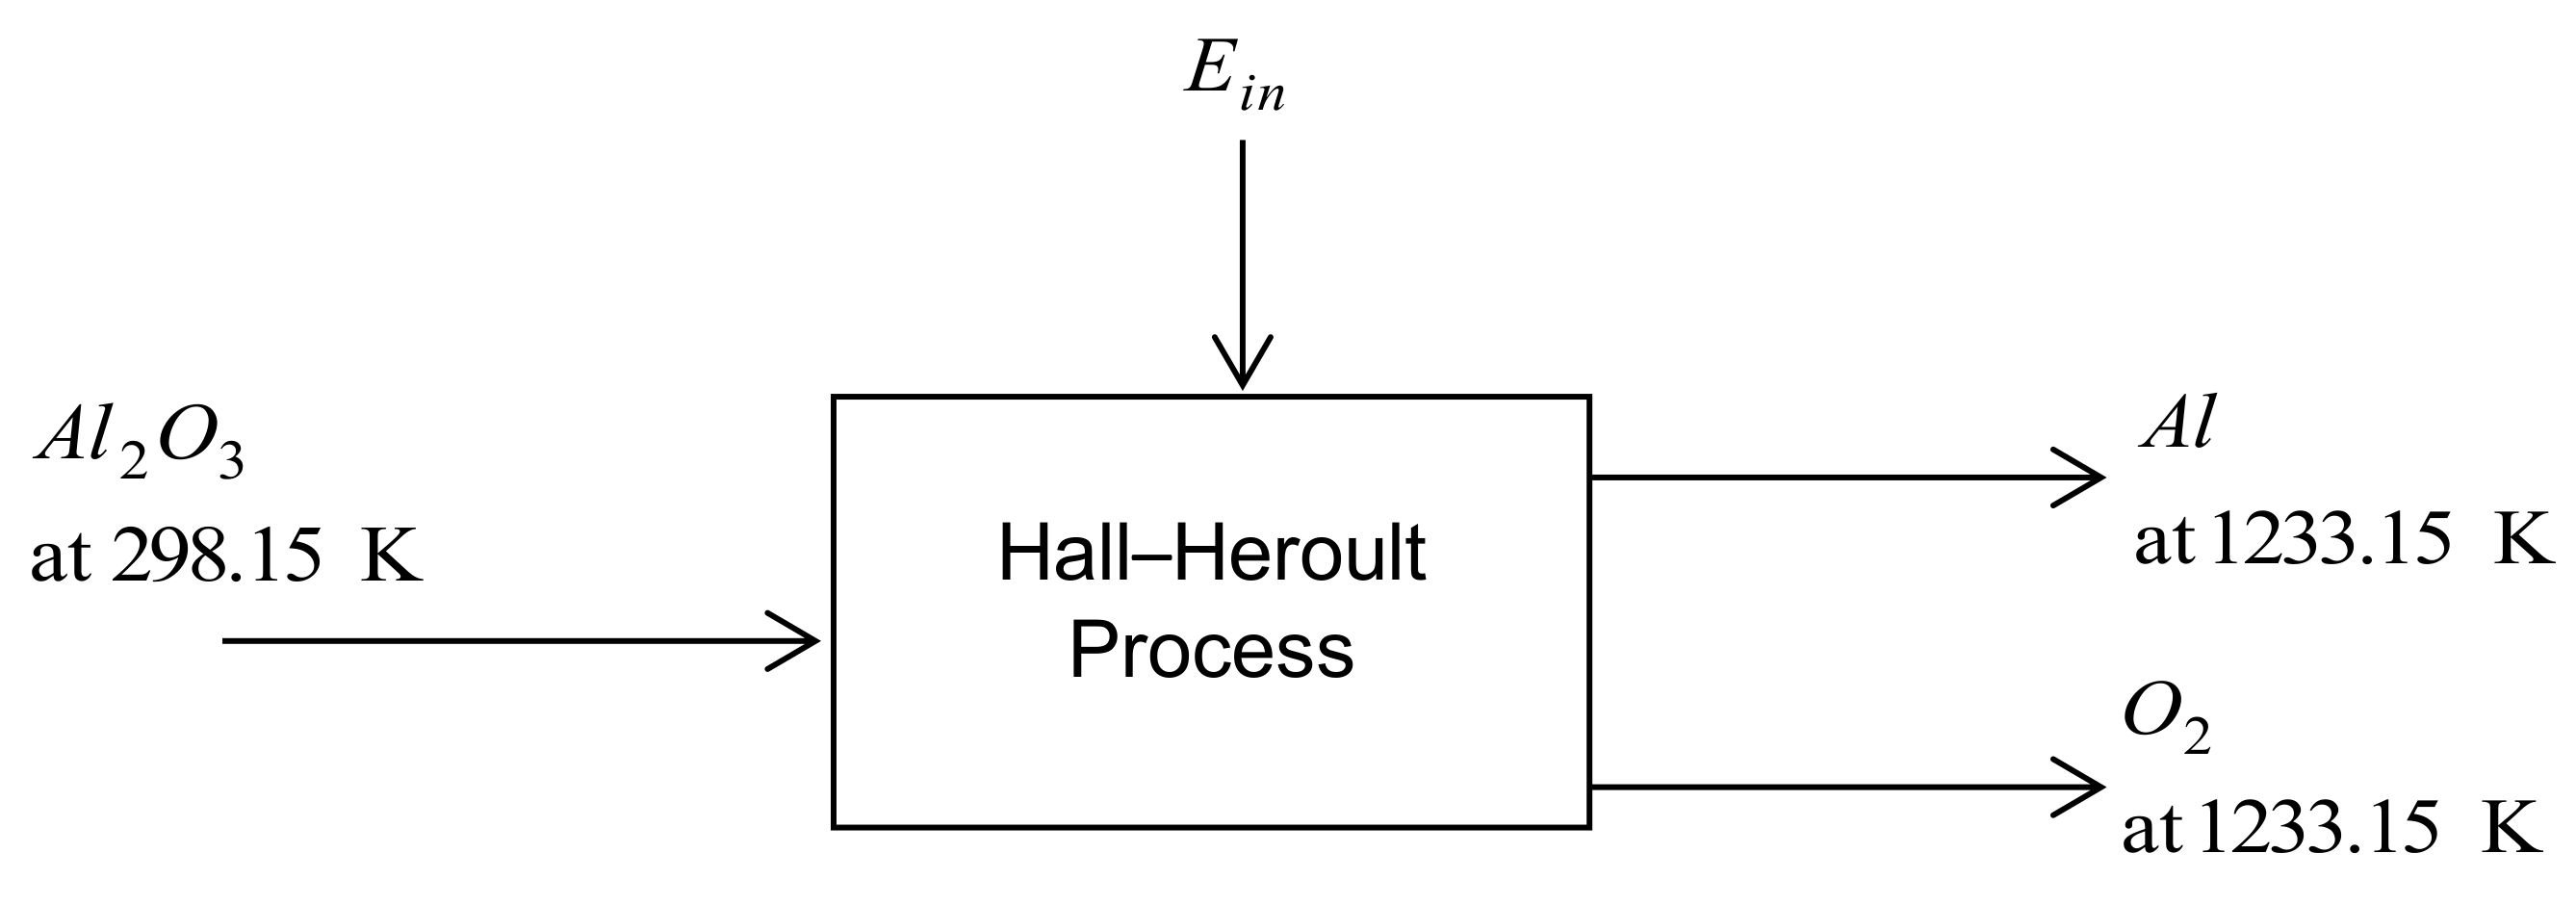
3.1.1. Hall–Heroult Process
3.1.2. Inert Anode Hall–Heroult
3.1.3. Wetted Drained Cathode
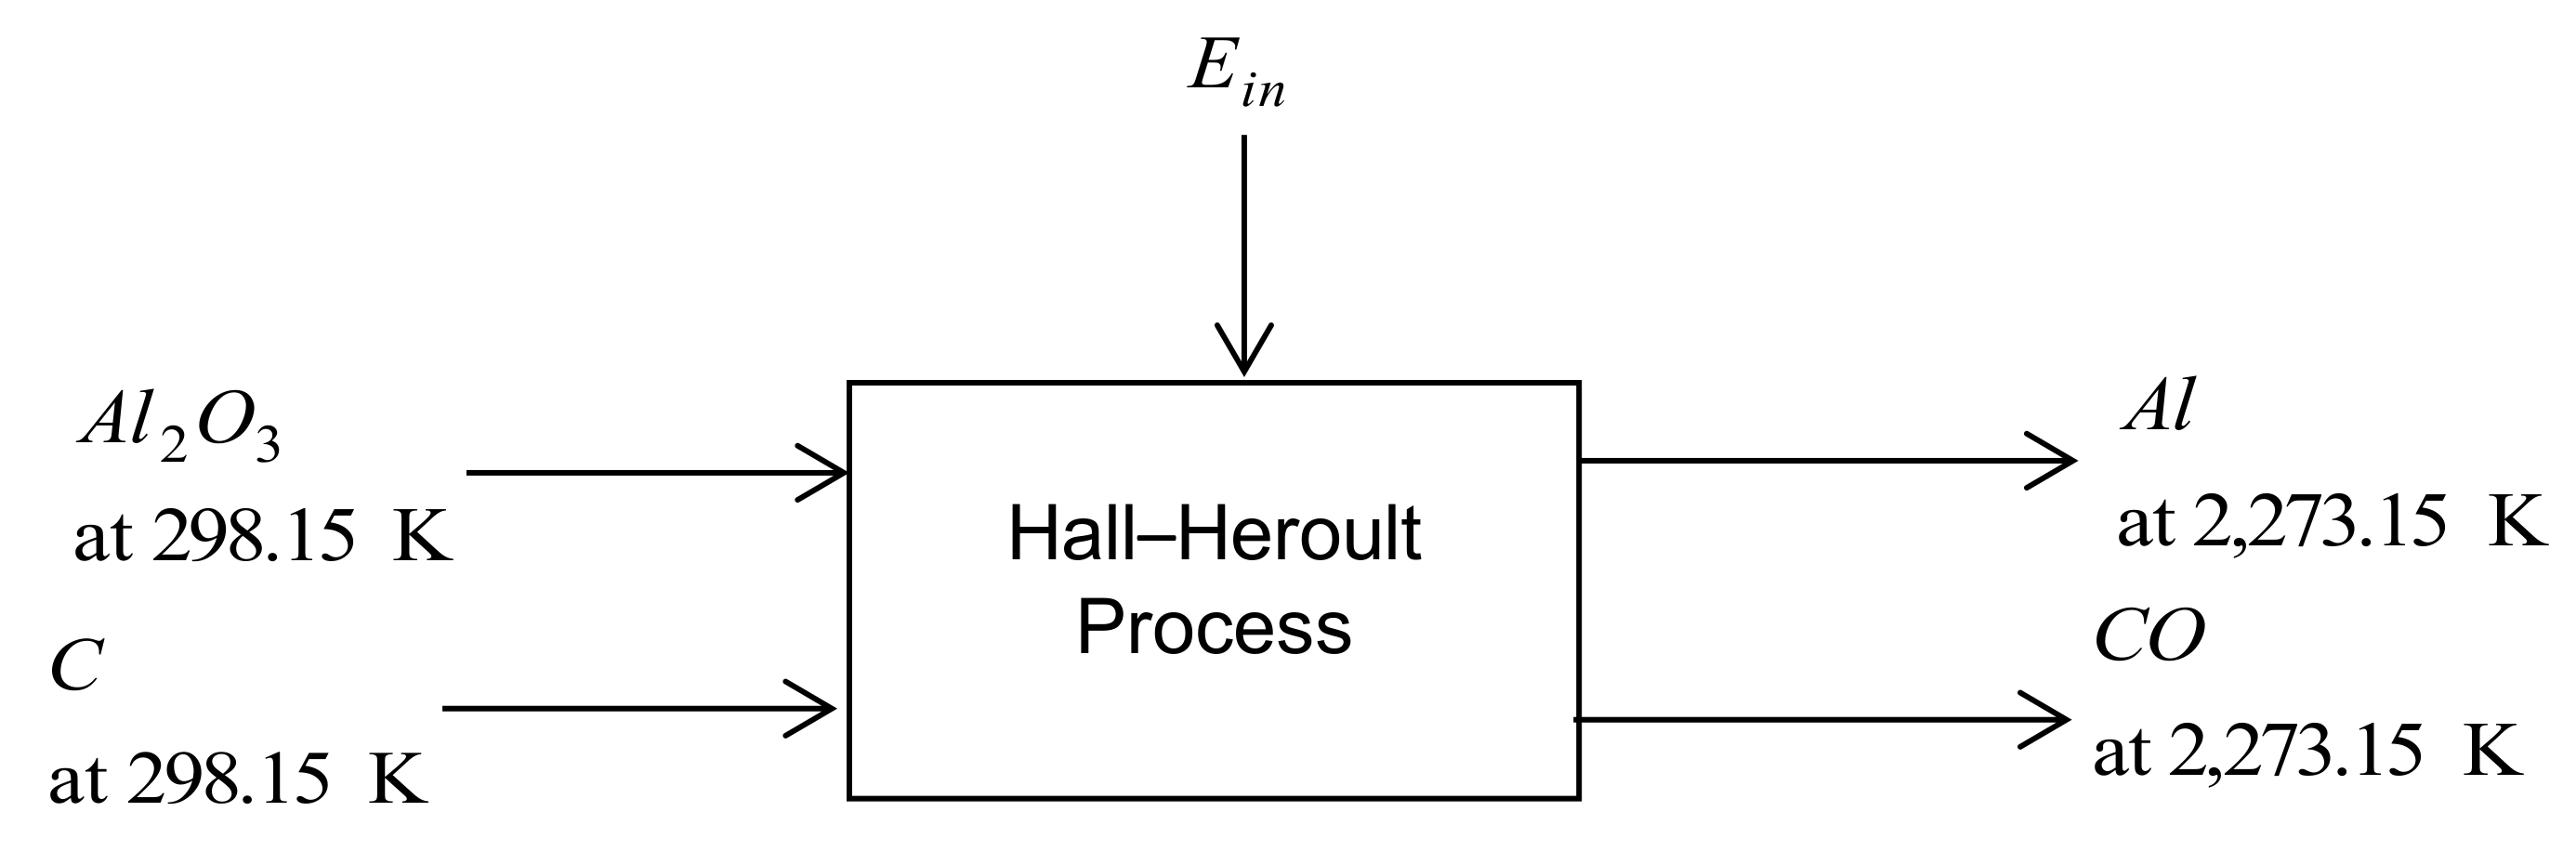
3.1.4. Carbothermic Technology
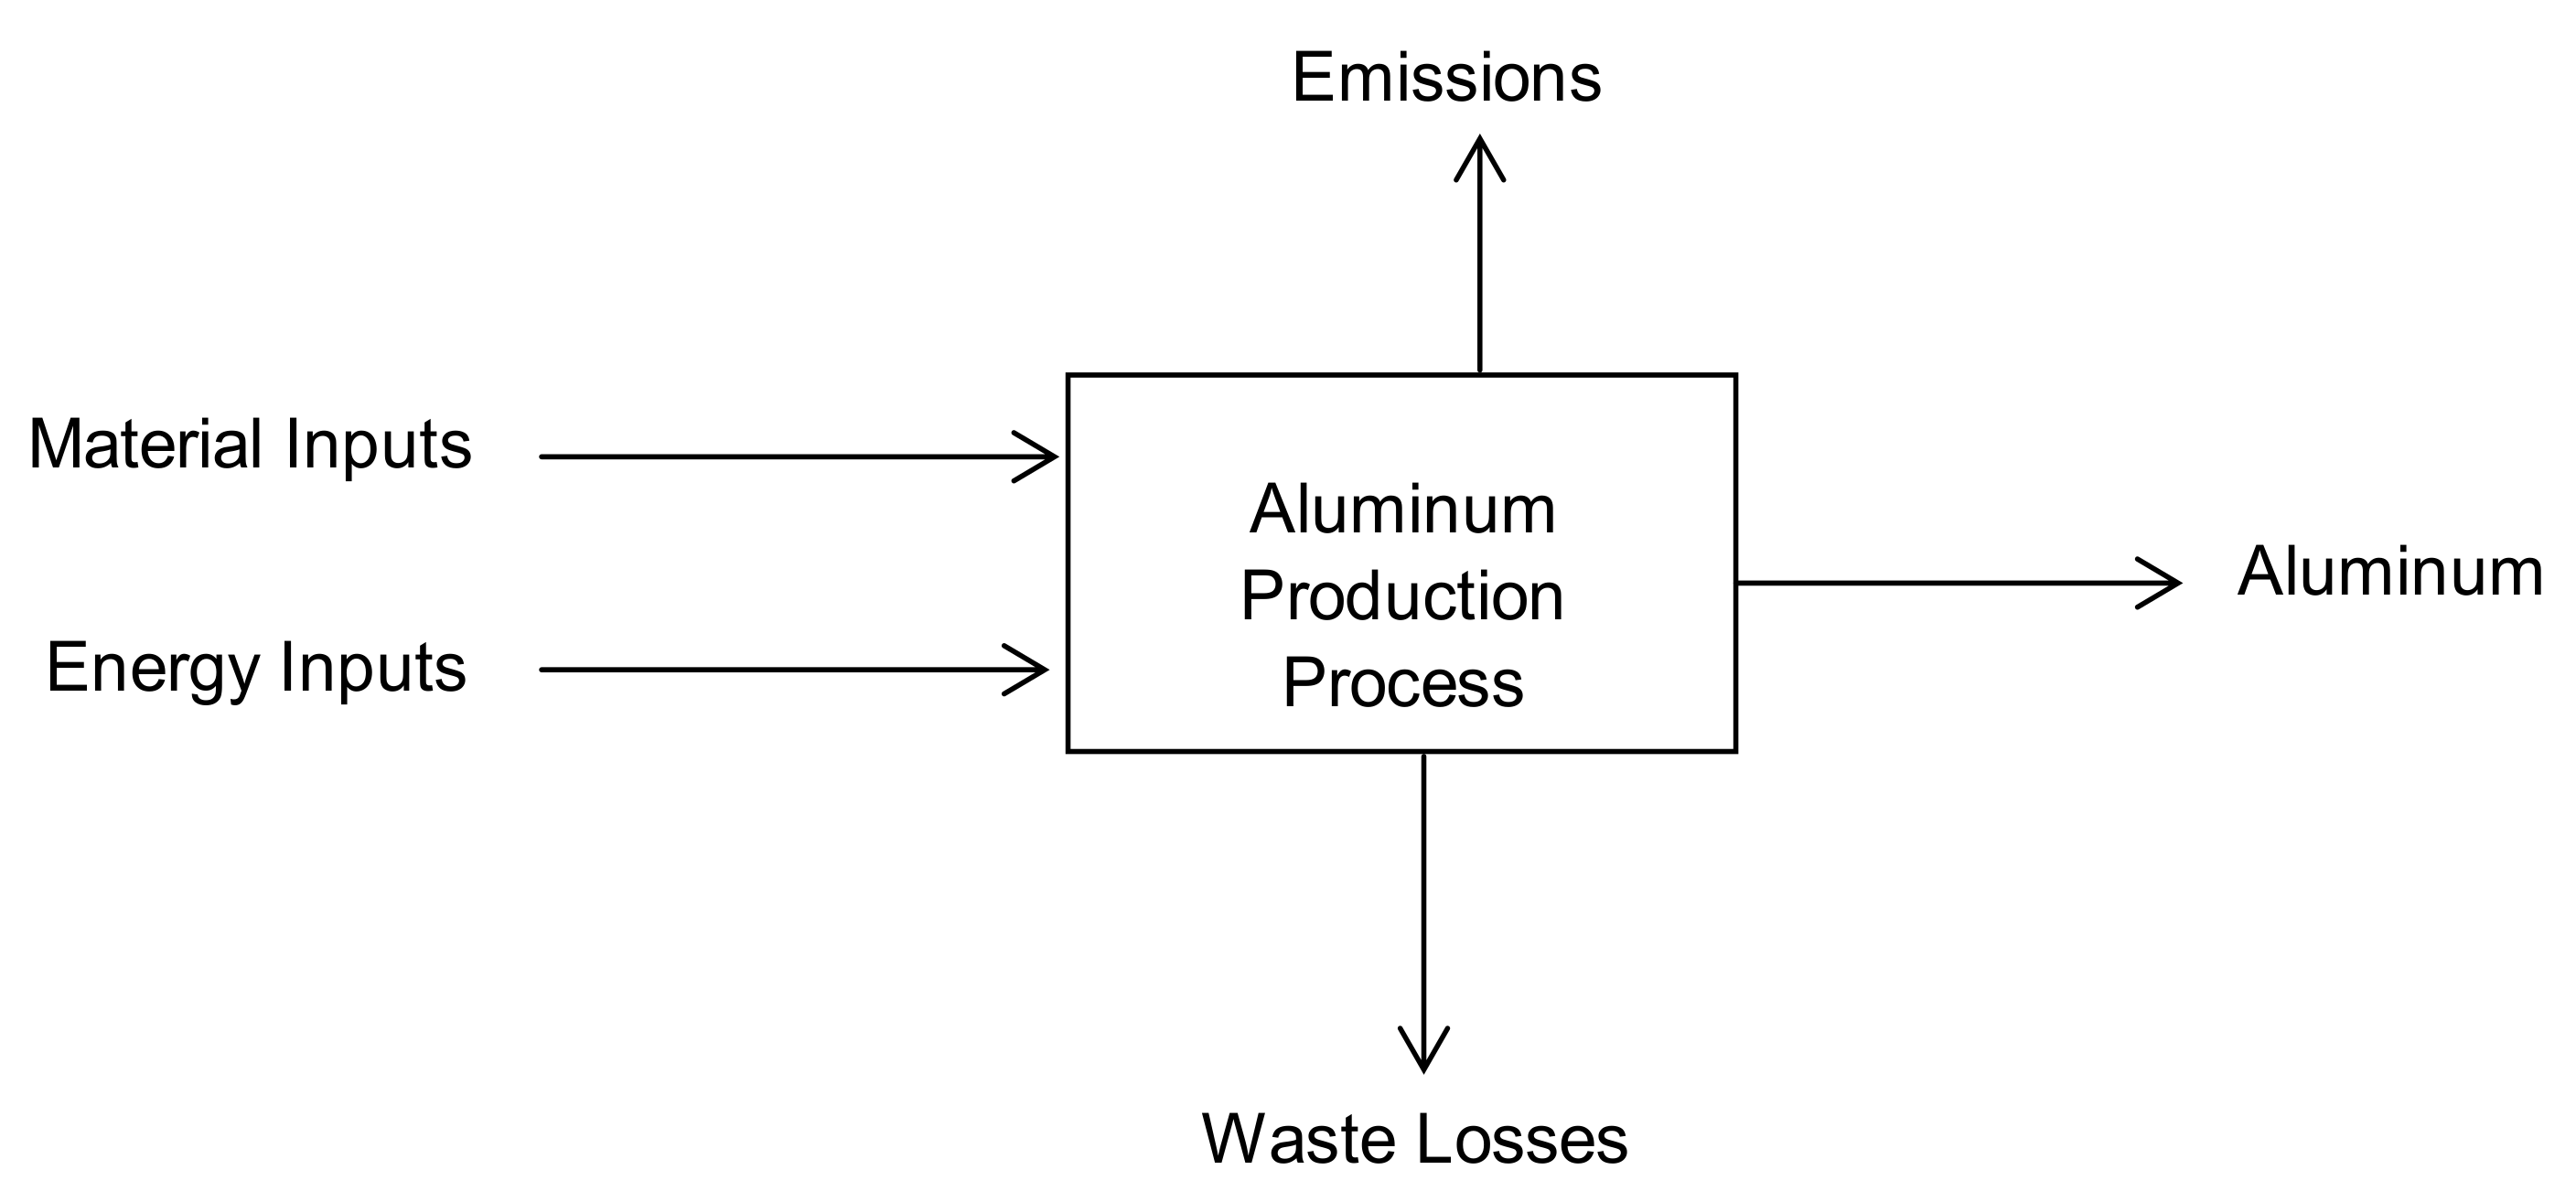
3.2. Actual Energy Consumption, Material Uses and Environmental Impacts of the Different Primary Aluminum Production Processes
3.2.1. Hall–Heroult Process
3.2.2. Inert Anode Technology
3.2.3. Wetted Drained Cathode Technology
3.2.4. Carbothermic Technology
3.3. Summary
4. Using Exergy as a Decision Tool
- As a measure of natural resource use—natural resources are traditionally divided into fuels and other (ex. material) resources. This division seems arbitrary; oil is usually considered to be a fuel resource and wood, a construction material. However, oil can be used for producing useful materials and wood can be used as a fuel. Therefore, it would be more appropriate to treat these resources together; the exergy concept can be used in this situation.
- As a measure of the resources needed to clean the emissions. Since pollution is due to the change in concentration of some specific substances in the environment, the exergy required in a process to remove a number of the substances which are released by a system can be considered as the measure of the environmental impact caused by this system.
- As a comparison criterion by combining the two above uses to measure how effective and environmentally-friendly a primary aluminum technology is regarding natural resources.
4.1. The Reference Environment
- For gaseous substances, such as O2, N2, CO2, H2O, D2O, Ar, He, Ne, Kr and Xe, a standard atmosphere, shown in Table 7, can be used to represent the dead states of these gases.
- For substances such as Al, Co, Cr, Fe, Mg, Mn, P, Sb and Si, a standard Earth’s land surface, shown in Table 8, is adopted to represent the dead states of these elements.
- For substances that exist as ions in the water, the composition of the ions or compounds as existing in standard seawater is adopted, as shown in Table 9.
4.2. Exergy Calculations
- For the reference substances that exist in the atmosphere air, and assuming ideal gas behaviors, the chemical exergy is given by [30]:where EXch,i is the chemical exergy of substance I that exists in the atmospheric air, Pi and Po,i are the partial pressures of substance i in the stream under consideration and in the dead state, respectively, and R is the universal gas (8.314 kJ/kmol K).
- Only 10 chemical elements can be defined using the reference atmosphere; however, for other elements, the Earth’s surface and seawater can serve as the dead states. In such situations, chemical exergy can be calculated by the following equation [30]:where is the standard normal free energy of formation, ni is the number of moles of element i in the compound under consideration, and EXch, i is the chemical exergy of element i of the compound. Table 5 presents the selected standard normal free energy of formation for some compounds used in this thesis [20]. Using Equations (10) and (11) and assuming the temperature, T, and pressure, P, of the stream, are equal to those of the dead state, i.e., To and Po (Po = 1 atm and To = 298.15 K), and all gases under consideration are treated as ideal gases, Table 5 summarizes the standard chemical exergy of the substances that will be used in this paper.
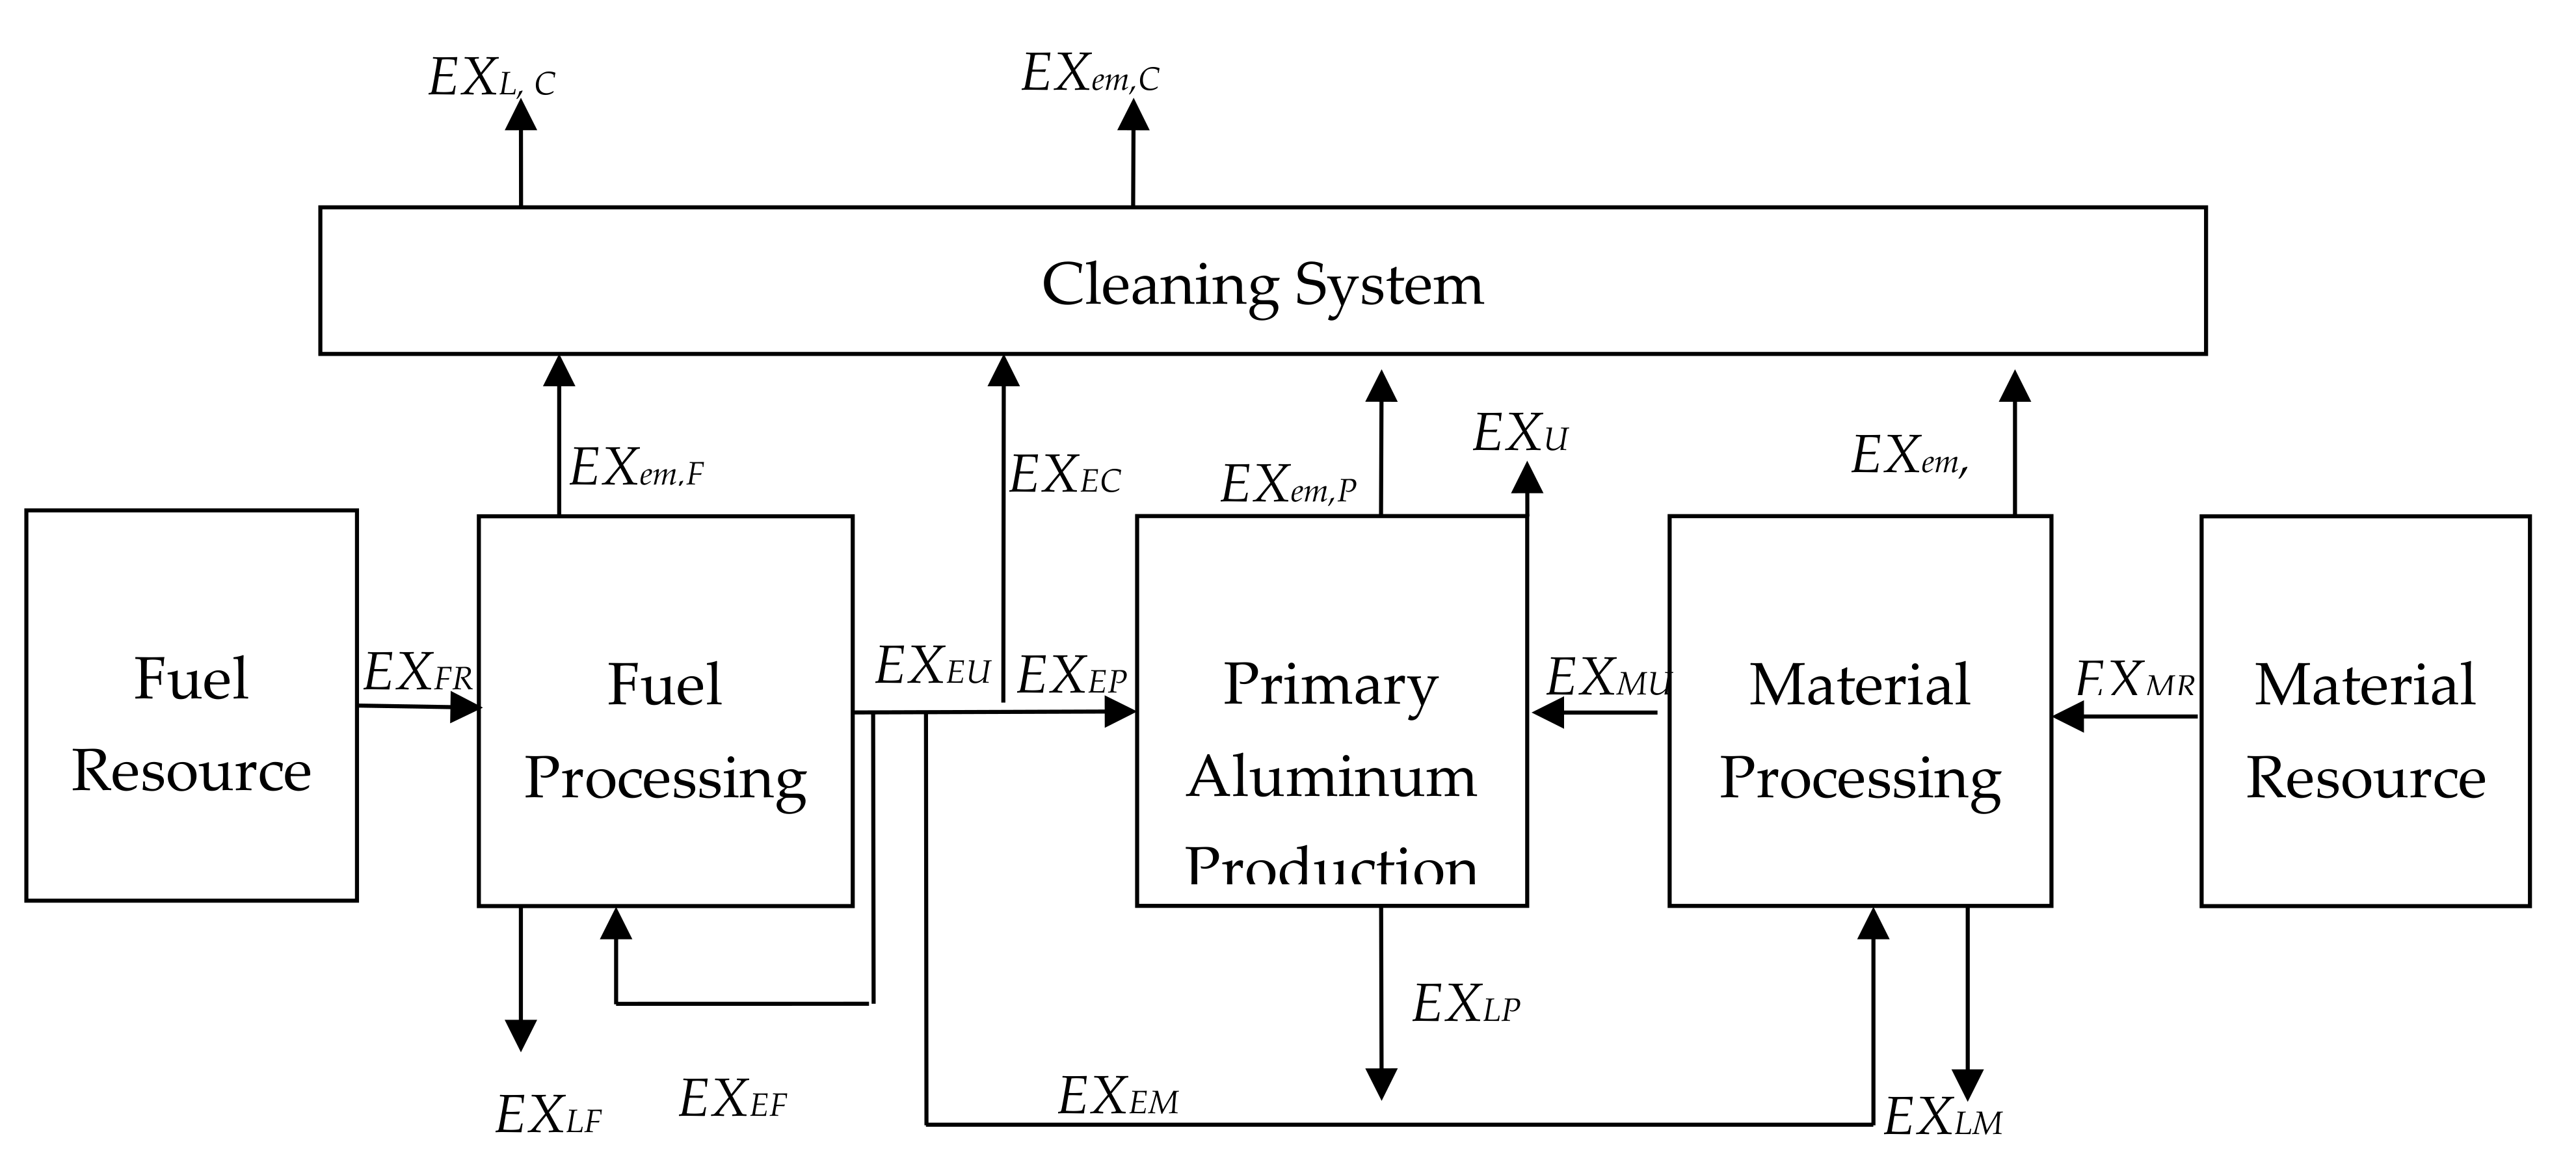
4.3. Proposed Exergy Model
5. Results and Discussion
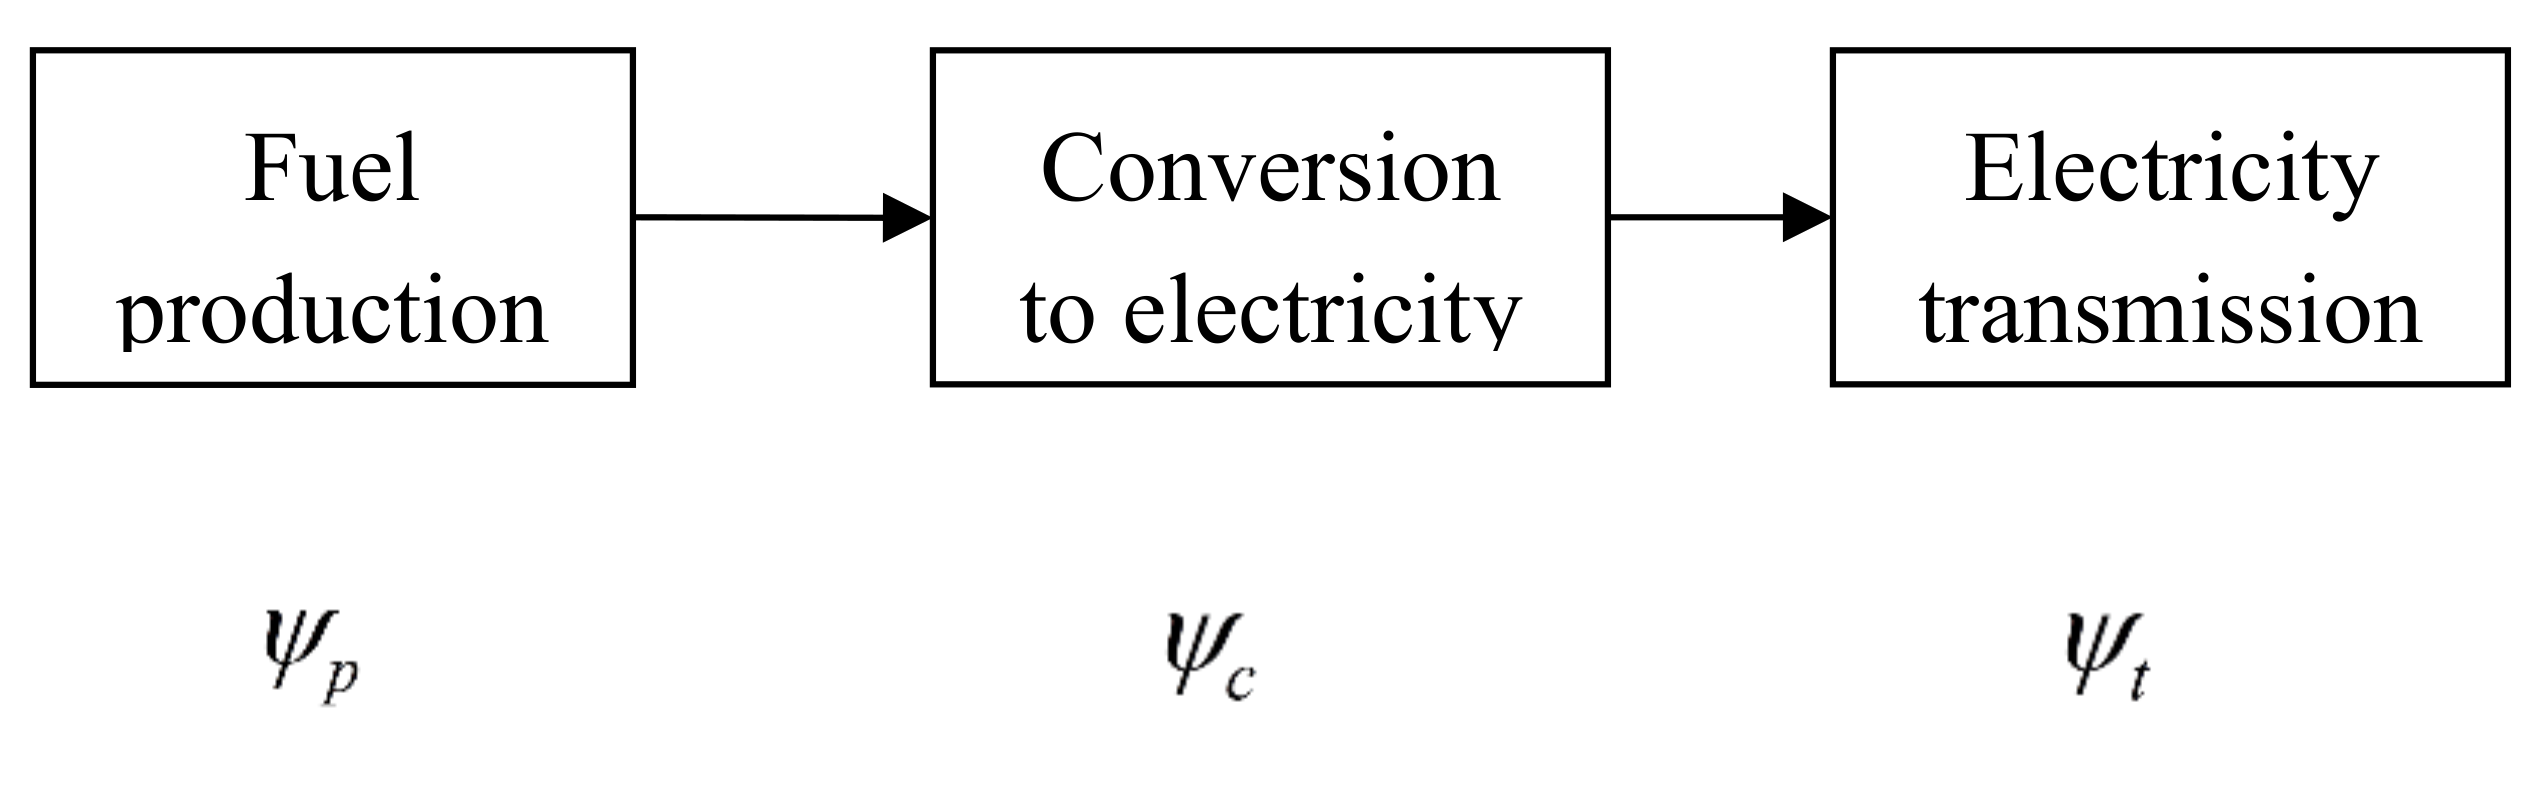
5.1. Source Fuel Exergy
5.2. Material Source Exergy
5.2.1. Alumina
5.2.2. Carbon Anode
5.3. Source Exergy of the Environmental Impact
5.3.1. CO2 Emission from Electricity Generation
5.3.2. CO2 Emission from Alumina and Carbon Anode Productions
5.4. Final Model Summary
6. Conclusions
Author Contributions
Conflicts of Interest
References
- The Aluminum Association. Aluminum Statistical Review for 1999; National Minerals Information Center: Washington, DC, USA, 2000.
- Robinson, T. Lowering energy intensity and emissions in the aluminum industry with government/industry/academia partnership. In Light Metals; TMS: Warrendale, PA, USA, 2004; pp. 277–281. [Google Scholar]
- Office of Industrial Technologies. Aluminum Industry for Technology Roadmap. 2003. Available online: https://www1.eere.energy.gov/manufacturing/resources/aluminum/pdfs/al_roadmap.pdf (accessed on 14 April 2018).
- Meirbekova, R.; Haarberg, G.M.; Thonstad, J.; Saevarsdottir, G. Influence of Sulfur Species on Current Efficiency in the Aluminum Smelting Process. Metall. Mater. Trans. B 2016, 47, 1309–1314. [Google Scholar] [CrossRef]
- Gunasegaram, D.R.; Molenaar, D. Towards improved energy efficiency in the electrical connections of Hall–Héroult cells through Finite Element Analysis (FEA) modeling. J. Clean. Prod. 2015, 93, 174–192. [Google Scholar] [CrossRef]
- Yang, Y.; Gao, B.; Wang, Z.; Shi, Z.; Hu, X. Study on the Inter-electrode Process of Aluminum Electrolysis. Metall. Mater. Trans. B 2016, 47, 621–629. [Google Scholar] [CrossRef]
- Wall, G. Exergy flows in industrial processes. Energy 1988, 13, 197–208. [Google Scholar] [CrossRef]
- Mizes, E.; Cornelissen, R.; Hirs, G.; Boom, R. Exergy analysis of the conventional textile washing process. Energy Convers. Manag. 1998, 39, 1835–1843. [Google Scholar] [CrossRef]
- Rosen, M.; Dincer, I. A study of industrial steam process heating through exergy analysis. Energy Res. 2004, 28, 917–930. [Google Scholar] [CrossRef]
- Gong, M. Exergy analysis of a pulp and paper mill. Int. J. Energy Res. 2005, 29, 79–93. [Google Scholar] [CrossRef]
- Ostovski, O.; Zhang, G. Energy and exergy analyses of direct ironsmelting processes. Energy 2005, 30, 2772–2783. [Google Scholar]
- Ozgener, L.; Ozgener, O. Exergy analysis of industrial pasta drying process. Int. J. Energy Res. 2006, 30, 1323–1335. [Google Scholar] [CrossRef]
- Yang, W.; Liu, X.; Liu, J.; Wang, Z.; Zhou, J.; Cen, K. Thermodynamics analysis of carbothermal-chlorination reduction in aluminum production. Appl. Therm. Eng. 2017, 111, 876–883. [Google Scholar] [CrossRef]
- Balomenos, E.; Panias, D.; Paspaliaris, I. Energy and exergy analysis of the primary aluminum production processes: A review on current and future sustainability. Miner. Process. Extr. Metall. Rev. 2011, 32, 69–89. [Google Scholar] [CrossRef]
- Zhao, R.; Nowicki, C.; Gosselin, L.; Duchesne, C. Energy and exergy inventory in aluminum smelter from a thermal integration point-of-view. Int. J. Energy Res. 2016, 40, 1321–1338. [Google Scholar] [CrossRef]
- Jarrett, N.; Frank, W.; Keller, R. Advances in aluminum smelting. Metall. Treatises AIME 1981, 93, 137–139. [Google Scholar]
- Industrial Technology Program. Inert Anode Roadmap. 1998. Available online: https://www.energy.gov/sites/prod/files/2013/11/f4/inertroad.pdf (accessed on 13 April 2018).
- Boxall, L.; Cook, A.; Hayden, W. TiB2 cathode material: Application in conventional VSS cells. J. Light Met. 1984, 36, 35–39. [Google Scholar] [CrossRef]
- Burkin, A. Production of Aluminum and Alumina; Imperial College: London, UK, 1987. [Google Scholar]
- Wagman, D.; Evans, W.; Parker, V.; Halow, I.; Bailey, S.; Schumm, R. Selected Values of Chemical Thermodynamic Properties; U.S. Department of Commerce, National Bureau of Standard: Gaithersburg, MD, USA, 1968.
- NIST Chemistry Webbook. Standard Reference Data Program. 2003. Available online: http://webbook.nist.gov (accessed on 15 February 2007).
- Moran, M.; Shapiro, H. Fundamentals of Engineering Thermodynamics; John Willey & Sons, Inc.: New York, NY, USA, 2000. [Google Scholar]
- Bruno, M. Aluminum carbothermic technology comparison to Hall-Heroult process. In Light Metals; TMS: Warrendale, PA, USA, 2003; pp. 395–400. [Google Scholar]
- U.S. Department of Energy, Office of Industrial Technologies. Technical Working Group on Inert Anode Technologies; American Society of Mechanical Engineers: Washington, DC, USA, 1999. [Google Scholar]
- Ayres, R.; Ayres, L.; Martinas, K. Exergy, waste accounting, and life-cycle analysis. Energy 1997, 23, 355–363. [Google Scholar] [CrossRef]
- Rosen, M.; Dincer, I. Exergy analysis of waste emissions. Int. J. Energy Res. 1999, 23, 1153–1163. [Google Scholar] [CrossRef]
- Sciubba, E. Beyond thermoeconomics? The concept of extended exergy accounting and its application to the analysis and design of thermal systems. Exergy Int. J. 2001, 1, 68–84. [Google Scholar] [CrossRef]
- Zhang, M. Analysis of energy Conversion Systems, Including Material and Global Warming Aspects. Ph.D. Thesis, Oregon State University, Corvallis, OR, USA, 12 October 1995. [Google Scholar]
- Szargut, J.; Morris, D.; Steward, R. Exergy Analysis of Thermal, Chemical, and Metallurgical Processes; Hemisphere Publishing Corporation: New York, NY, USA, 1988. [Google Scholar]
- Moran, M. Availability Analysis: A Guide to Efficient Energy Use; Prentice-Hall, Inc.: Upper Saddle River, NJ, USA, 1982. [Google Scholar]
- Sciubba, E. Extended exergy accounting applied to energy recovery from waste: The concept of total recycling. Energy 2003, 28, 1315–1334. [Google Scholar] [CrossRef]
- Boustead, I.; Hancock, G. HandBook of the Industrial Energy Analysis; John Wiley & Sons: New York, NY, USA, 1979. [Google Scholar]
- Petcher, N. Combined Heating, Cooling and Power Handbook: Technologies and Application; The Fairmont Press, Inc.: Lilburn, GA, USA, 2003. [Google Scholar]
- Reistad, G. Available energy conversion and utilization in the United States. J. Energy Power 1975, 97, 429–434. [Google Scholar] [CrossRef]
- The Aluminum Association. Life Cycle Inventory Report for the North American Aluminum Industry; The Aluminum Association: Washington, DC, USA, 1998. [Google Scholar]
- Energy Information Administration. 1991 Energy Consumption by Manufacturing; Manufacturing Energy Consumption Survey (MECS); DOE/EIA-0512 (94); Energy Information Administration: Washington, DC, USA, 1994.
- Zhang, M.; Reistad, G. Analysis of energy conversion systems, including material and global warming aspects. HVAC&R Res. 1998, 4, 45–65. [Google Scholar]
- U.S. Department of Energy, Office of Industrial Technologies. Energy and Environmental Profile of the U.S. Aluminum Industry; Energetics: Columbia, MD, USA, 1997. [Google Scholar]
- Department Of Energy (DOE). Emissions of Greenhouse Gases in the United States; DOE/EIA-0573(2000); DOE: Washington, DC, USA, 2000.
- Environment Information Center. Energy Information Abstract Annual; Bowker A & I Pub.: New York, NY, USA, 1993. [Google Scholar]


| Component | Voltage (V) | Distribution (%) |
|---|---|---|
| External connections | 0.16 | 3.4 |
| Anode | 0.32 | 6.9 |
| Polarization | 0.60 | 12.9 |
| Bath | 1.76 | 38.0 |
| Reaction | 1.20 | 25.9 |
| Cathode | 0.47 | 10.1 |
| Other | 0.13 | 2.8 |
| Substance | Enthalpy of Formation (MJ/kmol) | Enthalpy of Formation (MJ/kg) |
|---|---|---|
| Al2O3 | −1675.690 | −16.428 |
| CO2 | −393.520 | −8.944 |
| CO | −110.530 | −3.948 |
| O2 | 0 | 0 |
| C | 0 | 0 |
| Temperature Range (K) | A | B | C | D | E |
|---|---|---|---|---|---|
| <933.45 | 6.71348 | −1.29418 | 2.04599 | 0.81916 | −0.066294 |
| >933.45 | 7.58868 | 9.40685 × 10⁻⁹ | 4.26987 × 10⁻⁹ | 6.43922 × 10⁻⁹ | 1.30976 × 10⁻⁹ |
| Substance | |||||
|---|---|---|---|---|---|
| CO | 3.710 | −1.619 | 3.692 | −2.032 | 0.240 |
| CO2 | 2.401 | 8.735 | −6.607 | 2.002 | 0 |
| O2 | 3.626 | −1.878 | 7.055 | −6.764 | 2.156 |
| Substance | Molecular Mass (kg/kmol) | Gibbs Free Energy (kJ/kmol) | Standard Chemical Exergy (kJ/kmol) | Standard Chemical Exergy (kJ/kg) |
|---|---|---|---|---|
| O2 | 32 | 0 | 3924 | 123 |
| CO2 | 44 | −394,380 | 19,817 | 450 |
| C | 12 | 0 | 410,272 | 34,189 |
| Al | 27 | 0 | 888,746 | 32,917 |
| Al2O3 | 102 | −1,581,000 | 202,380 | 1984 |
| CO | 28 | −137,020 | 275,214 | 9829 |
| SiO2 | 60 | −856,000 | 1900 | 32 |
| Si | 28 | 0 | 853,977 | 30,499 |
| Al2O3·3H2O | 156 | −2,287,400 | 227,267 | 1456 |
| Al2SiO5 | 162 | −2,625,880 | 15,400 | 95 |
| H2 | 2 | −236,100 | 236,100 | 118,050 |
| Technology | Energy Use (kWh) | Alumina (kg) | Carbon Anode [carbon] (kg) | CO2 (kg) [CO] (kg) |
|---|---|---|---|---|
| Hall–Heroult | 15.37 | 1.93 | 0.45 | 1.66 |
| Wetted cathode | 11.83 | 1.93 | 0.45 | 1.66 |
| Inert anode | 16.82 | 1.93 | 0 | 0 |
| Carbothermic | 10.15 | 1.89 | [0.67] | [1.56] |
| Best technology | Carbothermic | Carbothermic | Inert anode | Inert anode |
| Substances | Conventional Mean Pressure in the Environment (kPa *) |
|---|---|
| Ar | 0.906 |
| CO2 | 0.0335 |
| D2O (g) | 0.000342 |
| H2O (g) | 2.2 |
| He | 0.000485 |
| Kr | 0.000097 |
| N2 | 75.78 |
| Ne | 0.00177 |
| O2 | 20.39 |
| Xe | 0.0000087 |
| Chemical Element | Reference Species | |
|---|---|---|
| Formula | Mole Fraction | |
| Al (s) | Al2SiO5 | 2 × 10⁻³ |
| Co (s) | Co3O4 | 2 × 10⁻⁷ |
| Cr (s) | Cr2O3 | 4 × 10⁻⁷ |
| Fe (s) | Fe2O3 | 1.3 × 10⁻³ |
| Mg (s) | CaCO3OMgCO3 | 2.3 × 10⁻³ |
| Mn (s) | MnO2 | 2 × 10⁻⁴ |
| P (s) | Ca(PO4)2 | 4 × 10⁻⁴ |
| Si (s) | SiO2 | 0.472 |
| Chemical Element | Reference Species | |
|---|---|---|
| Chemical Formula | Average Molarities (mole/kg H2O) | |
| Ca (s) | Ca2+ | 9.6 × 10⁻³ |
| Cl2 (g) | Cl−1 | 0.5657 |
| Cu (s) | Cu2+ | 7.3 × 10⁻¹⁰ |
| F2 (g) | F−1i | 3.87 × 10⁻⁵ |
| Na (s) | Na+ | 0.474 |
| Fuel (1 kg) | Production and Delivery Exergy (MJ) | Exergy Content of Fuel (MJ) | Source Exergy (MJ) | Exergy Efficiency (%) |
|---|---|---|---|---|
| Coal | 1.4 | 34.2 | 35.6 | 96.1 |
| Coke | 4.0 | 29.9 | 33.9 | 88.2 |
| Natural gas | 7.1 | 51.8 | 58.9 | 87.9 |
| Fuel oil | 8.9 | 47.1 | 56.0 | 84.1 |
| Kerosene | 8.9 | 46.5 | 55.4 | 83.9 |
| Diesel | 8.8 | 44.4 | 53.2 | 83.5 |
| Gasoline | 9.7 | 47.5 | 57.2 | 83.0 |
| Propane | 8.9 | 48.8 | 57.7 | 84.6 |
| Butane | 8.9 | 48.3 | 57.2 | 84.4 |
| Calcined petroleum coke | 0.4 | 35.4 | 35.8 | 98.9 |
| Pitch | 0.04 | 40.2 | 40.2 | 99.9 |
| Green coke | 0.5 | 33.0 | 33.5 | 98.5 |
| Natural Resource | Quantity |
|---|---|
| Fuel oil (kg) | 0.093 |
| Natural gas (kg) | 0.17 |
| Electricity (kWh) | 0.109 |
| Bauxite (kg) | 2.64 |
| Natural Resource | Quantity |
|---|---|
| Fuel oil (kg) | 0.004 |
| Natural gas (kg) | 0.073 |
| Electricity (kWh) | 0.266 |
| Caclined petroleum coke (kg) | 0.82 |
| Pitch (kg) | 0.231 |
| Green coke (kg) | 0.085 |
| Source | CO2 Emission (kg/kg of Fuel) | CO2 Emission (kg/MJ of Fuel) | CO2 Emission (kg/MJ of Electricity) a | U.S. Average (%) | Primary Aluminum Industry b (%) |
|---|---|---|---|---|---|
| Coal | 2.14 | 0.063 | 0.19 | 53.7 | 30.1 |
| Natural Gas | 1.98 | 0.038 | 0.12 | 9.6 | 5.4 |
| Fuel Oil | 3.52 | 0.075 | 0.23 | 4 | 2.25 |
| Nuclear | 0 | 0 | 0 | 21.9 | 12.3 |
| Hydroelectric | 0 | 0 | 0 | 10.8 | 50 |
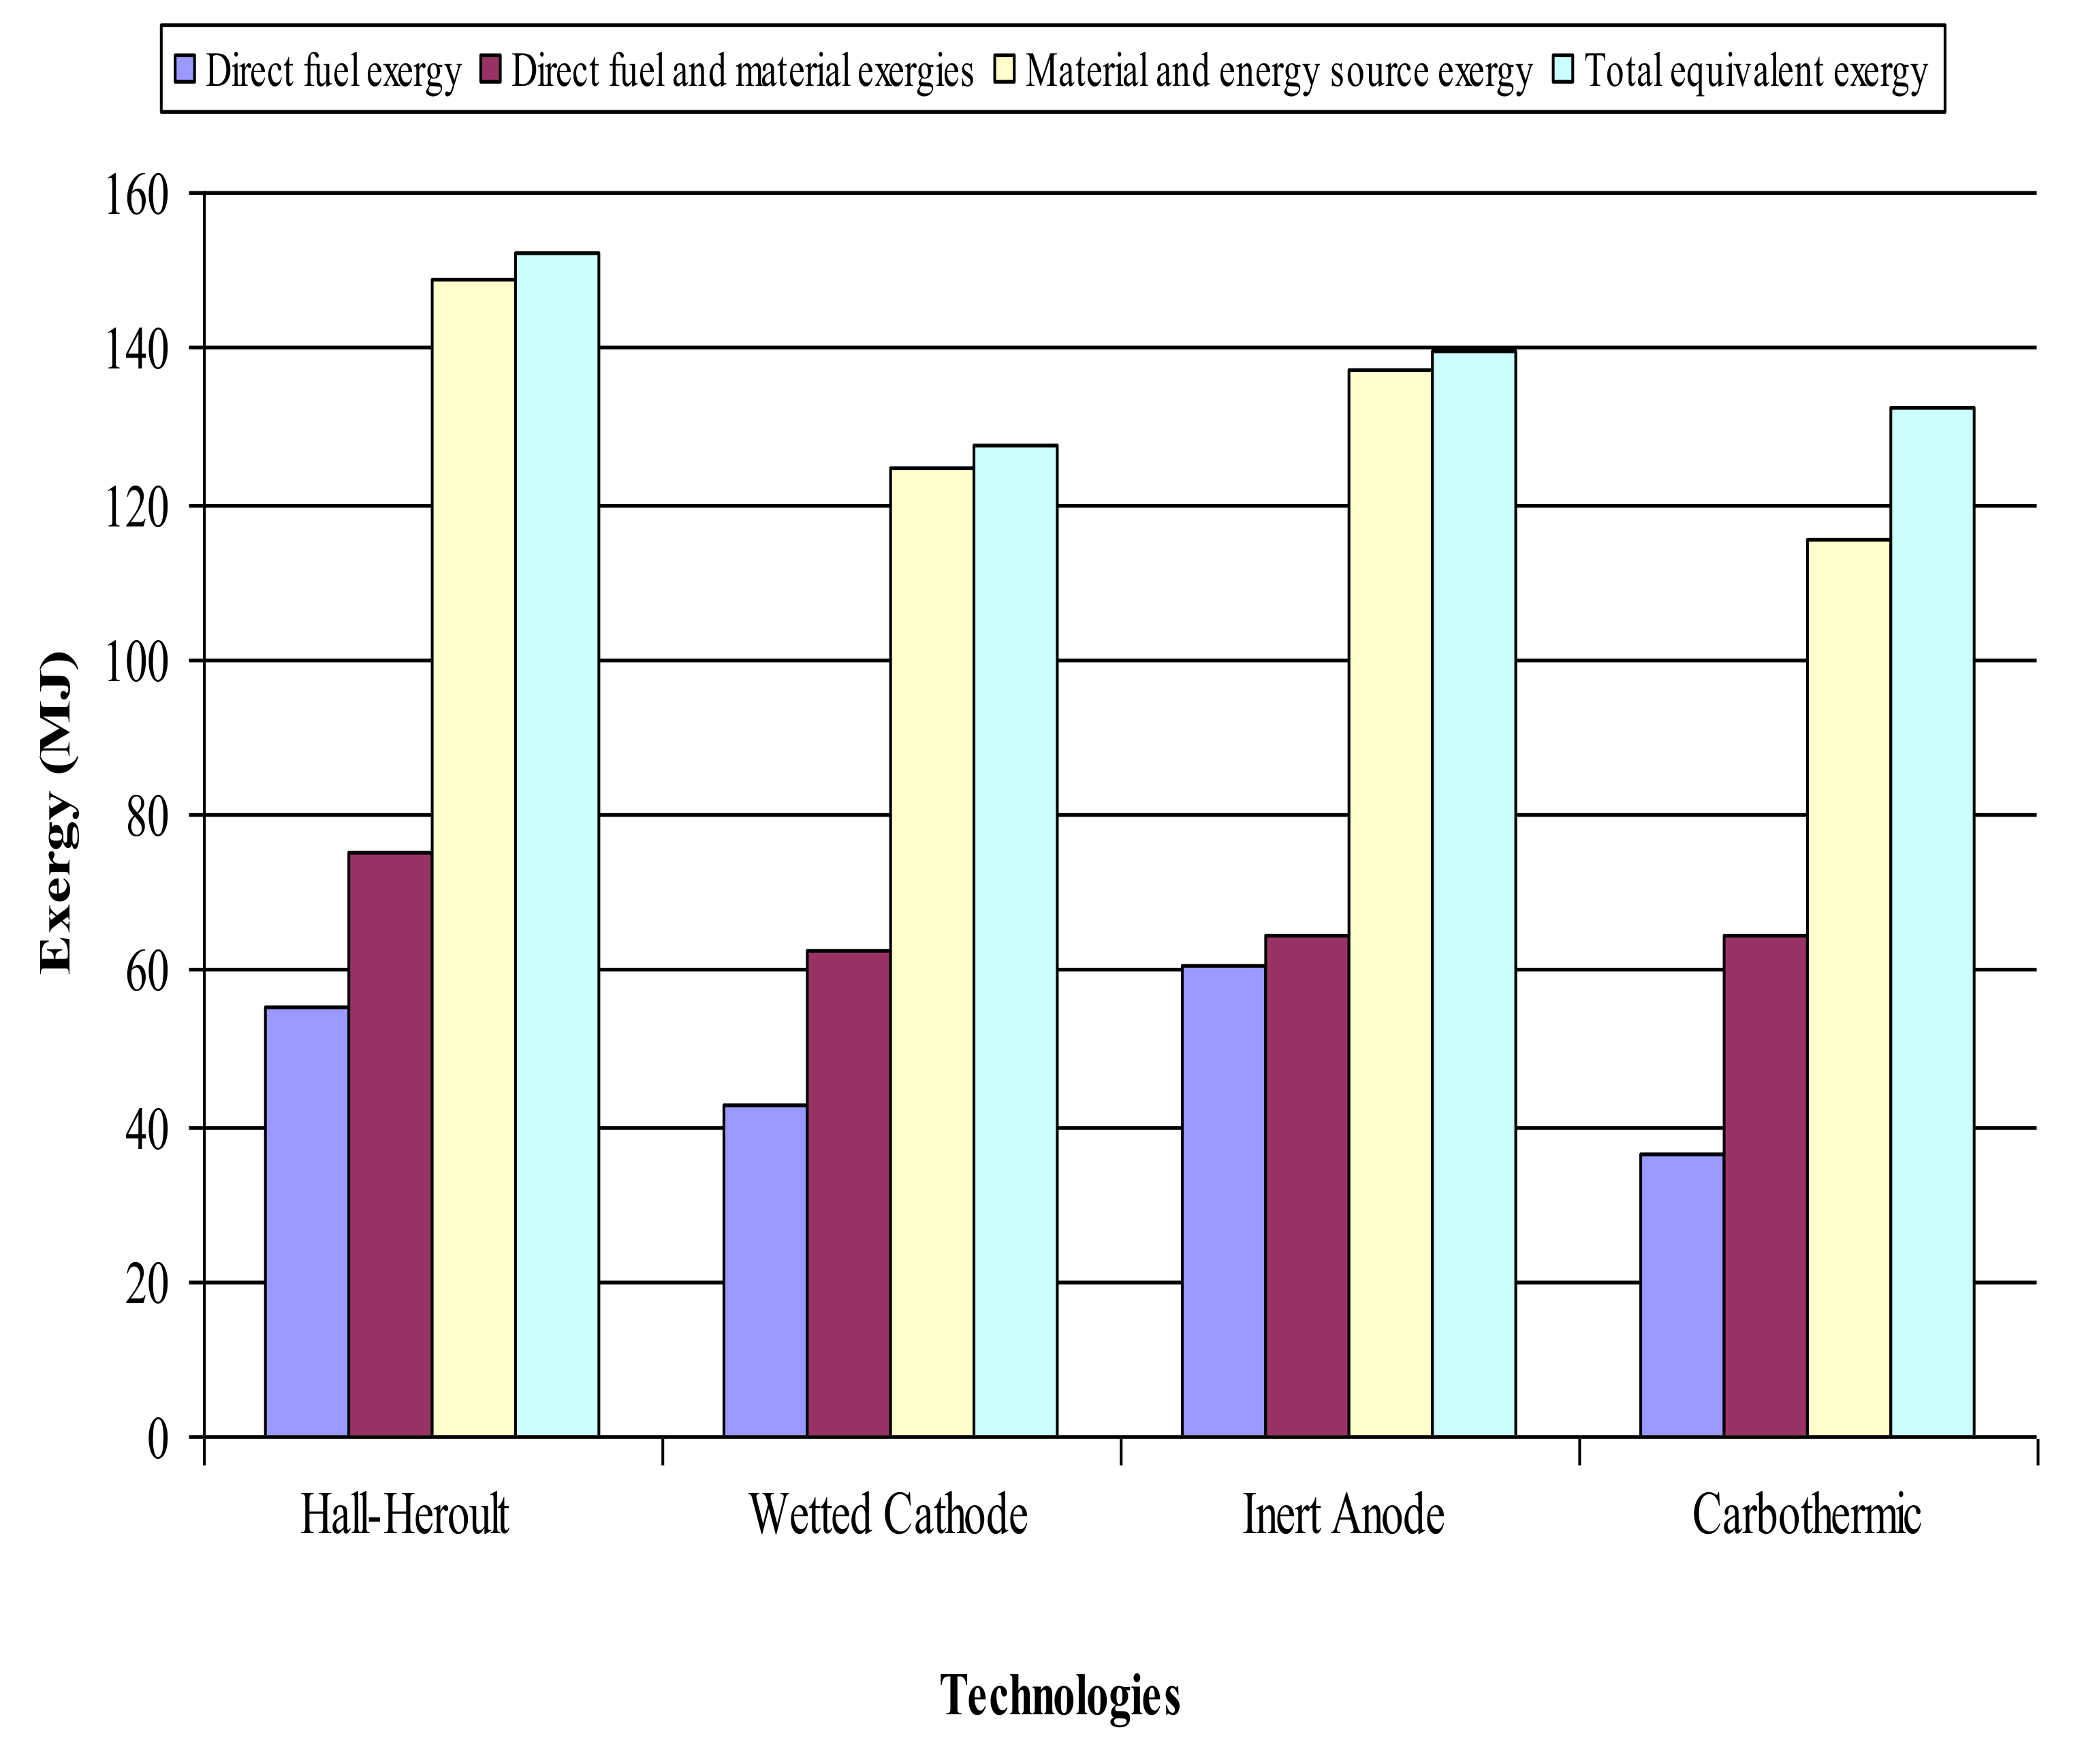
| Technology Name | Hall-Heroult | Wetted Cathode | Inert Anode | Carbothermic | |
|---|---|---|---|---|---|
| Direct fuel exergy requirement (MJ) | 55.33 | 42.59 | 60.55 | 36.54 | |
| Source fuel exergy requirement (MJ) | 104.89 | 80.73 | 114.78 | 69.26 | |
| Direct material exergy requirement (MJ) | Anode | 16.11 | 16.11 | 0 | 0 |
| Alumina | 3.83 | 3.83 | 3.83 | 3.75 | |
| Carbon | 0 | 0 | 0 | 23.99 | |
| Resource material exergy requirement (MJ) | Anode | 21.53 | 21.53 | 0 | 0 |
| Alumina | 22.5 | 22.5 | 22.5 | 22.04 | |
| Carbon | 0 | 0 | 0 | 23.99 | |
| Environmental Impact (kg) | CO2 | 6.96 | 6.08 | 5.56 | 3.87 |
| CO | 0 | 0 | 0 | 1.56 | |
| Environmental Impact(MJ) | CO2 | 3.13 | 2.74 | 2.50 | 1.74 |
| CO | 0.00 | 0.00 | 0.00 | 15.33 | |
| Total direct fuel exergy (MJ) | 55.33 | 42.59 | 60.55 | 36.54 | |
| Total direct fuel and material exergy (MJ) | 75.27 | 62.53 | 64.38 | 64.28 | |
| Total source exergy (MJ) | 148.92 | 124.76 | 137.28 | 115.29 | |
| Total exergy equivalent (MJ) | 152.05 | 127.50 | 139.78 | 132.36 |
© 2018 by the authors. Licensee MDPI, Basel, Switzerland. This article is an open access article distributed under the terms and conditions of the Creative Commons Attribution (CC BY) license (http://creativecommons.org/licenses/by/4.0/).
Share and Cite
Obaidat, M.; Al-Ghandoor, A.; Phelan, P.; Villalobos, R.; Alkhalidi, A. Energy and Exergy Analyses of Different Aluminum Reduction Technologies. Sustainability 2018, 10, 1216. https://doi.org/10.3390/su10041216
Obaidat M, Al-Ghandoor A, Phelan P, Villalobos R, Alkhalidi A. Energy and Exergy Analyses of Different Aluminum Reduction Technologies. Sustainability. 2018; 10(4):1216. https://doi.org/10.3390/su10041216
Chicago/Turabian StyleObaidat, Mazin, Ahmed Al-Ghandoor, Patrick Phelan, Rene Villalobos, and Ammar Alkhalidi. 2018. "Energy and Exergy Analyses of Different Aluminum Reduction Technologies" Sustainability 10, no. 4: 1216. https://doi.org/10.3390/su10041216
APA StyleObaidat, M., Al-Ghandoor, A., Phelan, P., Villalobos, R., & Alkhalidi, A. (2018). Energy and Exergy Analyses of Different Aluminum Reduction Technologies. Sustainability, 10(4), 1216. https://doi.org/10.3390/su10041216