Article

The Effects of Zoning Regulations along Fault Zone Areas on Land Development and Property Values after the 921 Chi-Chi Earthquake in Taiwan

1
Department of Urban Development, University of Taipei, Taipei 11153, Taiwan
2
Department of Urban Planning, National Cheng Kung University, Tainan 70101, Taiwan
*
Author to whom correspondence should be addressed.
Sustainability 2018, 10(4), 1175; https://doi.org/10.3390/su10041175
Submission received: 18 January 2018 / Revised: 10 April 2018 / Accepted: 12 April 2018 / Published: 13 April 2018

Abstract

:
Earthquakes are widely recognized as unpredictable and infrequent disasters that result in serious impacts on human settlements. Land use planning is one non-structural measure used to eliminate disaster risk by steering future development away from the existing built environment and enforcing particular structural engineering measures according to the disaster risk. However, arguments have arisen about applying land use planning to earthquake risk areas, as this serves as a type of disaster risk information disclosure that might impact the willingness to develop land or property value. Therefore, this study uses the spatial autocorrelation coefficient to examine the impact of land use planning on both land use and property transactions in the Chelungpu fault zone area (15 m from each side of the fault line) in Taiwan. The overall impacts with and without zoning regulation in the fault zone area are explored. The results demonstrate that parcels that changed to building use in the earlier time period (1995–2008) are located distant from those maintaining the same building use, whereas, later, building use (2008–2014) is located on or nearby the fault zone area. In addition, the most recently constructed buildings are located in or close to the fault zone area and have a relatively higher property price. The legal zoning regulation along the fault zone for building use requires lower height and less intensive building, which might help mitigate the potential impact of future earthquakes.

1. Introduction

The Ring of Fire in the Asian region is considered to be the area on earth most frequently hit by earthquake disasters and it is located in the basin of the Pacific Ocean. Earthquakes are widely recognized as unpredictable and infrequent disasters that have serious impacts on human settlements, including death and injury, property loss and damage, economic depression, and the breakdown of essential facilities [1,2]. Structural engineering measures have been the major way to cope with earthquake disasters, for example by seismic strengthening and the seismic improvement of structures. However, loss of life and building damage are possible whenever development is allowed in hazardous seismic areas if the magnitude of the disaster is at or below the design standard incorporated into the building codes and structural work [3,4,5]. In fact, the threats posed in a given area by future earthquakes with a magnitude larger than that experienced in the past create uncertainty about the ability to mitigate earthquakes’ impacts to acceptable levels using only engineering or construction measures.
Since the 1980s, nonstructural measures in both urban planning and architecture have moved far beyond the retrofitting of seismic damage, and seismic resistance has received much attention worldwide [6,7,8]. Land use planning is one of the nonstructural measures used to eliminate risk by steering future development away from risk areas and by enforcing particular structural engineering practices for that part of the built environment exposed to a relatively high earthquake risk. Common approaches to earthquake loss mitigation include land use planning policies, land acquisition programs, taxation policies, and other strategies in which certain standards, codes, or design requirements are applied only to specific sites known to be particularly hazardous [9]. Nevertheless, arguments have arisen for applying land use planning in earthquake risk areas. Indeed, land use planning is a proactive measure that can be taken to avoid or minimize losses.
The zoning regulation in high earthquake risk areas might impact private land owners and developers given that a relatively higher risk is accompanied by a higher construction cost [5]. A survey demonstrated that residents were willing to pay $6000 to relocate outward from a fault zone area [10]. Other studies suggest that property values are relatively low in earthquake risk areas [11,12,13,14]. Most previous studies regarding disasters in the hedonic house price literature indicate that proximity to a risk source has a negative effect on housing value [15]. However, a contrasting finding demonstrates that locations within fault zones are not disadvantaged for house buying and loan decisions. Another hedonic price study indicates that a surface fault rupture has little impact on the operation of the housing market [16]. A more recent study reports that a legal fault zone area limits the building area and further provides more open space, and such a land use type increases not only the amenity but also the house price in fault zone areas [17].
In Taiwan, the Chelungpu fault slipped, causing the 921 Chi-Chi Earthquake, in 1999. In this earthquake, nearly 2500 people were killed, 11,000 people were injured, and $12 billion worth of damage was incurred. Because more damaged buildings were clustered along the Chelungpu fault line, the Construction and Planning Agency (CPA) of the Ministry of the Interior announced a 50 m temporary prohibited zone along each side of the Chelungpu fault, and the prohibition period continued until the end of 1999. After a more accurate geologic map (1/1000) had been created by the Ministry of Science and Technology in 2000, the CPA announced a 15 m fault zone on each side of the Chelungpu fault, and the zoning regulation continued until the end of 2001. Owing to the serious damage experienced along the Chelungpu fault by urban planning areas, local planning agencies revised the urban planning maps and zoning regulations in the fault zone area 15 m on each side of the Chelungpu fault. Currently, the Chelungpu fault is the only fault that has a fault zone regulation in the urban planning area in Taiwan. Within the regulated fault zone area, building is only allowed for residential use, and the building height should be lower than seven meters. There is no such zoning regulation in non-urban planning areas because the general restriction period placed on the fault zone area only continued until the end of 2001.
In Taiwan, there are forty-one active faults and other earthquake-prone areas, including areas with soil liquefaction and landslides. The argument of whether to apply land use planning in earthquake-prone areas continues worldwide. Therefore, the principle focus of this study is an exploration of the patterns, distributions, and trends of land use and property transactions in geographic information systems. The spatial autocorrelation coefficient can combine the characteristics of both Pearson’s correlation coefficient and Moran’s I to evaluate the spatial characteristic of land use and property transactions. In Taiwan, a distance of 15 m from each side of the fault line has been regulated as a fault zone restricted land use area for over ten years. The assessment of such zoning regulations is important not only to identify the impact on both land use and property transactions but also to determine its effectiveness. Therefore, the spatial cluster of land use change and property transaction value within and outside the regulated fault zone is explored to discuss the impacts, or lack thereof, of zoning regulations in fault zones. In addition, the effectiveness of such zoning regulations will be investigated. The data and methodology are illustrated in Section 2, including the study area, data description, and spatial autocorrelation coefficient. In the next section, the results for the spatial characteristics of land use change and property transactions are discussed. A discussion of the field investigations exploring the effectiveness of zoning regulation in the fault zone area follows in Section 4. The paper then concludes with findings and implications in Section 5.

2. Data and Methodology

2.1. Study Area

Taiwan is located on the Pacific Ring of Fire in a seismically active zone. The Chelungpu fault is an 80 km north–south trending active fault trace located along the western edge of the Central Mountains. In 1999, the Chelungpu fault slipped, and Taiwan experienced a 7.3 magnitude seismic event that became known as the Chi-Chi Earthquake. The north–south trending fault ruptured for over 80 km in Shihgang, Dongshih, Fongyuan, Tanzih, Beitun, Dali, Taiping, and Wufong. There were 2400 people killed, 10,700 people injured, and over 10,000 buildings damaged. The overall economic loss was estimated to be $10 to $12 billion. Because less than 1% of the residential housing had earthquake insurance, housing reconstruction became a serious burden to the victims and the central government.
Because of the topography, the building use was distributed mostly to the west of the Chelungpu fault line (see Figure 1). Right after the Chi-Chi Earthquake, the Architecture and Building Research Institute of Taiwan’s Ministry of the Interior (1999) conducted a survey of the damaged buildings. The building height (number of floors), period of construction, construction materials, building use, earthquake-resistant structural components, and expansive architectural features were included in the survey. According to the survey, the majority of buildings experienced serious damage, including collapse (809 buildings), tilt (253 buildings), and other serious damage (431 buildings) (see Figure 1a). There were 364 buildings with moderate damage and 376 buildings with slight damage (see Figure 1b). In addition, there was a trend toward more damaged buildings being clustered along the fault line in the urban planning area (On the basis of the Urban Planning Law in Taiwan, the urban planning area refers to a planned development for significant facilities serving urban living, such as economic activities, communications, sanitation, public security, national defense, culture, education, and recreation, within a definite area and with rational planning for land use therein.) (see Figure 1c).

2.2. Data Description

2.2.1. Land Use Change Data

Land use change is the conversion of land uses, and land use investigation has been conducted by the Ministry of the Interior in conjunction with the Land Administration, Census Administration, and Revenue Service, on the basis of SPOT-5 satellite phantoms every 10 years. Currently, we have three time periods of land use data, including 1995, 2008, and 2014. In this study, we categorize two types of land use, including (i) building use and (ii) other uses. Buildings and public facilities are in the "building use" category, whereas agriculture, forest, transportation, water resources, leisure facilities, mining, and other uses are in the "other uses" category.
To explore the land use change pattern, we divide land use change into two types: (i) “continue building use” and (ii) “become building use from other uses”; these changes are based upon different time periods (see Figure 2). The applied ratio is based upon land use area per block area (A block is intersected by roads with multiple parcels within it, and a parcel is a piece of land with legally recognized units of private or public land ownership of variable shapes and sizes.). “Continue building use” parcels (1995–2008) are located in a westward direction away from the Chelungpu fault line (see Figure 2a). Both “become building use” parcels (1995–2008) and “become the same building use” parcels (2008–2014) are located outward, compared to the “continue building use” parcels (1995–2008) (see Figure 2b,c). Block areas categorized as “become building use” (2008–2014) are much fewer in number and scattered compared to earlier usage patterns, and some amount of building use is close to the fault zone area (see Figure 2d).

2.2.2. Property Transaction Data

Property transactions are changes in the ownership of a legally recognized piece of land. On the basis of the Equalization of Land Right Act article 47, whenever the ownership of any land is transferred or a right of dien is created over land, the obligee and the obligor shall declare the current transaction value of said land in 30 days (http://law.moj.gov.tw/Eng/LawClass/LawAll.aspx?PCode=D0060009). In this article, we only take single family detached house transactions from 2012 to 2015 into account; the total number of transactions is 15,219 (see Figure 3a). There are more transactions for buildings built before the Chi-Chi Earthquake in the southern portion, whereas there are more transactions for recently constructed buildings in or near the fault zone area in the middle and northern portions. Most of the building use is clustered in the western portion of the Chelungpu fault line (see Figure 3b). In this study, the mean value has been calculated according to the block (by summing all the house transaction events in every block and then calculating the mean value.). There are extreme mean values in both the house price per square meter and the house price when there are fewer transactions at relatively higher prices (see Figure 3c,d). As a whole, there is a tendency to see relatively higher property values located in the middle, close to the fault zone area.

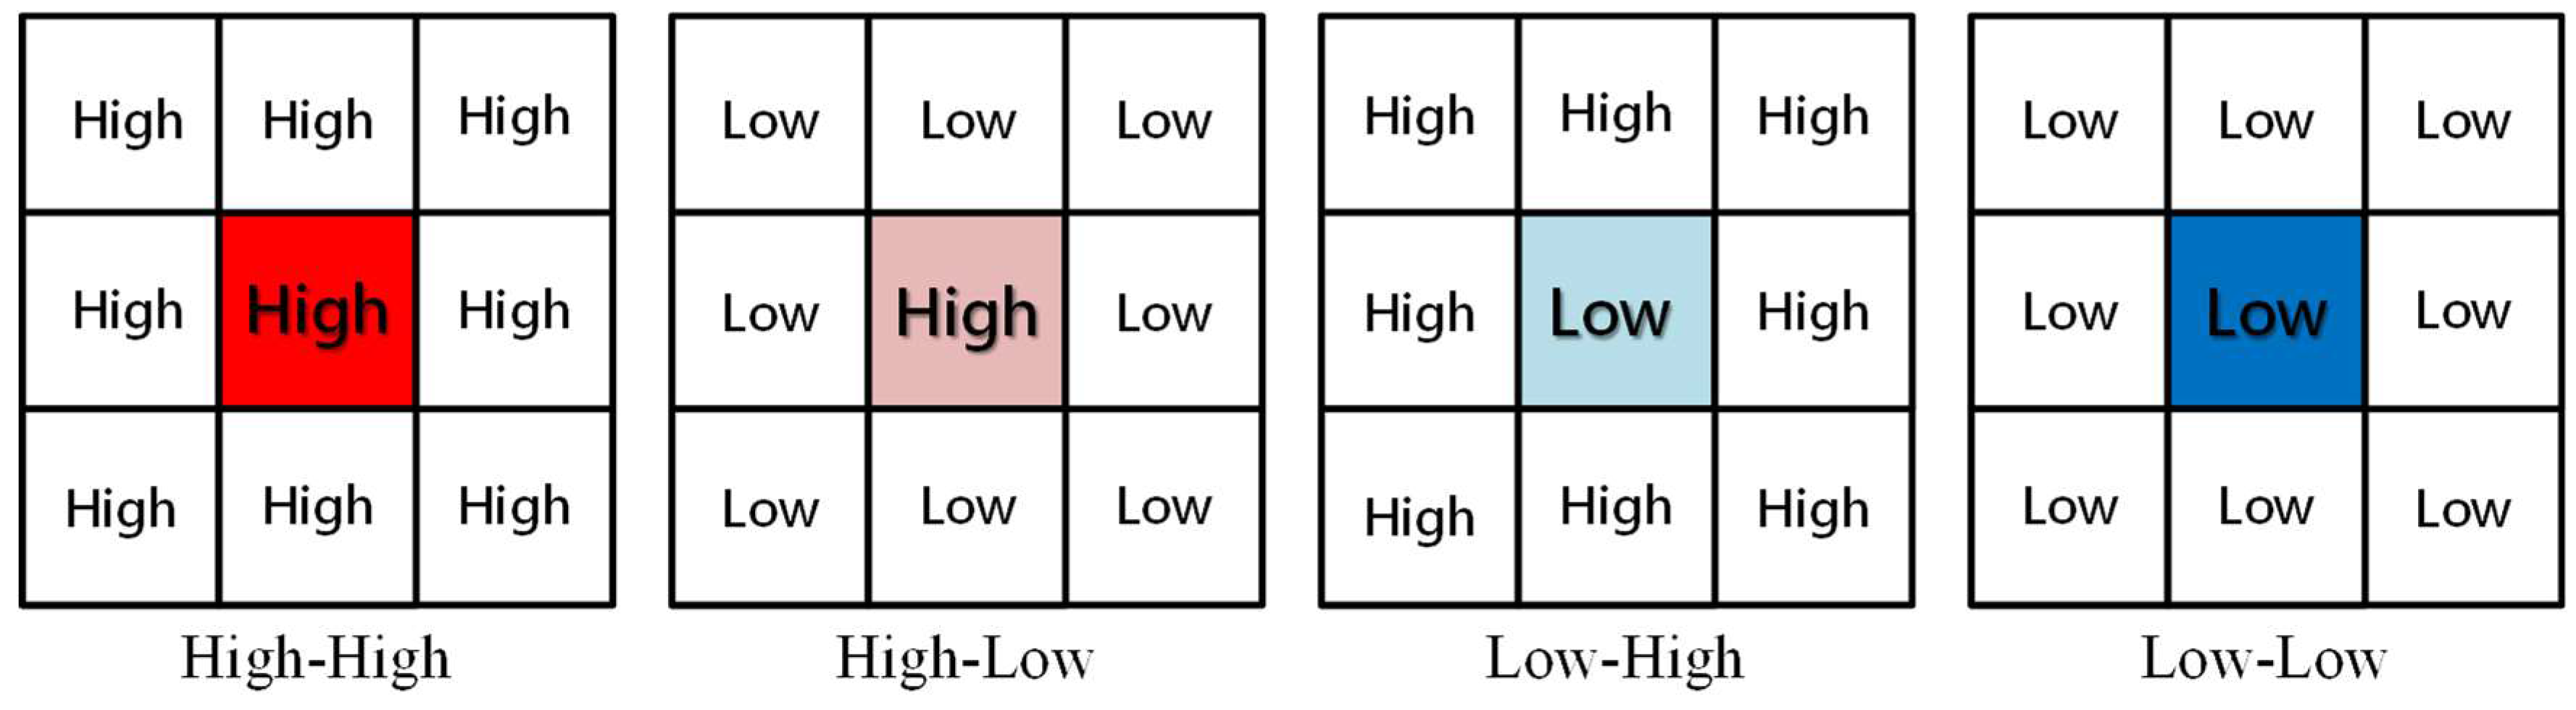
2.3. Spatial Autocorrelation Coefficient

The spatial autocorrelation coefficient is an approach that measures and tests the clustering/dispersion of spatial units (in this case, blocks) with respect to the attributes. Spatial autocorrelation is based upon the statement by Tobler (1970) [18] of the “first law of geography”: everything is related, but near objects are more closely related [19,20,21]. The spatial autocorrelation of a set of spatial units refers to the similarity between the spatial units in nearby locations, and similar features tend to be close to each other.
There are two popular indices for measuring spatial autocorrelation: Geary’s Ratio and Moran’s I Index. Geary’s Ratio and Moran’s I Index differ in whether the differences in attribute values (xi and xj) are calculated from direct comparison (xi–xj) or in reference to their mean ( x i x ¯ ) ( x j x ¯ ) [22]. Therefore, the two indices have a different numeric range, and Moran’s I index more closely resembles the conventional correlation measurement, (−1, 1) (see Table 1). Therefore, we apply Moran’s I to test for the significance of spatial patterns. If significant, positive spatial autocorrelation exists, then objects with similar characteristics will tend to be in close proximity to each other [23]. A weak or nonexistent spatial pattern indicates a lack of similarity, that is, in essence, a random pattern. The general form of the equation is as follows:
I ( d ) = n i = 1 n j n w i j × i = 1 n j = 1 n ( x i x ¯ ) ( x j x ¯ ) i = 1 n ( x i x ) 2
where I(d) is the Moran’s I value of the spatial autocorrelation of the land use change ratio and the property transaction value in a d order neighborhood; d is the spatial lag representing the first-, second-, third-, and higher-order neighborhood patterns; n is the number of spatial units; xi and xj are the land use change ratio and property transaction value in units I and j, respectively; x ¯ is the mean land use change ratio and property transaction value; and w i j is the spatial weights matrix (in the d-order neighborhood, the number of ways in which two corresponding spatial units can be connected to each other is 1, otherwise 0).
For Moran’s I index, the expected value for a random pattern and the variances are:
E ( I ) = ( 1 ) / ( n 1 )
The spatial autocorrelation coefficient is a global measurement testing spatial patterns over the entire study area, and such results might indicate that significant autocorrelation appears in a small area [24]. Local indicators of spatial association (LISA), derived by Anselin (1995) [25], resemble passing a moving window across the data and examining dependence within the chosen region for the site on which the window is centered. LISA is defined as follows:
I i = x i x ¯ 1 n i = 1 n ( x i x ¯ ) 2 j = 1 n W i j ( x i x j ) ,   i j ,   for   j   within   d   of   i
where x ¯ is the mean deviation. The expected value is as follows:
E ( I i ) = 1 n 1 j = 1 n W i j
When analyzing a spatial unit distribution, we may assume that the distribution of the attribute value is only one of many possible outcomes with the given value. Therefore, it is necessary to test the significance of the spatial autocorrelation measurement, the Z-scores. The same critical values of −1.96 < Z < 1.96 can be applied with a statistical significance level of 5%. The standardized Z-scores equation is as follows:
Z = I E ( I ) V A R ( I )
The LISA statistics are useful for identifying spatial clusters, including high–high clusters (HH), low–low clusters (LL), high–low outliers (HL), and low–high outliers (LH). HH clusters indicate high values surrounded by high values; LL clusters indicate low values surrounded by low values; HL outliers indicate high values surrounded by low values; LH outliers indicate low values surrounded by high values (see Figure 4).

3. Results

The following sections explain the process of incorporating the land use change ratio and property transaction value into the spatial analyses using Moran’s I and LISA statistics.

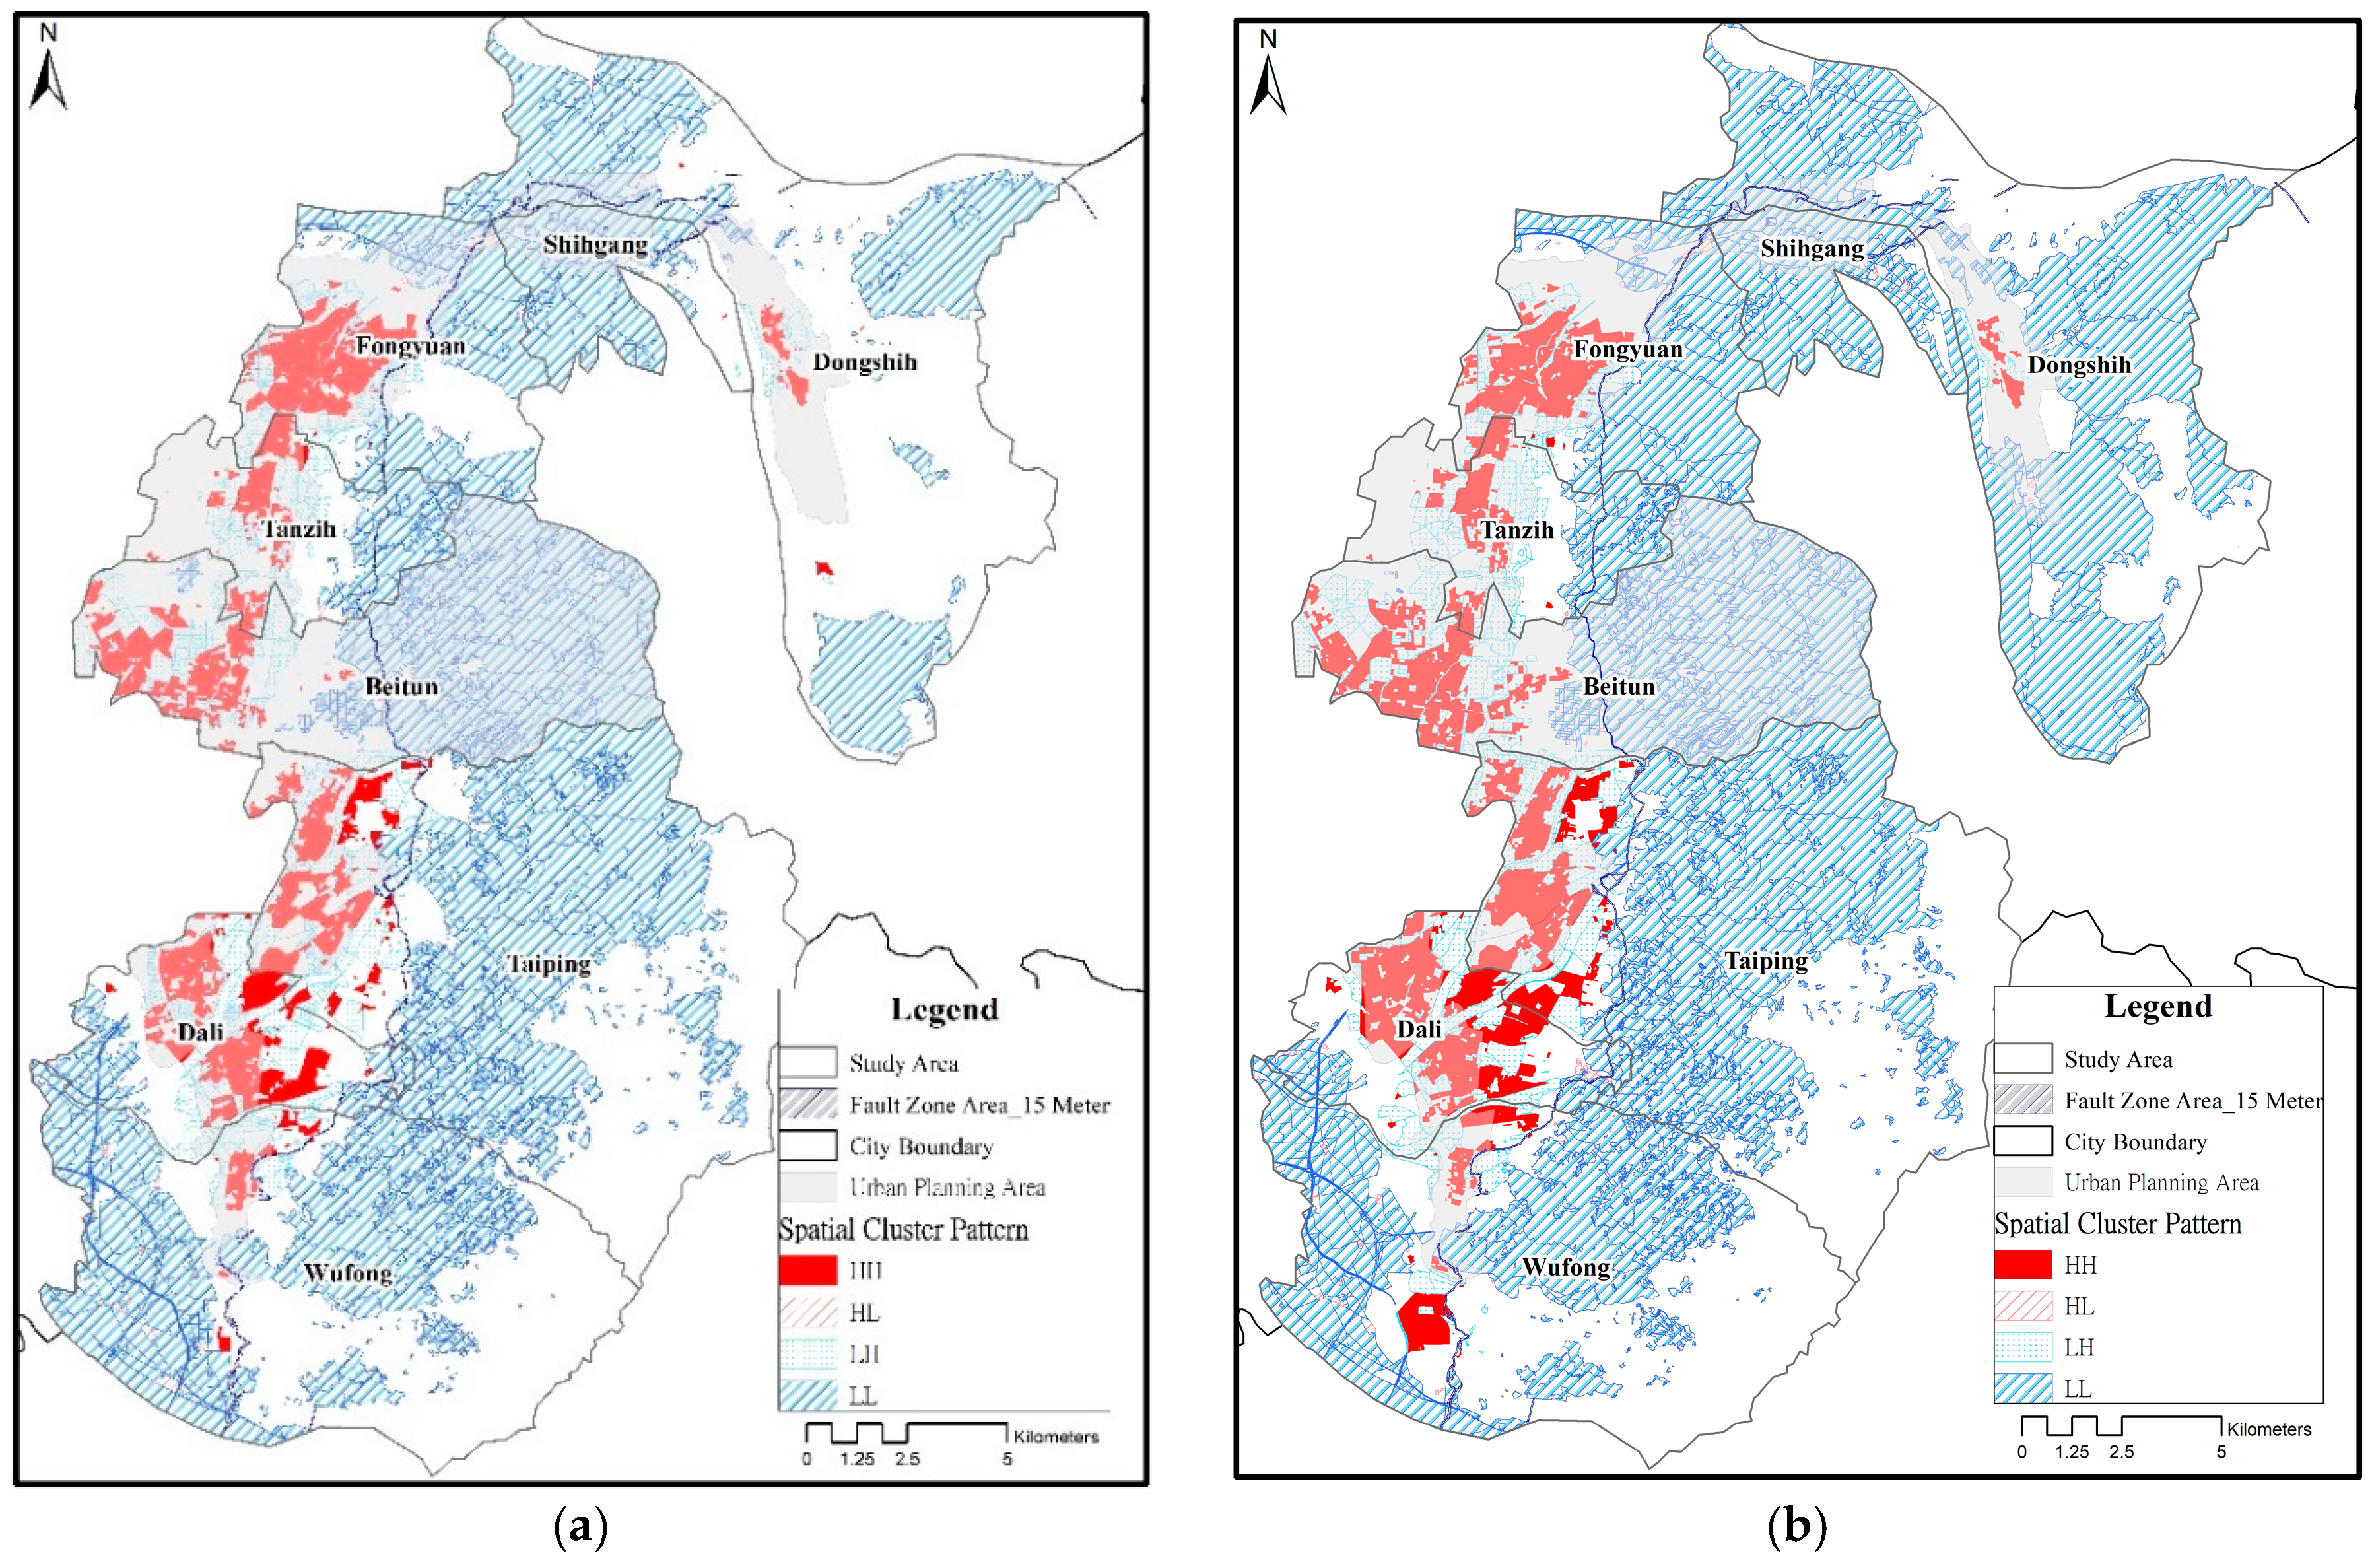
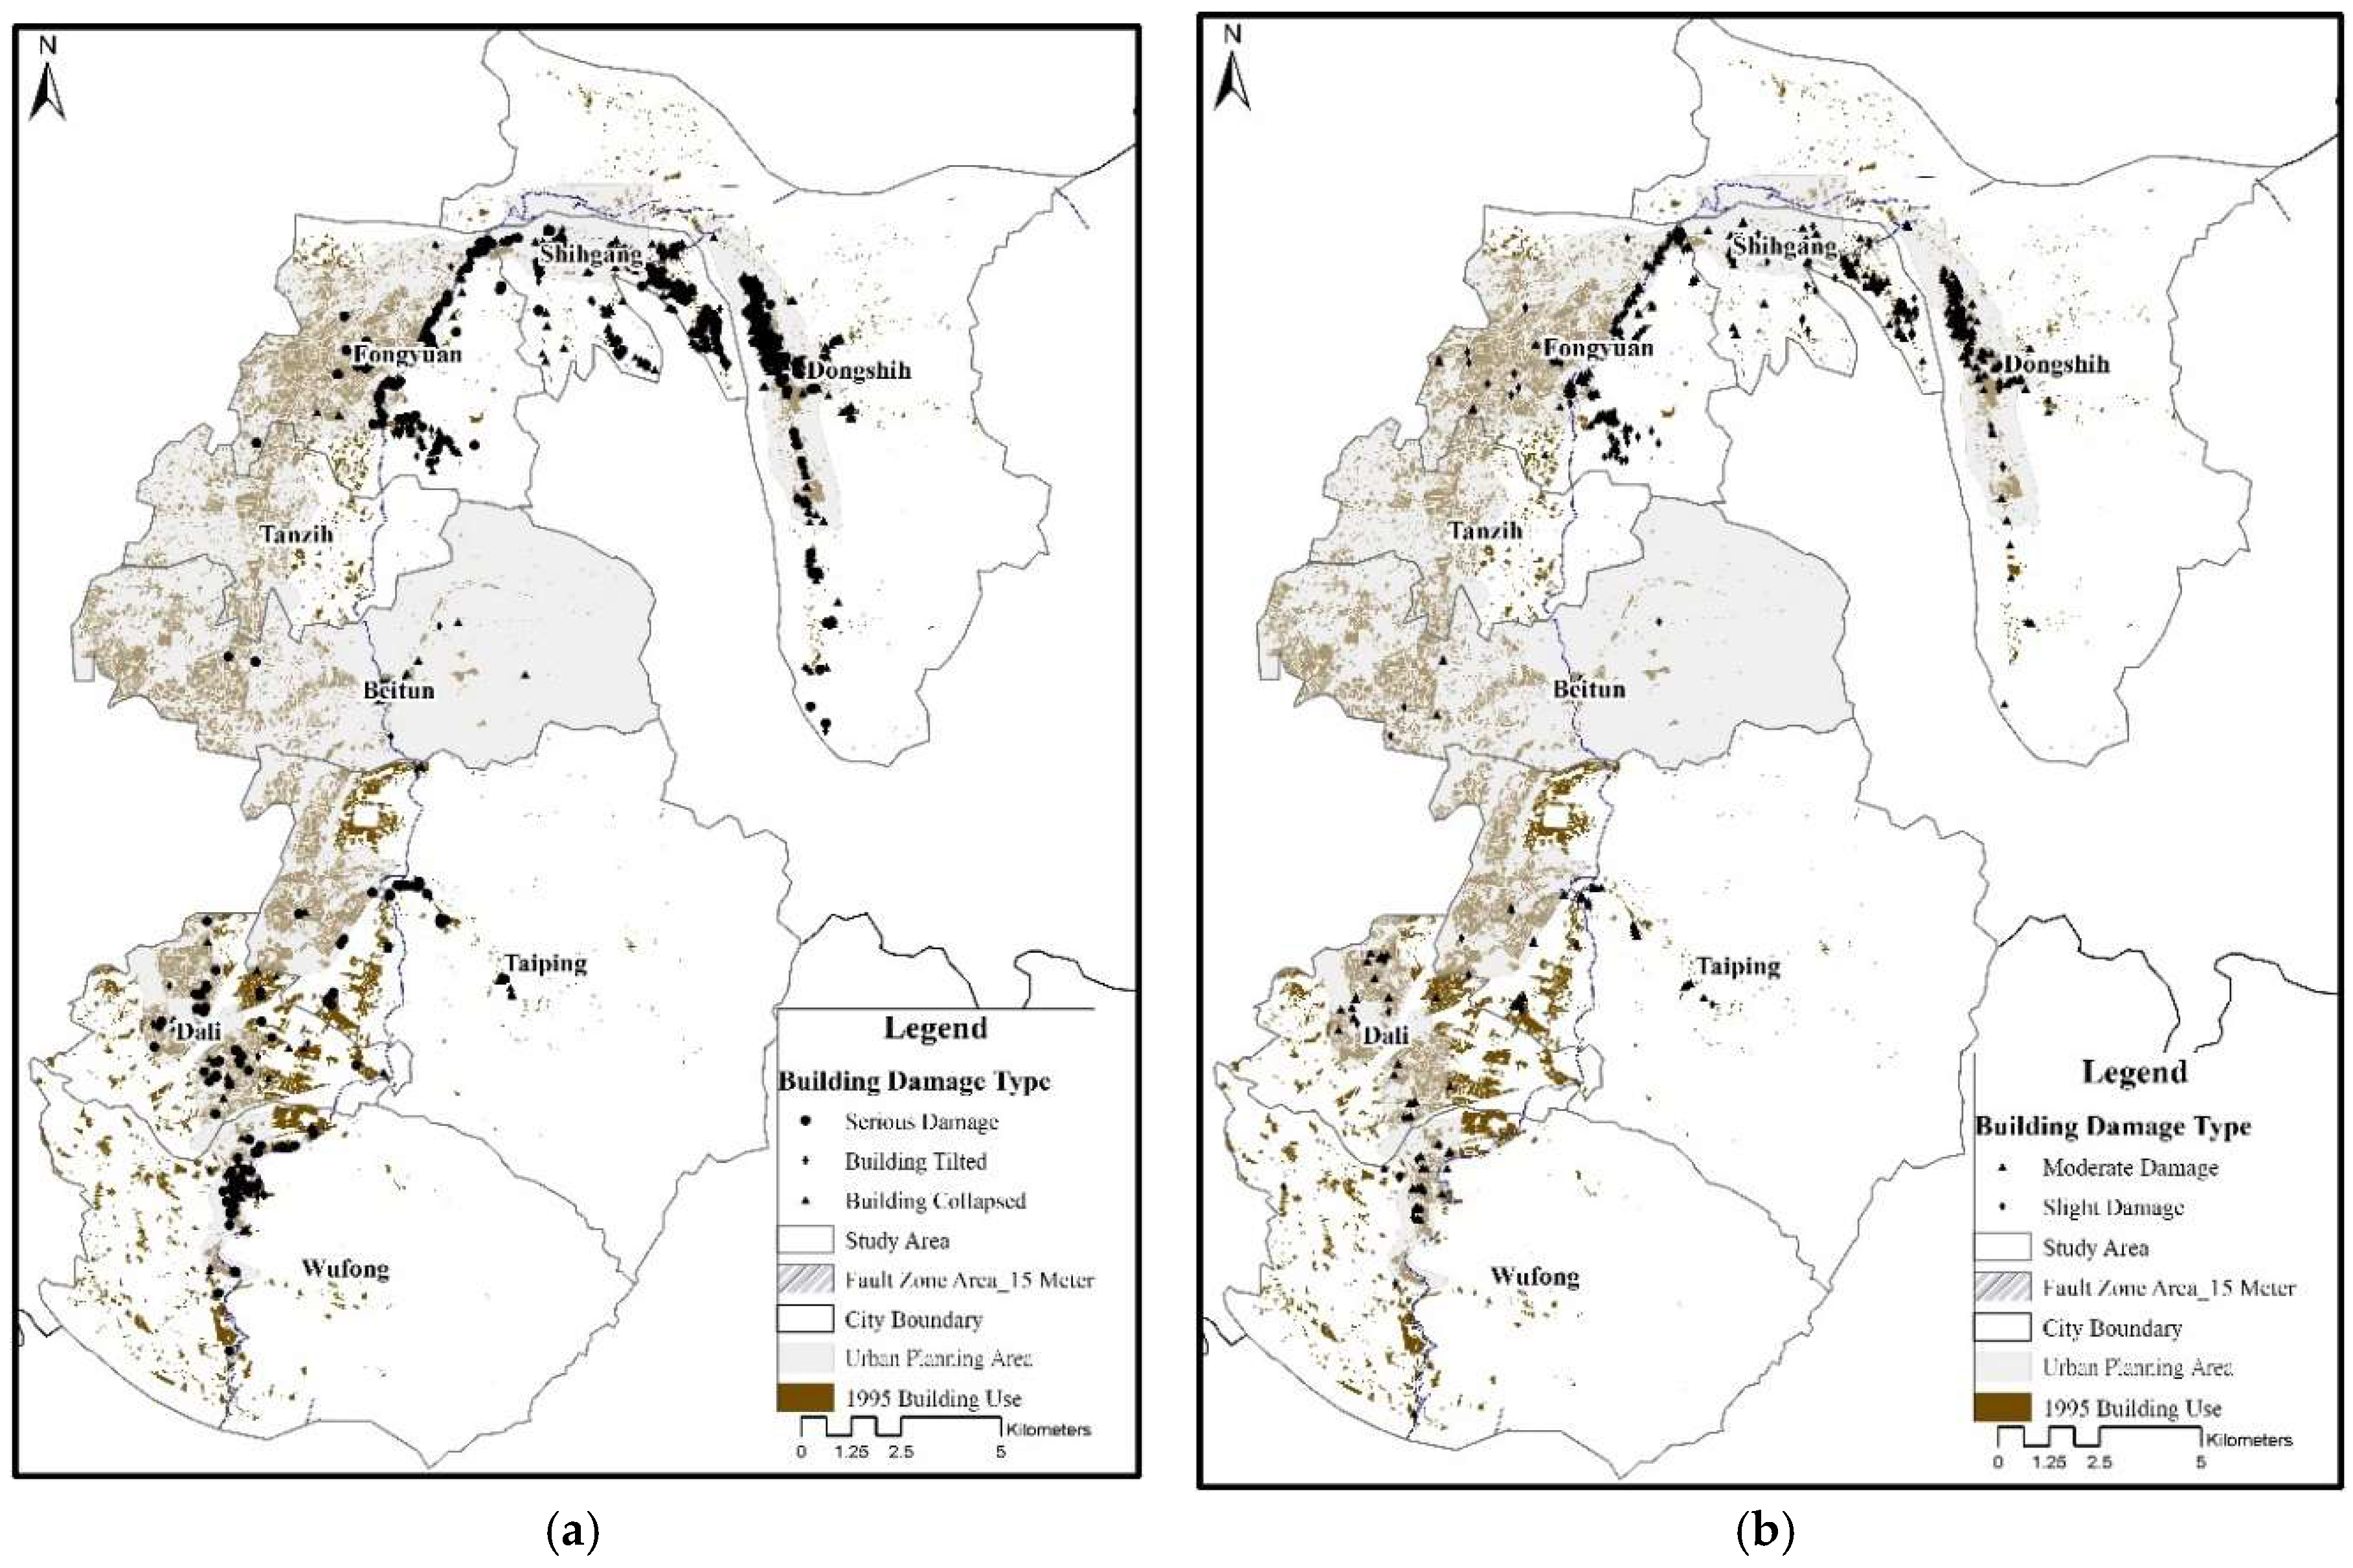
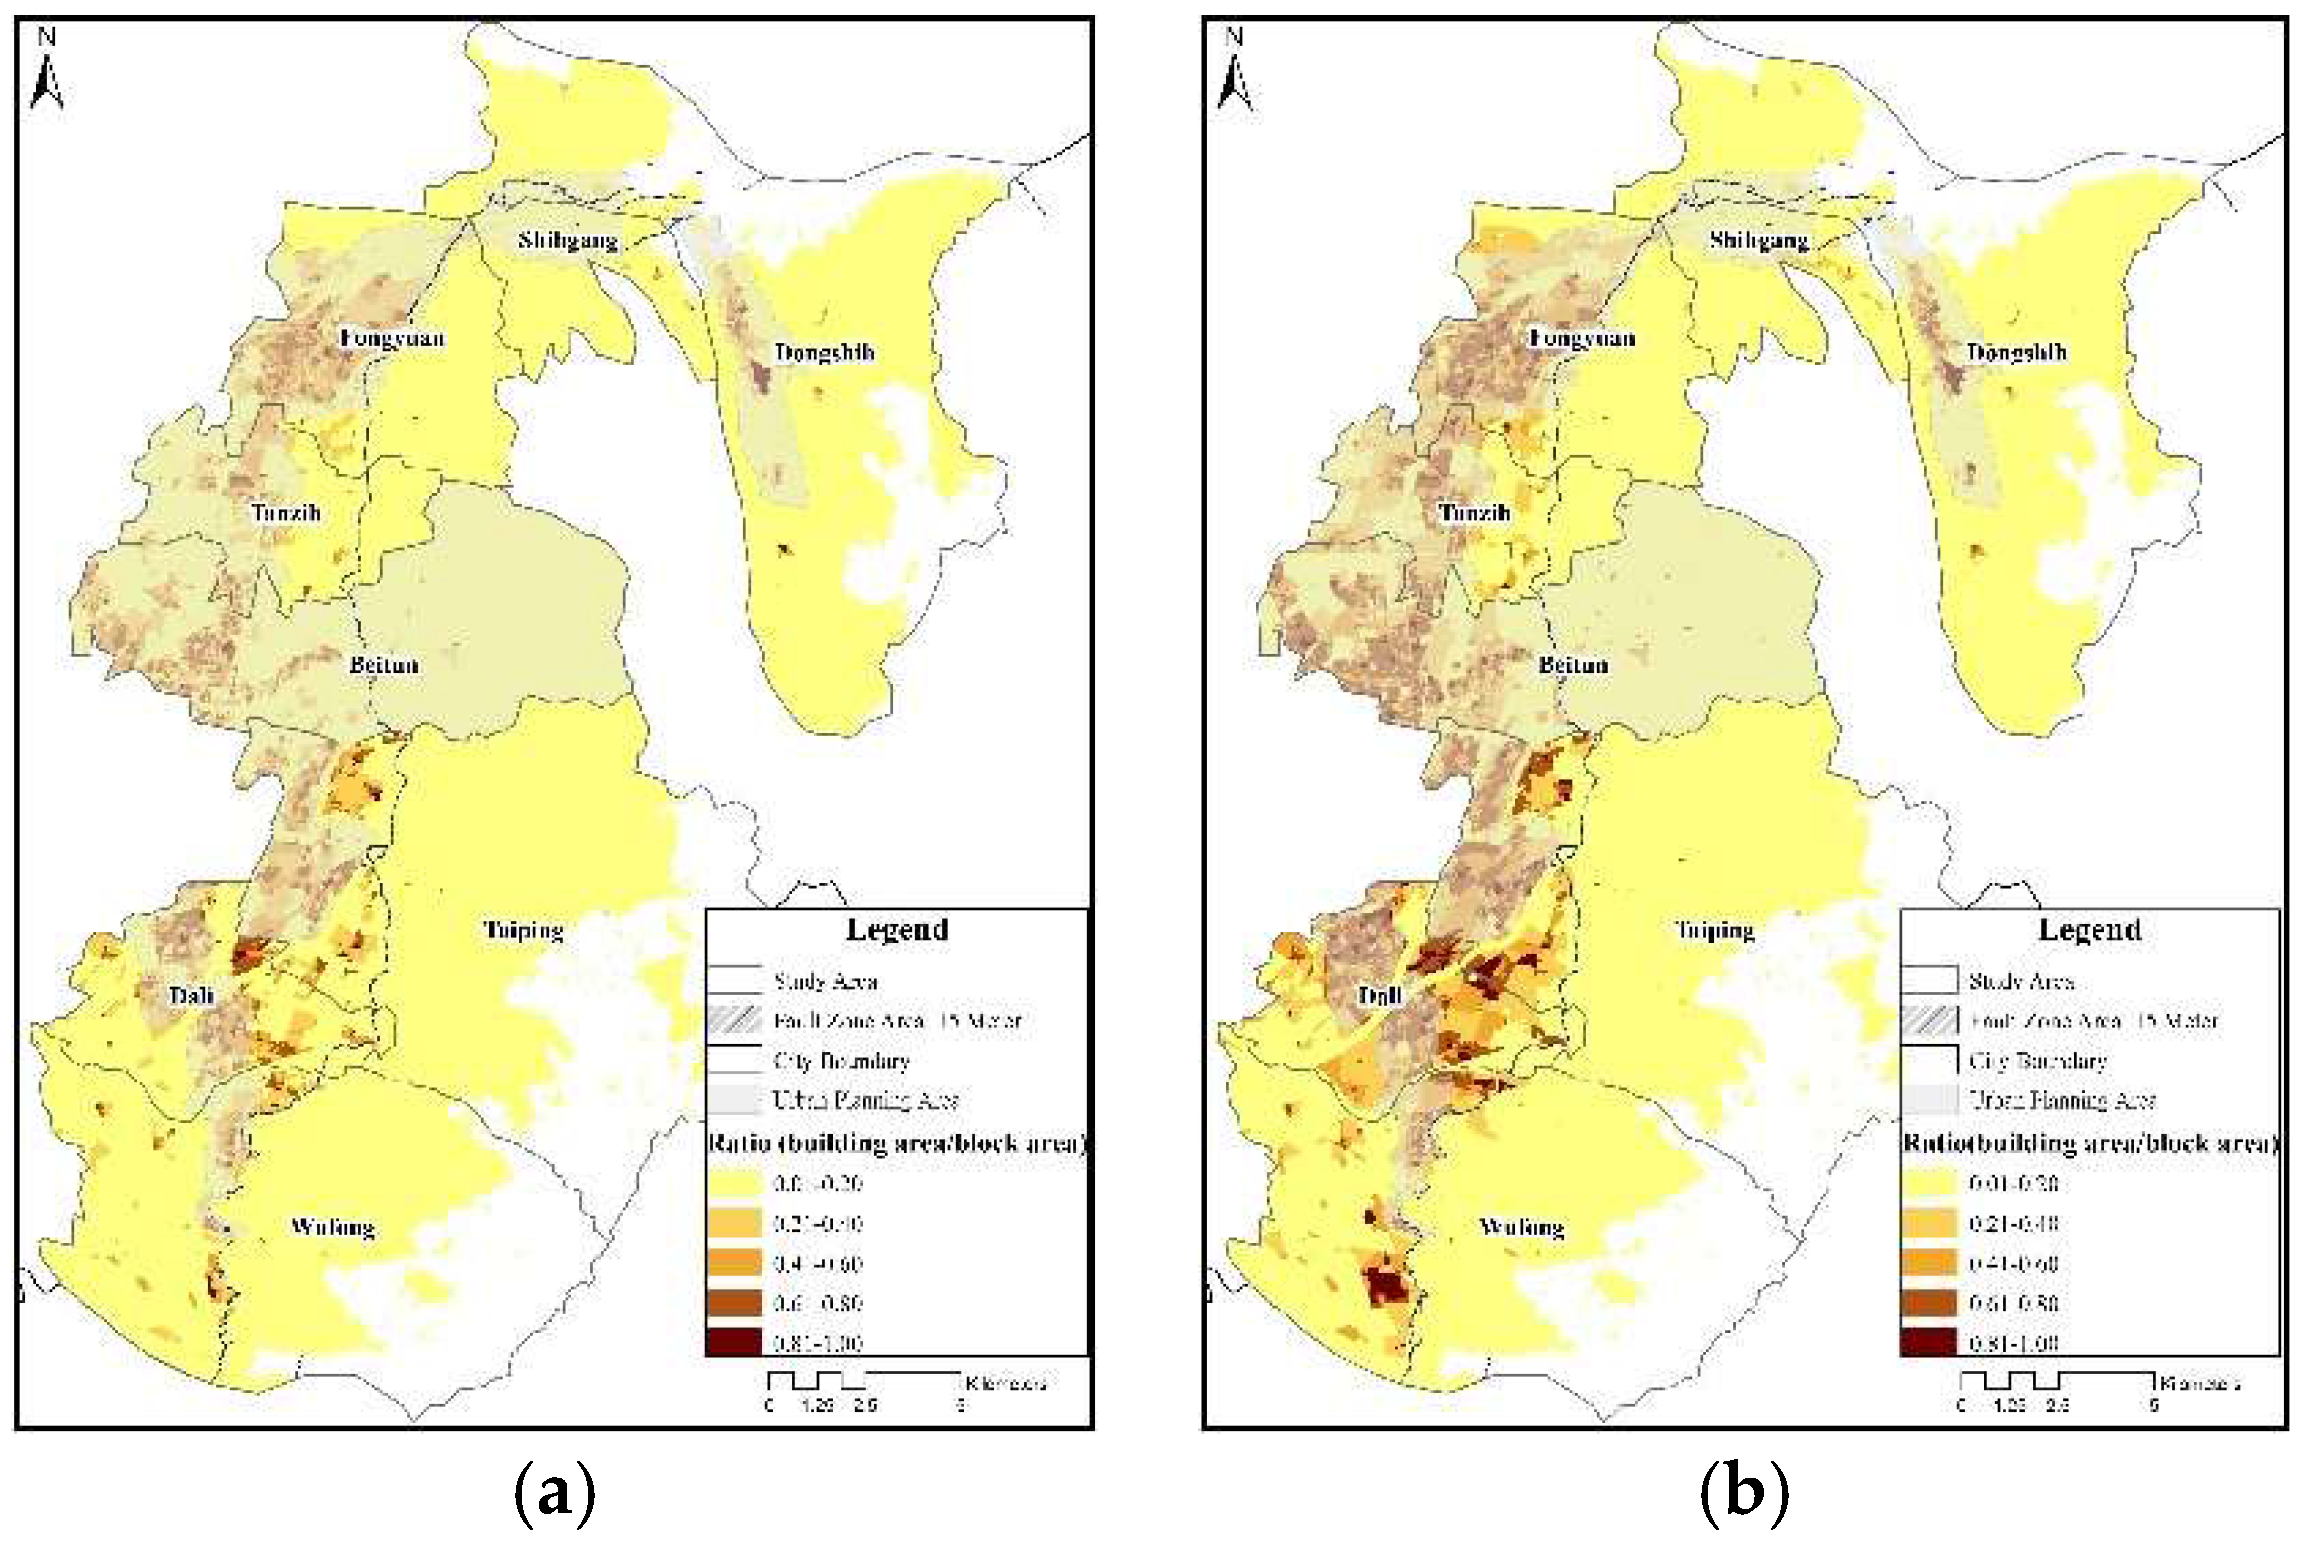
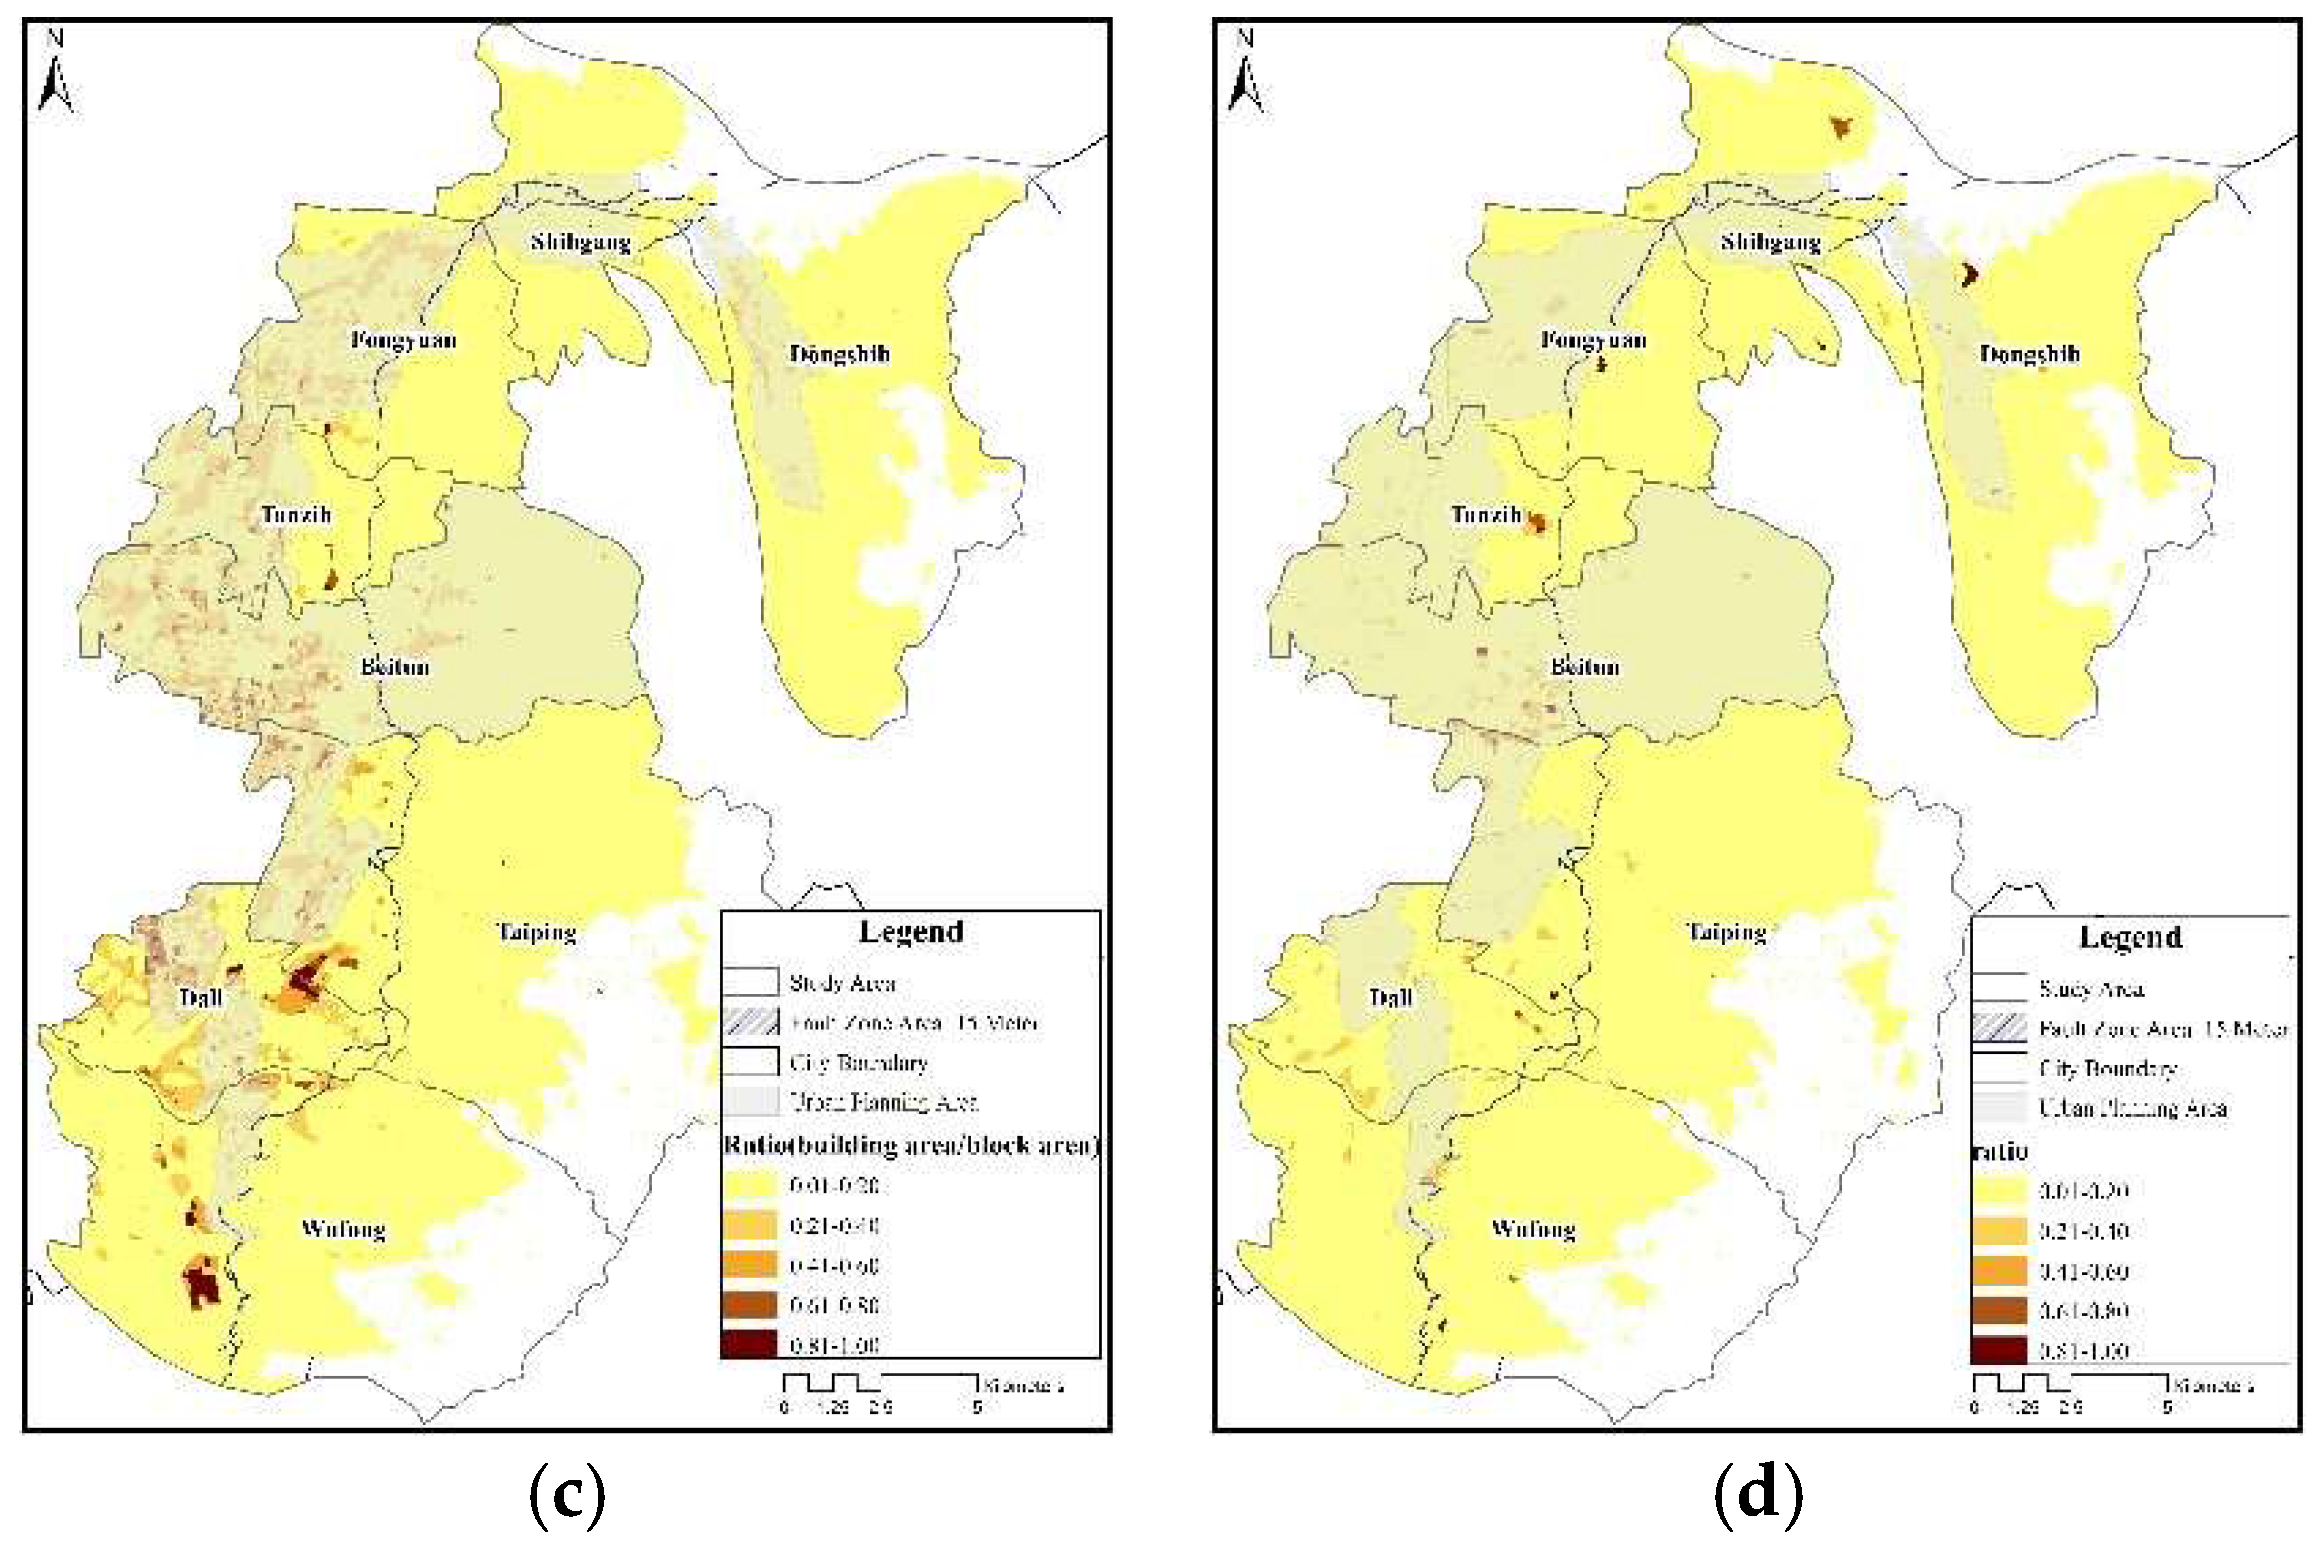
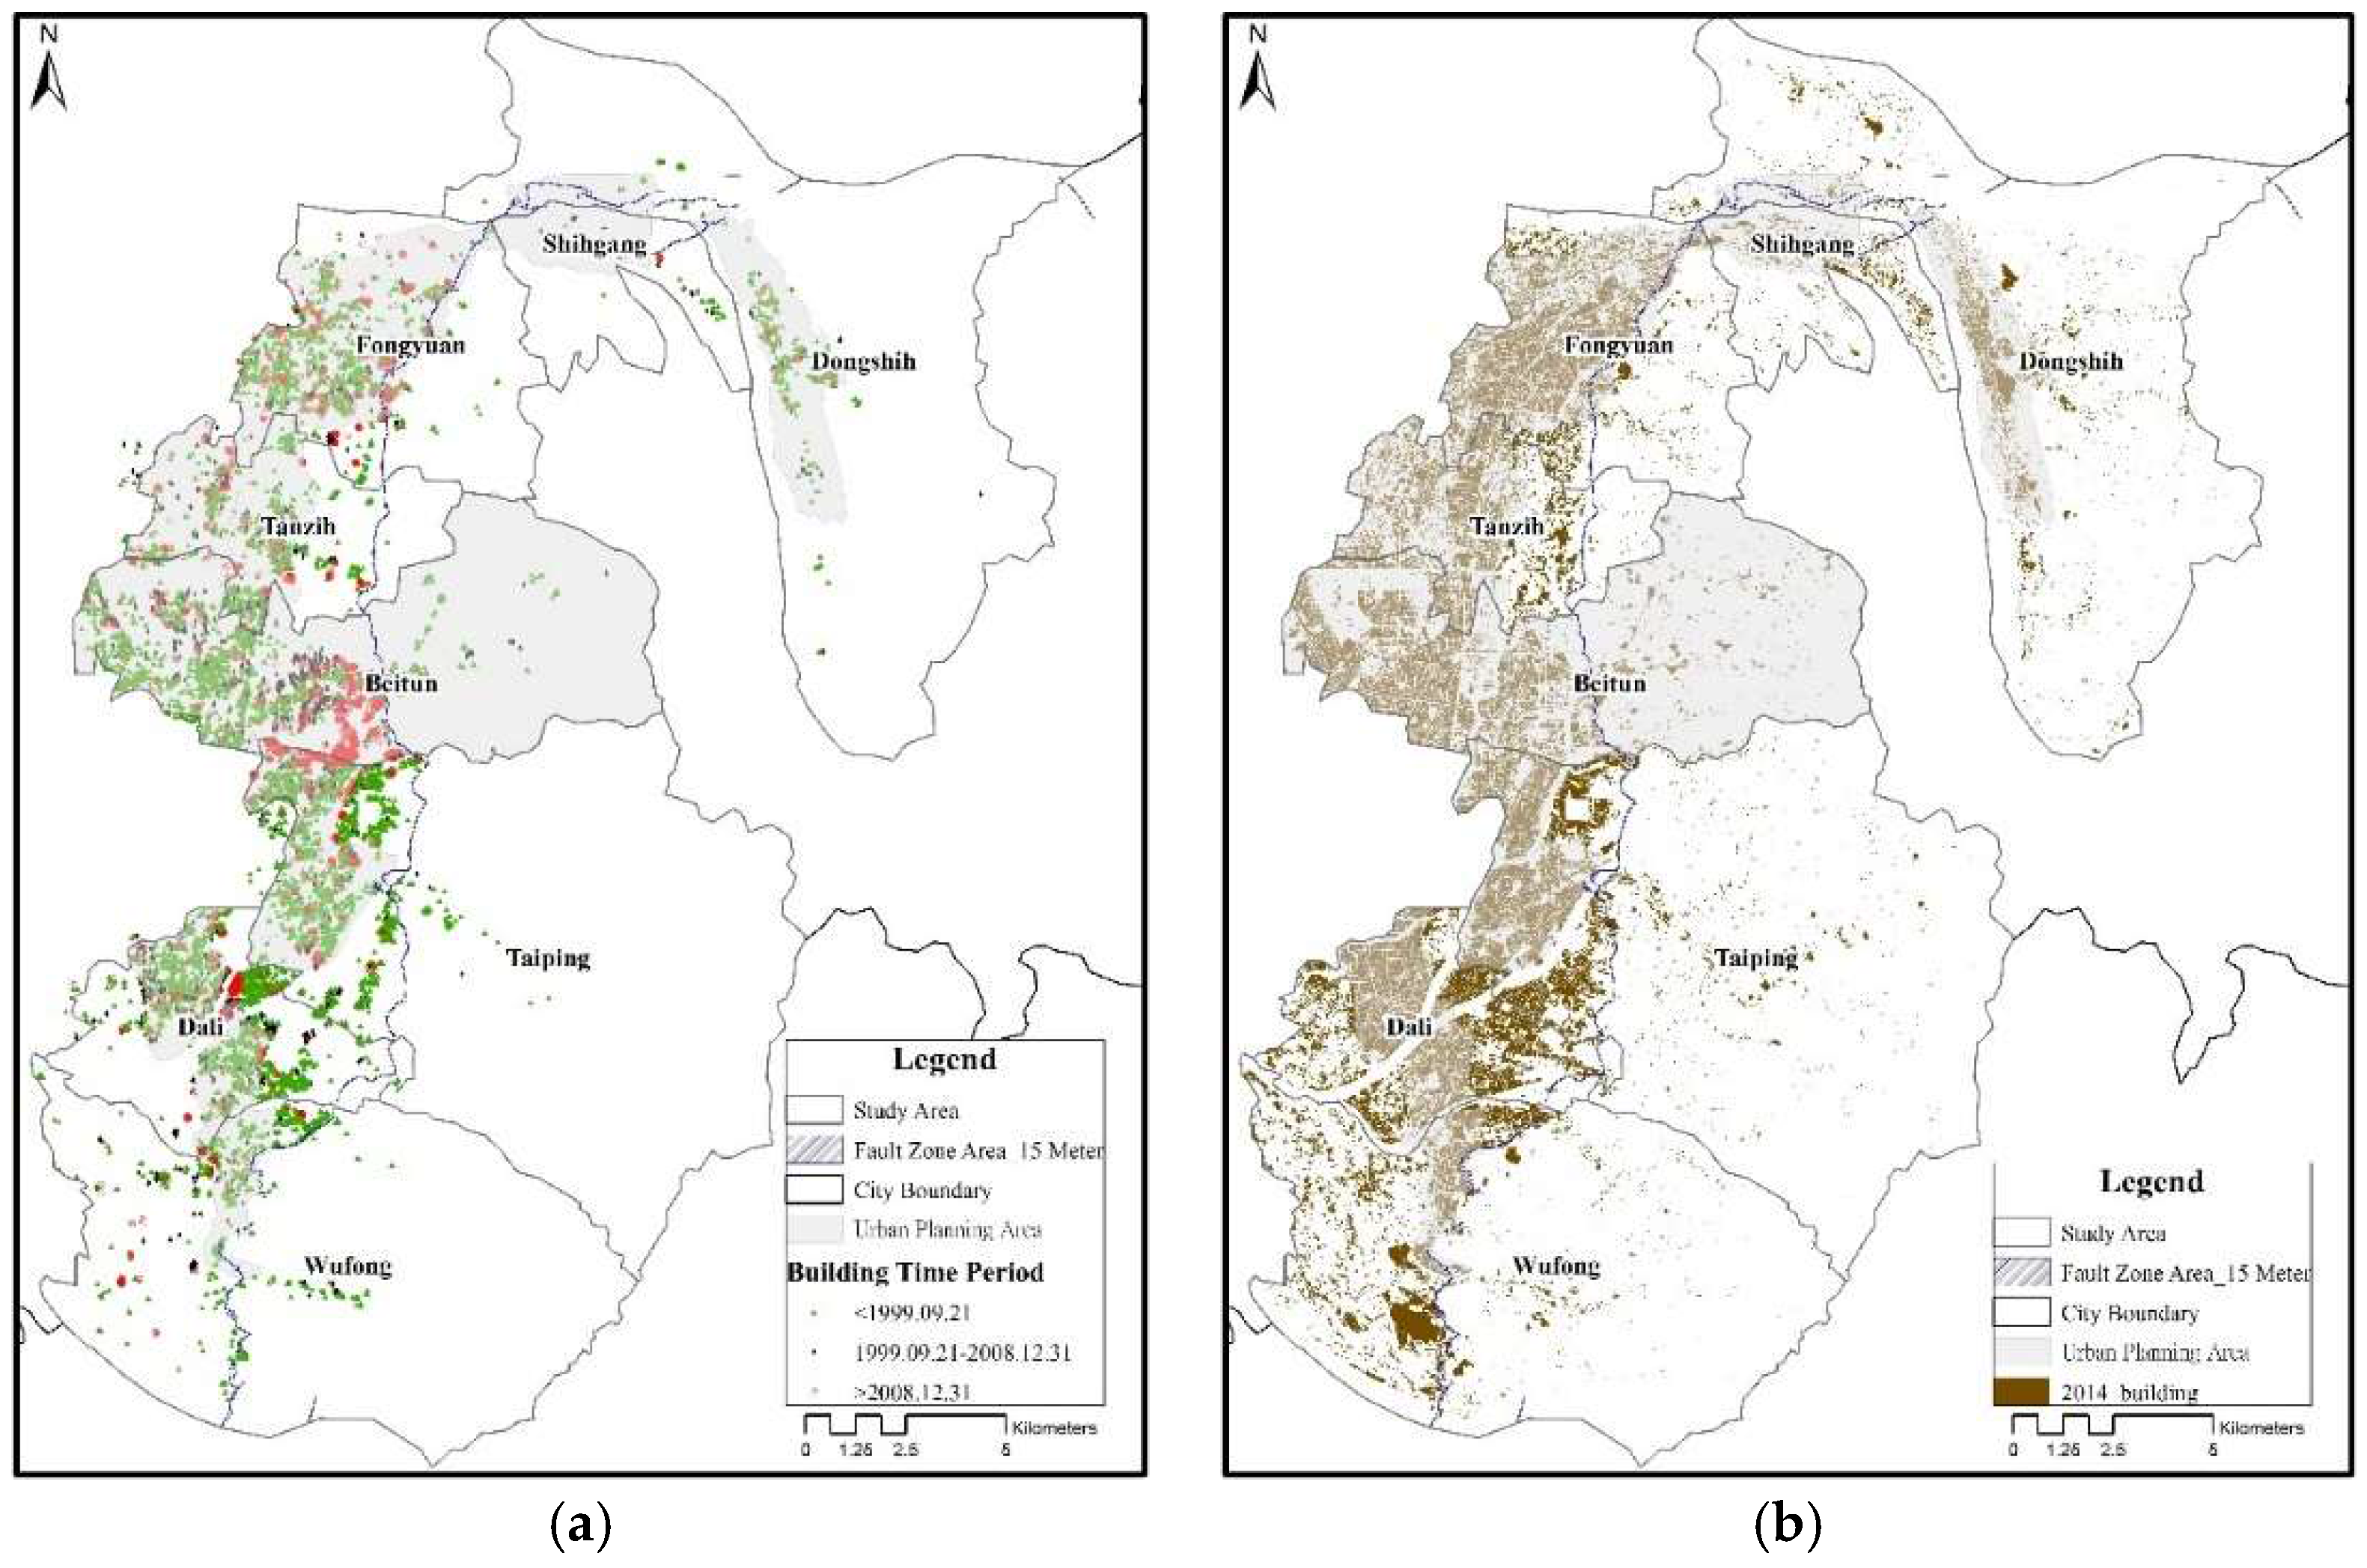
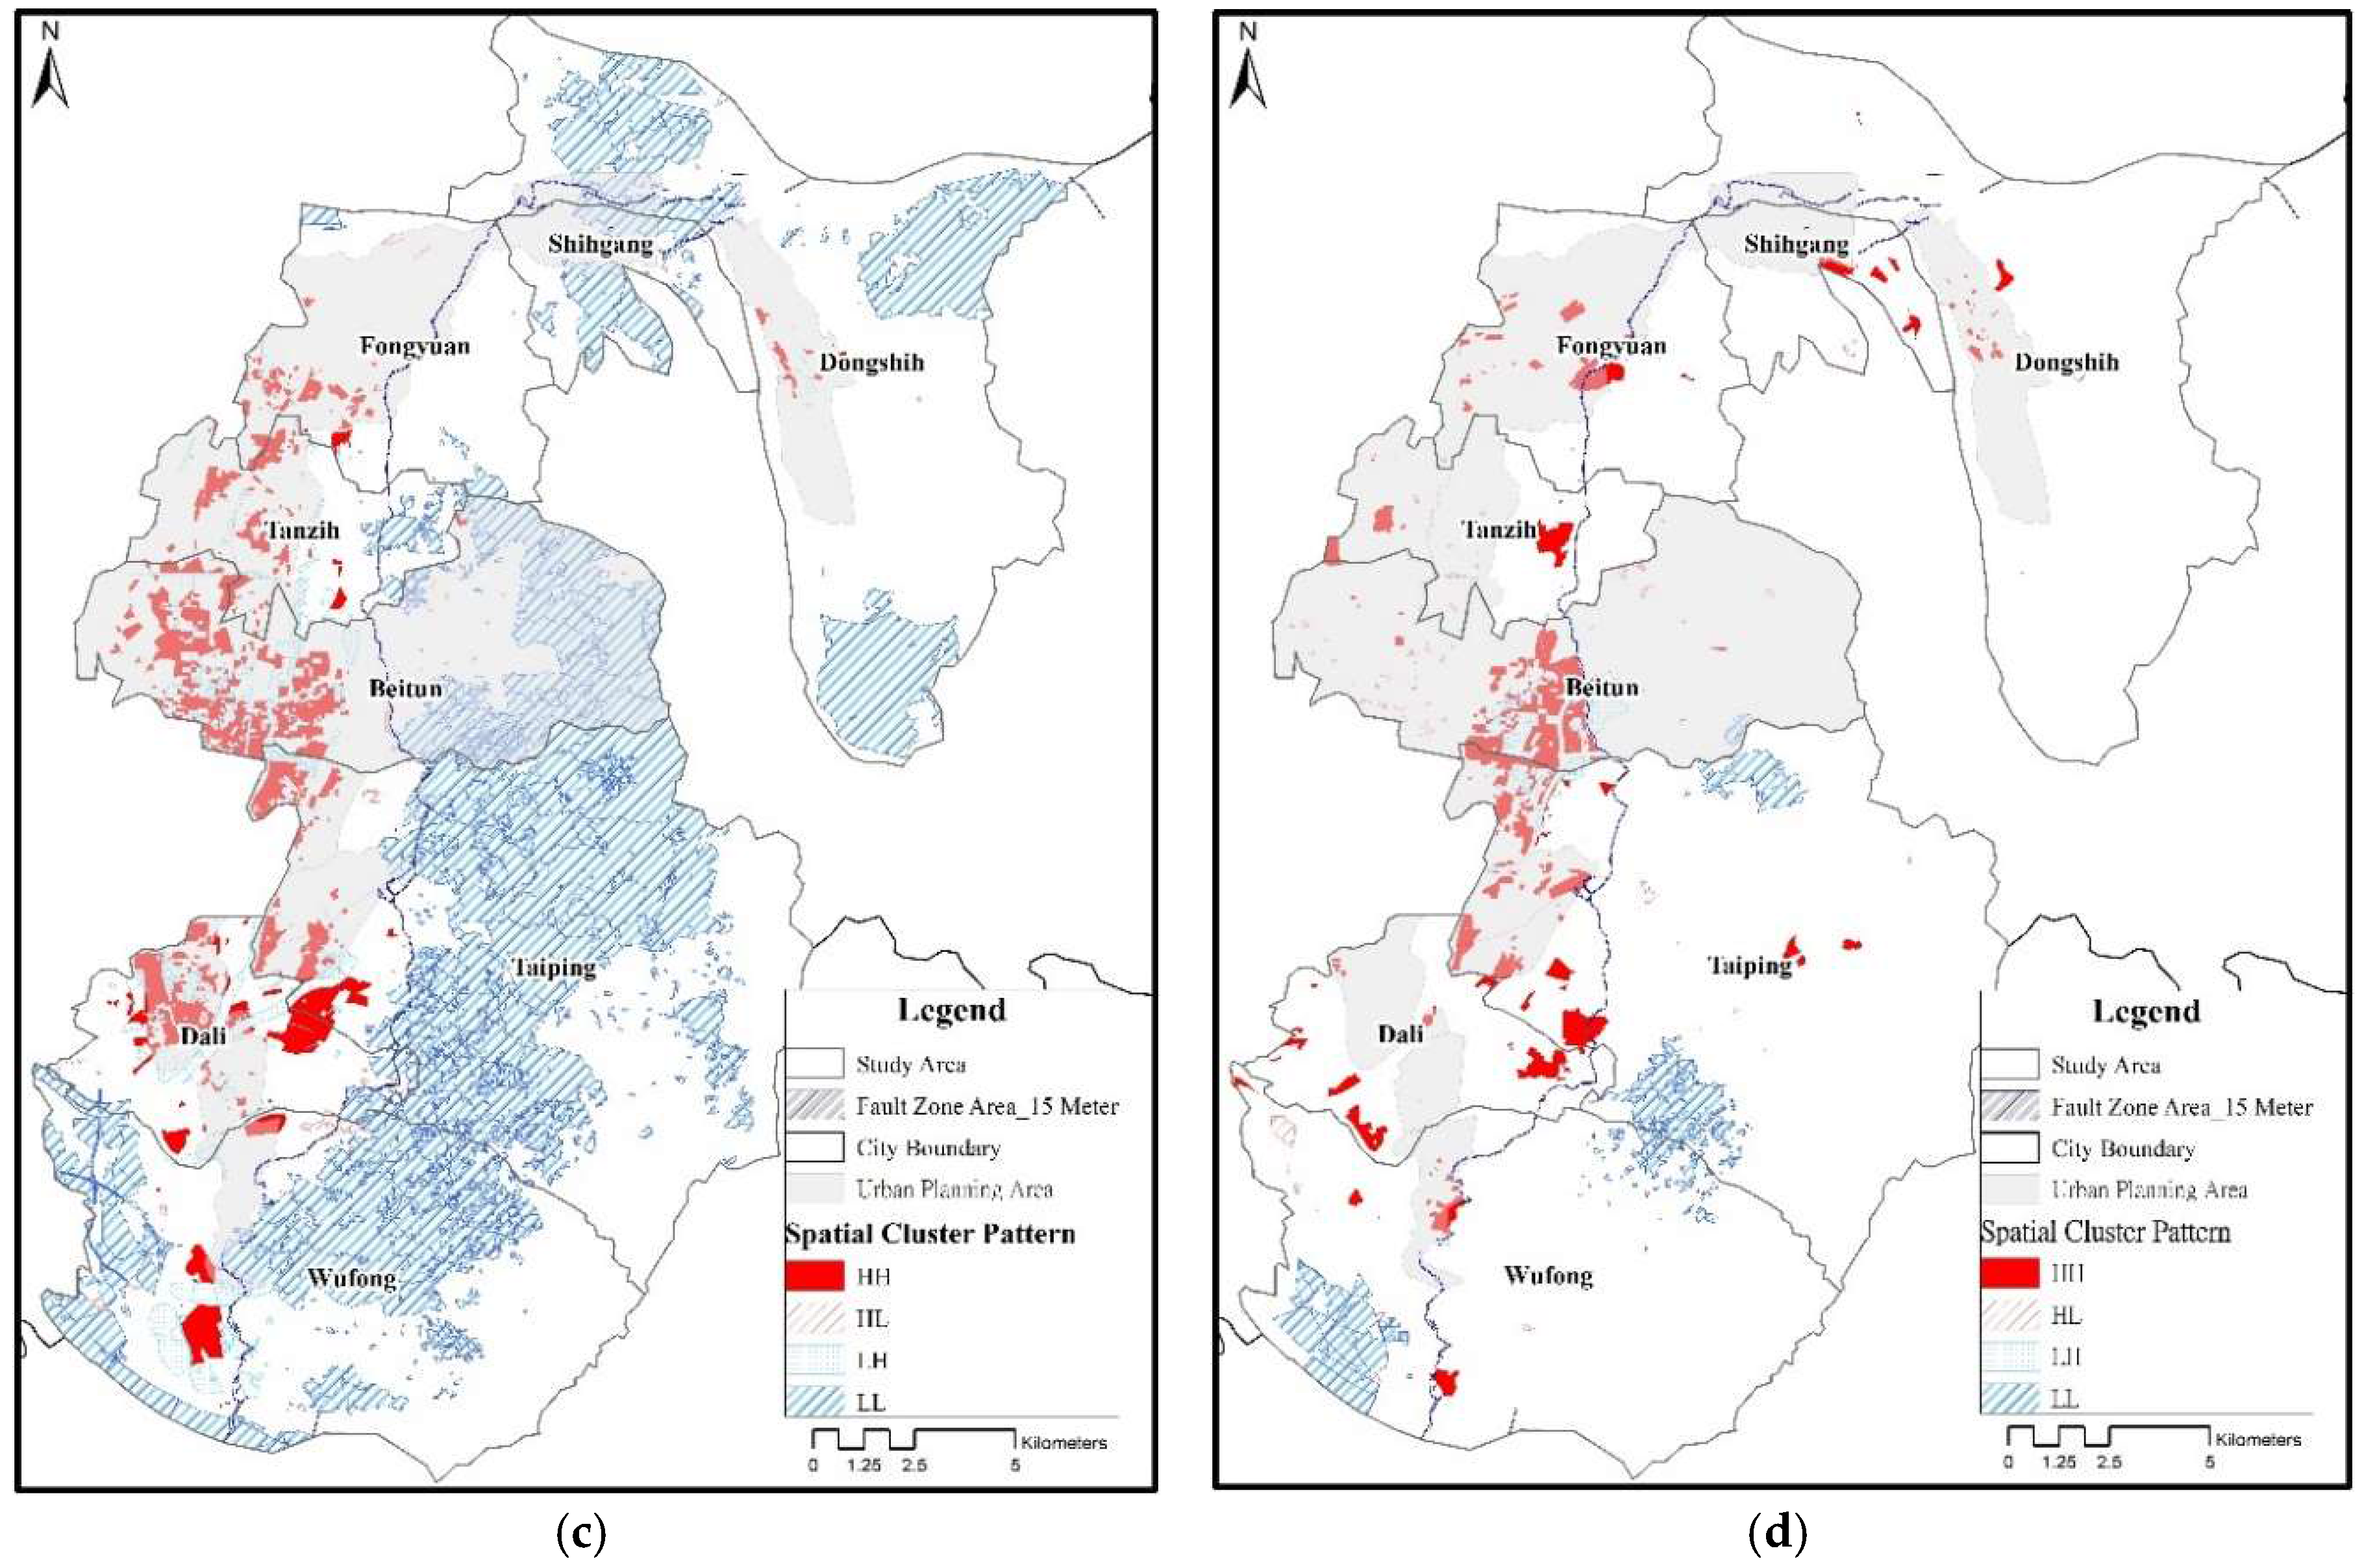
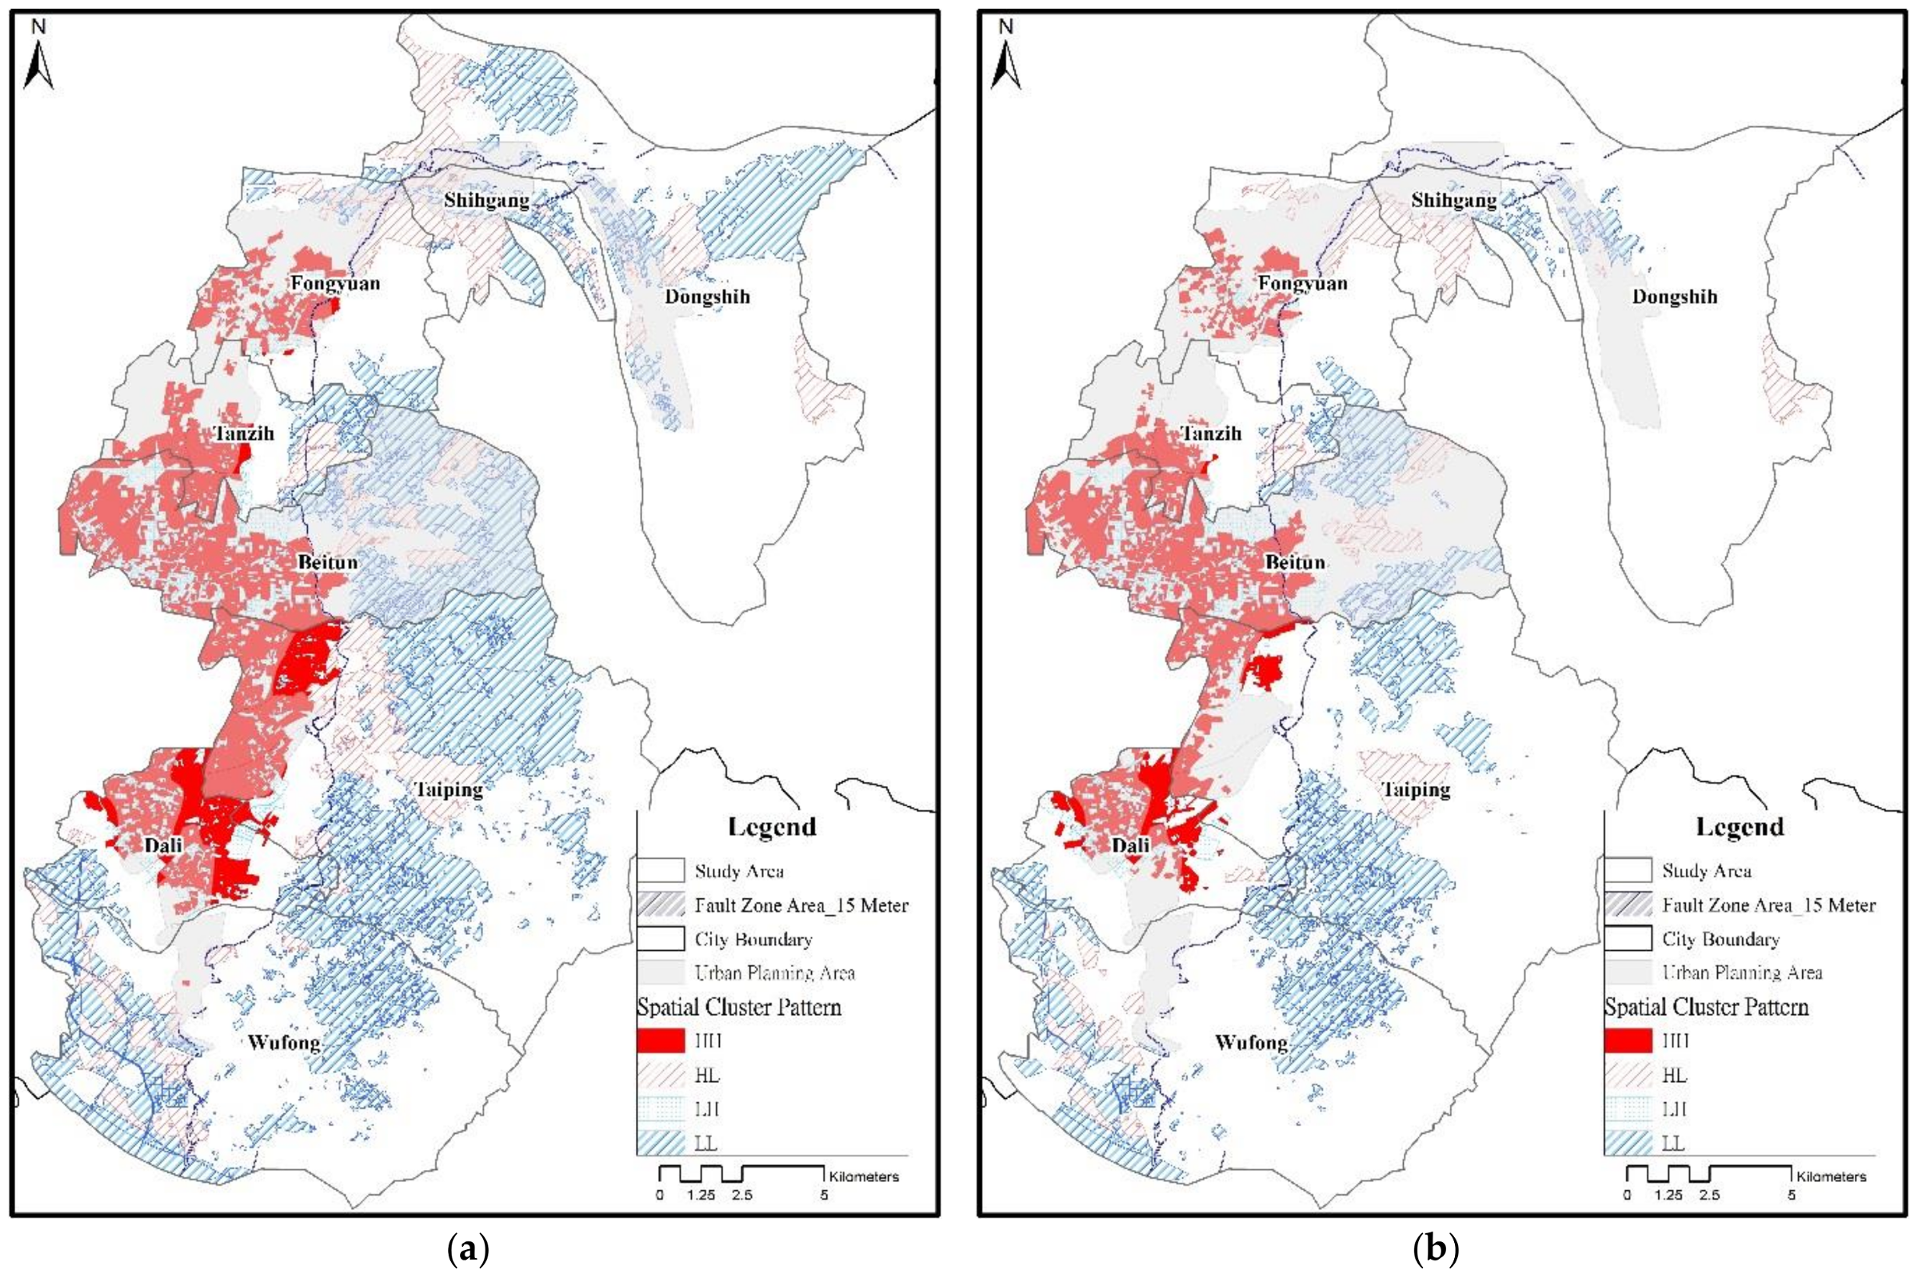
3.1. Spatial Characteristics of Land Use Change

The global measurement Moran’s I index is applied to explore the influence of the spatial qualities of being clustered/random/dispersed on land use change. The results show that various time periods of land use change, clustered for the Moran’s I index value, are higher than E(I) and with a Z-score greater than 1.96 (see Table 2). Among them, “continue building use” is significantly more clustered than the other two categories. To detect the spatial cluster pattern, this paper then applies LISA.

3.1.1. Land Use Change from 1995 to 2008

Within the “continue building use” category, there are 3059 hectares (ha) of HH areas, located west of the fault zone area. HL areas encompass 103 ha and are located away from the HH areas. LL areas span 22,158 ha and are located in the eastern and southern parts of the fault zone area (see Figure 5a). Most of the HH areas are distributed in Dali, Taiping, Gongyuan, Beitun, and Fongyuan; the latter has the greatest amount of HH areas. Most of the LL areas are distributed in the eastern portion, and Shihgang has a relatively high amount of LL areas, as the land use demand is relatively low.
Within the “become building use” category, HH areas span 3059 ha and are located west of the fault zone area. HL areas span 119 ha and are dispersed throughout the study area. LH areas encompass 1362 ha and are located away from the HH areas. LL areas consist of 15,686 ha and are located in the northern and eastern portions (see Figure 5c). Most of the HH areas are distributed in Beitun, Dali, Tanzih, Wufong, and Fongyuan, and both Dali and Beitun have the greatest number of HH areas. However, most of the LL areas are distributed in Taiping, Wufong, Dongshih, and Shihgang.

3.1.2. Land Use Change from 2008 to 2014

Among the parcels designated “continue building use”, HH areas encompass 3966 ha. Although HH areas are distributed west of the fault zone area, the building use is relatively eastward, close to the fault. HL areas comprise 119 ha and are located along the fault zone area. LH areas span 3486 ha and are located away from the HH areas. LL areas encompass 26,004 ha and are located in the eastern and southern portions (see Figure 5b). Most of the HH areas are distributed in Dali, Taiping, and Fongyuan, whereas most of the LL areas are distributed in Dongshih, Taiping, and Wufong.
For parcels designated “become building use”, HH areas comprise 1419 ha. Most of the HH areas are located west of the fault zone area, but some of the HH areas are significantly located on or near the fault zone area. HL areas span 128 ha and are scattered throughout the study area. LH areas encompass 353 ha and are located away from the HH areas in Beitun. LL areas span 1299 ha and are clustered in both the southern and northern portions of Taiping and the southern portion of Wufong (see Figure 5d). Most of the HH areas are distributed in Taiping, Beitun, Dali, and Fongyuan, and the LL areas are located in Wufong and Taiping.

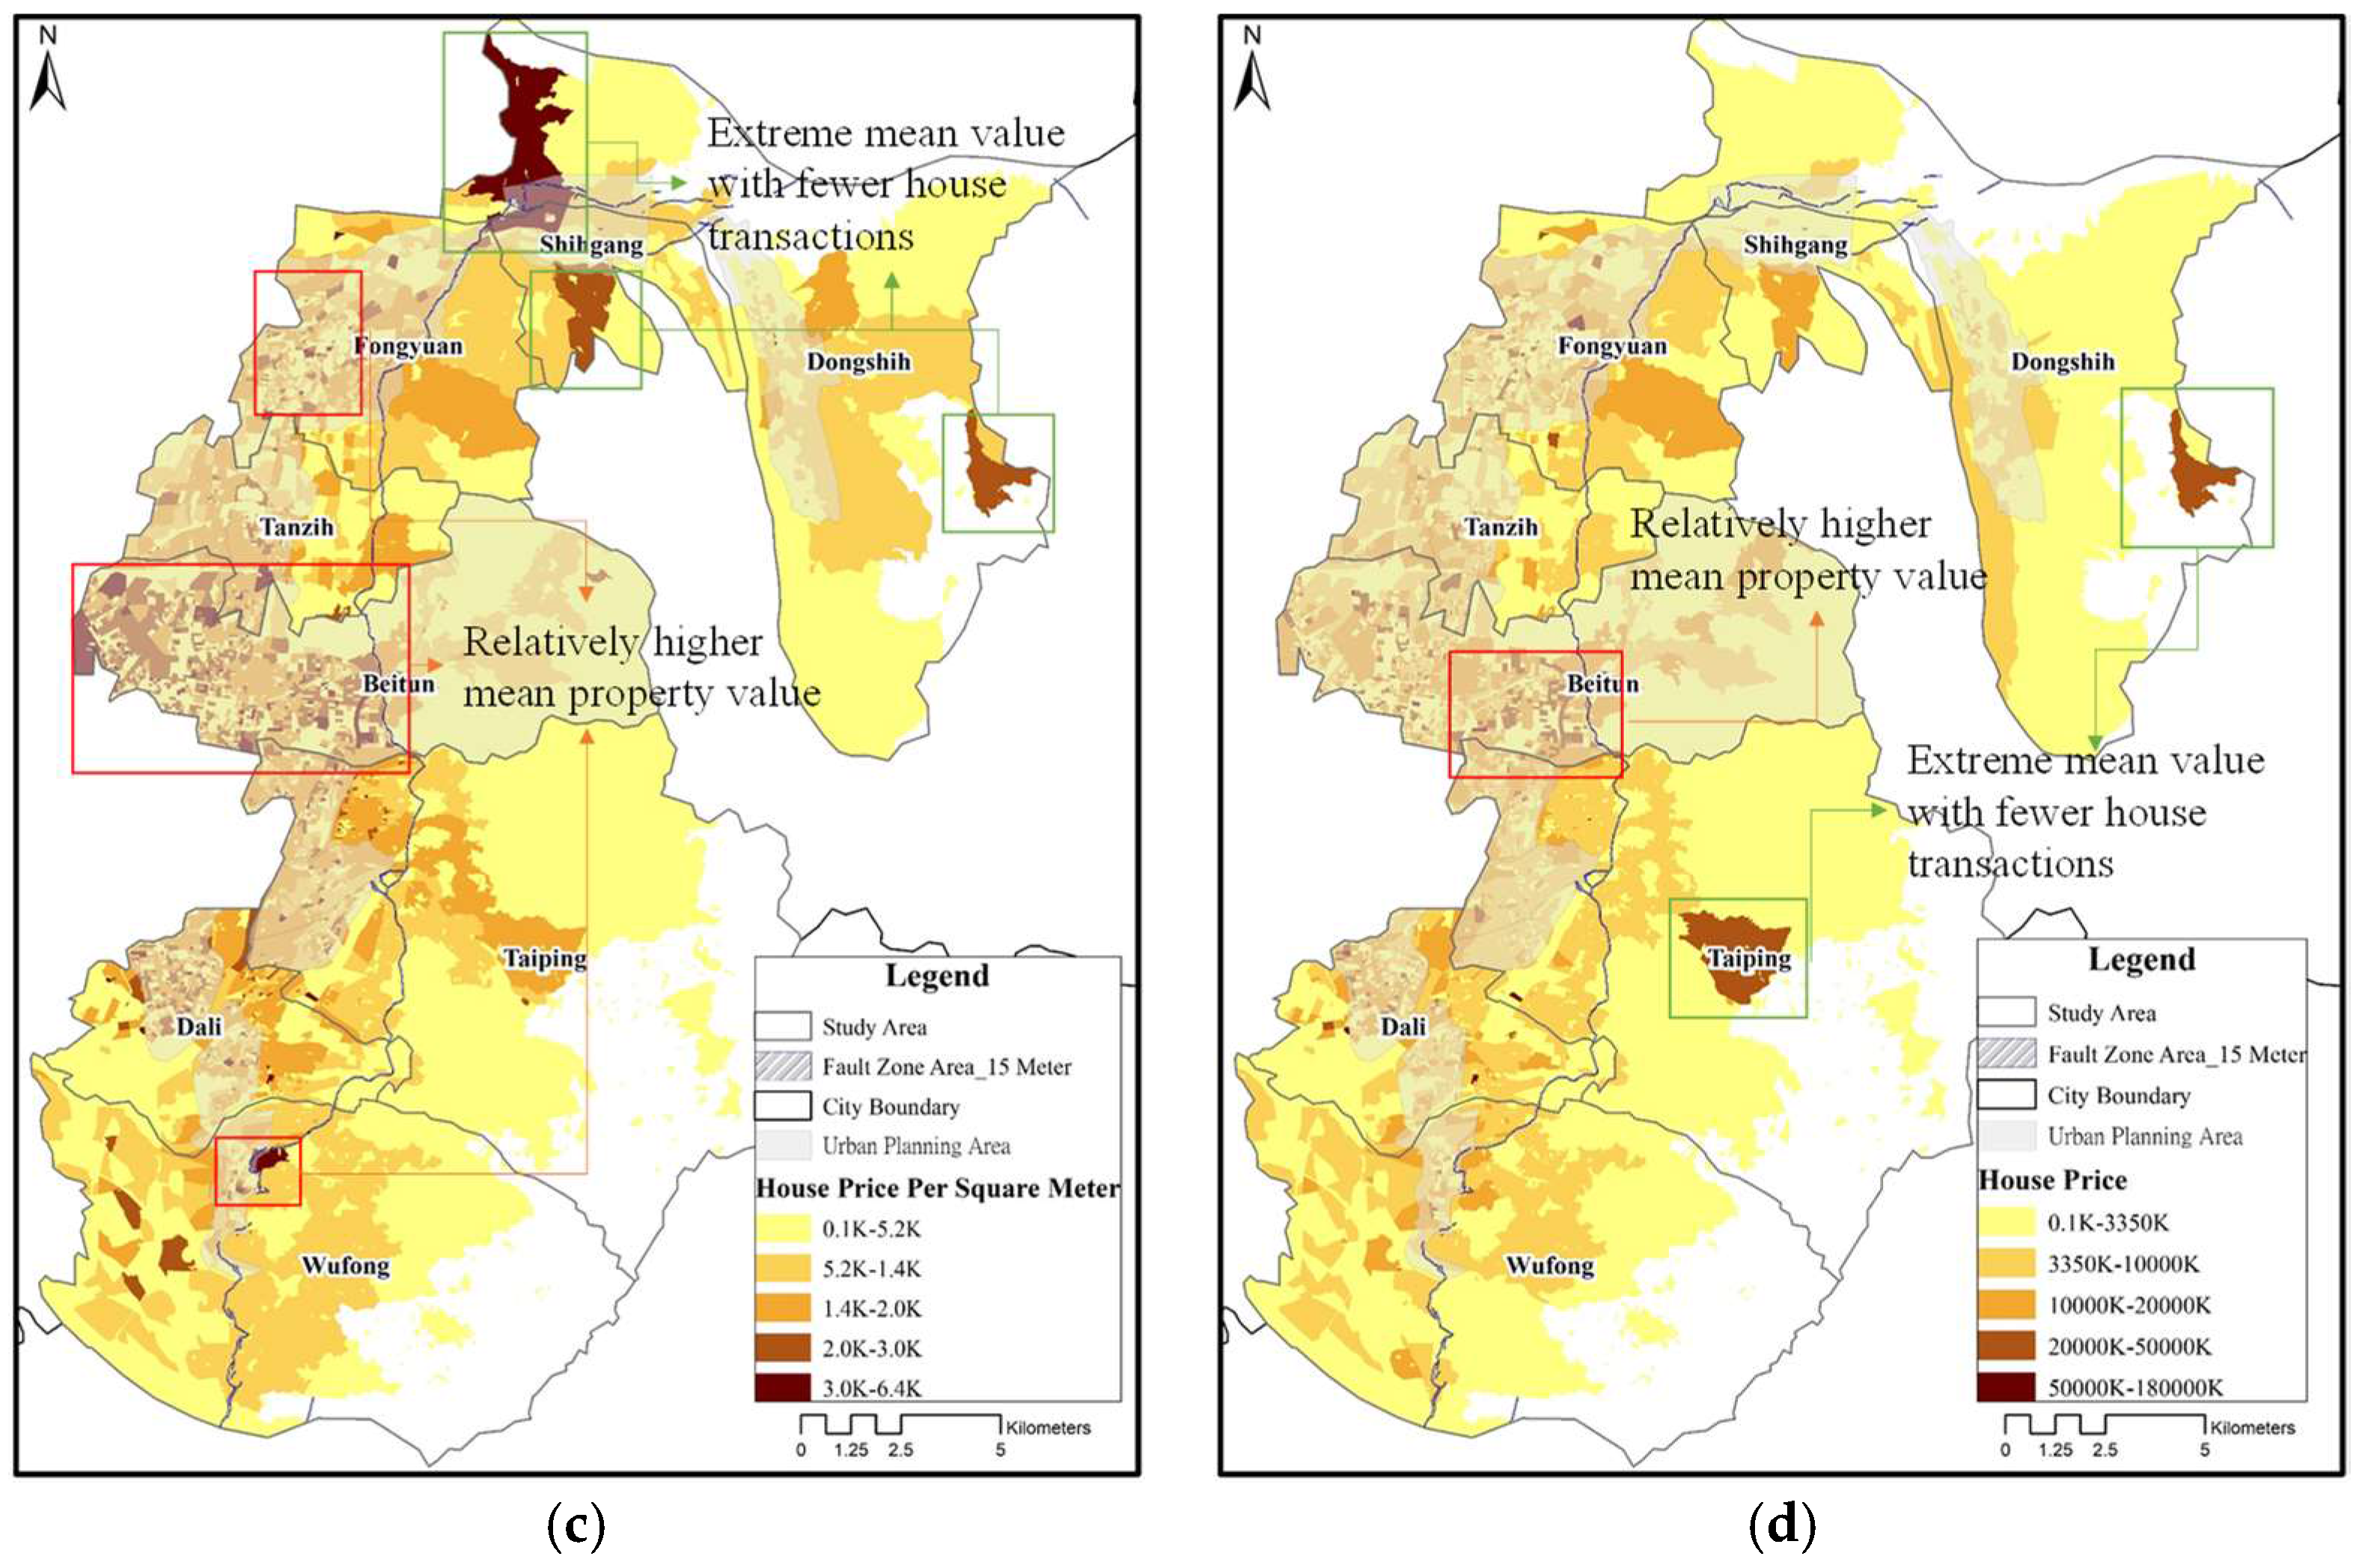
3.2. Spatial Characteristics of Property Transaction Values

The global Moran’s I index results demonstrate that both the house price per square meter and the house price are clustered in the study area (see Table 3). Of these, the house price per square meter is significantly more clustered than the house price. To detect the spatial cluster pattern, this paper will apply LISA. The LISA results indicate that the house price per square meter has much more significant spatial clustering than the house price. However, both HH areas are significantly clustered west of the fault zone area and especially in Fongyuan, Tanzih, Beitun, Taiping, and Dali. HL areas are located along the fault zone area. LH areas are located away from the HH and LL areas, which are located in the eastern portion of the study area (see Figure 6). In sum, partial HH areas in Fongyuan and Beitun are distributed on or near the fault zone area, indicating high property values along these areas.

4. Discussion

Land use planning is one nonstructural measure used to eliminate risk by steering future development away from a risk area and by enforcing particular measures for the existing built environment according to the disaster risk. Nevertheless, various arguments have arisen around applying land use planning in earthquake risk areas. Among these arguments, the announcement of land use planning in earthquake risk areas is a type of disaster risk information disclosure and might impact real estate development willingness or property values. Although land use planning in earthquake risk areas might not impact real estate development willingness, some studies have determined that real estate value in earthquake risk areas is lower than that in non-earthquake risk areas [11,12,13,14].
This study empirically examined how land use planning in an earthquake risk area has been reflected in land development and property value since 2002. The results demonstrate that, although “continue building use” parcels in different time periods are located to the west of the fault zone area, the later ones tend to be built close to Chelungpu fault. By contrast, “become building use” parcels in the earlier time period are located outward from the “continue building use” parcels, whereas later they are located on or nearby the fault zone area. According to the property transaction data, the buildings built before the 921 Chi-Chi Earthquake are located on or nearby the fault zone area in the southern portion, whereas the most recently built buildings are located on or close to the fault zone area in the mid and northern portions.
Owing to the serious damage along Chelungpu fault, local planning agencies revised the urban planning maps and zoning regulation in the fault zone area along each side of Chelungpu fault. Therefore, this paper investigates land use along the fault zone area in both urban planning areas and non-urban planning areas (zoning regulation is regulated in the urban planning area only). On the basis of the zoning regulation in the fault zone area in the urban planning area, the building ratio must be less than 50%, while the floor area ratio should be less than 180%. The only building use type in the fault zone area is residential. In addition, the building height should be less than 7 m.
In the urban planning area, the land use investigation shows that newly constructed buildings (some buildings are even for sale) in the fault zone area are consistent with the zoning regulation, including being residential-only and less than 7 m in height (see Figure 7). Furthermore, residential use is the major land use type within the fault zone area. The zoning regulation is a type of earthquake risk information disclosure, and, according to previous studies, such disclosure might lead to some type of passive attitude toward land use development and may even have a price impact on property transactions. However, the newly constructed buildings with legal building licenses demonstrate the continued willingness to reside within a fault zone area with an improved seismic structure.
The 15 m restriction zone on each side of Chelungpu fault was continued until the end of 2001, after which there were no zoning regulations in the non-urban planning area. The land use investigation in the non-urban planning area indicates that there are newly constructed buildings close to the fault line as well. The building certificate licenses demonstrate that the building height is relatively higher than that of buildings in the urban planning area (see Figure 8). In addition, the height of some buildings in reality is inconsistent with that on the building certificate. In addition to residential use, multiple mixed uses are clustered near or on the fault zone area, which could lead to major damage during serious earthquakes.

5. Conclusions

This paper empirically examined how zoning regulations in earthquake risk areas have been reflected in land use and property transactions since 2002. The results demonstrate that “become building use” parcels in the earlier time period (1995–2008) are located outward from “continue building use” parcels, whereas the later “become building use” parcels (2008–2014) are even located on or nearby the fault zone area (see Figure 5c,d). In addition, buildings built before the 921 Chi-Chi Earthquake located in or near the fault zone area are located in the southern portion, whereas the most recently constructed buildings are located in or close to the fault zone area in the middle and northern portions (see Figure 6).
There has been zoning regulation in the fault zone area in the urban planning area since 2002, but such zoning regulation was only implemented until the end of 2001 in the non-urban planning area. There are newly constructed buildings in both the urban planning and the non-urban planning areas. Most newly built buildings in the urban planning area comply with the zoning regulation with legal building certificates. By contrast, some newly built buildings in the non-urban planning area are relatively higher and see more intensive use near or in the fault zone area. Comparing the building use in the urban planning and non-urban planning areas, the lower height and less intensive use complying with zoning regulation in the urban planning area might help mitigate the potential impact of earthquakes when the fault slips in the future.
Arguments have arisen about applying land use planning to earthquake risk areas, as this serves as a type of disaster risk information disclosure that might impact the willingness to develop land or property value. However, the results indicate that the most recently constructed buildings are located in or close to the fault zone area and have relative higher property prices. In fact, the effects on housing value might vary because of many other factors, such as the house itself, the housing market, the residents’ perception of the hazard risk, etc. Therefore, it is necessary to discuss the factors affecting those who are risk-averse or risk-inclined. A more thorough assessment of land use planning in earthquake risk areas should consider the risk perception and adaptation behavior of households.

Acknowledgments

Support from the Ministry of Science and Technology of ROC through grant MOST 104-2410-H-006-079-MY3 is gratefully acknowledged.

Author Contributions

Tzu-Ling Chen conceived, designed, performed, and analyzed all the data and wrote the paper. Hsueh-Sheng Chang helped conceive and design the overall structure.

Conflicts of Interest

The authors declare no conflict of interest.

References

  1. O’Brien, K.; Sygna, L.; Leichenko, R.; Adger, W.N.; Barnett, J.; Mitchell, T.; Schipper, L.; Tanner, T.; Vogel, C.; Mortreux, C. Disaster reduction, climate change adaptation and human security. In Global Environmental Change and Human Security; The MIT Press: Cambridge, MA, USA, 2008. [Google Scholar]
  2. Guha-Sapir, D.V. Earthquakes, an epidemiological perspective on patterns and trends. In Human Casualties in Earthquakes: Progress in Modelling and Mitigation; Springer: Dordrecht, The Netherlands, 2010. [Google Scholar]
  3. Sheaffer and Roland, Inc. Flood Hazard Mitigation through Safe Land Use and Construction Practices; Keifer and Associates, Inc.: Chicago, IL, USA, 1976. [Google Scholar]
  4. Petak, W.J.; Atkisson, A.A. Natural Hazard Risk Assessment and Public Policy: Anticipating for Unexpected; Springer-Verlag: New York, NY, USA, 1982. [Google Scholar]
  5. Kerr, J.; Nathan, S.; Van Dissen, R.J.; Webb, P.; Brunsdon, D.; King, A.B. Planning for Development of Land on or Close to Active Faults: An Interim Guideline to Assist Resource Management Planners in New Zealand; GNS Client Report; Ministry for the Environment: Wellington, New Zealand, 2003.
  6. Center for Disaster Management (CENDIM); Bogazici University; the Center for Hazards and Risk Research (CHRR); Columbia University. Urban Risk Management or National Disasters: A Research Planning Workshop; CENDIM: Istanbul, Turkey, 2001. [Google Scholar]
  7. Coburn, A.; Spence, R. Earthquake Protection; John Wiley & Sons: Chichester, UK, 2002. [Google Scholar]
  8. Athanasopoulou, E.; Despoiniadou, V.; Dritsos, S. The impact of earthquakes on the city of Aigio in Greece. Urban planning as a factor in mitigating seismic damage. In Proceedings of the Seismic Engineering Conference Commemorating the 1908 Messina and Reggio Calabria Earthquake, Reggio Calabria, Italy, 8–11 July 2008. [Google Scholar]
  9. Bolton, P.A.; Heikkala, S.; Greene, M.; May, P.; Wolfe, M.R. Land Use Planning for Earthquake Hazard Mitigation: A Handbook for Planners. Paper 82. Available online: http://scholarcommons.usf.edu/fmhi_pub/82 (accessed on 25 February 2017).
  10. Brookshire, D.S.; Thayer, M.A.; Tschirhart, J.; Schulze, W.D. A test of the expected utility model: Evidence from earthquake risks. J. Political Econ. 1985, 93, 369–389. [Google Scholar] [CrossRef]
  11. Dale-Johnson, D.; Hyang, K.Y. Coastal development moratoria and housing prices. J. Prop. Financ. Econ. 1990, 3, 165–184. [Google Scholar] [CrossRef]
  12. Bernknopf, R.; Brookshire, D.S.; Thayer, M. Earthquake and volcano alerts: An economic evaluation of risk perception changes. J. Environ. Econ. Manag. 1990, 18, 35–49. [Google Scholar] [CrossRef]
  13. McGinnis, A. The Effect of Earthquake Risk on San Francisco Bay Area Housing Market: How Has It Changed Since the Loma Prieta and Northridge Earthquake? Ph.D. Thesis, Standford University, Standford, CA, USA, 2004. [Google Scholar]
  14. Nakagawa, M.; Saito, M.; Yamaga, H. Earthquake risks and land prices: Evidence from the Tokyo metropolitan area. Jpn. Econ. Rev. 2009, 60, 208–222. [Google Scholar] [CrossRef]
  15. Zhang, Y.; Hwang, S.N.; Lindell, M.K. Hazard proximity or riskperception? Evaluating effects of natural and technological hazards on housing values. Environ. Behav. 2010, 42, 597–624. [Google Scholar] [CrossRef]
  16. Palm, R. Real Estate Agents and Special studies Zones Disclosure: The Response of California Home Buyers to Earthquake Hazards Information; Institute of Behavioral Science, Program on Technology, Environment and Man, Monograph No. 32; University of Colorado: Boulder, CO, USA, 1981. [Google Scholar]
  17. Toké, N.A.; Boone, C.G.; Arrowsmith, J.R. Fault zone regulation, seismic hazard, and social vulnerability in Los Angeles, California: Hazard or urban amenity? Earth’s Futur. 2014, 2, 440–457. [Google Scholar] [CrossRef]
  18. Tobler, W.R. A computer movie simulating urban growth in the Detroit region. Econ. Geogr. 1970, 46, 234–240. [Google Scholar] [CrossRef]
  19. Cliff, A.D.; Ord, J.K. Spatial Processes; Pion: London, UK, 1981. [Google Scholar]
  20. Goodchild, M.F. Spatial Autocorrelation; CATMOG 47; University of East Angolia: Norwich, UK, 1986. [Google Scholar]
  21. Griffith, D.A. Spatial Autocorrelation and Spatial Filtering: Gaining Understanding through Theory and Scientific Visualization; Springer-Verlag: Berlin/Heidelberg, Germany, 2003. [Google Scholar]
  22. Wong, D.W.S.; Lee, J. Statistical Analysis of Geographic Information with ArcView GIS and ArcGIS; Wiley: Chichester, UK, 2008. [Google Scholar]
  23. Chang, H.S.; Chen, T.L. Exploring spatial patterns of farmland transactions and farmland use changes. Environ. Monit. Assess. 2015, 187, 1–14. [Google Scholar] [CrossRef] [PubMed]
  24. Bivand, R.S. Exploratory spatial data analysis. In Handbook of Applied Spatial Analysis: Software Tools, Methods and Applications; Springer: Heidelberg, Germany; Dordrecht, The Netherlands; London, UK; New York, NY, USA, 2010. [Google Scholar]
  25. Anselin, L. Local indicators of spatial association-LISA. Geogr. Anal. 1995, 27, 93–116. [Google Scholar] [CrossRef]
Figure 1. Spatial distribution of damaged buildings in the study area. (a) Spatial distribution of collapsed buildings, tilted buildings, and serious damage; (b) Spatial distribution of moderate and slight damage; (c) The relationship between building damage and distance from the fault line.
Sustainability 10 01175 g001aSustainability 10 01175 g001b
Figure 2. Geographical distribution of land use change in different time periods. (a) Continue building use (1995–2008); (b) Continue building use (2008–2014); (c) Become building use (1995–2008); (d) Become building use (2008–2014).
Sustainability 10 01175 g002aSustainability 10 01175 g002b
Figure 3. Spatial features of house transactions from 2012 to 2015. (a) Housing transactions; (b) Spatial distribution of 2014 building use; (c) House price per square meter; (d) House price.
Sustainability 10 01175 g003aSustainability 10 01175 g003b
Figure 4. Demonstration of spatial cluster patterns.
Sustainability 10 01175 g004
Figure 5. LISA results of land use change. (a) Continue building use from 1995 to 2008; (b) Continue building use from 2008 to 2014; (c) Become building use from 1995 to 2008; (d) Become building use from 2008 to 2014.
Sustainability 10 01175 g005aSustainability 10 01175 g005b
Figure 6. LISA results of property transactions. (a) House price per square meter; (b) House price.
Sustainability 10 01175 g006
Figure 7. Land use investigation within the fault zone area in the urban planning area.
Sustainability 10 01175 g007
Figure 8. Land use investigation within the fault zone area in the non-urban planning area.
Sustainability 10 01175 g008
Table 1. The measurement of Geary’s Ratio and Moran’s I Index
Spatial PatternsGeary’s RatioMoran’s I Index
Clustered pattern in which adjacent or nearby blocks show similar characteristics0 < C < 1I > E(I)
Random pattern in which blocks do not show particular patterns of similarity C 1 I E ( I )
Dispersed pattern in which adjacent or nearby blocks show different characteristics1 < C < 2I < E(I)
Table 2. The global Moran’s I results for land use change.
Moran’s I IndexE(I)Z-ScoresPattern
Continue building use1995–20080.3524−0.0001252.5748Clustered
2008–20140.4055290.6210Clustered
Become building use1995–20080.2006143.8835Clustered
2008–20140.091465.6674Clustered
Table 3. The global Moran’s I results for property values.
Moran’s I IndexE(I)Z-ScoresPattern
Property transactionPer square meter0.2269−0.0001154.7625Clustered
House price0.1724118.2155Clustered

