Article

Quantifying Surface Coal-Mining Patterns to Promote Regional Sustainability in Ordos, Inner Mongolia

1
Center for Human-Environment System Sustainability (CHESS), State Key Laboratory of Earth Surface Processes and Resource Ecology (ESPRE), Beijing Normal University, Beijing 100875, China
2
Faculty of Geographical Science, Beijing Normal University, Beijing 100875, China
3
School of Life Sciences and School of Sustainability, Arizona State University, Tempe, AZ 85287, USA
*
Author to whom correspondence should be addressed.
Sustainability 2018, 10(4), 1135; https://doi.org/10.3390/su10041135
Submission received: 20 March 2018 / Revised: 6 April 2018 / Accepted: 7 April 2018 / Published: 10 April 2018

Abstract

:
Ordos became the new “coal capital” of China within a few decades since the country’s economic reform in 1978, as large-scale surface coal mining dramatically propelled its per capita GDP from being one of the lowest to one of the highest in China, exceeding Hong Kong in 2009. Surface coal-mining areas (SCMAs) have continued to expand in this region during recent decades, resulting in serious environmental and socioeconomic consequences. To understand these impacts and promote regional sustainability, quantifying the spatiotemporal patterns of SCMAs is urgently needed. Thus, the main objectives of this study were to quantify the spatiotemporal patterns of SCMAs in the Ordos region from 1990 to 2015, and to examine some of the major environmental and socioeconomic impacts in the study region. We extracted the SCMAs using remote-sensing data, and then quantified their spatiotemporal patterns using landscape metrics. The loss of natural habitat and several socioeconomic indicators were examined in relation to surface coal mining. Our results show that the area of SCMAs increased from 7.12 km2 to 355.95 km2, an increase of nearly 49 times from 1990 to 2015 in the Ordos region. The number of SCMAs in this region increased from 82 to 651, a nearly seven-fold increase. In particular, Zhungeer banner (an administrative division), Yijinhuoluo banner, Dongsheng District and Dalate banner in the north-eastern part of the Ordos region had higher growth rates of SCMAs. The income gap between urban and rural residents increased along with the growth in SCMAs, undermining social equity in the Ordos region. Moreover, the rapid increase in SCMAs resulted in natural habitat loss (including grasslands, forests, and deserts) across this region. Thus, we suggest that regional sustainability in Ordos needs to emphasize effective measures to curb large-scale surface coal mining in order to reduce the urban–rural income gap, and to restore degraded natural ecosystems.

1. Introduction

Surface coal-mining areas (SCMAs) refer to places where coal reserves are exploited using opencast mining techniques, including the surrounding areas associated with mining activities [1]. The Ordos region is located in the south-western part of the Inner Mongolia Autonomous Region, which is an important base of coal production in China. The coal reserves in this region account for about one-sixth of the national proven reserves, most of which are suitable for opencast mining [2]. In addition, with the semi-arid climate, the Ordos region has a vulnerable environment and is faced with multiple challenges of severe water shortages, high sensitivity to climate change and large-scale land degradation [3,4,5]. Since China’s reform and opening up, the Ordos region has experienced a dramatic growth in SCMAs to meet the increasing demand for coal due to rapid socioeconomic development [6]. Such growth has resulted in numerous problems, including soil erosion, loss of lakes, soil and water pollution, and biodiversity decline, which undermine the sustainable development of this region [4,7]. To assess the environmental and socioeconomic effects of SCMAs and improve sustainability in the Ordos region, understanding the spatiotemporal patterns of the SCMAs is an important and necessary step.
Several researchers have quantified the spatiotemporal patterns of SCMAs in the Ordos region. For example, Li et al. [6] quantified the spatiotemporal patterns of SCMAs in the Mu Us sandy lands in the Ordos region from 2000 to 2013. Kang et al. [8] quantified the spatiotemporal patterns of Heidaigou SCMAs in the Ordos region from 1987 to 2010. Zeng et al. [9] quantified the spatial patterns of SCMAs in the eastern part of Ordos in 2014. However, these studies only focused on the spatiotemporal patterns of SCMAs in partial areas of the Ordos region, lacking the research quantifying the spatiotemporal patterns of SCMAs in the entire Ordos region.
In this study, our primary objective was to quantify the spatiotemporal patterns of SCMAs in the entire Ordos region from 1990 to 2015. First, we extracted the SCMAs in the Ordos region for the years of 1990, 1995, 2000, 2005, 2010, and 2015, using remote-sensing data. Then, we analyzed the spatiotemporal patterns of SCMAs from 1990 to 2015 based on the landscape metrics. Finally, we discussed the environmental and socioeconomic impacts of the changes in SCMAs by utilizing statistical data and land-use/cover data in the Ordos region.

2. Study Area and Data
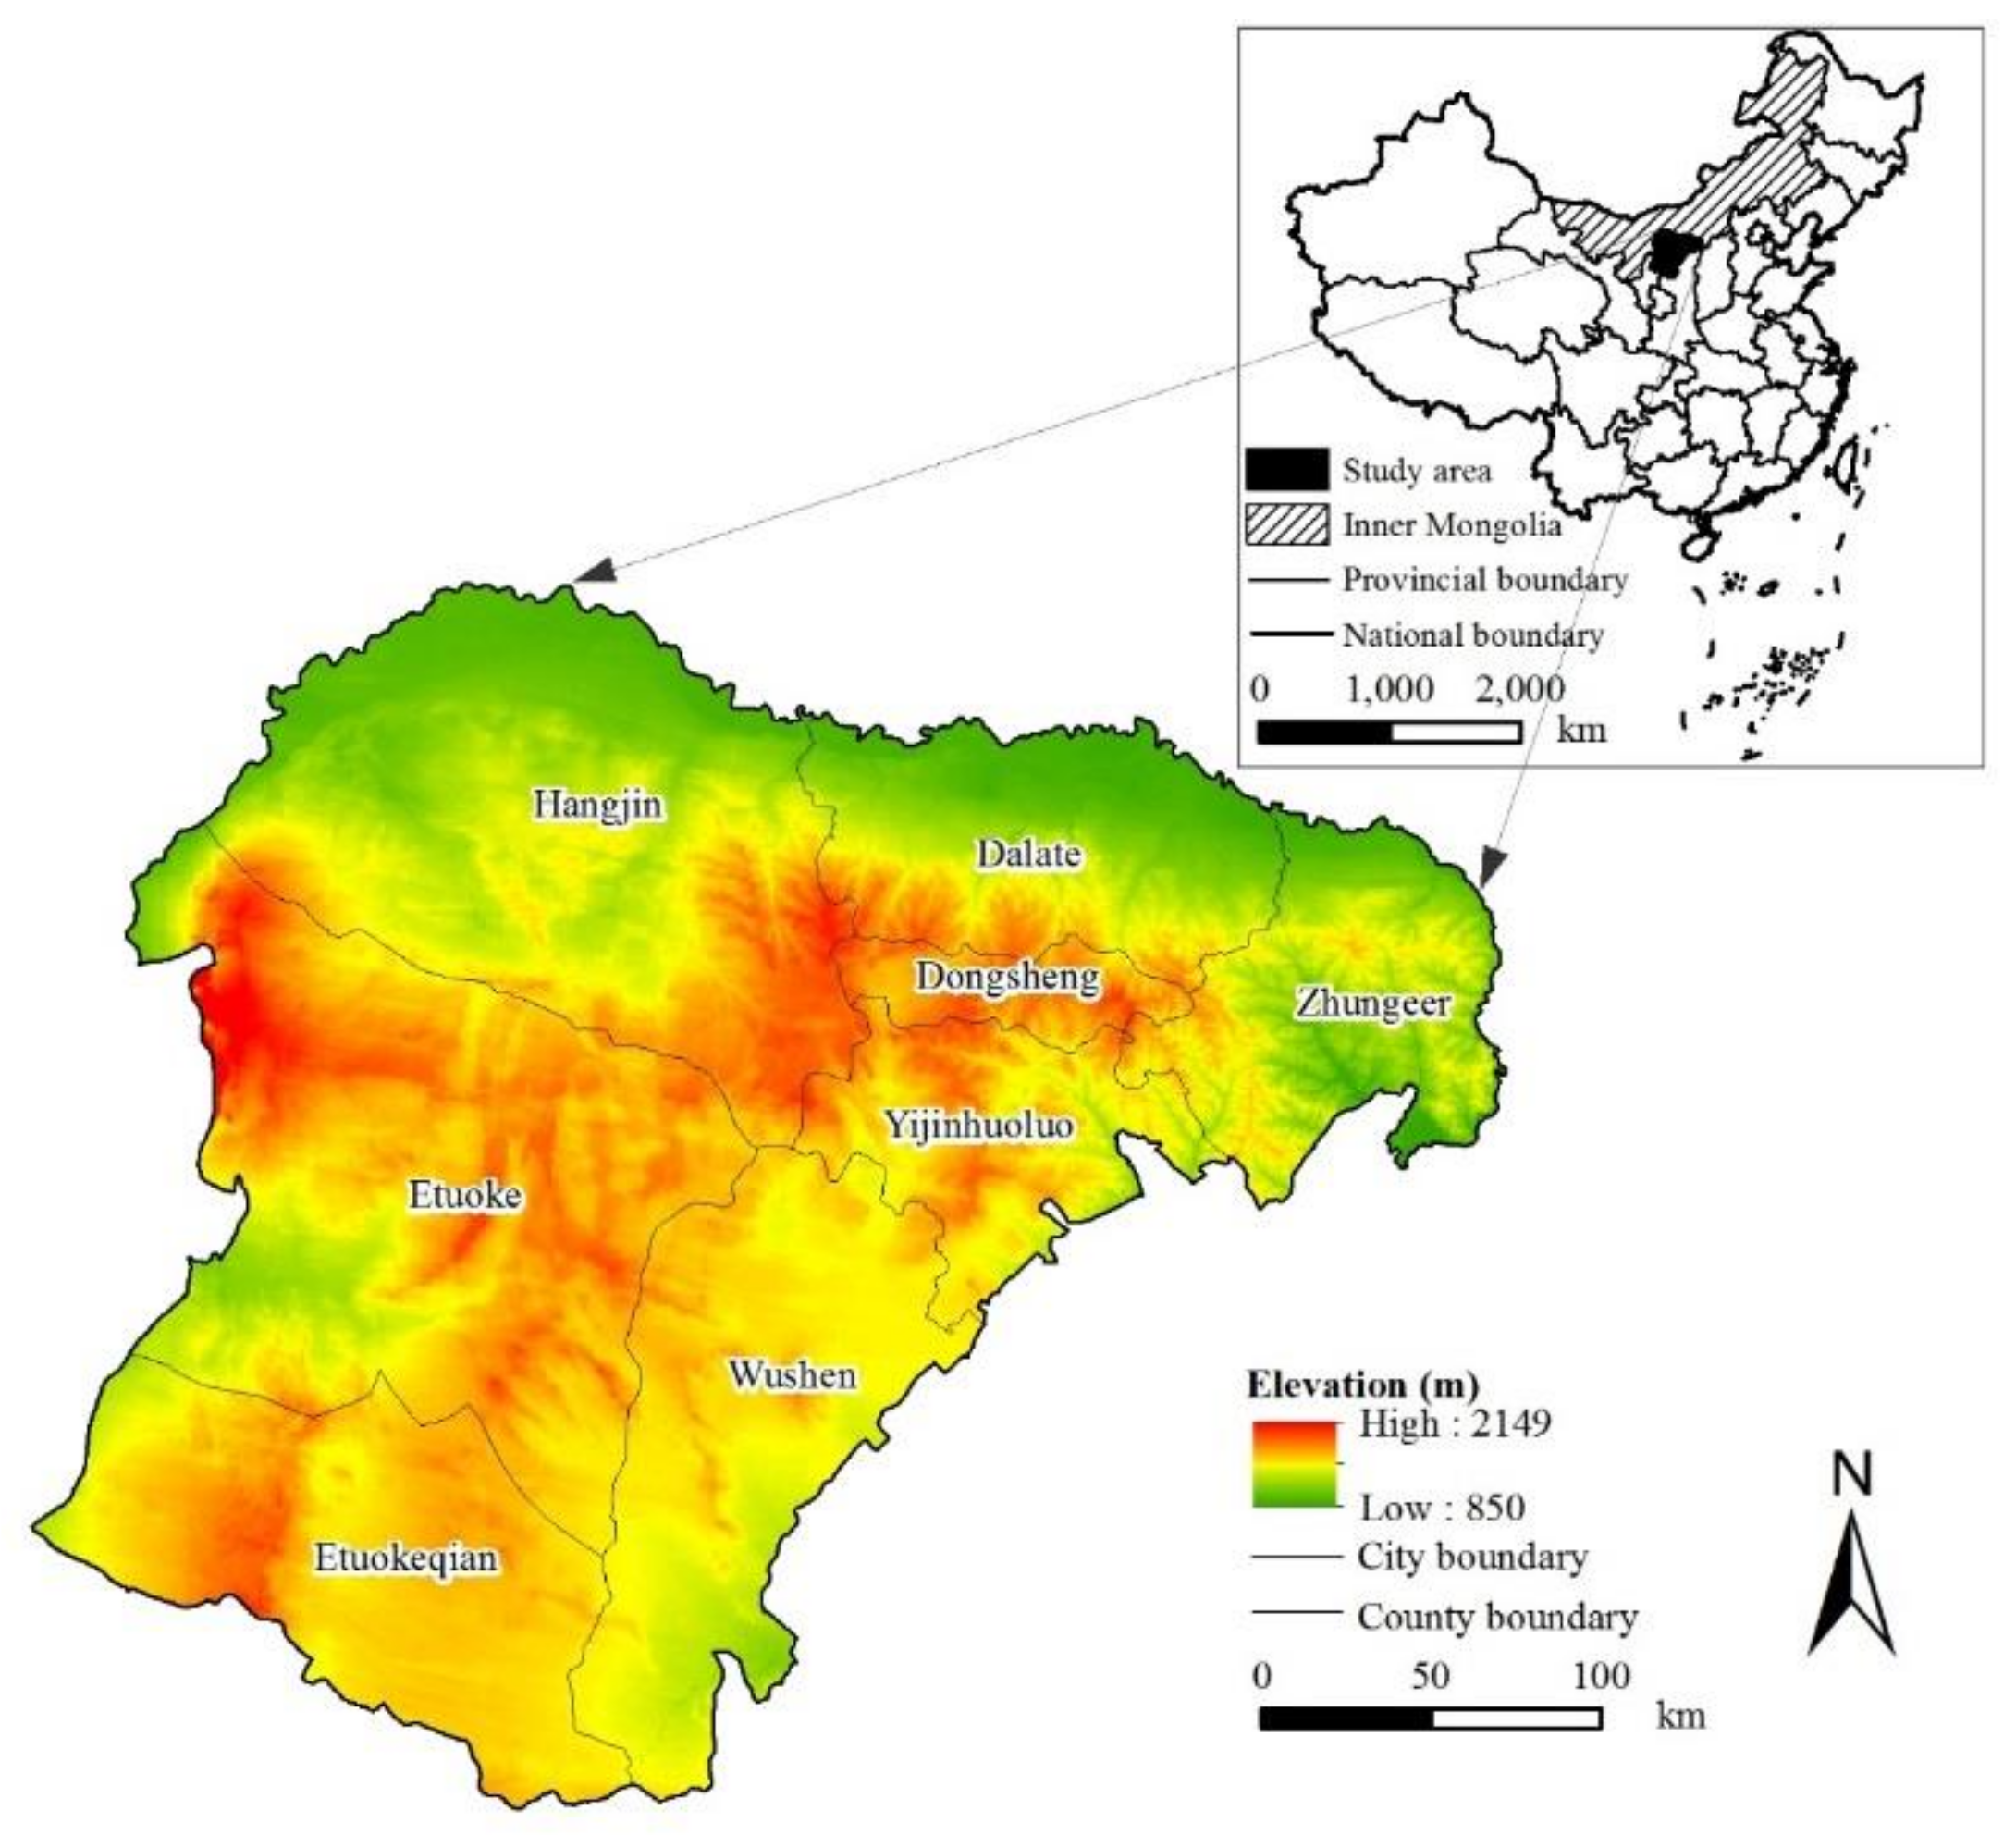
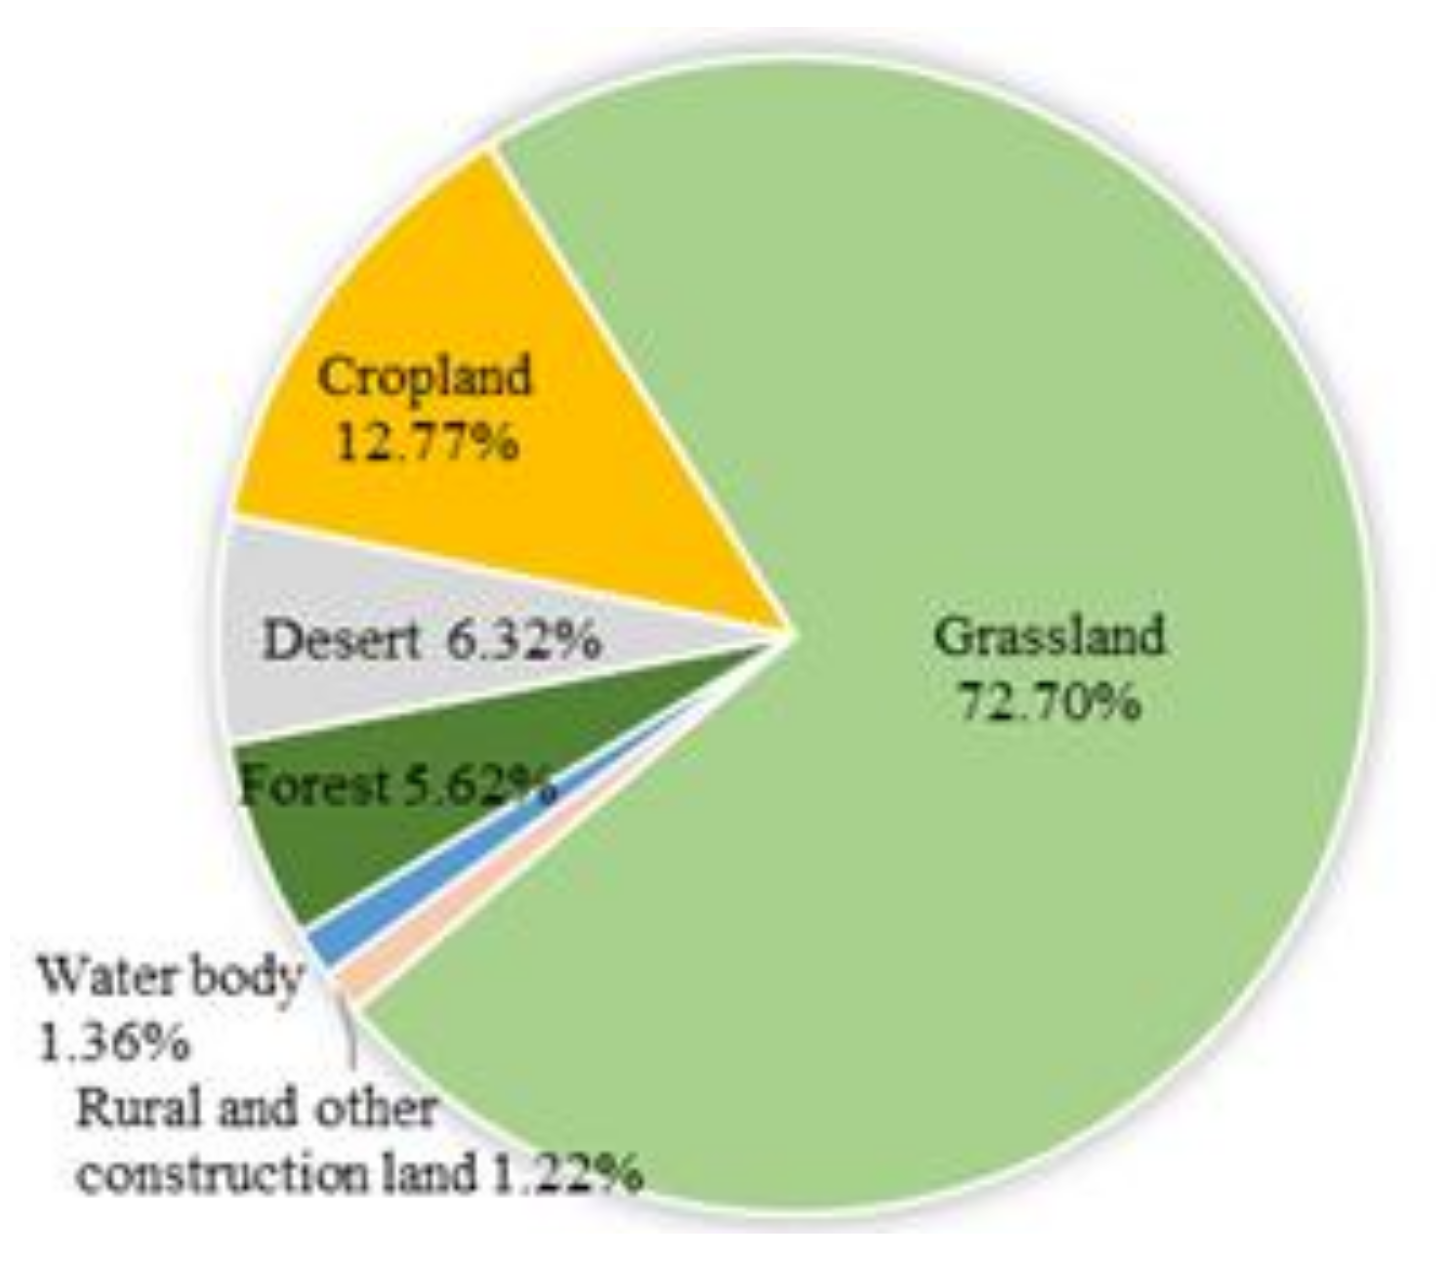
2.1. Study Area

The Ordos region is located within 37°35′~40°51′ N and 106°42′~111°27′ E, and it covers an area of approximately 86,000 km2 (Figure 1). The topography is high in the west and low in the east, with an elevation between 850 m and 2149 m [10]. With a temperate continental climate, the Ordos region has an annual sunshine duration between 2716.4 h and 3193.9 h, an average annual temperature between 5.3 °C and 8.7 °C, and a mean annual precipitation ranging from 170 mm to 450 mm [11].
The Ordos region includes eight counties (Figure 1). In the period of 1990–2015, the total population increased from 1.20 million people to 2.05 million people, representing an increase of 70.83% in the region [12,13]. The urban population increased from 0.22 million people to 1.50 million people, representing an increase of 5.82 times [12,13]. The urbanization rate of the Ordos region increased from 18.27% to 73.13%, representing an increase of 3 times [12,13]. The gross domestic product (GDP) increased from 1.49 trillion yuan to 422.61 trillion yuan, representing an increase of 282.63 times [12,13]. The ratio of secondary industry increased from 25.43% to 56.79%, representing an increase of 1.23 times, while the ratio of tertiary industry increased from 26.65% to 40.87%, representing with an increase of 53.36% [12,13].
The Ordos region has abundant coal resources. In this region, the coal-bearing area covers about 70% of the total area, while the proven coal reserves account for 201.75 trillion tons [2]. Specifically, this region can be divided into four coalfields including the Zhungeer coalfield in the east, the Zhuozishan coalfield in the west, the Dongsheng coalfield in the south, and the Wulangeer coalfield in the north [14]. In addition, this region has various types of coal, such as brown coal, cannel coal, and no-caking coal. Most of those coal resources are buried in a shallow layer, which is suitable for opencast mining [14]. From 1990 to 2015, coal production in the Ordos region increased from 6.11 million tons to 616.93 million tons, representing growth of 100 times [12,13]. In the same period, the coal price increased from 61.67 RMB yuan to 424.80 RMB yuan, a growth of about 6 times [12,13]. The coal industry has played an important role in the socioeconomic development of Ordos [14].

2.2. Data

Landsat TM/OLI data at a spatial resolution of 30 m in the Ordos region from 1990 to 2015 were obtained from the United States Geological Survey website (http://glovis.usgs.gov). The Landsat TM/OLI data covering the study area were acquired in June or July for the years 1990, 1995, 2000, 2005, 2010, and 2015 (Appendix A). Such a period is the growing season of vegetation, which is appropriate for distinguishing SCMAs from vegetated areas.
Land-use/cover data for the Ordos region in 1990 were obtained from the China Land-Use/Cover Dataset (CLUD) published by the Chinese Academy of Sciences [15,16,17]. It covers 6 classifications including cropland, forest, grassland, water body, rural and other construction land, and desert, with a spatial resolution of 30 m.
Socioeconomic data for the Ordos region from 1990 to 2015 were obtained from the Inner Mongolia Statistical Yearbooks and the Ordos Statistical Yearbooks. The socioeconomic data included the population, GDP, local government revenue, total investment in fixed assets, resident saving deposit, per-capita net income of peasants and herdsmen, per capita disposable income of urban residents, and coal production.
High-resolution images, acquired on September 12, 2015, were obtained from the Google Earth website (https://www.google.com/earth). The administrative boundaries were obtained from the National Geomatics Center of China at the scale of 1:1,000,000.

3. Methods

3.1. Extracting the Surface Coal-Mining Areas (SCMAs)

Following Zeng et al. [9], we extracted the SCMAs in the Ordos region from the Landsat TM/OLI data for the years 1990, 1995, 2000, 2005, 2010, and 2015, by combining the object-oriented decision trees (OODT) with the visual interpretation. Specifically, the OODT approach involves three main steps, i.e., object-oriented segmentation, calculation of spectral characteristics, and extraction of SCMAs [9]. First, we used an object-oriented multiscale image analysis method to segment the Landsat TM/OLI image. The segmentation scale parameter was set to 200, and the weights of color, shape, smoothness and compactness were set to 0.9, 0.1, 0.5, and 0.5, respectively [9]. Then, we calculated three indices that can capture the spectral characteristics of SCMAs for all segmented objects, following the methods used by Tucker [18], Bouziani et al. [19], Zhai et al. [20], and Mao et al. [21]. These indices included the normalized difference coal index (NDCI), the normalized difference vegetation index (NDVI), and the built-up area index (BAI). Finally, we used the object-oriented decision trees developed by Zeng et al. [9] to extract the SCMAs in the Ordos region. Since some SCMAs would be omitted using the OODT approach [9], we further performed visual interpretation to correct the results of the SCMAs

3.2. Quantifying the Spatiotemporal Patterns of SCMAs

Following Herzog [22], Wu et al. [23], and Liu et al. [24], we used landscape metrics to quantify the spatiotemporal patterns of SCMAs from 1990 to 2015 in the Ordos region. First, we selected eight landscape metrics to quantify the composition and configuration of SCMAs in this region. These metrics included largest patch index (LPI), mean patch size (MPS), patch density (PD), edge density (ED), landscape shape index (LSI), area-weighted mean fractal dimension (AWMFD), mean Euclidean nearest neighbor distance (NND) and aggregation index (AI) (Table 1). Then, we calculated the landscape metrics of SCMAs for the years 1990, 1995, 2000, 2005, 2010, and 2015 in the Ordos region and the eight counties using the FRAGSTATS v4.2 software [25] (McGarigal et al. 2002). Finally, we analyzed the changes in landscape metrics of SCMAs from 1990 to 2015 at the regional and county scales.

4. Results

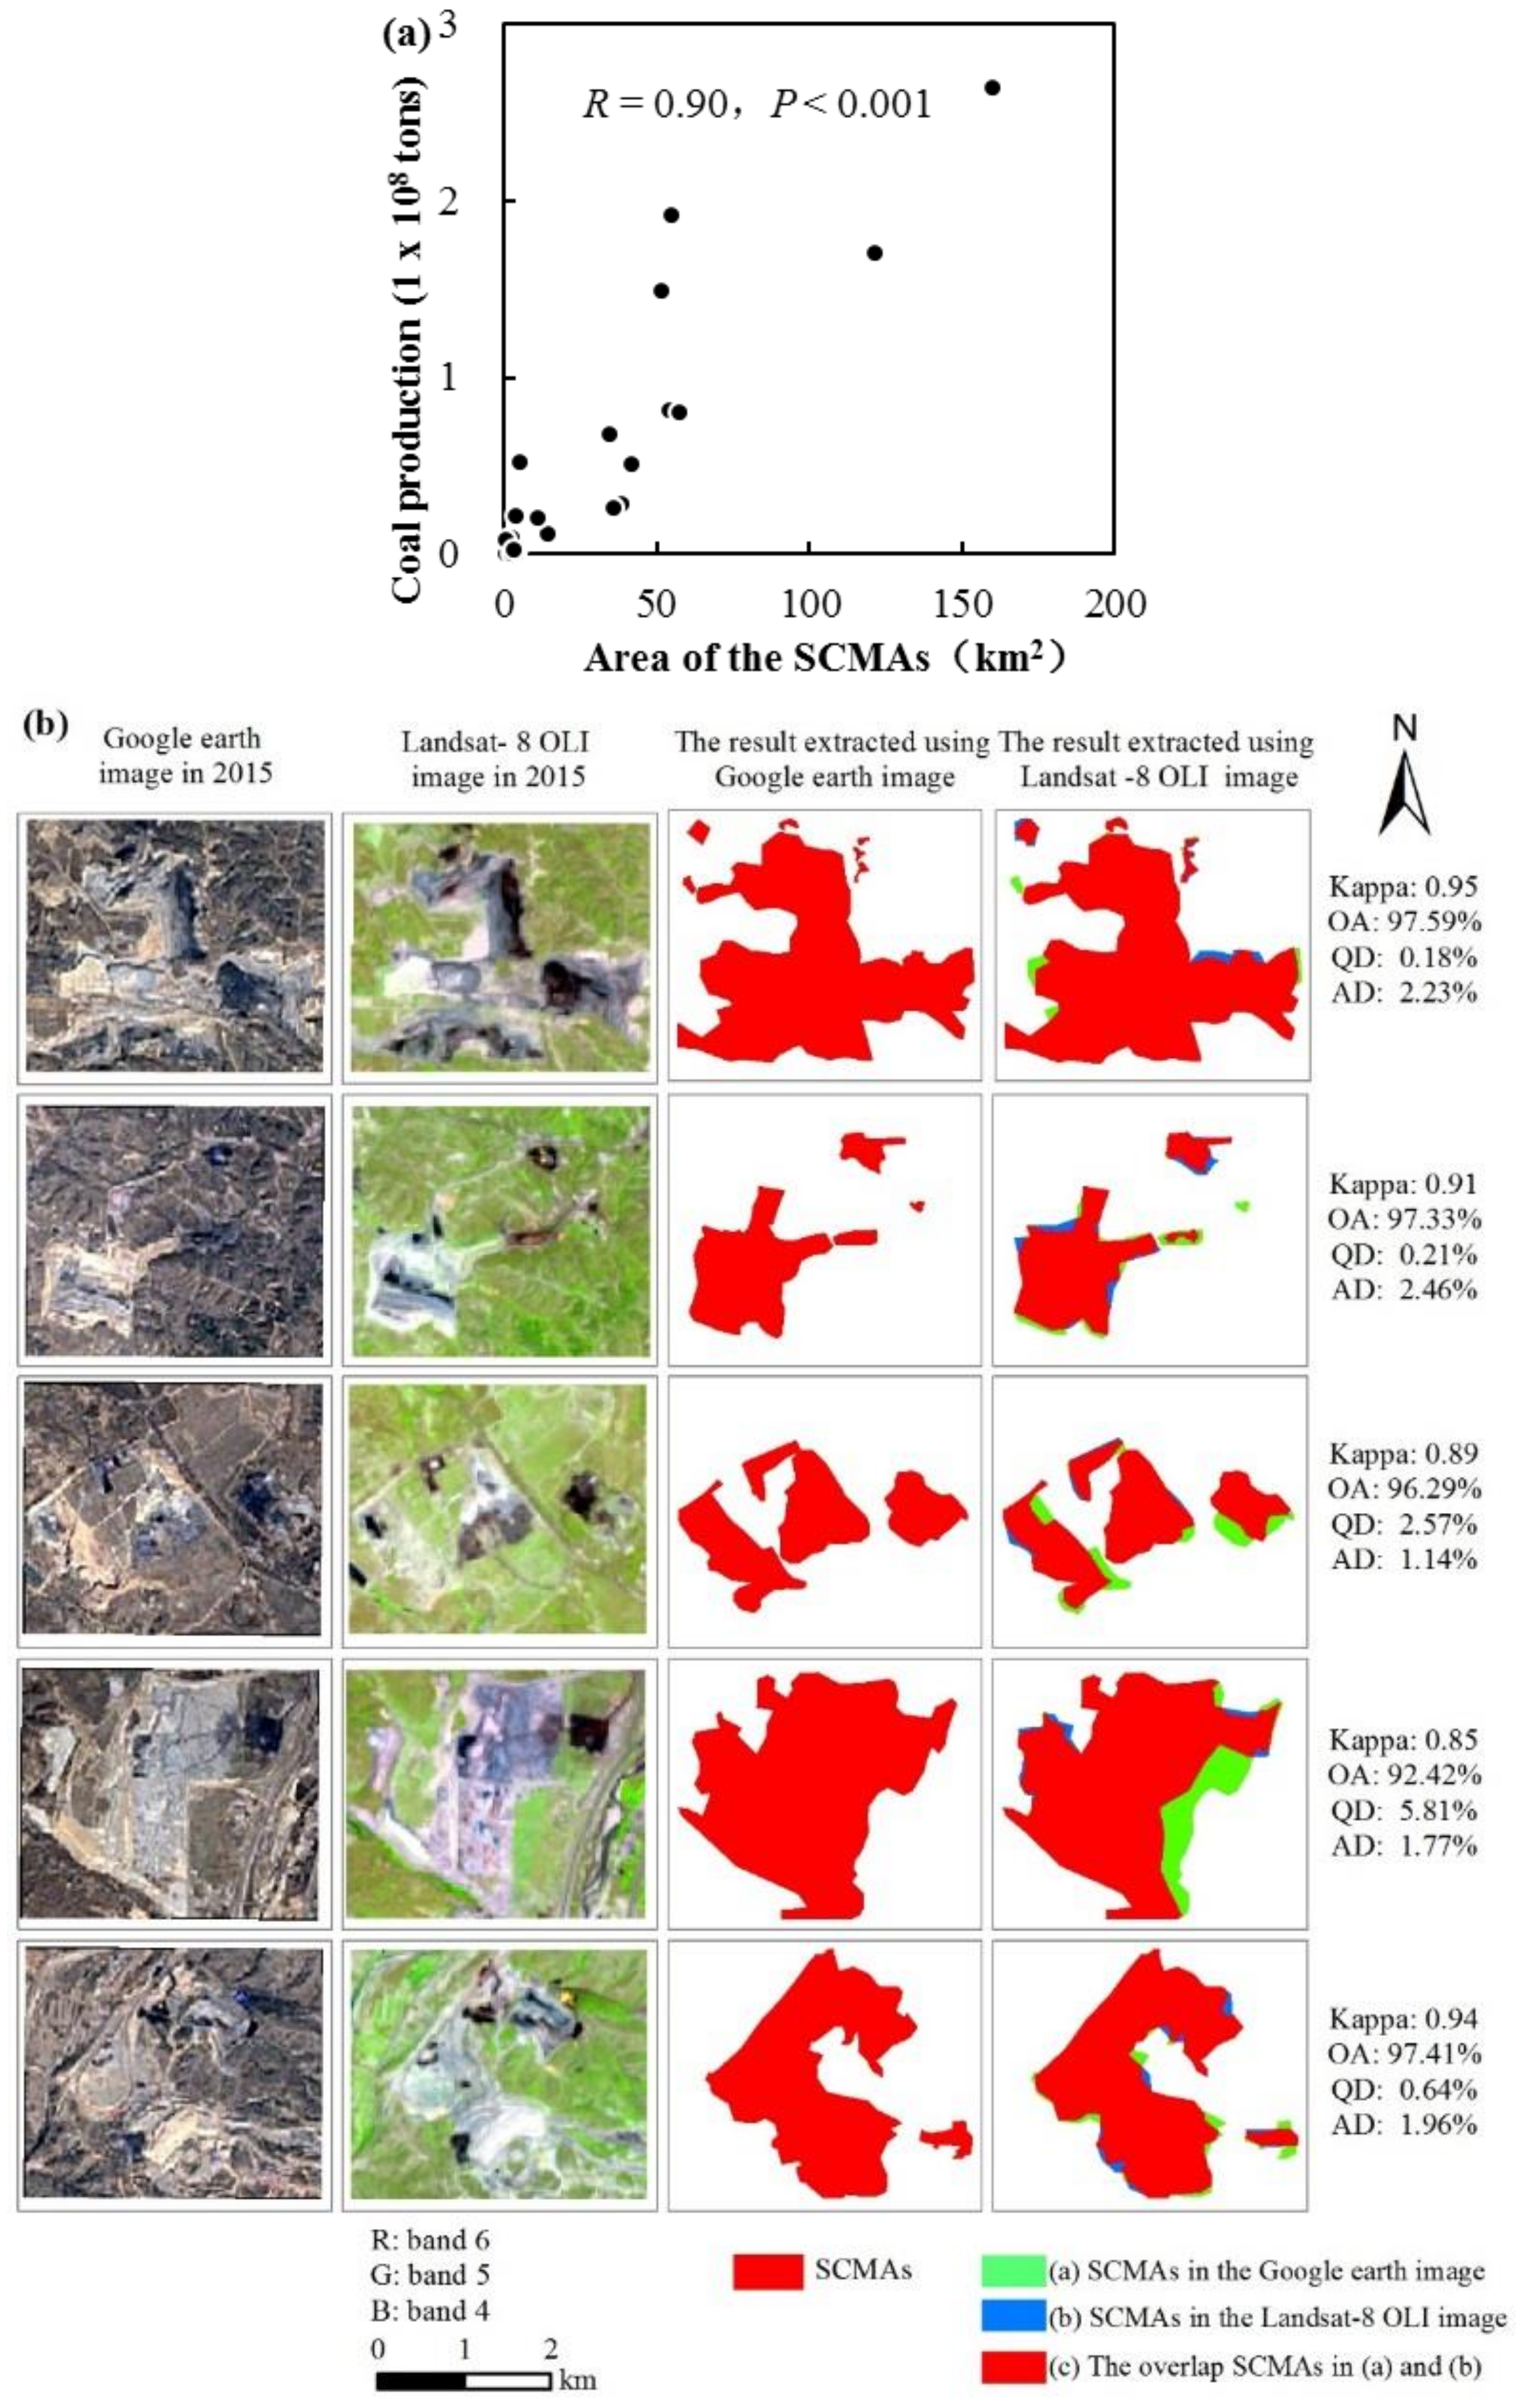
4.1. Accuracy Assessment

Following Liu et al. [26] and He et al. [27], we used the statistical data on coal production and the high-resolution images to assess the accuracy of the extracted SCMAs in the Ordos region from 1990 to 2015. First, the relationships between the area of the SCMAs and coal production were analyzed at the county level. The assessment showed that our extracted results had a strong correlation (R = 0.90) with statistical data on coal production at a significance level of 0.001 (Figure 2a). In addition, we assessed the spatial accuracy of our extracted SCMAs in 2015 with reference to the SCMAs extracted from the high-resolution images. In this assessment process, five SCMAs were selected as sample areas. The assessments showed that there were an average Kappa value of 0.91, an average overall accuracy (OA) of 92.21%, an average quantity of disagreement (QD) of 1.88%, and an average allocation of disagreement (AD) of 1.91% (Figure 2b). The relatively high accuracy suggests that the dynamics of SCMAs in the Ordos region from 1990 to 2015 were well captured in our study.

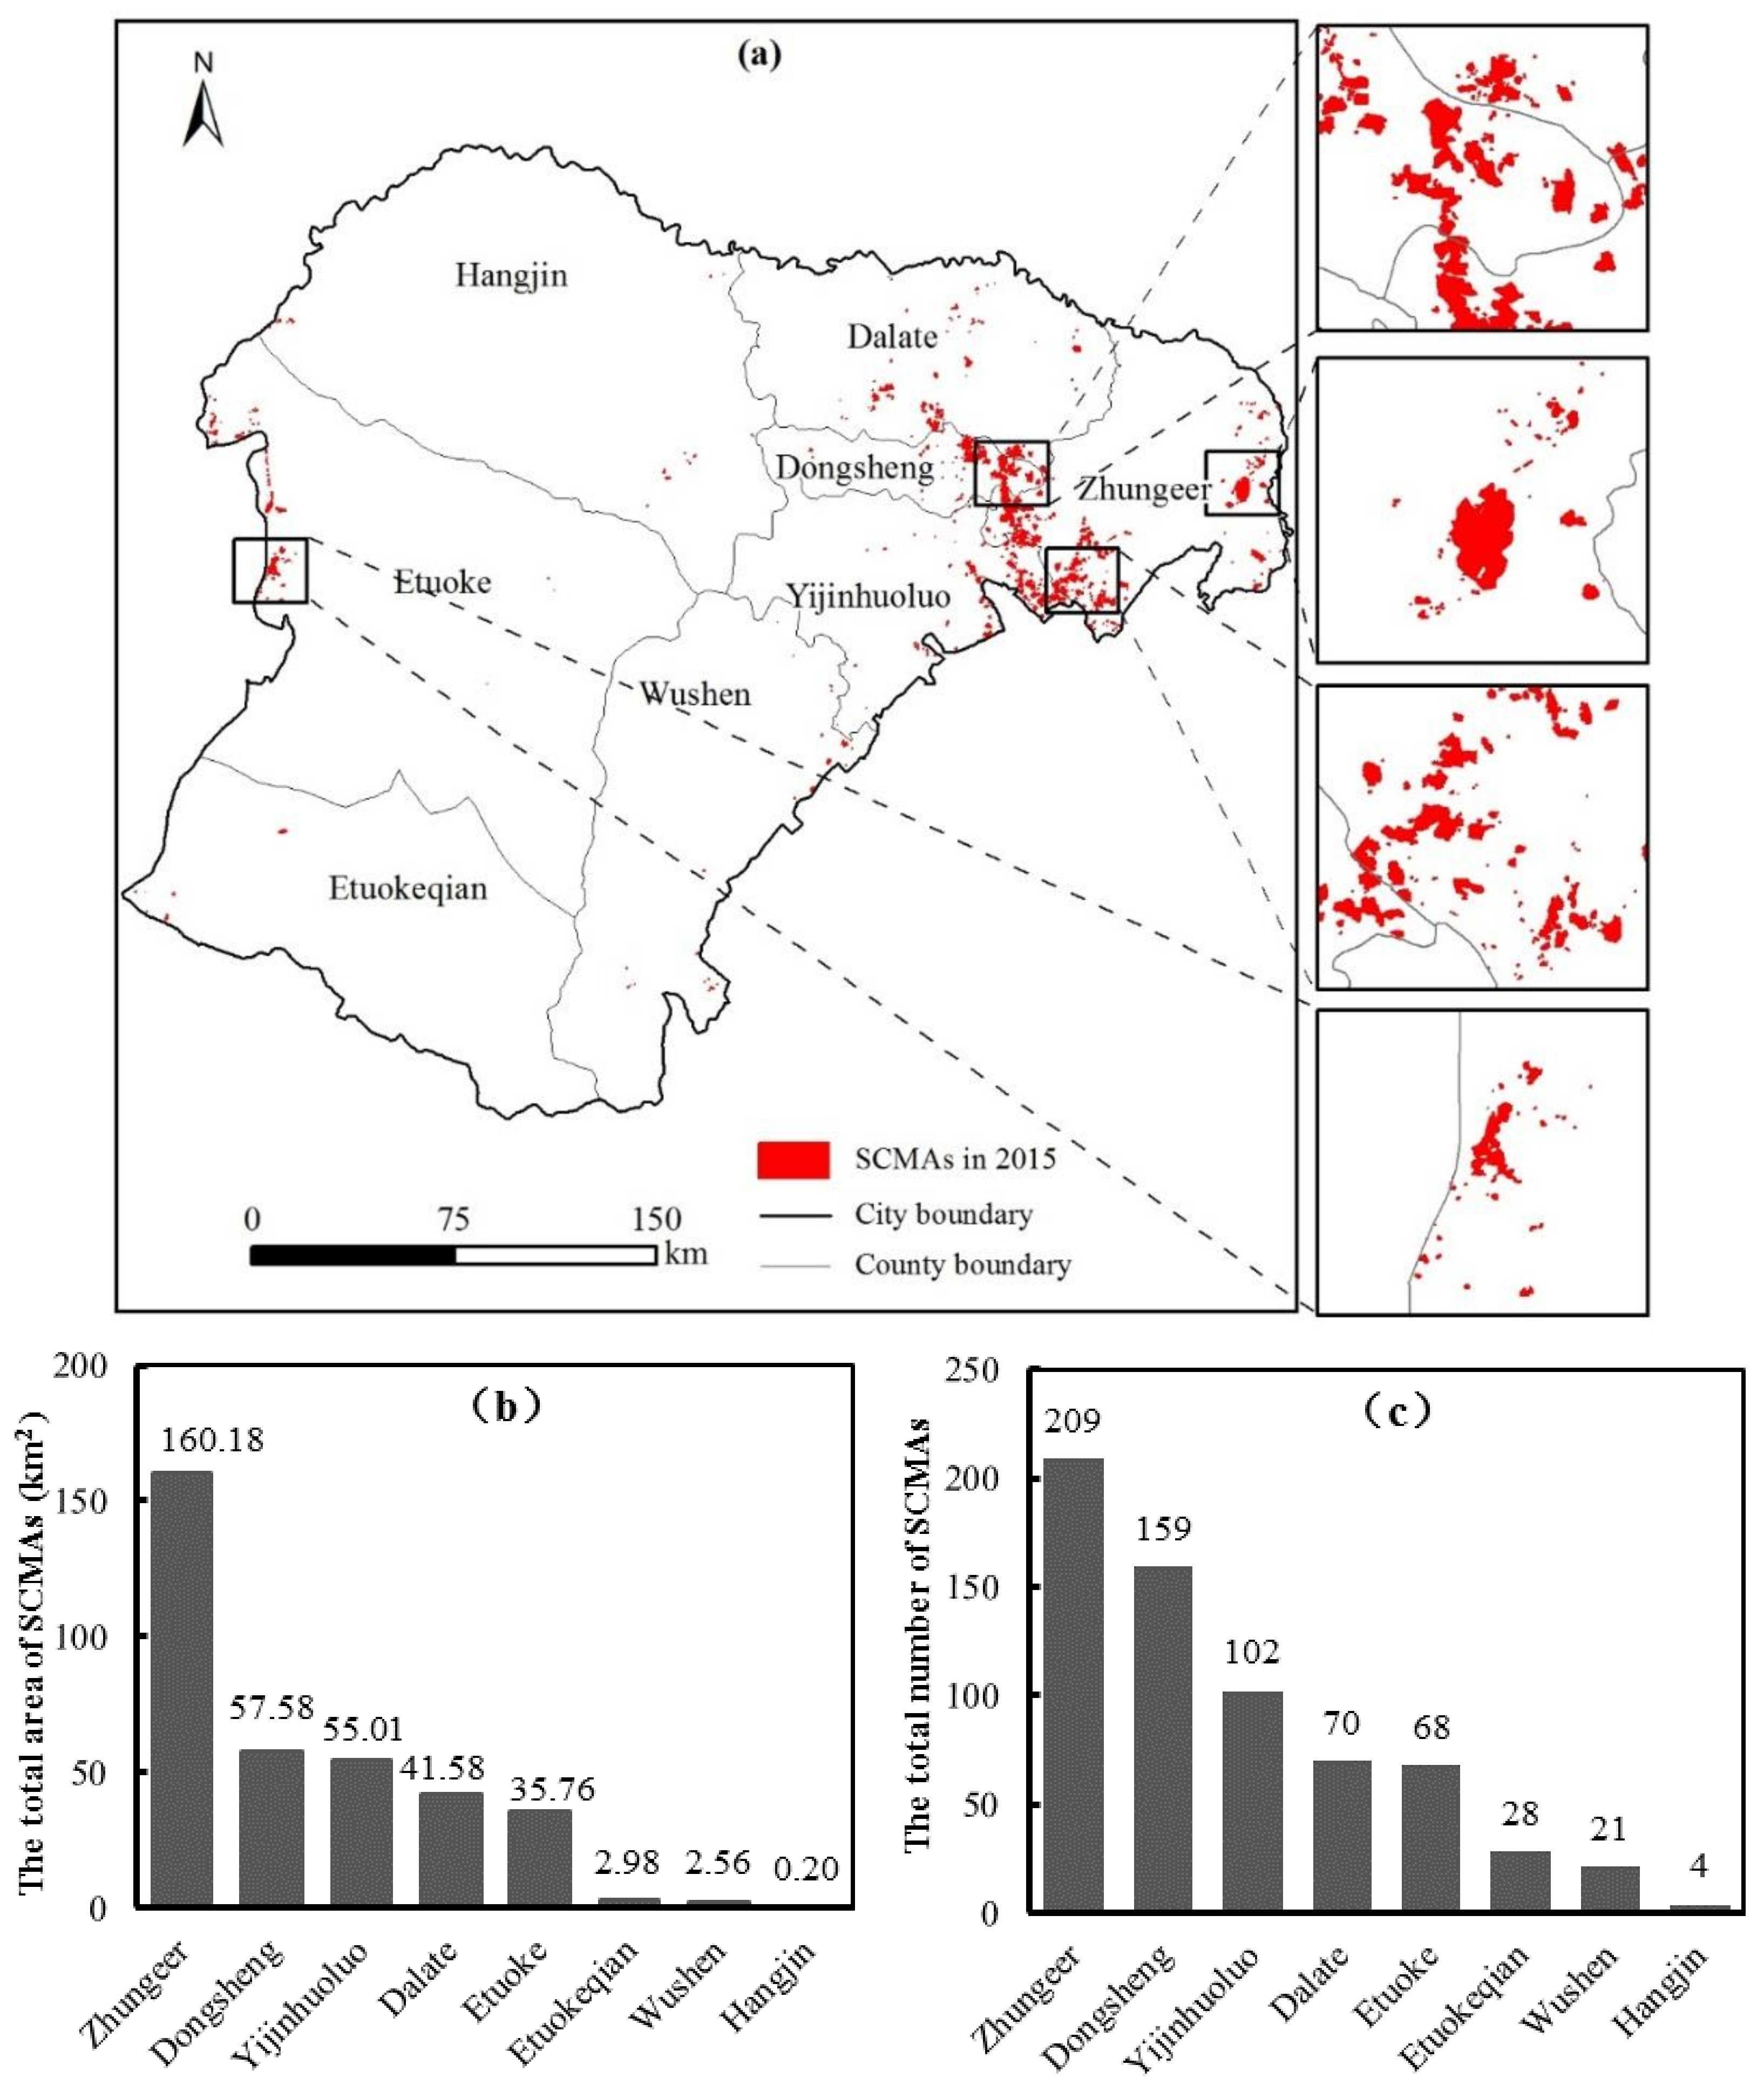
4.2. Spatial Patterns of SCMAs in the Ordos Region

There were 651 SCMAs with a total area of 355.95 km2, accounting for 0.41% of the total land area within the study area in 2015 (Figure 3). Most of the SCMAs were concentrated in the north-eastern part of Ordos. At the county level, the Zhungeer banner (an administrative division) had the largest area of SCMAs. The SCMAs in the Zhungeer banner had an area of 160.18 km2, accounting for 45.01% of the total area of SCMAs in the Ordos region. The Dongsheng district and the Yijinhuoluo banner had an area of SCMAs between 50 km2 and 100 km2. The areas of SCMAs in the Dongsheng district and the Yijinhuoluo banner were 57.58 km2 and 55.01 km2, respectively. The Dalate banner and the Etuoke banner had an area of SCMAs between 10 km2 and 50 km2, while the former had the SCMAs of 41.58 km2 and the latter had the SCMAs of 35.76 km2. The areas of SCMAs in the Hangjin banner, the Wushen banner, and the Etuokeqian banner were less than 10 km2, which were 0.20 km2, 2.56 km2, and 2.98 km2, respectively.

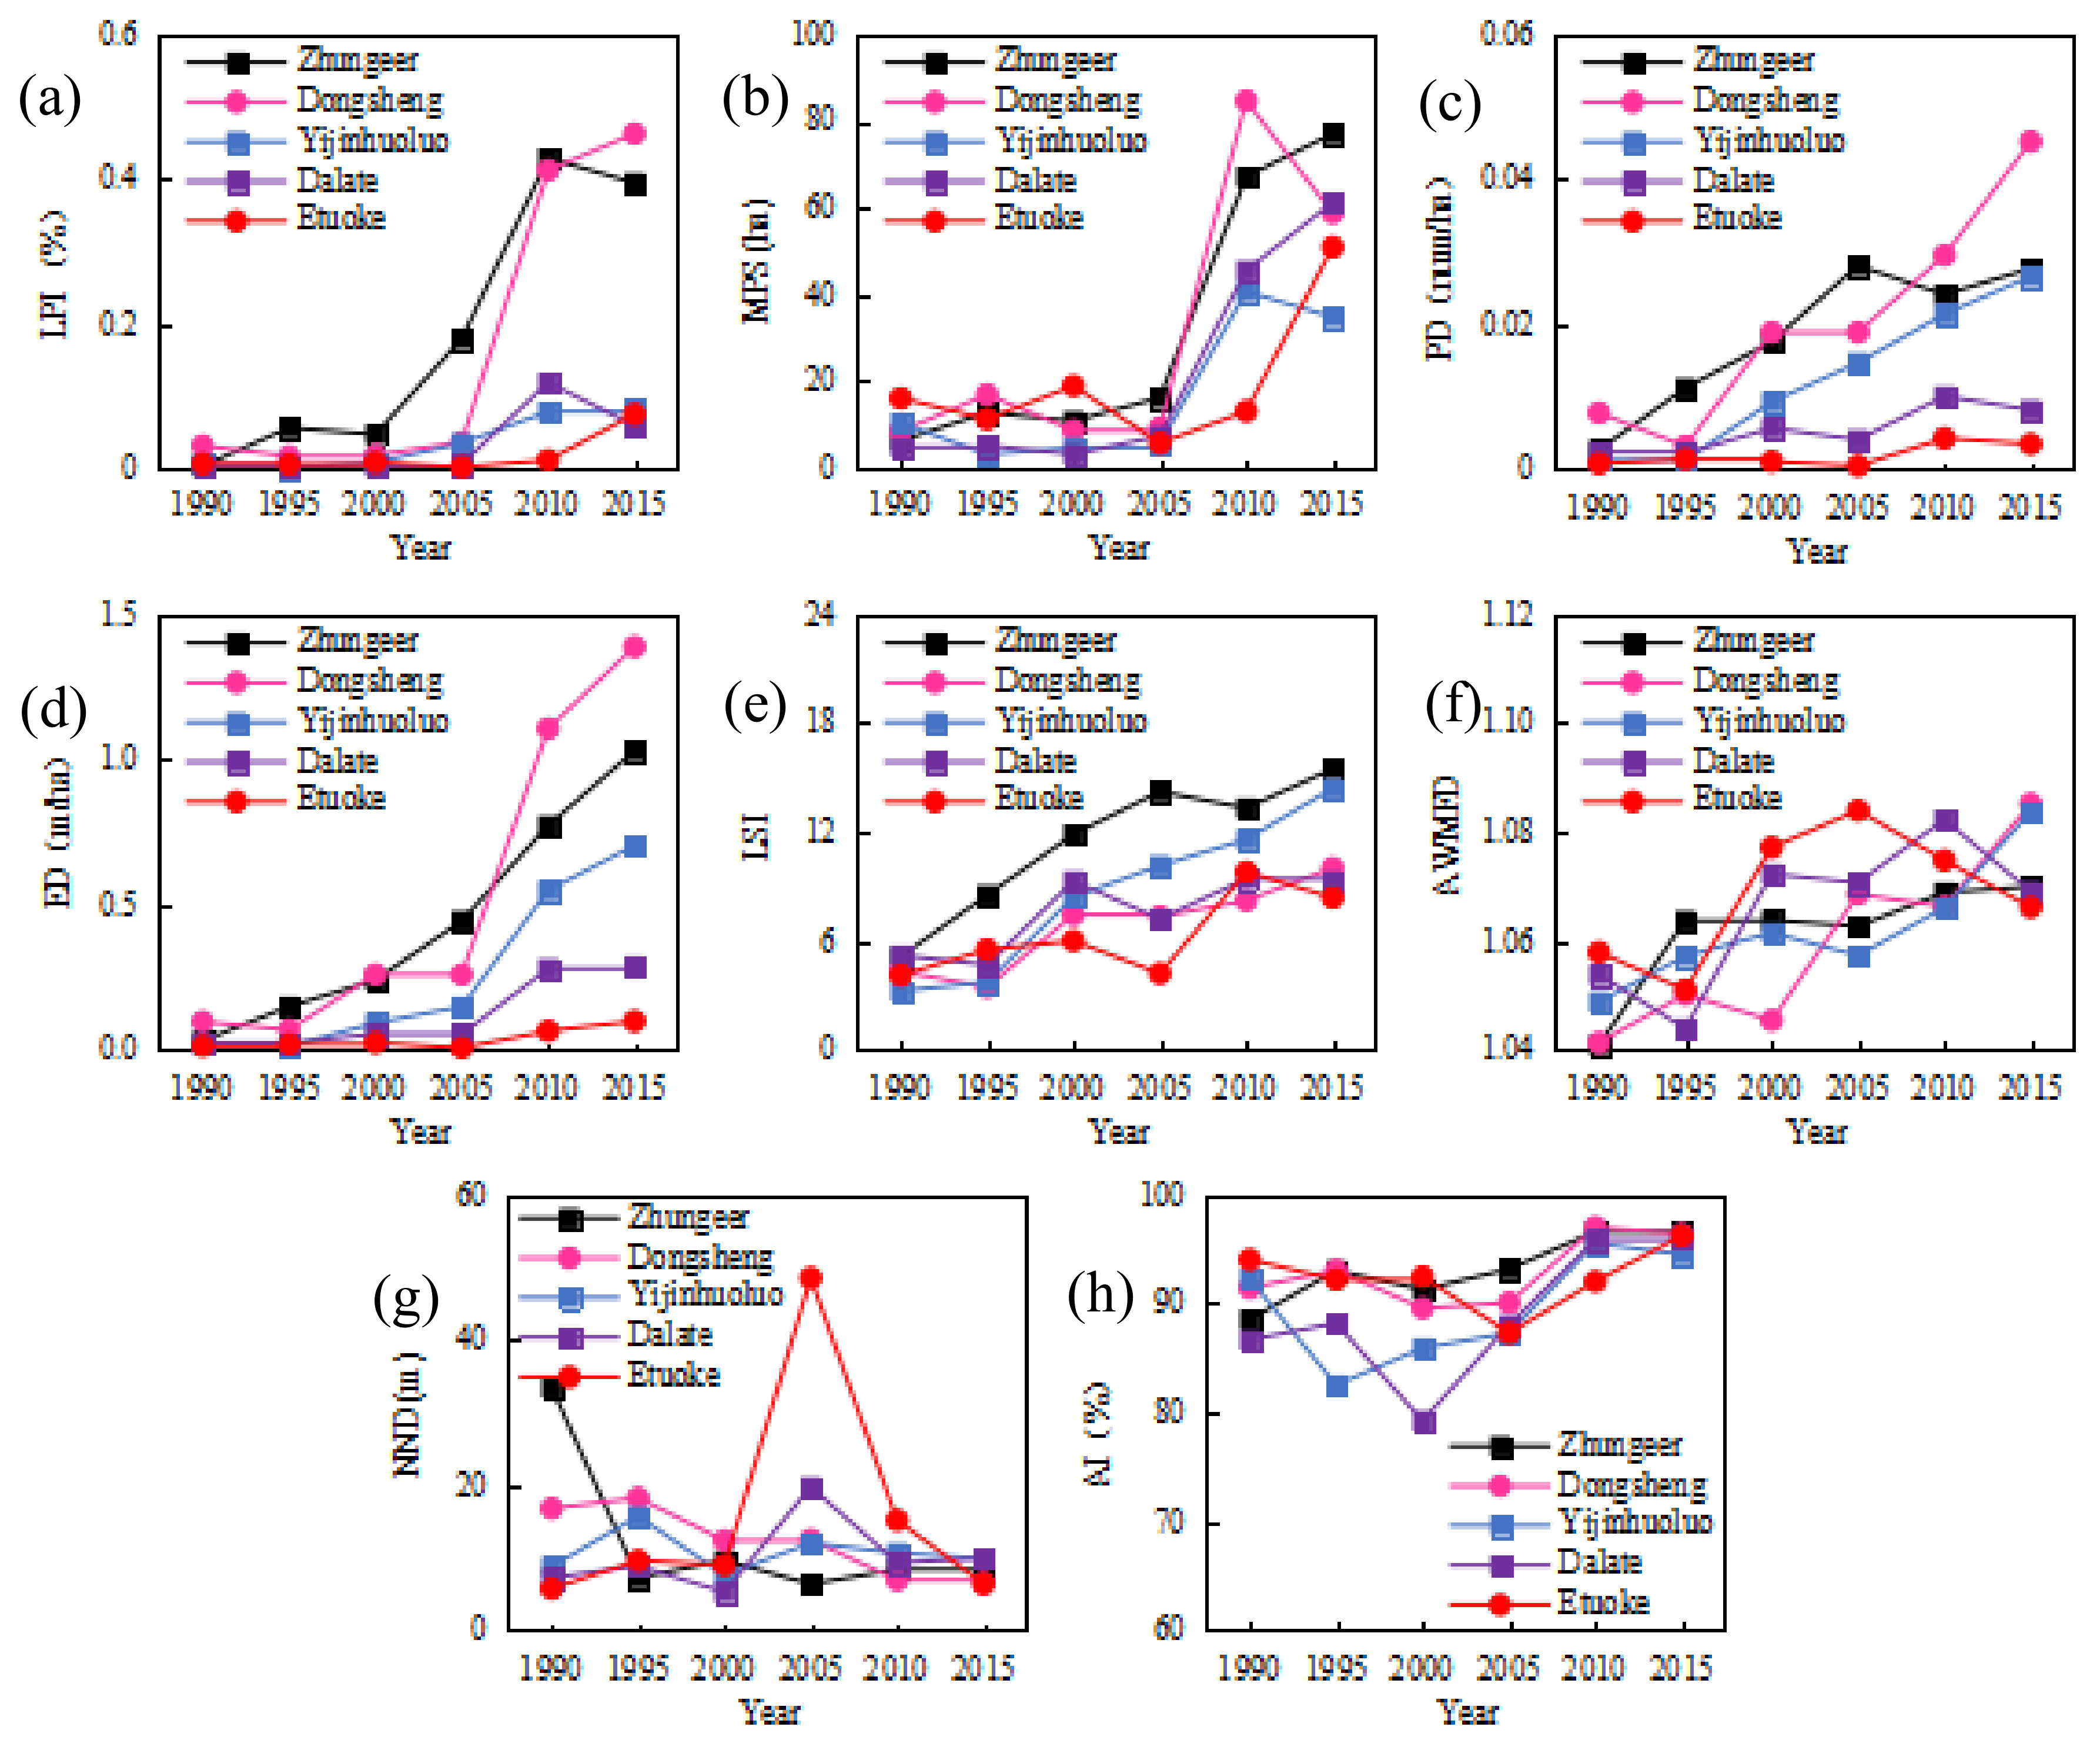
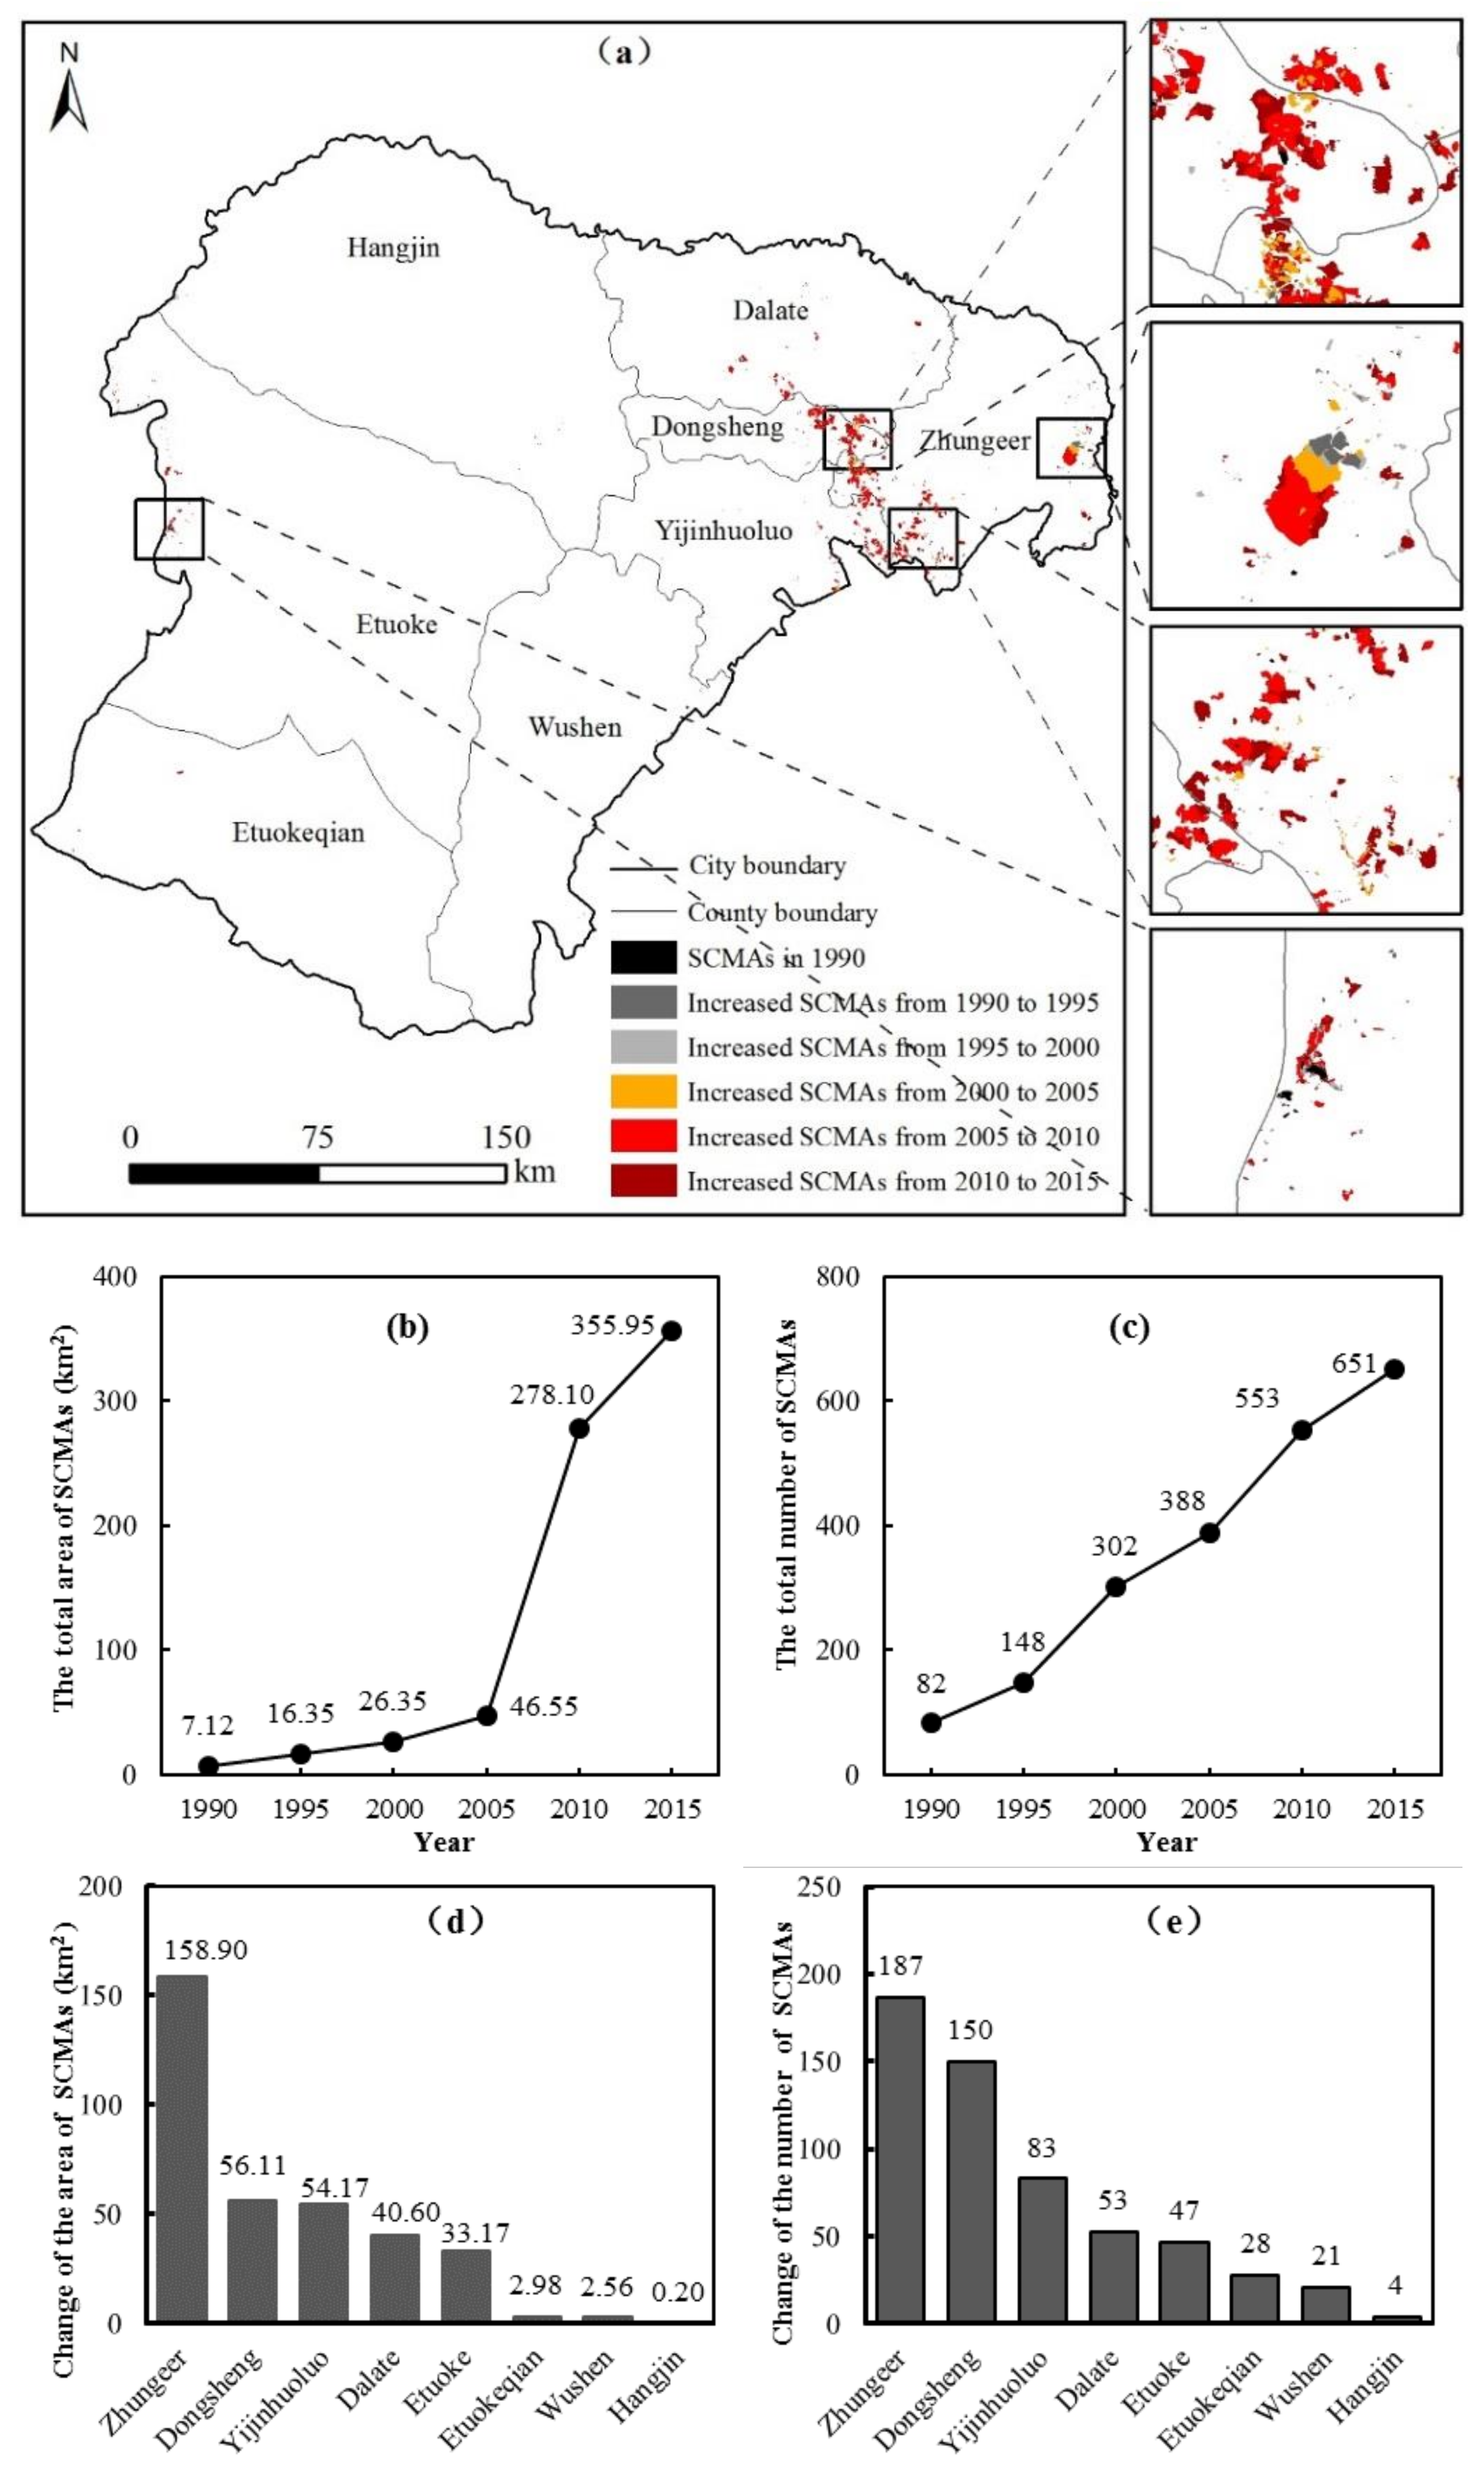
4.3. Dynamics of SCMAs in the Ordos Region from 1990 to 2015

The Ordos region experienced rapid increases in area, number and fragmentation of SCMAs from 1990 to 2015 (Figure 4a; Table 2). The area of SCMAs increased from 7.12 km2 to 355.95 km2, representing an increase of 49.01 times (Figure 4b). The number of SCMAs increased from 82 to 651, representing an increase of 6.94 times (Figure 4c). The LPI, MPS, PD, ED, LSI, AWMFD and AI of the SCMAs showed an increase of 0.12%, 0.5 ha, 0.02 Num/ha, 166.38 m/ha, 0.5, 0.02 and 7.6, respectively (Figure 5; Table 3), while the NND of the SCMAs decreased by 938.53 m.
Among the eight counties, the Zhungeer banner experienced the rapidest increase of SCMAs. The area of SCMAs in the Zhungeer banner increased by 158.90 km2 from 1990 to 2015, accounting for 45.55% of the total increased area of SCMAs in the study area (Figure 4d). The Dongsheng district and the Yijinhuoluo banner had an increased area of SCMAs between 50 km2 and 100 km2. In these two counties, the increased areas of SCMAs were 56.11 km2 and 54.17 km2, accounting for 16.08% and 15.53% of the total increased area of SCMAs in the Ordos region, respectively. The Dalate banner and the Etuoke banner had an increased area of SCMAs between 10 km2 and 50 km2. The increased area of SCMAs in the Dalate banner was 40.60 km2 and accounted for 11.64% of the total increased area of SCMAs in the Ordos region. The increased area of SCMAs in the Etuoke banner was 33.17 km2 and accounted for 9.51% of the total increased area of SCMAs in the study area. The Hangjin banner, the Wushen banner and the Etuokeqian banner had increased areas of SCMAs of less than 10 km2. The increased areas of SCMAs in the three counties were 0.20 km2, 2.56 km2 and 2.98 km2, respectively, while the total increased area of SCMAs in the three counties only accounted for 1.65% of the total increased area of SCMAs in the Ordos region.
The Dongsheng district experienced the most obvious fragmentation of SCMAs, with the largest increases of LPI, PD, ED, LSI and AWMFD from 1990 to 2015 (Figure 5; Table 3). Specifically, in the Dongsheng district, the LPI increased from 0.03% to 0.46% with growth of 14.33 times; the PD increased from 0.008 Num/ha to 0.045 Num/ha with growth of 4.63 times; the ED increased from 0.10 m/ha to 1.40 m/ha with growth of 13 times; the LSI increased from 1.28 to 1.95 with growth of 52.34%; while the AWMFD increased from 1.05 to 1.08 with growth of 2.86%. The Zhungeer banner had the largest variations of MPS and NND. In this area, the MPS increased from 6.36 ha to 77.07 ha with growth of 11.12 times, while the NND decreased from 3348.43 m to 815.19 m, representing a decline of 75.65%. The Dalate banner had the largest growth in AI, which increased from 86.57 to 96.08 with growth of 10.99%.

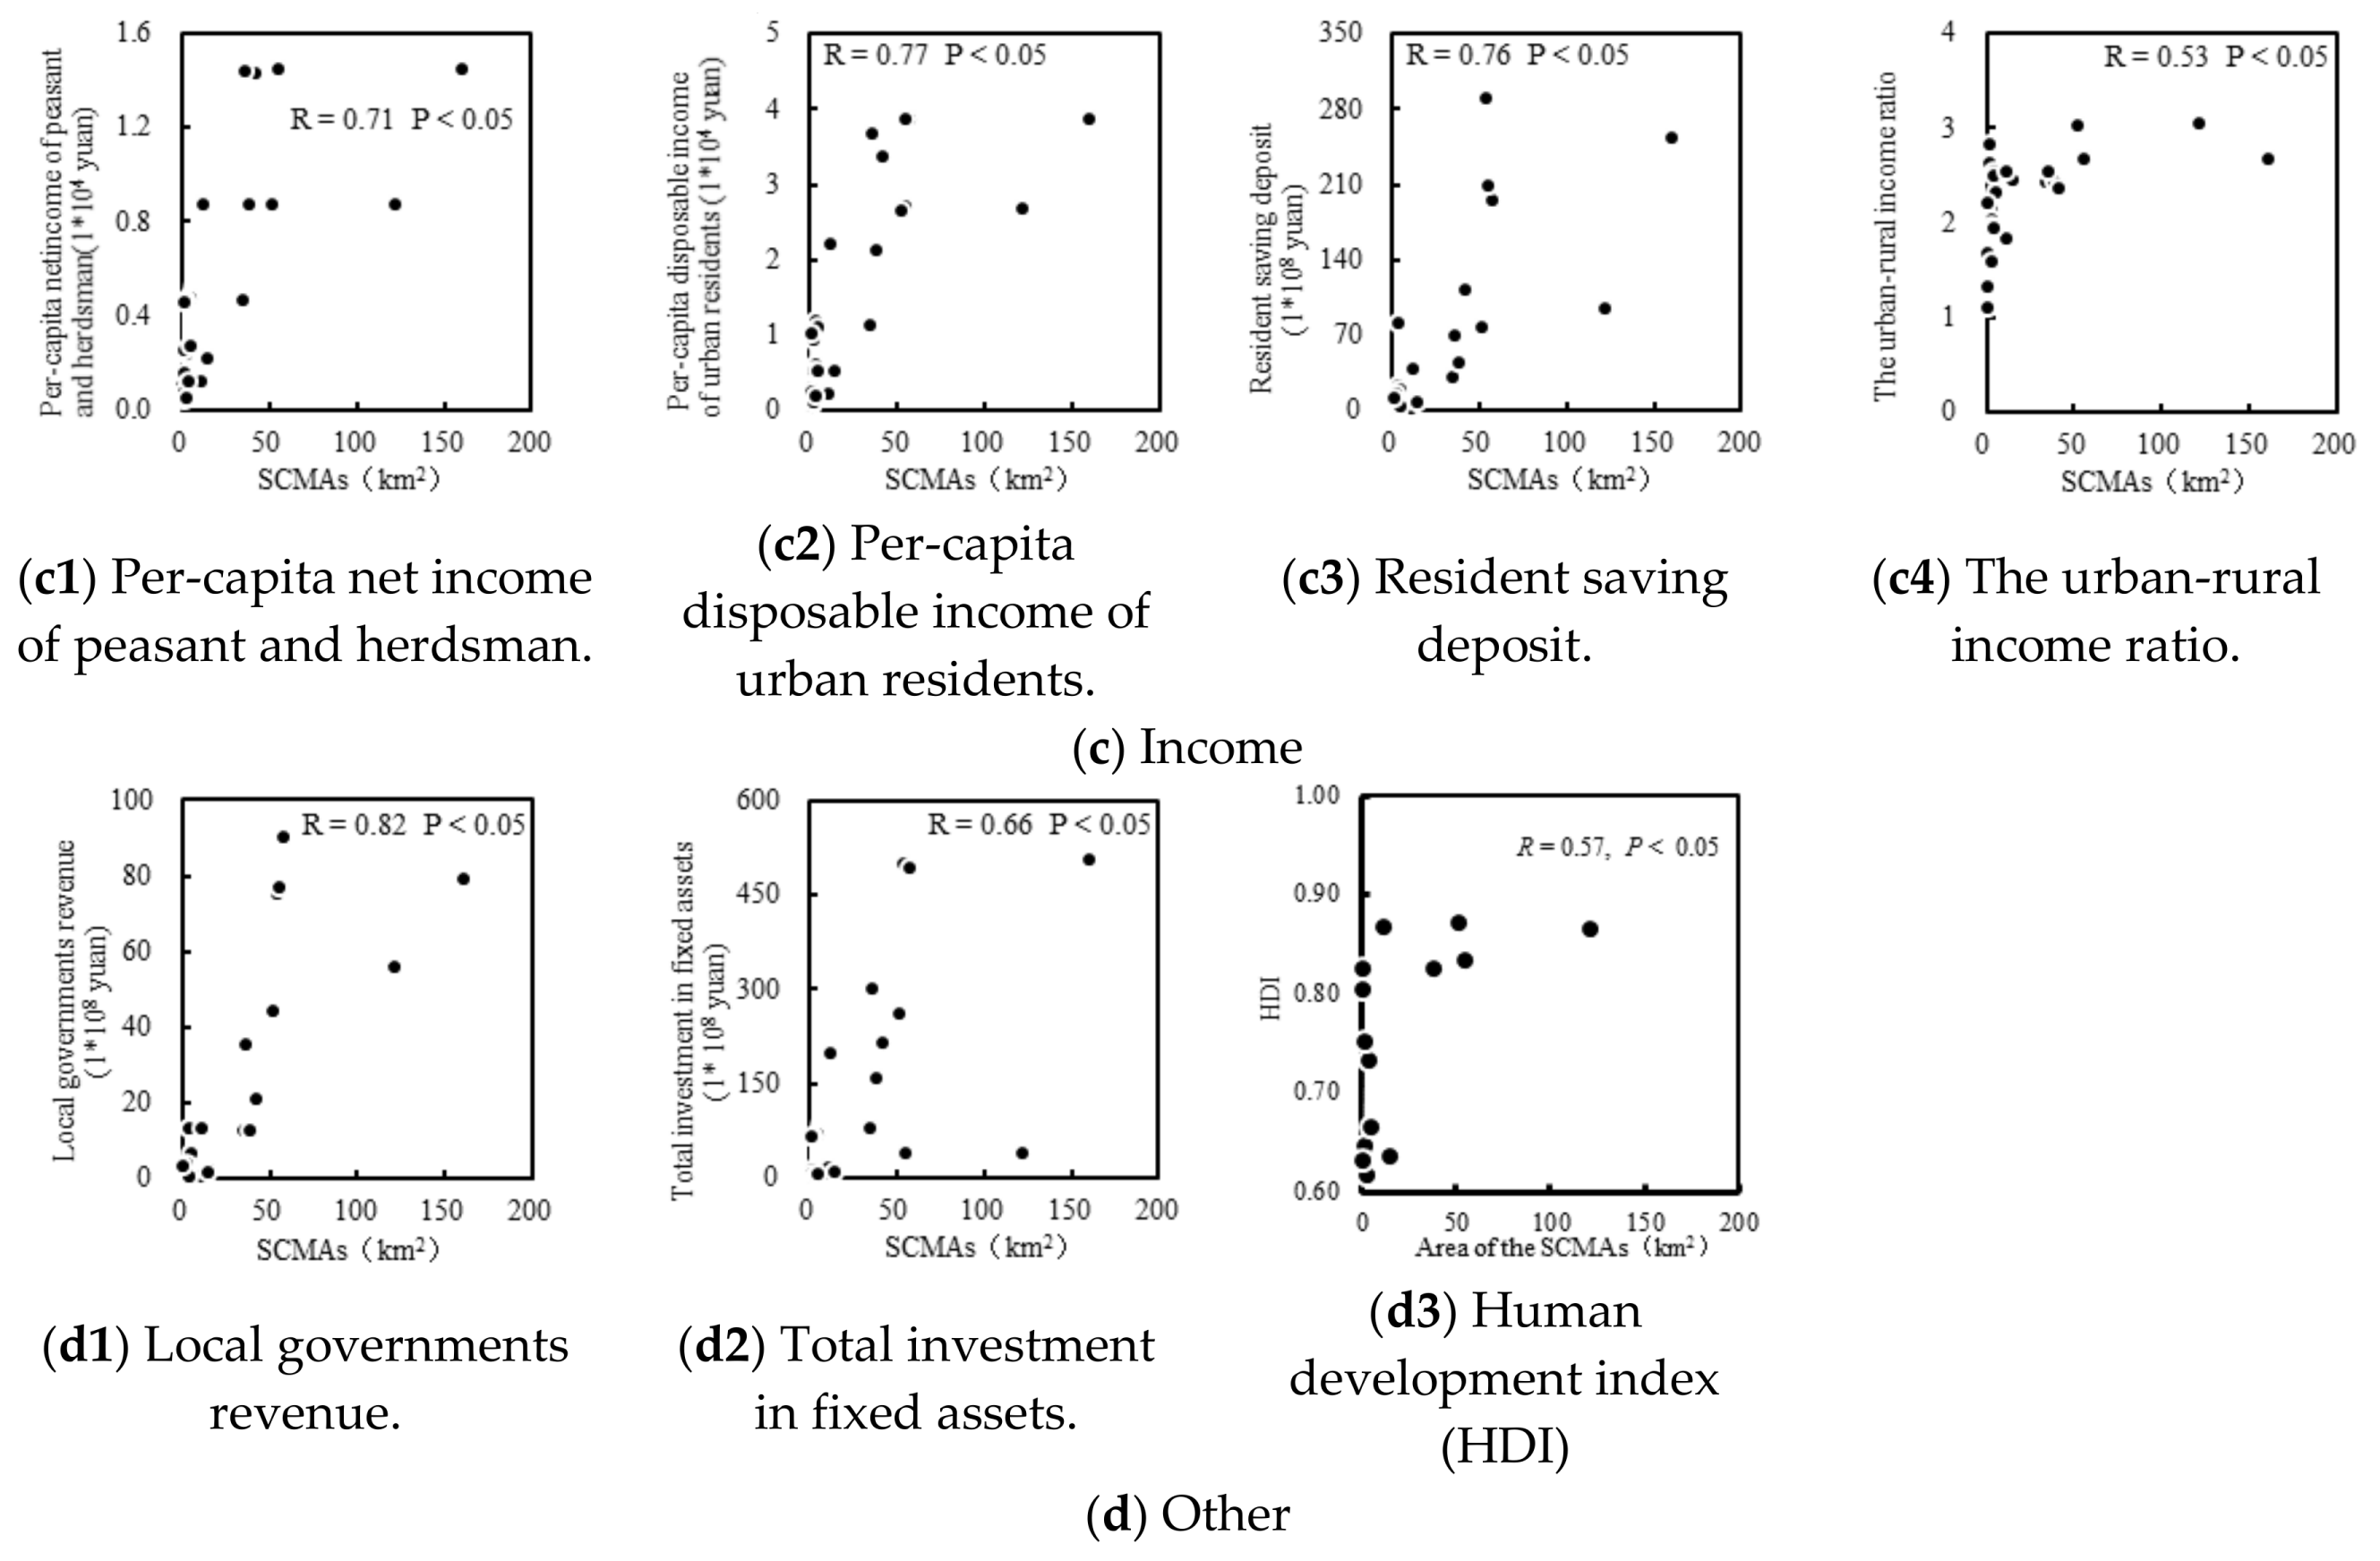
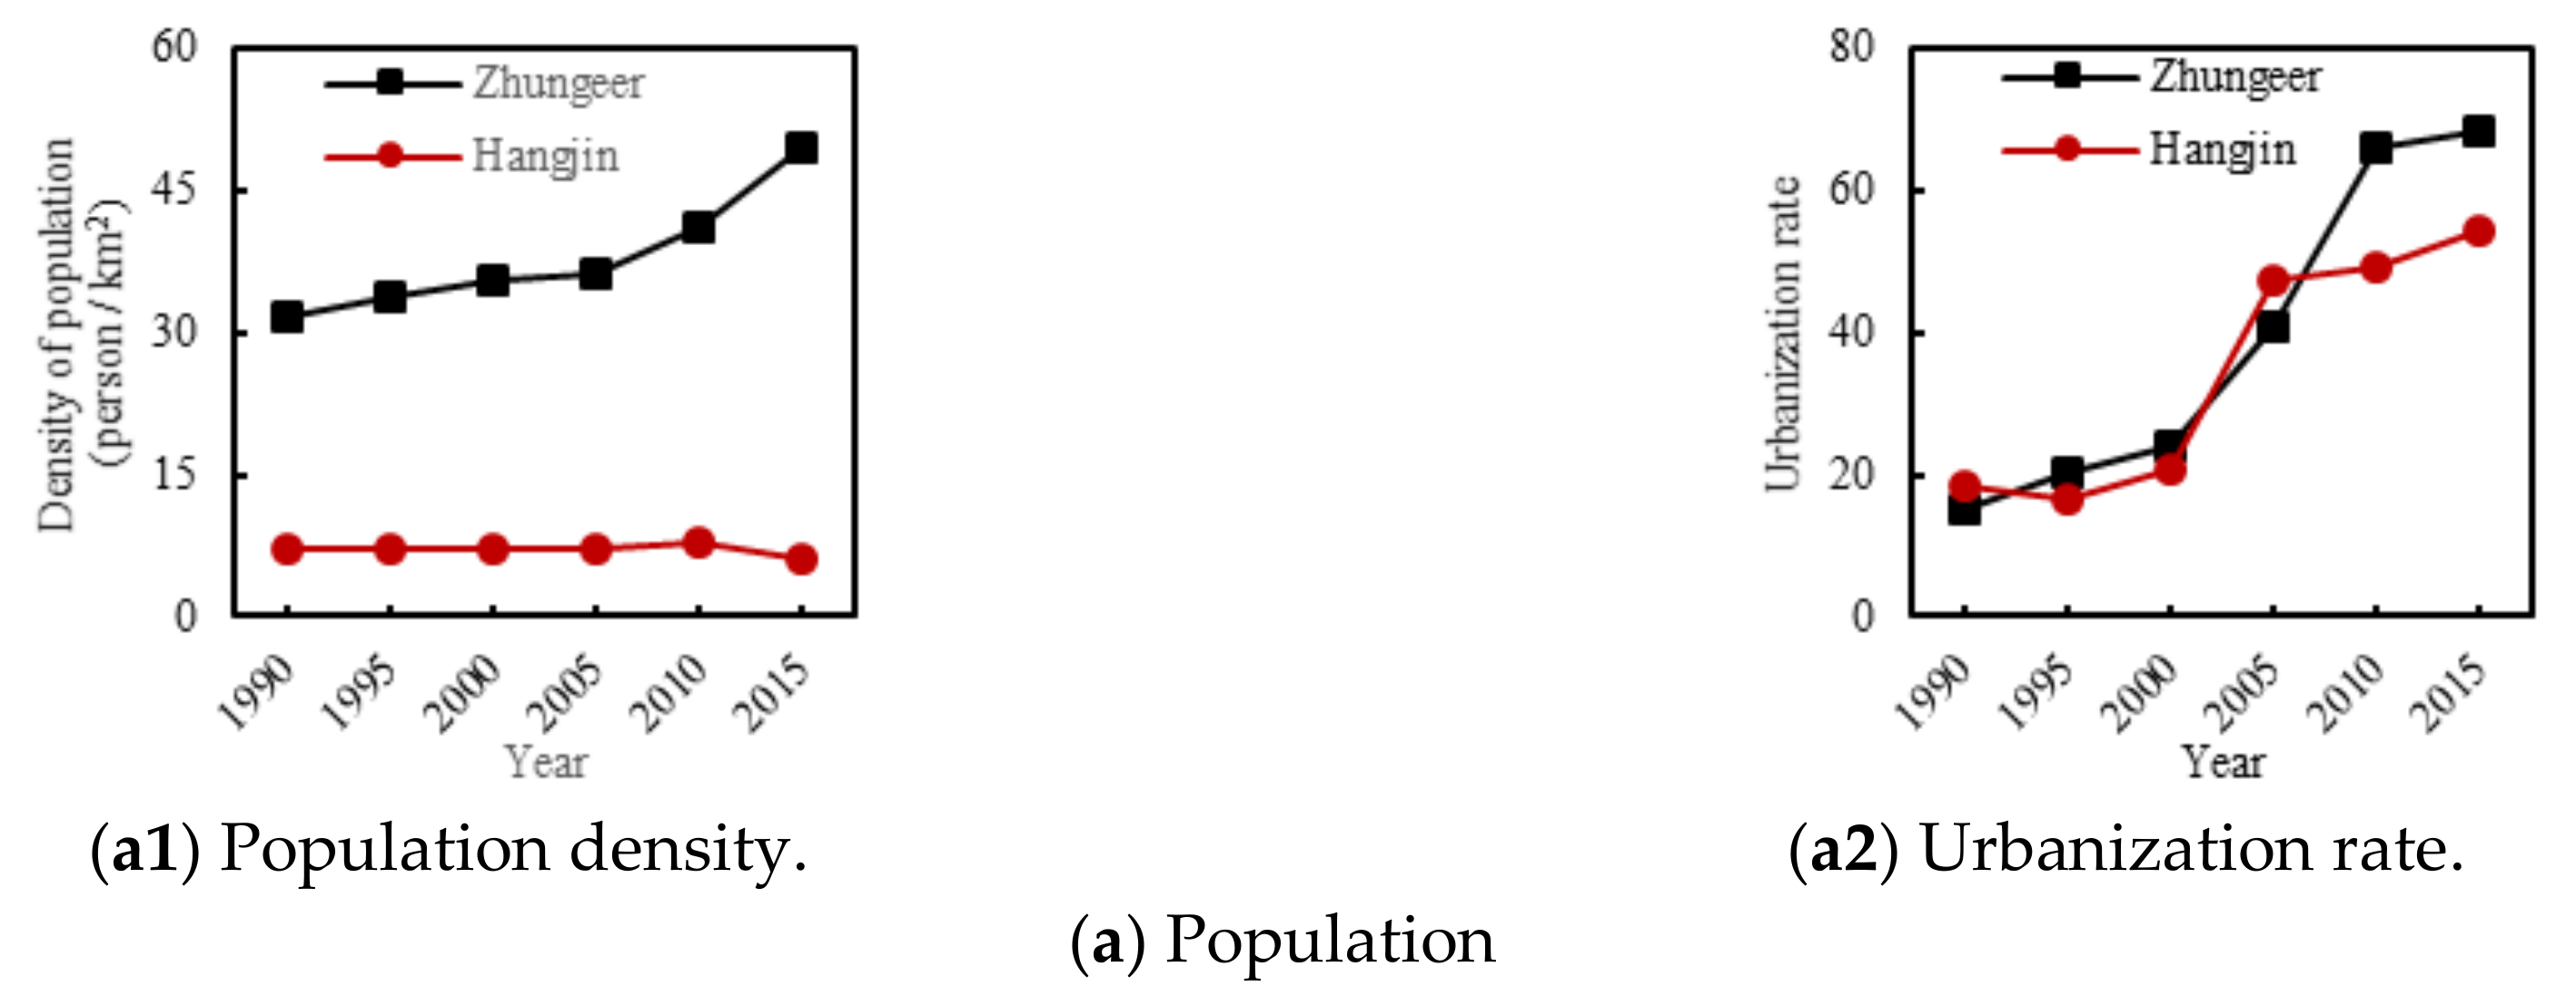
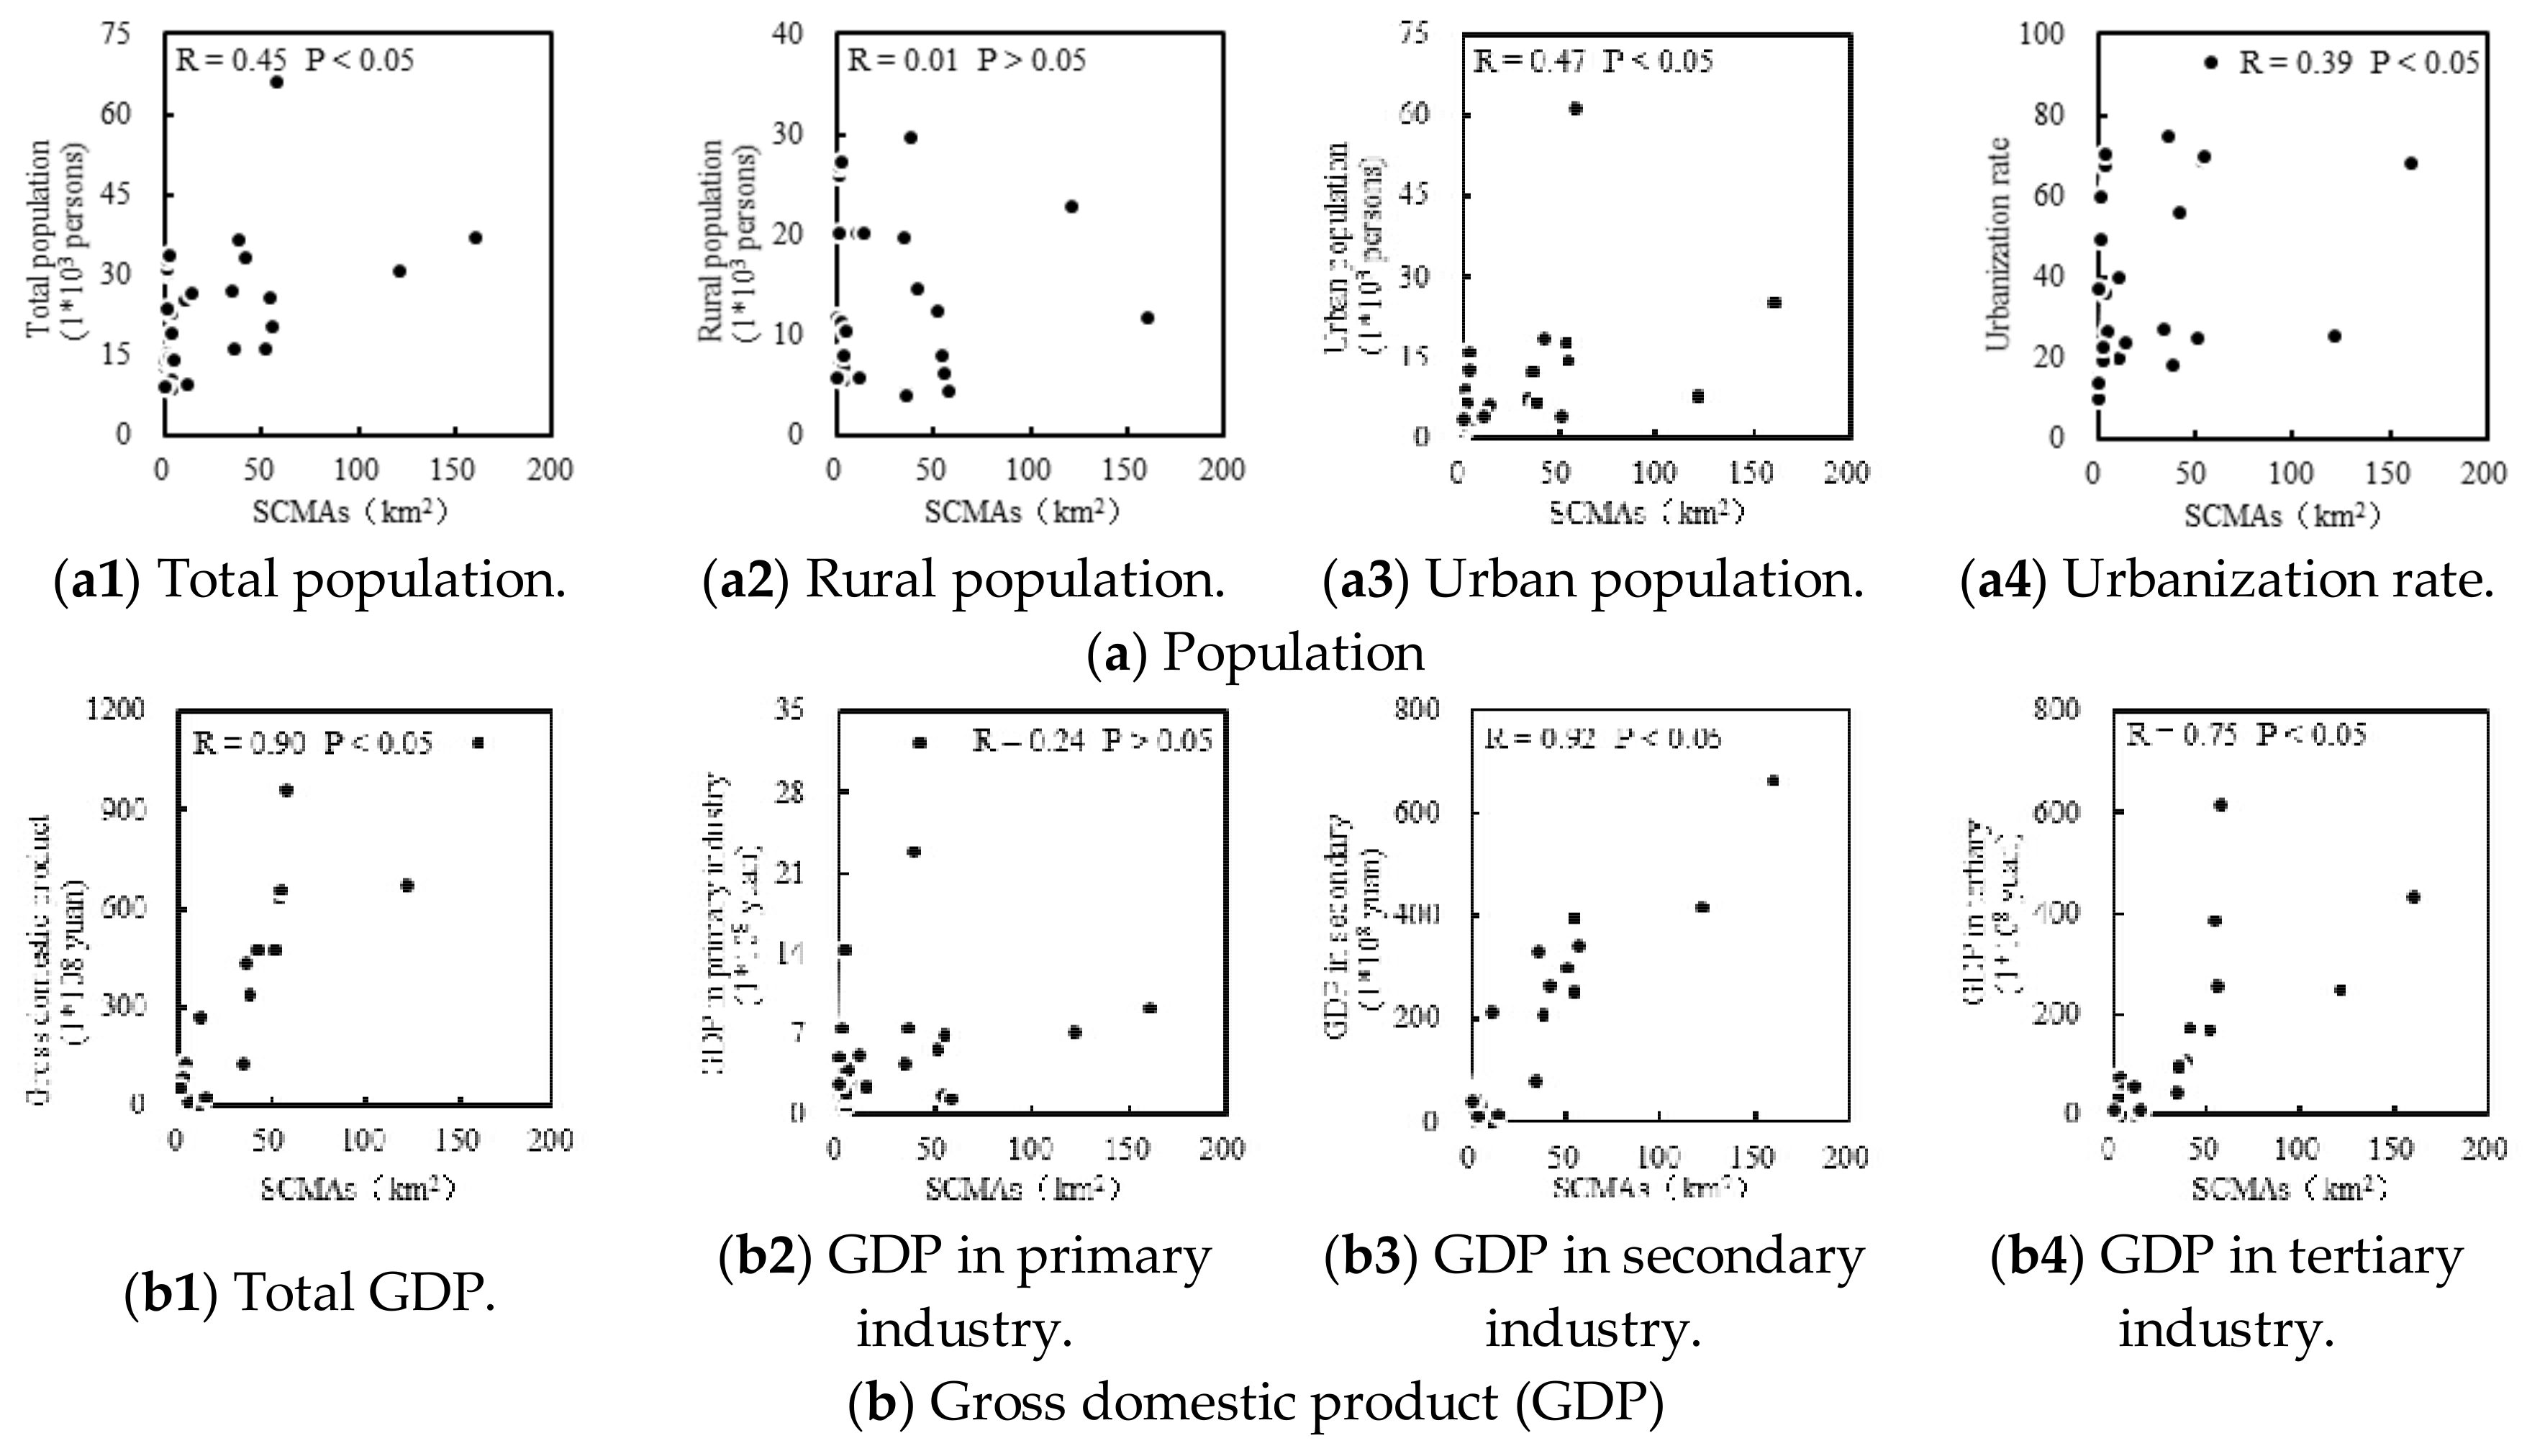
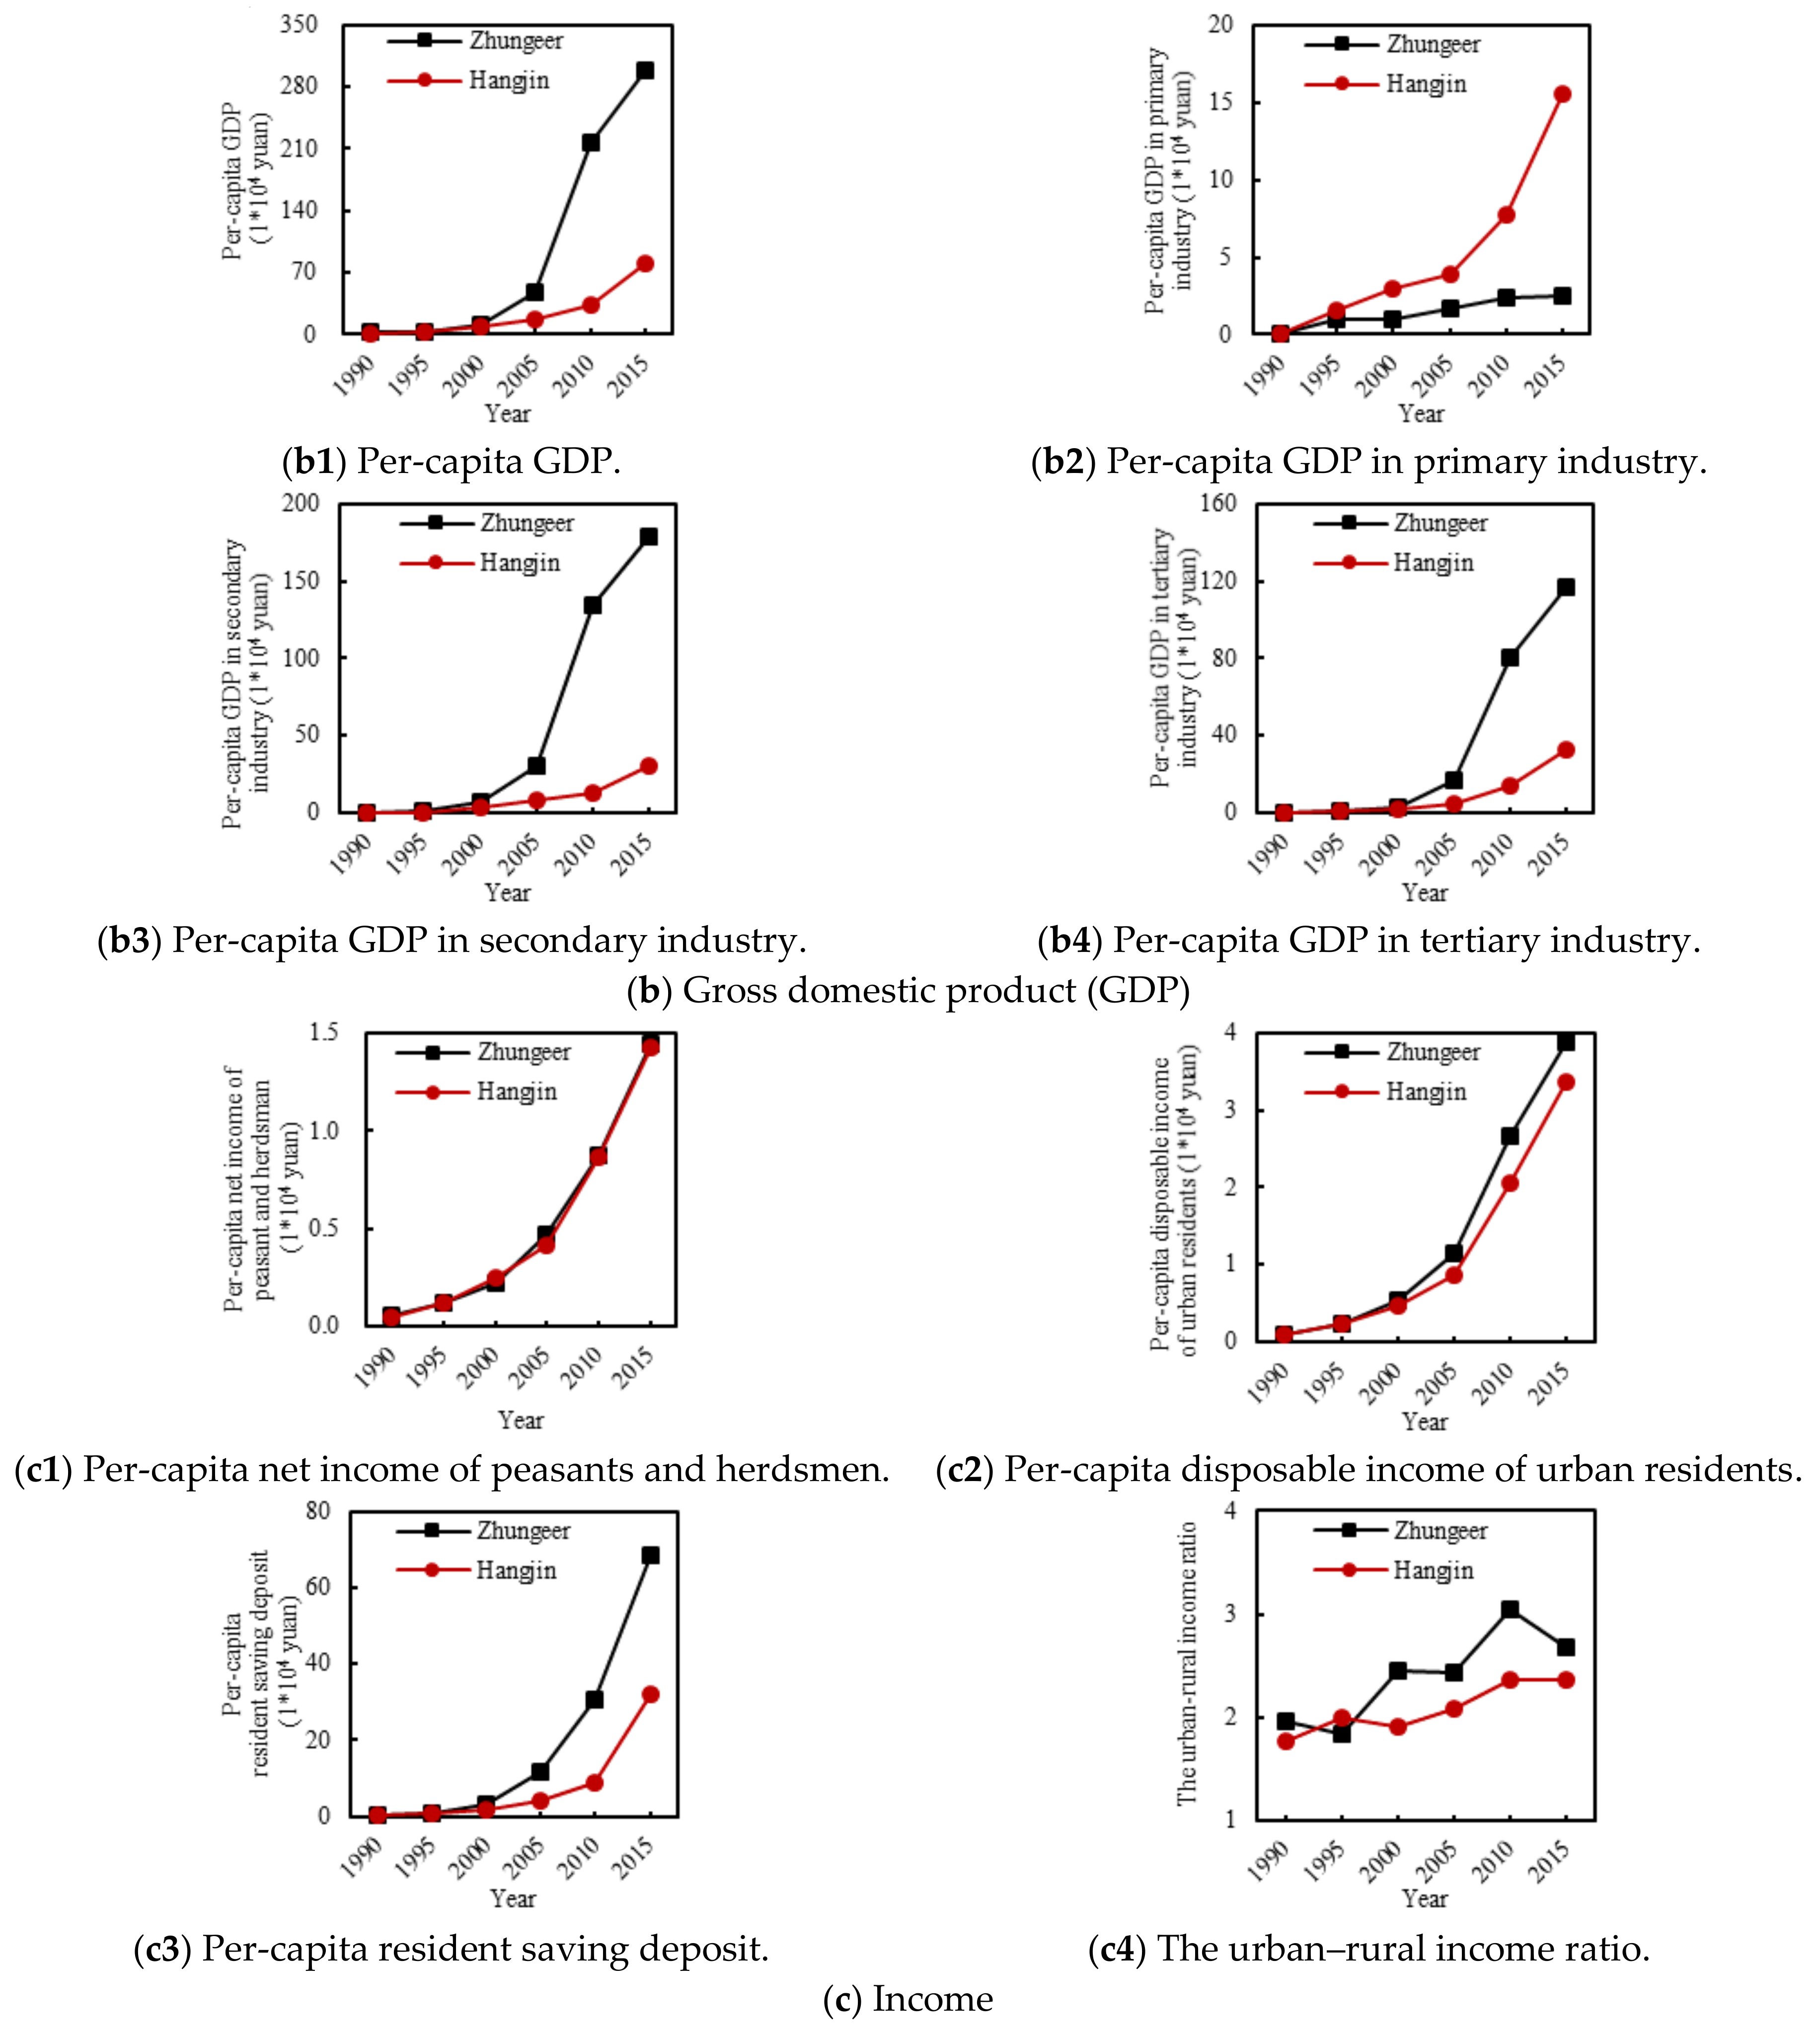
4.4. Socioeconomic Impacts of Surface Coal Mining

We found that the area of SCMAs had strong correlations with socioeconomic factors (e.g., population, GDP, and household income) between 1990 and 2015 at the county level in the Ordos region. The area of SCMAs had positive correlations (R > 0.40) with total population and urban population at the significance level of 0.05 (Figure 6). It also had positive correlations (R > 0.70) with GDP, the GDP in secondary industry, and the GDP in tertiary industry at the significance level of 0.001, and had positive correlations (R > 0.40) with the per-capita net income of peasant and herdsman, the per capita disposable income of urban residents, and the human development index (HDI) at a significance level of 0.05. In addition, we also found that the area of SCMAs and the urban–rural income ratio were positively correlated (R = 0.49) at the significance level of 0.05.
These correlations suggest that the GDP, the revenue of local governments, and the income of rural and urban residents all increased along with the growth in SCMAs, and thus surface coal mining promoted the socioeconomic development of the Ordos region. Between 1990 and 2015, the per capita disposable income of urban residents increased from 1032 yuan to 37,432 yuan, representing growth of 35.27 times. The per-capita net income of peasants and herdsmen increased from 600 yuan to 37,432 yuan with growth of 24.03 times. In the period of 1990–2015, the urban–rural income ratio increased from 1.72 to 2.60, an increase of 51.16%.
In addition, we compared the dynamics of socioeconomic indicators between the Zhungeer banner, with a widespread increase of SCMAs, and the Hangjin banner, almost without an increase of SCMAs (Figure 7). We found that the population density, urbanization rate, per-capita GDP, income of urban residents and the urban–rural income ratio showed much higher growth rates in the Zhungeer banner. In contrast, the income of peasants and herdsmen had a similar trend in these two banners.

4.5. Loss of Natural Habitat Due to Surface Coal Mining

Surface coal mining has had a number of negative influences on the environment in the Ordos region, including the removal of natural vegetation and the consumption and contamination of water. In this study, however, we focused primarily on the loss of natural habitats because of the lack of reliable data on water use and pollution directly associated with coal mining in the region. The SCMAs caused natural habitat loss (Figure 8), negatively affecting the biodiversity of this region. The total area of natural grasslands occupied by SCMAs was 247.45 km2, accounting for 72.70% of the total increased area of SCMAs. The desert and forest occupied by SCMAs were 21.52 km2 and 19.13 km2, and accounted for 6.32% and 5.62% of the total increased area of SCMAs, respectively.
Such losses of natural habitats would further influence threatened species in the Ordos region. According to the International Union for Conservation of Nature (IUCN) red list of threatened species [28], there are 15 threatened species in the Ordos region and all of them show decreasing population trends (Table 4). Among these species, 14 species experienced habitat loss due to the increased SCMAs, which included one critically endangered species, two endangered species, and 11 vulnerable species (Table 4). Although the declining biodiversity in the region has been caused by myriad anthropogenic factors, surface coal mining has certainly exacerbated the situation.

5. Discussion

Our study represents an assessment of the scope and speed of surface coal mining in the Ordos region, with a critical examination on its socioeconomic and environmental impacts. Our results corroborate some of the findings from previous studies. For example, Dong et al. [29] found that coal mining accelerated the process of urbanization in the Ordos region. Liu et al. [30] found that rapid economic development in the Ordos region mainly depended on coal mining. Liu et al. [16] found that the development of coal mining promoted the economy of this region, but the per-capita net income of peasants and herdsmen was not improved accordingly. Increases of the urban–rural income gap would influence the human well-being of rural people and cause social injustice [31,32,33]. Our study further showed that the urban–rural income gap continued to expand with the growth of SCMAs, which undermines social equity and stability in the Ordos region.
The economic growth in the Ordos region clearly took place primarily at the expense of its environment. Our study has shown that surface coal mining resulted in a great loss of natural ecosystems in this dryland region. Beyond habitat loss, previous studies also reported that increased SCMAs had caused a series of environmental issues such as land degradation, desertification, and air/water/soil pollution in the Ordos region. For example, Luo et al. [11] found that the increase of SCMAs was the key factor of land degradation in the northern part of the Ordos region. Zheng et al. [34] found that the annual change of underground water level from 2005 to 2014 was mainly influenced by coal exploitation in this region. Li et al. [35] found that the increases of SCMAs resulted in the decline of ecological carrying capacity and the growth in ecological footprint, aggravating the ecological deficit in this region. Specifically, the ecological footprint increased from 3.92 km2 in 2000 to 42.61 km2 in 2013, an increase of 9.87 times, while the ecological deficit increased from 0.43 km2 in 2000 to 38.94 km2 in 2013, representing an increase of 89.56 times in the Ordos region.
Furthermore, the effects of SCMAs on the environment may be further exacerbated. In 2016, the government of Ordos city issued the “plan for improving comprehensive competitiveness of the coal industry in Ordos city between 2016 and 2018” [36]. According to this plan, 14 new mining areas—Wanli, Zhungeer, Shengdong, Gaotouyao, Tarangaole, Xinjie, Hujieerte, Shanghaimiao, Nalinhe, the middle region of Zhungeer, Xinjietaigemiao, Nalinxili, Wulangeer, and Zhuozishan—will be constructed. Among these new mining areas, eight mining areas covering about 5000 km2 in total have been approved by the National Development and Reform Commission in China.
Thus, central and local governments have paid close attention to the environmental impacts of increasing SCMAs in the Ordos region. To promote the sustainable development of this region, the government of Ordos city issued a trial program in 2012 for developing harmonious, human-oriented, and environment-friendly mining areas. This trial program proposed to find effective approaches for environmental conservation and restoration within and around the SCMAs. According to our findings, we suggest that the timely and accurate assessments of the impacts of SCMAs on natural habitats are needed during the construction of SCMAs. In addition, effective governance should be established to improve environmental management and promote cleaner production in the Ordos region.
Our current study focused primarily on quantifying the spatiotemporal patterns of surface coal mining in the Ordos region and assessing some of their major socioeconomic and environmental impacts. More comprehensive and in-depth analyses of environmental and socioeconomic impacts of surface coal mining are needed. For example, the social effects on the education and training of the workforce, access to infrastructure, and subjective well-being should be analyzed. In the future, we will use ecosystem services models—e.g., the integrated valuation of ecosystem services and tradeoffs (InVEST) and service path attribution networks (SPANs)—to evaluate the impacts of the expansion of SCMAs on ecosystem services such as water retention, carbon sequestration, and water purification under the framework of landscape sustainability science [37]. In addition, we plan to analyze the relationships between the development of SCMAs and the human well-being of local people by combining field surveys and socioeconomic models.

6. Conclusions

Our study has shown that surface coal mining expanded extensively in space and rapidly in time across the Ordos region from 1990 to 2015. The area of SCMAs increased from 7.12 km2 to 355.95 km2, at an annual growth rate of 16.91%. The number of SCMAs increased from 82 to 651, at an annual growth rate of 8.40%. The area of SCMAs in the Zhungeer banner showed the largest increase of 158.90 km2, which accounted for 45.55% of the total increment of SCMAs in the Ordos region. Between 1990 and 2015, increasing surface coal mining caused a massive grassland loss of 247.45 km2, which accounted for 72.70% of the total increase in SCMAs. The urban–rural income ratio increased from 1.72 to 2.60, with an increase of 51.16%. Therefore, effective policies are urgently needed to curb surface coal mining to protect the natural environment and promote sustainable development in the region.

Acknowledgments

We would like to thank the anonymous reviewers for their valuable comments and suggestions. This work was supported in part by the National Basic Research Program of China (Grant Nos. 2014CB954303 and 2014CB954302) and the National Natural Science Foundation of China (Grant Nos. 41621061 and 41501195). It was also supported by Fundamental Research Funds for the Central Universities, the project from the State Key Laboratory of Earth Surface Processes and Resource Ecology, China, and the China Scholarship Council (File No. 201606040136).

Author Contributions

All authors contributed significantly to the research design, data analysis, and manuscript preparation.

Conflicts of Interest

The authors declare no conflict of interest.

Appendix A

Table A1. Specific information on the Landsat data used in this study.
Path/RowDate of Acquisition *
199019952000200520102015
July 1stJuly 8thJune 2ndJuly 5thJuly 9thJuly 15thJuly 2ndJuly 2ndJuly 3th
126/032
126/033
127/032
127/033
128/032
128/033
128/034
129/032
129/033
* The gray grids represent the date, path and row of the Landsat data used in this study.

References

  1. World Coal Institute. The Coal Resource—A Comprehensive Overview of Coal; World Coal Institute: London, UK, 2009. [Google Scholar]
  2. Statistics Bureau of Inner Mongolia Autonomous Region, Inner Mongolia Statistics 2015; China Statistics Press: Beijing, China, 2015.
  3. Meng, J.J.; Zhang, Y.R.; Zhou, P. Ecological Vulnerability Assessment of the Farming-Pastoral Transitional Zone in Northern China: A case study of Ordos City. J. Desert Res. 2010, 30, 850–856. [Google Scholar]
  4. Wu, J.; Zhang, Q.; Li, A.; Liang, C. Historical landscape dynamics of Inner Mongolia: Patterns, drivers, and impacts (Special Issue). Landsc. Ecol. 2015, 30, 1579–1598. [Google Scholar] [CrossRef]
  5. Shang, Y.Z.; Lu, S.B.; Li, X.F.; Hei, P.F.; Lei, X.H.; Gong, J.G.; Liu, J.H.; Zhai, J.Q.; Wang, H. Balancing development of major coal bases with available water resources in China through 2020. Appl. Energy 2017, 194, 735–750. [Google Scholar] [CrossRef]
  6. Li, N.; Yan, C.Z.; Xie, J.L. Remote sensing monitoring recent rapid increase of coal mining activity of an important energy base in northern China, a case study of Mu Us Sandy Land. Res. Conserv. Recycl. 2015, 94, 129–135. [Google Scholar] [CrossRef]
  7. Tao, S.; Fang, J.; Zhao, X.; Zhao, S.; Shen, H.; Hu, H.; Tang, Z.; Wang, Z.; Guo, Q. Rapid loss of lakes on the Mongolian Plateau. Proc. Natl. Acad. Sci. USA 2015, 112, 2281–2286. [Google Scholar] [CrossRef] [PubMed]
  8. Kang, S.L.; Niu, J.M.; Zhang, Q.; Han, Y.J.; Dong, J.J.; Zhang, J. Impacts of mining on landscape pattern and primary productivity in the grassland of Inner Mongolia: A case study of Heidaigou open pit coal mining. Acta Ecol. Sin. 2014, 34, 2855–2867. [Google Scholar]
  9. Zeng, X.; Liu, Z.; He, C.; Ma, Q.; Wu, J. Detecting surface coal mining areas from remote sensing imagery: An approach based on object-oriented decision trees. J. Appl. Remote Sens. 2017, 11. [Google Scholar] [CrossRef]
  10. Mao, X.Y.; Meng, J.J.; Xiang, Y.Y. Cellular automata-based model for developing land use ecological security patterns in semi-arid areas: A case study of Ordos, Inner Mongolia, China. Environ. Earth Sci. 2013, 70, 269–279. [Google Scholar] [CrossRef]
  11. Luo, J.; Duan-Yang, X.U.; Ren, H.Y. The Desertification Dynamics in Ordos from 2000 to 2010 and Their Relationship with Climate Change and Human Activities. J. Glaciol. Geocryol. 2013, 35, 48–56. [Google Scholar]
  12. Statistics Bureau of Inner Mongolia Autonomous Region, Inner Mongolia Statistics 1991; China Statistics Press: Beijing, China, 1991.
  13. Statistics Bureau of Inner Mongolia Autonomous Region, Inner Mongolia Statistics 2016; China Statistics Press: Beijing, China, 2016.
  14. Yu-Lin, L.U.; Lin, Y.; Ji-Ning, Y.I.; Guo, J.; Wang, H.; Yang, J. The present situation and the suggestion for exploration and development of mineral resources in Ordos Basin. China Min. Mag. 2015, 10, 15–21. [Google Scholar]
  15. Zhang, Z.; Wang, X.; Zhao, X.; Liu, B.; Yi, L.; Zuo, L.; Wen, Q.; Liu, F.; Xu, J.; Hu, S. A 2010 update of National Land Use/Cover Database of China at 1:100,000 scale using medium spatial resolution satellite images. Remote Sens. Environ. 2014, 149, 142–154. [Google Scholar] [CrossRef]
  16. Liu, L.; Liu, J.; Zhang, Z.G. Environmental Justice and Sustainability Impact Assessment: In Search of Solutions to Ethnic Conflicts Caused by Coal Mining in Inner Mongolia, China. Sustainability 2014, 6, 8756–8774. [Google Scholar] [CrossRef]
  17. Kuang, W.; Liu, J.; Dong, J.; Chi, W.; Zhang, C. The rapid and massive urban and industrial land expansions in China between 1990 and 2010: A CLUD-based analysis of their trajectories, patterns, and drivers. Landsc. Urban Plan. 2016, 145, 21–33. [Google Scholar] [CrossRef]
  18. Tucker, C.J. Red and photographic infrared linear combinations for monitoring vegetation. Remote Sens. Environ. 1979, 8, 127–150. [Google Scholar] [CrossRef]
  19. Bouziani, M.; Goïta, K.; He, D.-C. Automatic change detection of buildings in urban environment from very high spatial resolution images using existing geodatabase and prior knowledge. ISPRS J. Photogramm. Remote Sens. 2010, 65, 143–153. [Google Scholar] [CrossRef]
  20. Zhai, M.; Xu, X.; Jiang, D.; Jiang, X. Remote Sensing Monitoring of the Ecological Environment in Wuhai Mining Area Since 1979. Remote Sens. Technol. Appl. 2012, 27, 933–940. [Google Scholar]
  21. Mao, Y.; Ma, B.; Liu, S.; Wu, L.; Zhang, X.; Yu, M. Study and Validation of a Remote Sensing Model for Coal Extraction Based on Reflectance Spectrum Features. Can. J. Remote Sens. 2014, 40, 327–335. [Google Scholar] [CrossRef]
  22. Herzog, F.; Lausch, A.; Muller, E.; Thulke, H.H.; Steinhardt, U.; Lehmann, S. Landscape metrics for assessment of landscape destruction and rehabilitation. Environ. Manag. 2001, 27, 91–107. [Google Scholar] [CrossRef] [PubMed]
  23. Wu, J.; Jenerette, G.D.; Buyantuyev, A.; Redman, C.L. Quantifying spatiotemporal patterns of urbanization: The case of the two fastest growing metropolitan regions in the United States. Ecol. Complex. 2011, 8, 1–8. [Google Scholar] [CrossRef]
  24. Liu, Z.; He, C.; Wu, J. General Spatiotemporal Patterns of Urbanization: An Examination of 16 World Cities. Sustainability 2016, 8, 41. [Google Scholar] [CrossRef]
  25. McGarigal, K.; Cushman, S.A.; Neel, M.C.; Ene, E. FRAGSTATS: Spatial pattern analysis program for categorical maps. Computer software program produced by the authors at the University of Massachusetts, Amherst. 2002. Available online: http://www.umass.edu/landeco/research/fragstats/fragstats.html (accessed on 20 February 2018).
  26. Liu, Z.; He, C.; Zhang, Q.; Huang, Q.; Yang, Y. Extracting the dynamics of urban expansion in China using DMSP-OLS nighttime light data from 1992 to 2008. Landsc. Urban Plan. 2012, 106, 62–72. [Google Scholar] [CrossRef]
  27. He, C.Y.; Liu, Z.F.; Tian, J.; Ma, Q. Urban expansion dynamics and natural habitat loss in China: A multiscale landscape perspective. Glob. Chang. Biol. 2014, 20, 2886–2902. [Google Scholar] [CrossRef] [PubMed]
  28. The IUCN Red List of Threatened Species. Version 2017-3. Available online: http://www.iucnredlist.org/ (accessed on 20 February 2018).
  29. Dong, N.; Han, X.G.; Wu, J.G. Changes in the spatiotemporal pattern of urbanization in Erdos of Inner Mongolia and related driving forces. Chin. J. Appl. Ecol. 2012, 23, 1097–1103. [Google Scholar]
  30. Liu, Y.; Yang, M. Introspection on Erdos’ Model from the perspective of ecological civilization. J. Arid Land Resour. Environ. 2011, 39, 2407–2412. [Google Scholar]
  31. Dai, G.; Ulgiati, S.; Zhang, Y.; Yu, B.; Kang, M.; Jin, Y.; Dong, X.; Zhang, X. The false promises of coal exploitation: How mining affects herdsmen well-being in the grassland ecosystems of Inner Mongolia. Energy Policy 2014, 67, 146–153. [Google Scholar] [CrossRef]
  32. Kitula, A. The environmental and socio-economic impacts of mining on local livelihoods in Tanzania: A case study of Geita District. J. Clean. Prod. 2006, 14, 405–414. [Google Scholar] [CrossRef]
  33. Hajkowicz, S.; Heyenga, S.; Moffat, K. The relationship between mining and socio-economic well being in Australia’s regions. Resour. Policy 2011, 36, 30–38. [Google Scholar] [CrossRef]
  34. Zheng, Y.; Wang, Z.; Fang, B.; He, C.; Li, L.; Li, C. Variation of Groundwater Level in Ordos, Inner Mongolia, China from 2005 to 2014. J. Desert Res. 2015, 35, 1036–1040. [Google Scholar]
  35. Li, J.; Liu, Z.; He, C.; Tu, W.; Sun, Z. Are the drylands in northern China sustainable? A perspective from ecological footprint dynamics from 1990 to 2010. Sci. Total Environ. 2016, 553, 223–231. [Google Scholar] [CrossRef] [PubMed]
  36. The Ordos Municipal Government. Initiative for Improving Comprehensive Competitiveness of Coal Industry of Ordos (2016–2018). 2016. Available online: http://xxgk.ordos.gov.cn/information/ordos_xxw50/msg10204251134.html (accessed on 20 February 2018).
  37. Wu, J. Landscape sustainability science: Ecosystem services and human well-being in changing landscapes. Landsc. Ecol. 2013, 28, 999–1023. [Google Scholar] [CrossRef]
Figure 1. The study area, the Ordos region, which is located in the south-western part of Inner Mongolia, China.
Sustainability 10 01135 g001
Figure 2. The accuracy assessment of the surface coal-mining areas (SCMAs). (a) The accuracy assessment based on statistical data for coal production; (b) the accuracy assessment based on high-resolution images from Google Earth.
Sustainability 10 01135 g002
Figure 3. The spatial patterns of SCMAs in 2015 in the Ordos region. (a) The spatial distribution of SCMAs; (b) the total area of SCMAs in each county; (c) the total number of SCMAs in each county.
Sustainability 10 01135 g003
Figure 4. The changes in SCMAs from 1990 to 2015 in the Ordos region. (a) The spatiotemporal patterns of SCMAs; (b) the changes in the total area of SCMAs in the region; (c) the changes in the total number of SCMAs in the region; (d) the changes in the area of SCMAs in each county; (e) the changes in the number of SCMAs in each county.
Sustainability 10 01135 g004
Figure 5. The changes in landscape metrics of SCMAs from 1990 to 2015 in the Ordos region. (a) Largest patch index (LPI); (b) mean patch size (MPS); (c) patch density (PD); (d) edge density (ED); (e) landscape shape index (LSI); (f) area-weighted mean fractal dimension (AWMFD); (g) mean Euclidean nearest neighbor distance (NND); (h) aggregation index (AI).
Sustainability 10 01135 g005
Figure 6. The relationships between the area of SCMAs and socioeconomic factors. (a) Factors related to population; (b) factors related to GDP; (c) factors related to income; (d) other factors.
Sustainability 10 01135 g006aSustainability 10 01135 g006b
Figure 7. Comparison of socioeconomic dynamics between the Zhungeer banner with a widespread increase of SCMAs and the Hangjin banner almost without an increase of SCMAs.
Sustainability 10 01135 g007aSustainability 10 01135 g007b
Figure 8. The land occupied by SCMAs in the Ordos region from 1990 to 2015.
Sustainability 10 01135 g008
Table 1. List of landscape metrics used in this study [25].
Landscape MetricAbbreviationDescription
Largest patch indexLPILargest patch index at the class level quantifies the percentage of total landscape area comprised by the largest patch (unit: %).
Mean patch sizeMPSThe average area of all patches in the landscape (unit: ha).
Patch densityPDThe number of patches per hectare (unit: Number of patches/ha).
Edge densityEDThe total length of all edge segments per hectare for the class or landscape of consideration (unit: m/ha).
Landscape shape indexLSIA modified perimeter-area ratio of the form that measures the shape complexity of patch.
Area-weighted mean fractal dimensionAWMFDThe patch fractal dimension weighted by relative patch area, which measures the average shape complexity of individual patches for the whole landscape or a specific patch type.
Mean Euclidean nearest neighbor distanceNNDThe distance to the nearest neighboring forest patch, based on shortest edge-to-edge distance (unit: m).
Aggregation indexAIAggregation index is calculated from an adjacency matrix, which shows the frequency with which different pairs of patch types (including like adjacencies between the same patch type) appear side-by-side on the map.
Table 2. Changes of SCMAs in the Ordos region from 1990 to 2015.
Region/CountyArea of SCMAs (km2)Number of SCMAs
199019952000200520102015Change from 1990 to 1995Mean Annual Change Rate (%)199019952000200520102015Change from 1990 to 1995Mean Annual Change Rate (%)
Zhungeer1.2810.8314.5834.34121.51160.18158.921.31 *22901732151782091879.42 *
Dongsheng1.481.203.633.7954.1157.5856.115.77 *199484165102836.95 *
Yijinhuoluo0.840.252.664.9051.6955.0154.1718.21 *98598712215915012.17 *
Dalate0.970.971.662.5438.2641.5840.6116.22 *212367358368474.81 *
Etuoke2.593.244.220.6411.3535.7633.1711.07 *173928118670535.82 *
Etuokeqian00000.242.982.9865.50 **00009212118.47 **
Wushen00000.072.562.56105.41 **00004282847.58 **
Hangjin0000.350.870.200.20−5.44 ***000212447.18 ***
Ordos7.1616.5026.8446.55278.10355.86348.716.91 *881693783915596615738.40 *
* The change rate between 1990 and 2015; ** The change rate between 2010 and 2015; *** The change rate between 2005 and 2015.
Table 3. The changes in landscape metrics of SCMAs in the Ordos region from 1990 to 2015.
Region/County LPI (%)MPS (ha)PD (num/ha)ED (m/ha)LSIAWMFDNND (m)AI
Zhungeer19900.006.340.000.035.131.043346.9988.54
20150.3977.060.031.0315.481.07815.0796.56
Change0.3970.720.031.0010.350.03−2531.928.02
Dongsheng19900.038.580.010.104.331.041681.4591.46
20150.4658.820.051.3910.031.09652.9496.42
Change0.4350.250.041.295.690.04−1028.514.96
Yijinhuoluo19900.0110.480.000.023.241.05876.0192.29
20150.0834.820.030.7114.411.08991.6294.55
Change0.0824.340.030.6811.170.03115.612.26
Dalate19900.004.840.000.025.211.05725.1186.67
20150.0661.200.010.299.301.07993.4696.11
Change0.0656.360.010.264.090.02268.349.44
Etuoke19900.0116.130.000.014.101.06573.8694.05
20150.0750.930.000.108.391.07642.7796.26
Change0.0734.800.000.094.280.0168.912.21
Ordos19900.006.970.000.039.061.051766.0388.48
20150.1260.290.020.7324.461.08831.0596.03
Change0.1253.320.020.6915.400.03−934.987.54
Table 4. Habitat loss due to the increased SCMAs, and the threatened species in the Ordos region.
CategoriesClass of SpeciesName of SpeciesPopulation TrendHabitat Loss Due to the Increased SCMAs (km2)
Critically endangeredBirdsAythya baeriDecreasing287.70
EndangeredBirdsFalco cherrugDecreasing287.70
EndangeredBirdsAquila nipalensisDecreasing274.94
VulnerableBirdsOtis tardaDecreasing287.70
VulnerableBirdsHaliaeetus leucoryphusDecreasing287.70
VulnerableBirdsEmberiza rusticaDecreasing287.70
VulnerableBirdsAquila heliacaDecreasing287.70
VulnerableBirdsAnser cygnoidDecreasing287.70
VulnerableBirdsAnser erythropusDecreasing287.70
VulnerableBirdsPelecanus crispusDecreasing284.80
VulnerableBirdsChlamydotis macqueeniiDecreasing264.31
VulnerableBirdsLarus relictusDecreasing0.00
VulnerableMammalsVormela peregusnaDecreasing287.70
VulnerableMammalsGazella subgutturosaDecreasing269.71
VulnerableMammalsNaemorhedus griseusDecreasing12.68

