Article

Measurement of Particulate Matter (PM2.5) and Health Risk Assessment of Cooking-Generated Particles in the Kitchen and Living Rooms of Apartment Houses

Department of Architectural Engineering, Yonsei University, 50 Yonsei-ro, Seodaemun-gu, Seoul 03722, Korea
*
Author to whom correspondence should be addressed.
Sustainability 2018, 10(3), 843; https://doi.org/10.3390/su10030843
Submission received: 19 January 2018 / Revised: 12 March 2018 / Accepted: 14 March 2018 / Published: 16 March 2018
(This article belongs to the Collection Sustainable Built Environment)

Abstract

:
The purpose of this study was to measure the concentration of cooking-generated particles and to assess the health risk of the occupants. Numerous particulates are released from the kitchen when people are cooking, and diffused to other spaces in house, which would adverse the health of occupants. Sufficient ventilation is needed to decrease the PM2.5 concentration. To analyze the PM2.5 concentration, field measurements were performed on a cooking condition. A case study was performed based on the ventilation type including natural and mechanical ventilation. Three cases were designed: single-sided natural ventilation, cross-ventilation, and mechanical ventilation. The PM2.5 concentration was measured for 30 min, with a cooking time of 16 min. According to the analysis, the PM2.5 concentration increased 3.8 times more than the 24 h standard (50 µg/m3). The PM2.5 concentration in the living room was slightly greater than that in the kitchen. The particulate matter also rapidly diffused to other spaces. Moreover, the health risk increased by up to 30.8% more than in the base scenario. Therefore, additional ventilation strategies are needed to alleviate the diffusion of cooking particles.

1. Introduction

In indoor living spaces, many contaminants are generated due to the building materials, ventilation, cooking, etc. The common indoor contaminants include gaseous contaminants like COx, NOx, and TVOCs (Total Volatile Organic Compounds), and particulate contaminants like fine particles and PAHs (Polycyclic Aromatic Hydrocarbons). When these contaminants enter the room, the indoor air quality may deteriorate and thus have adverse health effects on humans. In particular, fine particles can be inhaled into the body via the respiratory system, and can thus cause respiratory diseases.
Cooking activity is the major source that generates a number of fine particles in a room. During the cooking process, many fine particles are generated due to the burning of food and oil [1]. This may increase the incidence of lung cancer among housewives, whose main activity is usually cooking [2]. In addition, the fine particles generated by cooking spread not only to the kitchen, but also to the living room and adjacent spaces, thereby having negative impacts on the occupants’ health [3].
Since the 1990s, many studies have been conducted to address the aforementioned problems. He et al. classified the causes of indoor-generated fine particles into several categories and analyzed the generation of fine particles according to each occupant activity. As a result of the research, it was found that the cooking-generated particles had the greatest effect on the indoor particle concentration [4]. Chiang et al. conducted a research in which they analyzed the concentration of indoor contaminants in cases with mechanical and natural ventilation [5]. In addition, the transom was applied to increase effectiveness of natural ventilation. In other studies, the diffusion of cooking-generated particles to other spaces was evaluated through a numerical analysis, in addition to field measurements and experiments [6,7]. The fine particles were found to have diffused to the adjacent spaces and then to have entered the human body through the respiratory system. With respect to the deposition of inhaled particles in the human respiratory tract, another study was conducted by applying the human respiratory model [8]. The degree of diffusion or human inhalation of the particles varies according to the particle size. In this regard, a study was undertaken to analyze the fine particles generated when oil is heated, according to the particle size [9]. According to the results of this study, most of the particles with diameters from 0.1 to 10 found to be in the diameter range below 4.0. In addition, a study analyzed the amount of polycyclic aromatic hydrocarbon (PAH)—an aromatic compound with benzene rings that is a kind of carcinogen—and of fine particles [10]. There is still a need, however, to study the generation of fine particles and to assess the associated health risks of the occupants. Therefore, risk assessment according to various ventilation methods is required for each space.
According to the particle size, particles are classified into coarse particle (PM10), fine particle (PM2.5), or ultra-fine particle (UFP). Fine particles with a small particle diameter are mostly generated during cooking [11]. These fine particles are deposited in the lungs through the respiratory system, and cause various respiratory diseases [12]. In particular, when people cook in the kitchen, strong buoyancy occurs, and the generated fine particles rapidly spread to spaces other than the kitchen. In this case, the fine particles are more rapidly diffused to other spaces [7]. This has adverse effects not only on the housewives, who are directly affected by the fine particles in the kitchen, but also on the occupants situated in the other spaces in the living quarters. Especially in the East Asian countries, where the living room and the kitchen are located close to each other, the cooking-generated particles can be rapidly diffused into the living room and other spaces if not properly exhausted. Therefore, it is necessary to evaluate the emission of cooking-generated particles as well as the diffusion of fine particles into the adjacent spaces.
To evaluate the effects of fine particles (PM2.5) on the human body, a human health risk assessment method should be applied. Human health risk assessment is a method in which the levels of human exposure to contaminants are combined with the life cycle impact assessment (LCIA) method [13]. It involves occupant scenarios according to the concentration of the contaminants, and assesses the risks to the human health when the occupants are exposed to the contaminants for a long period of time. Many researches have been conducted lately to evaluate the risk posed by various indoor contaminants to human health [14]. Two types of important exposure information are needed to assess the risk posed by fine particles: lifetime exposure, which is the estimate of a person’s exposure according to the human exposure scenario; and short-term exposure, which is about the actual concentrations of the contaminants [15]. Through the short-term exposure data, the amount of long-term exposure can be predicted, and then the occupant health risk can be assessed.
The objective of this study was to analyze the diffusion degree of cooking-generated particles, and to quantify the health impact through the risk assessment method based on the particle distribution and occupant scenarios. To achieve this, the concentration of the cooking-generated particles in the kitchen and the living room were measured based on the PM2.5 level.

2. Measurement of Cooking-Generated Particles

2.1. Measurement Overview

In this study, field measurements were conducted on an experimental house located in South Korea. The experimental house was constructed in accordance with the most common apartment floor plan design. The data was measured in the kitchen and the living room, and ventilation was provided using heat recovery ventilation (HRV) units, ventilation windows, and a range hood in the kitchen. A ventilation window was installed in the kitchen and the living room, respectively. Two supply diffusers were installed in the middle position between the living room and the kitchen, and two exhaust diffusers were installed in the living room, on the window side (Figure 1). The total floor area of the living room and the kitchen was 29.6 m2, and the floor height was 2.3 m. To minimize the effects of air infiltration during the measurement process, the rooms other than the living room were sealed to reduce the diffusion of fine particles thereto due to air infiltration.
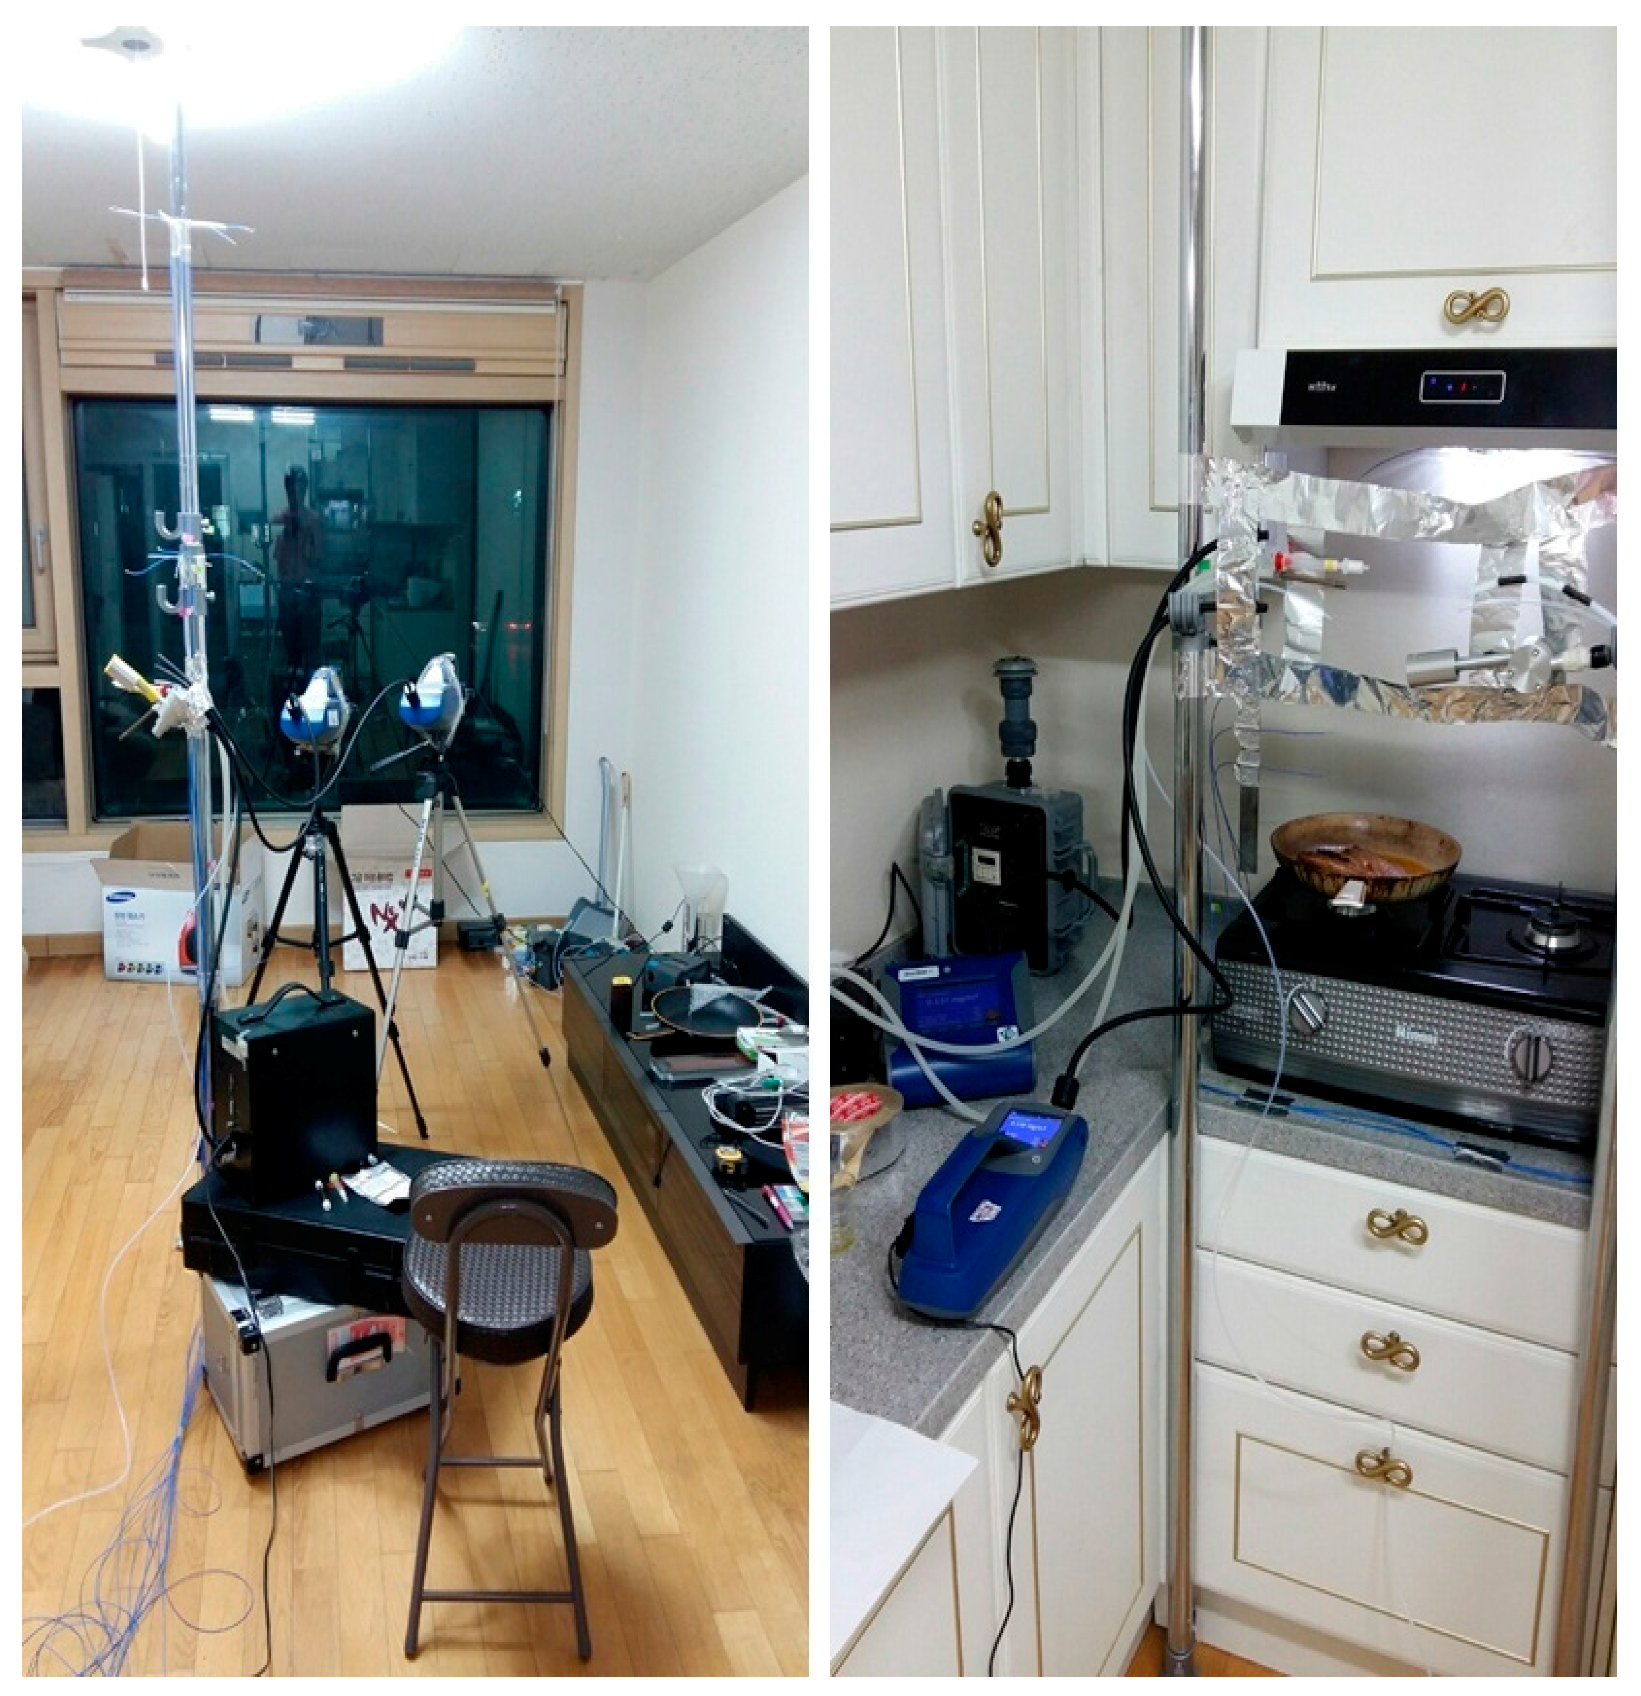
The concentration of fine particles was measured using TSI DustTrak II (Model 8532, TSI, Shoreview, MN, USA), based on the mass concentration (Figure 2). The measurement points were the kitchen cook position (P1), the living room (P2), and the outdoor range hood exhaust duct. In the exhaust duct of the range hood, the amount of cooking-generated particles was measured. In the interior space, the concentrations of PM2.5 in the living room and the kitchen were compared to evaluate the amount of cooking-generated particles that the occupants were exposed to, and the amount of particles that were diffused into the living room. The mass concentration was measured at the human respiration level of 1.5 m (height). The data was measured in 30-s intervals. Before the measurement of the fine particles, the indoor fine particles were removed through natural ventilation for 30 min. As a result, the initial concentration was 18–20 µg/m3. When natural ventilation was applied, the outdoor average wind speed was about 0.3 m/s (±0.1 m/s), and the outdoor temperature was about 25 °C.

2.2. Measurement Conditions

In this study, a case study was conducted to measure the impacts of cooking-generated particles and ventilation systems through field measurements. In the case study, three cases were investigated based on the window opening and ventilation system (Table 1). For relative comparison during the measurement process, various air supply methods were applied, and the range hood was used as the exhaust port to create similar airflow rate conditions. In cases 1 and 2, the ventilation window was opened when the range hood was in operation, and the fine-particle reduction effect through the natural air supply-range hood exhaust was analyzed (NV; Natural Ventilation). Case 3 investigated the fine-particle reduction effect of the use of the ventilation air supply-range hood exhaust with the operation of heat recovery ventilation units (MV; Mechanical Ventilation). In such case, the air exhaust diffusers were closed, and only the air supply diffusers were opened so that all the supplied air would be exhausted through the range hood and indoor air balance would be established. In case 1, the southern-side window in the living room was opened to minimize the diffusion of the fine particles from the kitchen to the living room. In case 2, the southern window and the kitchen veranda window were opened to create the conditions for smooth air supply through the windows. In each case, the exhaust air was discharged into the range hood, and the same exhaust flow rate (1-speed of range hood; Normal flow-150 CMH) was kept to maintain similar airflow rate conditions. In this study, as the exhaust system was applied only through the range hood, the airflow rate in each case was obtained by measuring the amount of exhaust air through the range hood. The model, before being applied to evaluate the concentration of fine particles generated by cooking food, should be calibrated with external air which, if polluted, may already contain a high concentration of fine particles [16,17]. To minimize the effect of outside air, the entire space was ventilated by opening the windows for an hour before the measurement.
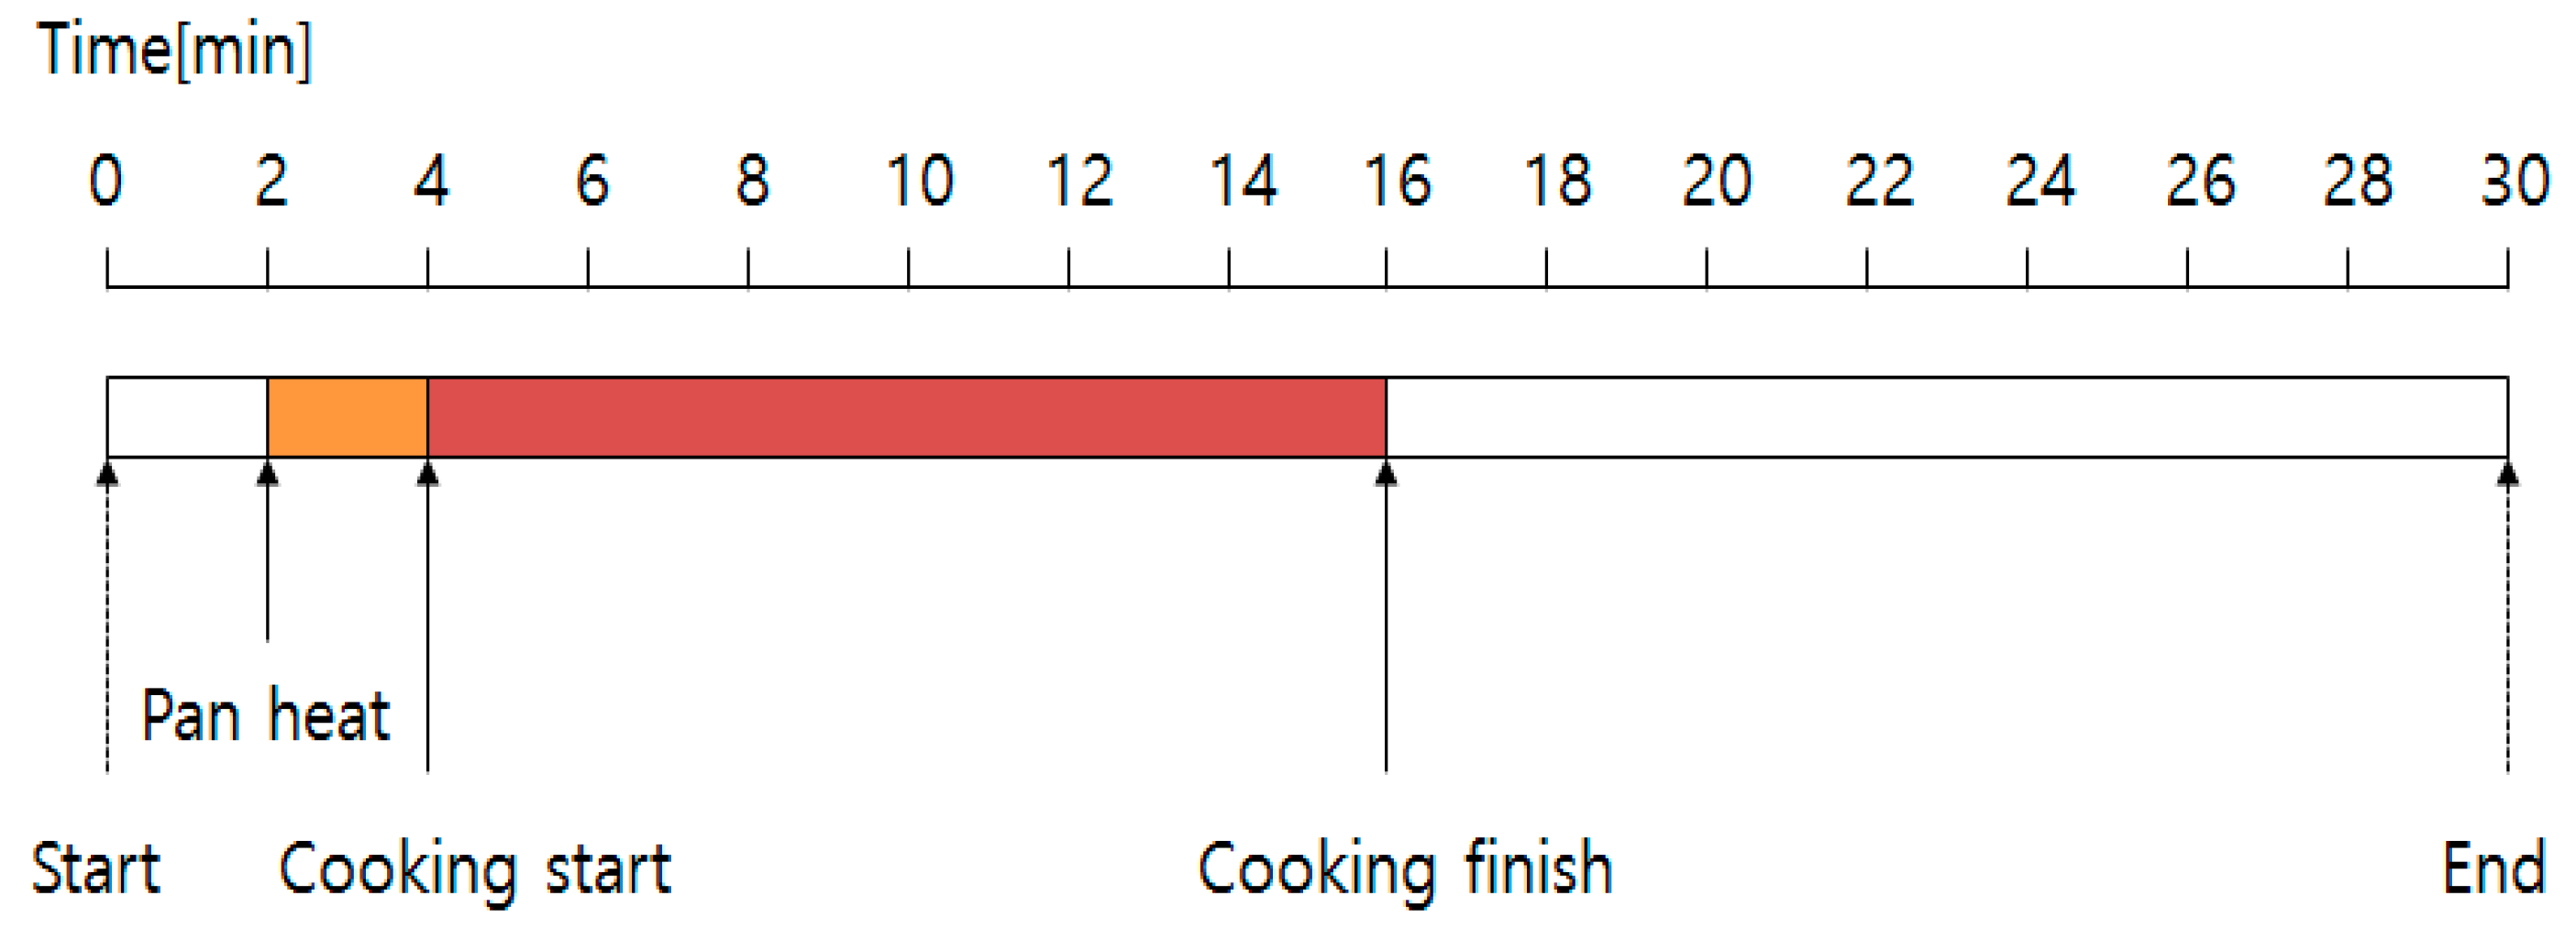
Field measurement was conducted for 30 min. For relative comparison of the cases, the obtained data were analyzed by converting them to the normalized concentration (C/Ci). As a result of the measurement, the room temperature ranged from 25 to 26 °C before the start of cooking, and the concentration of PM2.5 was about 20 µg/m3. For realistic analysis, particle concentration analysis is needed on various cooking conditions. However, it is difficult to measure many kinds of the recipes in the experimental process. Therefore, in this study, we try to analyze by using a representative recipe that many particles occur among various kinds of recipes in Korea. For cooking, grilling fish (mackerel), one of the famous cooking methods in which many fine particles occur during cooking, was applied as a cooking method. Two minutes after the start of the measurement, the gas range was turned on to start the preheating, and the cooking commenced after 4 min. At the start of the cooking, one mackerel and 20 mL cooking oil (soybean oil) were put in at the same time. Since after the cooking started, the fish was flipped over for five times in every 2 min until cooking finished, so that cooking could be done under conditions similar to the actual cooking conditions (Figure 3).

3. Cooking-Generated Particles and Occupant Health Risks

3.1. Assessment of the Health Risk Posed by Particulate Matter

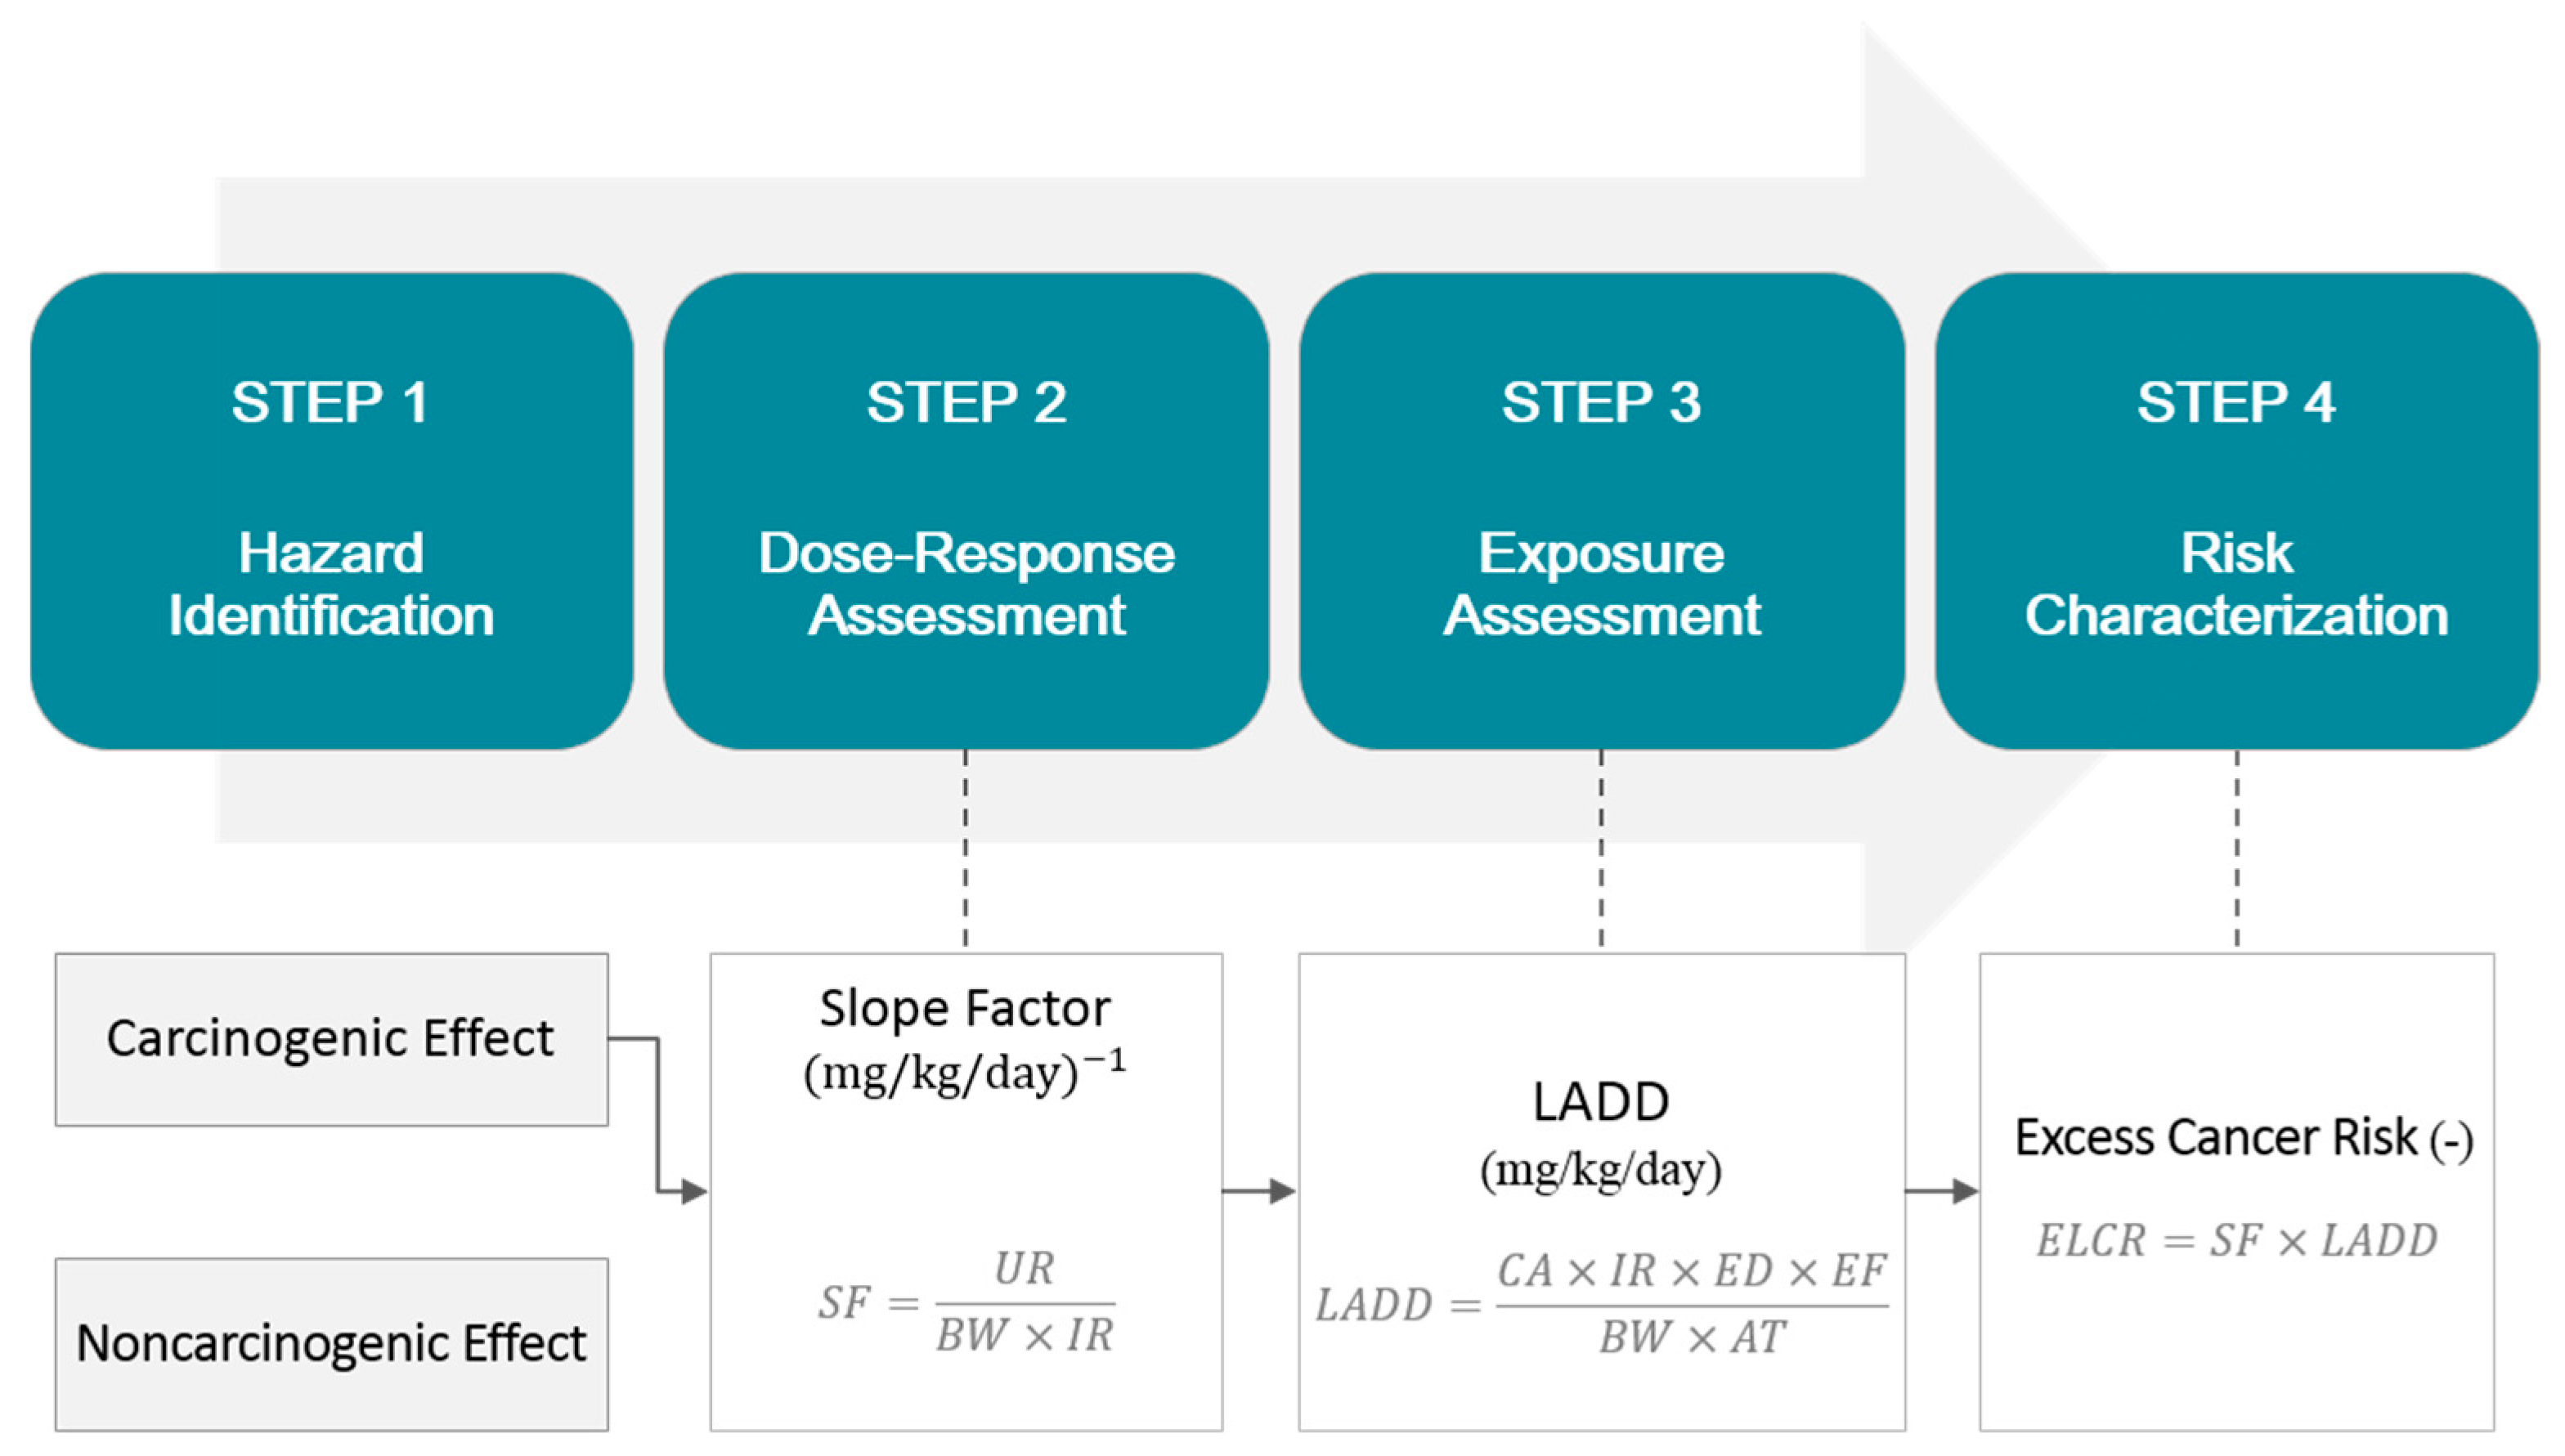
Human risk assessment quantifies the lifetime effects of occupants’ exposure to contaminants on their health. The risk assessment method is divided into four stages: hazard identification, dose response assessment, exposure assessment, and risk assessment. The assessment of the health risk posed by contaminants can be split into the carcinogenic/non-carcinogenic health risk assessment [18]. In the case of fine particles, the assessment can be performed based on the excess lifetime cancer risk (ELCR) factors (Figure 4).
First, calculation of the slope factors (SFs) indicating the cancer risk posed by fine particles is required for the dose response assessment. The dose response assessment determines the degree of carcinogenicity of the contaminant, which determines the slope of potential risk when a person is exposed to the contaminant. The SF data of each contaminant is provided by the Integrated Risk Information System (IRIS) of U.S. Environmental Protection Agency (EPA) [19]. The dose response assessment values for each substance are obtained using Equation (1), where UR pertains to the unit risk (µg/m3), BW to the body weight (kg), and IR to the inspiration rate (m3/h):
SF = U R B W × I R .
In the exposure assessment step, the amount of exposure of the occupants to contaminants over their lifetime is calculated, considering the concentration of the contaminants and the exposure time. The exposure assessment is based on the lifetime average daily dose (LADD), which is calculated by applying CA (contaminant concentration; µg/m3), IR (inhalation rate; m3/h), ED (exposure duration for scenario; years), EF (exposure frequency; days/year), BW (body weight; kg), and AT (average time for lifetime; days), as shown in Equation (2):
LADD = ( C A × I R × E D × E F ) ( B W × A T ) .
Finally, the human risk is calculated by multiplying the previously calculated SF and LADD values. The cancer risk is the probability that a person will develop cancer during his or her lifetime. Its reference value is 3.14 × 10³, which pertains to one cancer incidence for every one million people. The ELCR (Excess Lifetime Cancer Risk) are calculated by Equation (3):
ELCR = SF × LADD .

3.2. Risk Assessment Based on Particle Exposure

The analysis of the exposure concentration should precede the risk assessment. In this study, the measurement was conducted for only 30 min under cooking conditions, not for 24 h, and a prediction model of the fine-particle concentration was needed for the remaining time. To compensate this, the equation below was constructed and utilized to predict the contaminant concentration:
CA = ( 0 30 C n + 30 t g ( t ) ) · C i · n + C i · ( 1440 n t ) 1440 ,
where Cn is the measured concentration (µg/m3), g(t) is decay rate equation, Ci to the initial concentration(µg/m3), n is number of cooking event (#), and t is decayed time (min).
The exposure concentration was predicted based on the initial concentration before the measurement (20 µg/m3). The measured values were applied until 30 min after the start of cooking, and then a concentration-decreasing function was applied through linear regression analysis. Various regression functions can be applied to decay rate functions. As a result of the measurement, it was predicted that the decrease of particle concentration was linearly decreased after cooking. Therefore, linear equations were used in this study. The average daily exposure concentration was determined by applying the distribution of fine particles and the residual time of each case under the condition of cooking twice a day.
In addition to the exposure concentration, additional information regarding the inhalation rate and exposure duration is needed for risk assessment. In this study, these types of information were obtained from the existing literature and were applied to the risk assessment (Table 2). The data on the inhalation rate and body weight were referenced from the data contained in the South Korean Exposure Factors Handbook [20]. In this study, as the genders were not separated, the mean value (14.25 m3/day) of the inhalation rate for the adult males (15.7 m3/day) and that for the adult females (12.8 m3/day) were applied as the inhalation rate. In addition, 62.8 kg was used as the average body weight for both the adult males and females. The exposure duration was set to 24 h (for homemaker), the average exposure concentration, and the average time was 70 years, the average time applied in cancer risk assessment as per the U.S. EPA guidelines [21]. Meanwhile, SF should be applied to determine the health risk posed by contaminants, and the unit risk (µg/m3) information is needed to calculate the cancer SF. However, there is no information about SF in Korea. In this study, the risk value adopted in the research conducted by Natasha et al., who conducted health impact assessment using PM2.5, was applied [22].

4. Results

4.1. Particle Distribution by Cooking Condition

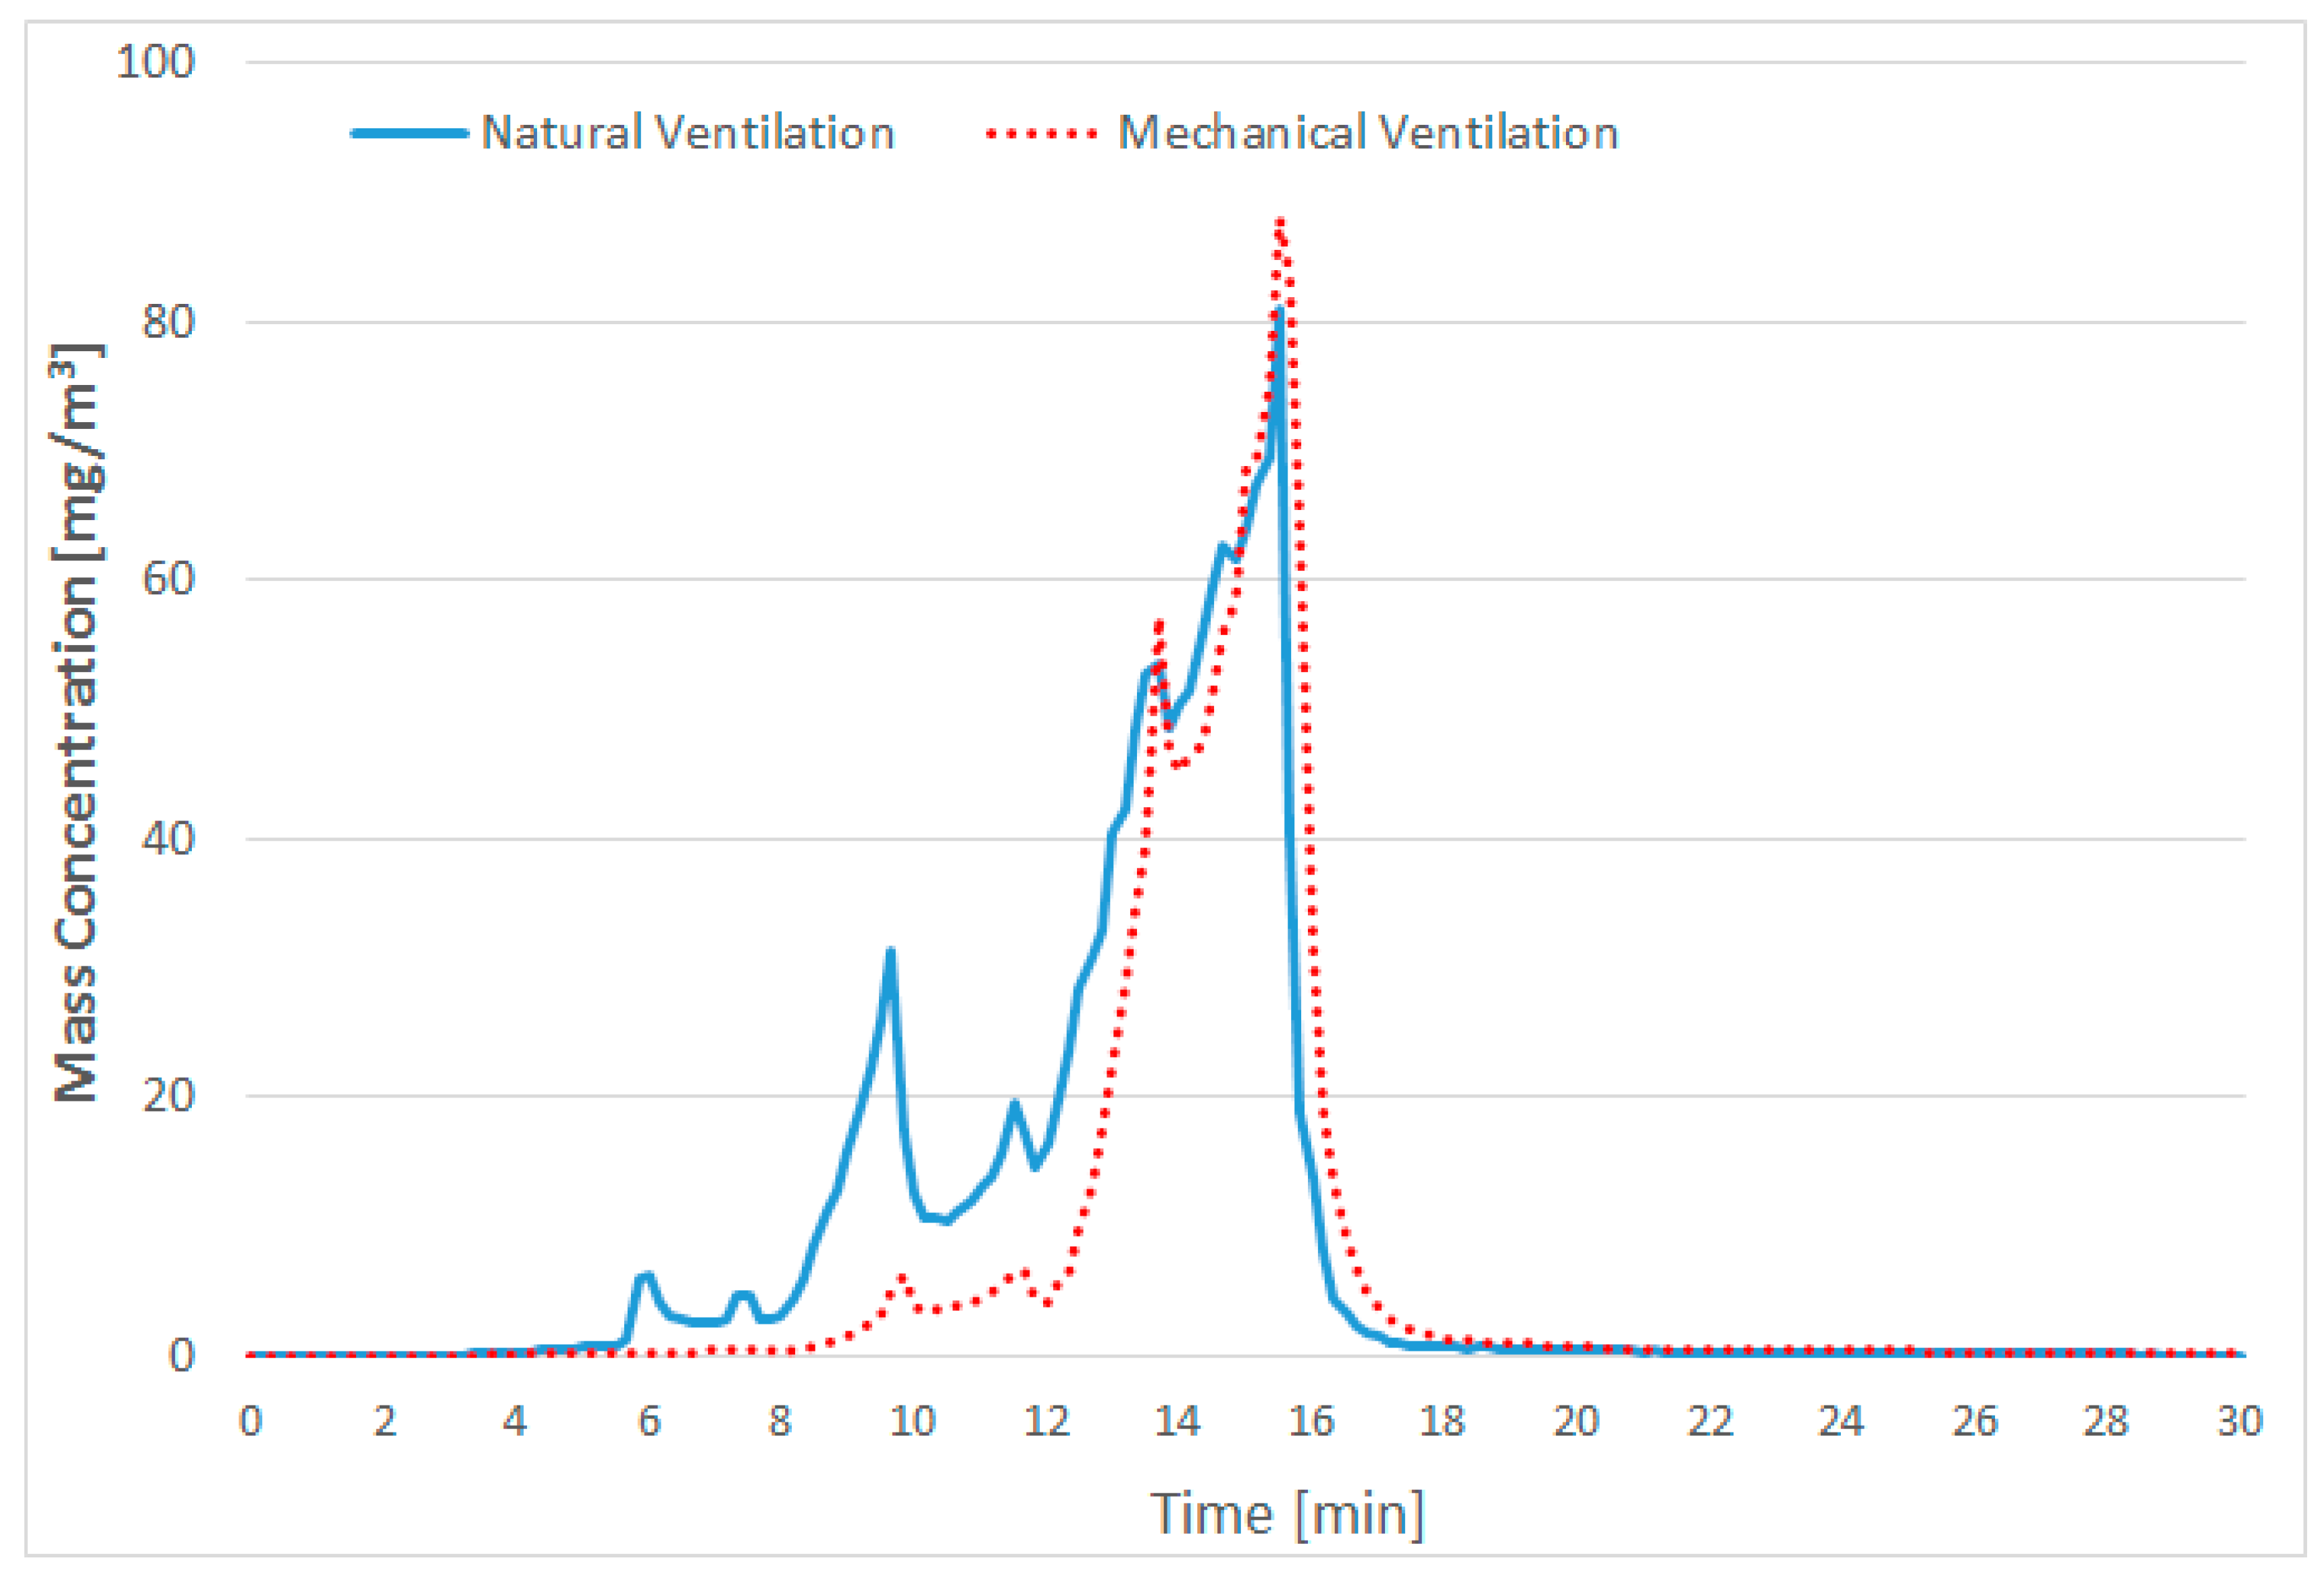
The distribution of the PM2.5 concentration in the kitchen and the living room during cooking is shown in Figure 5 and Figure 6. First, Figure 5 shows the amount of PM2.5 measured at the exhaust diffuser of range hood. Fine particles started to be generated from 6 min after the start of cooking. The amount of fine particles steadily increased during cooking, and the maximum value was observed at about 16 min after the end of cooking. The fine-particle emission trends in the natural- and mechanical-ventilation cases were similar. The total amount of emissions, however, was greater in the natural-ventilation case than in the mechanical-ventilation case, but the maximum value was larger in the mechanical-ventilation case (88.1 mg/m3) than in the natural-ventilation case (81.1 mg/m3). This suggests that, in the natural-ventilation case, the total concentration was larger due to the inflow of the fine particles contained by the outside air.
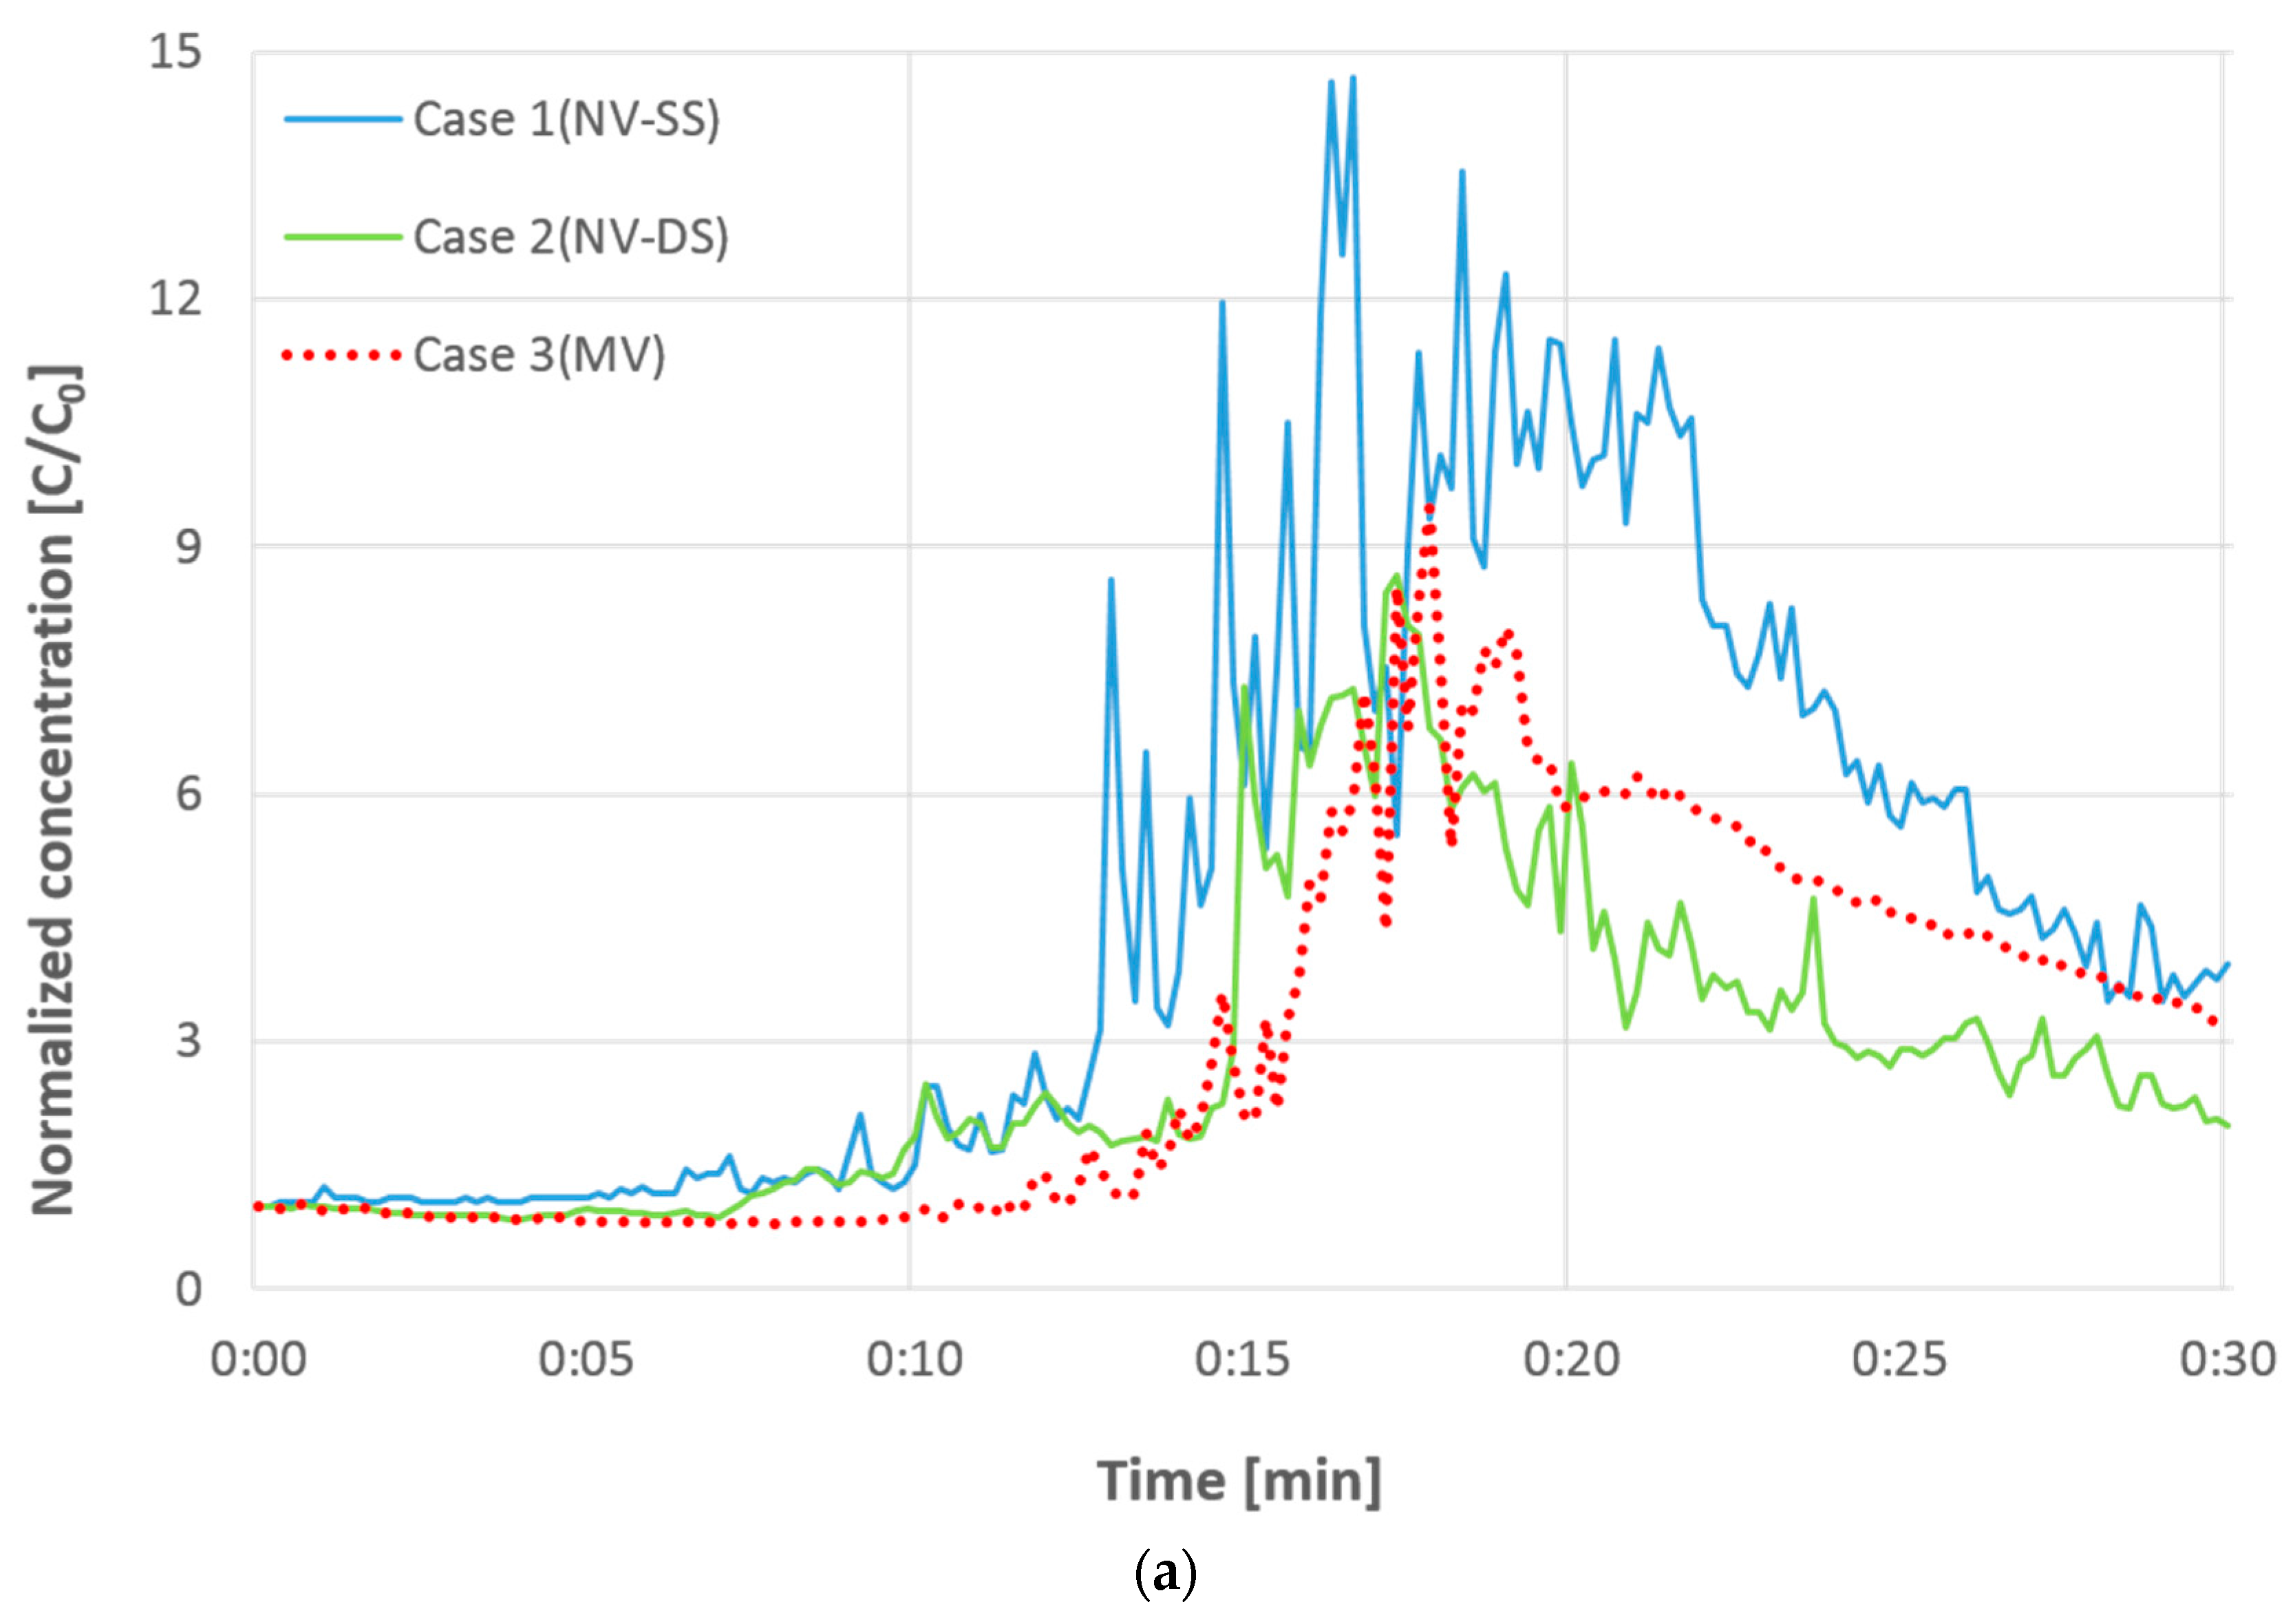
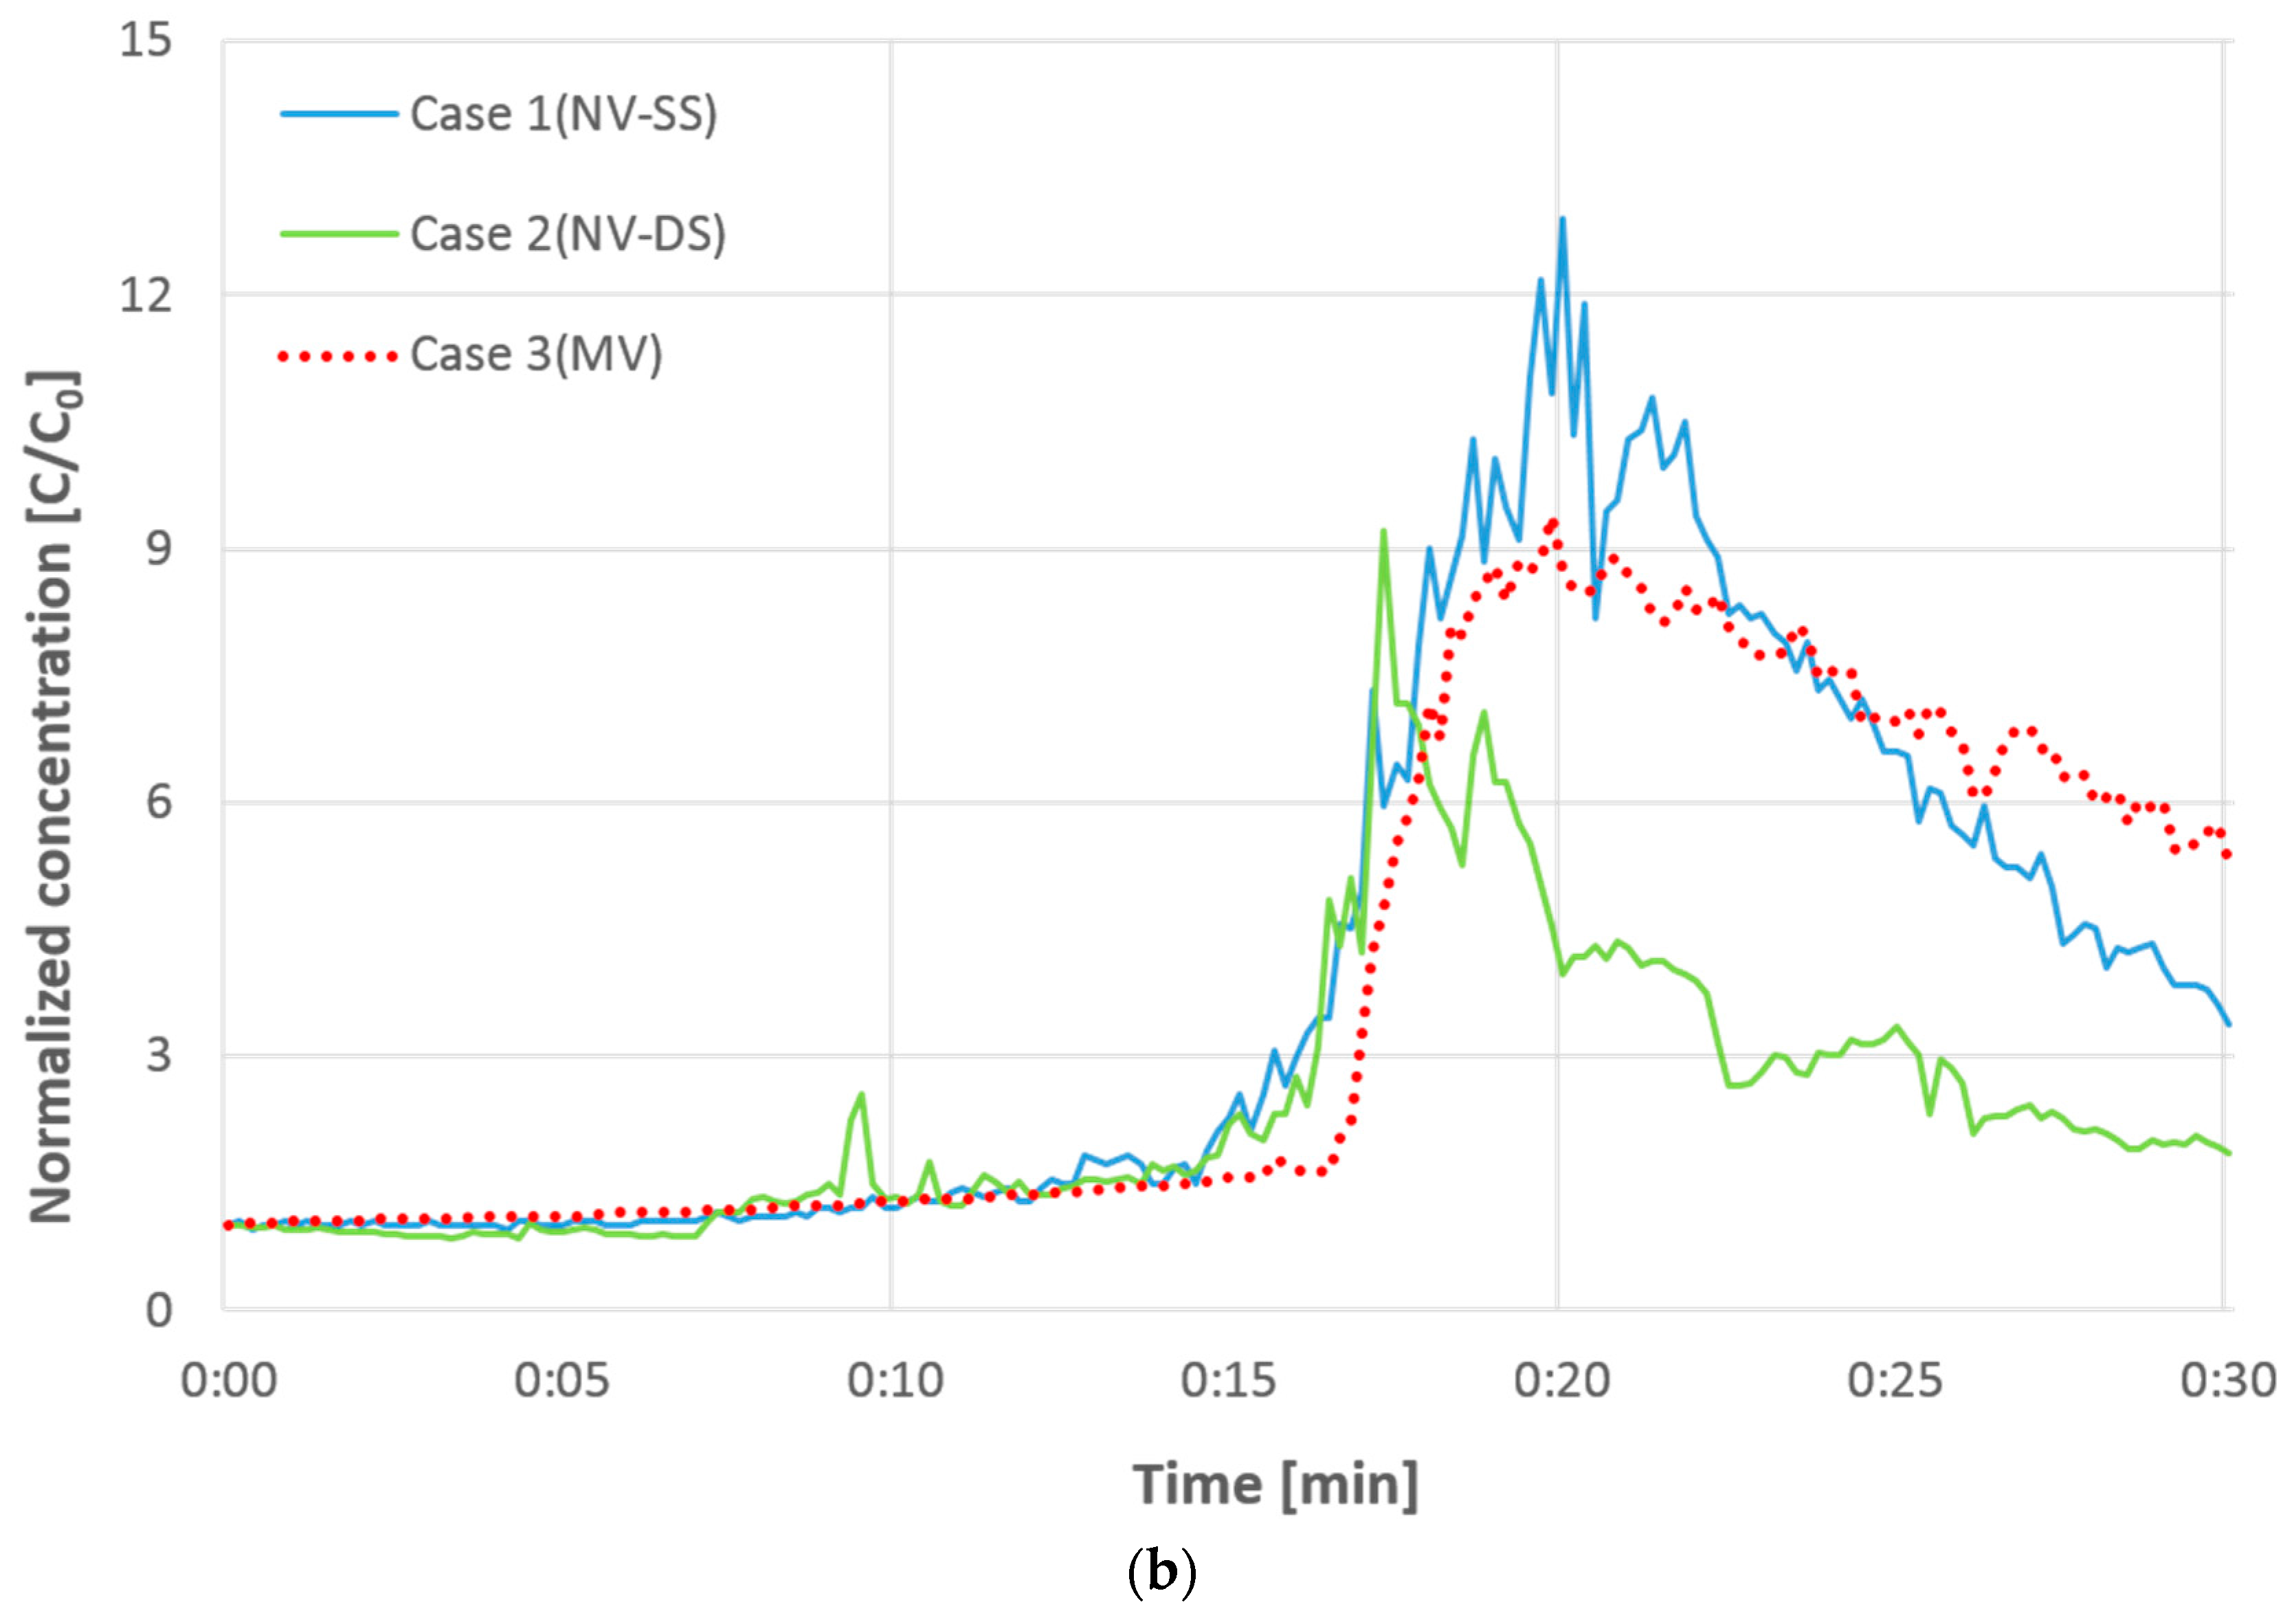
Figure 6 shows the distribution of fine particles in the kitchen (a) and in the living room (b). (NV: Natural Ventilation, MV: Mechanical Ventilation, SS: Single-sided, DS: Double-sided) To compare the three measurement results under the same conditions, the distribution of the indoor fine particles was converted as a normalized concentration obtained by dividing the concentration for each of the three measurement points by the initial concentration. The results showed that the fine particles were not diffused immediately after the start of cooking but spread quickly after 6 min (10 min after the measurement). This is because, when food is heated, the response is not great at the beginning, but the amount of fine particles increases significantly as the food is grilled. In the measurement process, the maximum concentration of fine particles was largest from 16 min immediately after the end of cooking to 2 min after the end of cooking.
The concentration of fine particles in the kitchen gradually increased after the start of cooking, and the highest concentration was observed at about 16 min after the end of cooking. In case 1, the concentration was relatively high. As the fine particles were rapidly removed, however, the concentration became similar to that in case 3—in which mechanical ventilation was used—at about 30 min after the measurement. In case 2, in which cross-ventilation was applied, although there were fine particles that were exhausted through the range hood, cross-ventilation could have caused additional fine-particle emissions, resulting in a low particle concentration. Case 3, where mechanical ventilation was introduced, showed small concentration fluctuations. This is because the turbulence of the indoor airflow is reduced as the indoor airflow distribution becomes relatively uniform when mechanical ventilation is applied. In all three cases in this study, the maximum concentration was higher than the concentration in the living room, and, as such, it can be said that the fine particles were rapidly removed from the kitchen.
In the living room, fine particles are rarely diffused 16 min before the cooking is finished, and the concentration is low. They are rapidly diffused, however, after the cooking is finished. Particularly in case 2 in this study, in which cross-ventilation was applied, the fine particles reached the maximum concentration more rapidly than in the other cases. As the maximum concentration was not as high as in the other cases, however, and as the fine particles were quickly exhausted due to the large airflow rate, a concentration value similar to the initial concentration was observed at about 10 min after the end of cooking. In case 3, in which mechanical ventilation was applied, the highest concentration was similar to that in case 2. As the concentration slowly decreased, however, the concentration was highest at the end of the measurement. Especially in this case, the particle concentration in the living room was higher than that in the kitchen. Therefore, it was predicted that the mechanical ventilation system would be vulnerable to the diffusion of fine particles. The target building seems to be particularly more vulnerable to fine-particle diffusion as its air supply diffusers are located halfway between the living room and the kitchen, and the air supply diffuser located on the ceiling does not effectively remove the fine particles that spread quickly in the kitchen. It is therefore necessary to consider the locations of the air supply and exhaust diffusers when mechanical ventilation is applied. In case 1, where ventilation was effected by opening the windows in the living room, the concentration of the fine particles in the living room rapidly decreased, confirming that keeping the direction of the airflow constant by providing air supply from the windows in the living room greatly contributes to the reduction of the fine-particle diffusion. In cases 1 and 3, however, as the concentration of fine particles was higher in the living room after the cooking was finished, proper countermeasures are needed. In the Table 3, the decay rate and average concentration in each case are reported.

4.2. Results of the Health Risk Assessment

For the assessment of the health risk posed by cooking-generated particles, the daily average particle concentration was calculated using Equation (4). The ED (Exposure Duration) is 70 years, the IR (Inhalation Rate) is 14.25 m3/day, the EF (Exposure Frequency) is 365 days/year, the BW (Body Weight) is 62.8 kg and the AT (Average Time) is 25,550 days (70 years × 365 days/year). In addition, 365 days were substituted into the EF and AT values to apply average values in the analysis process.
The analysis was performed based on the measurement results under cooking conditions, twice a day for 30 min. Thirty minutes after the completion of the measurement, the concentration decay rates were estimated and applied through the concentration graph. The linear regression equation was derived based on the data obtained from 20 to 30 min when the particle concentration began to decay, and the decay rate of the fine particles was predicted (Table 3). When the reference concentration was set at 20 µg/m3, the time until this point was reached in the kitchen was estimated to be 59.13, 66.25, and 82.01 min in cases 1, 2, and 3, respectively, and, in the living room, 55.46, 50.72, and 116.17 min. In general, the reduction in the concentration of the fine particles was found to be faster in the natural ventilation case. The daily average particle concentration was analyzed based on these results.
The results of the health risk assessment for each case in this study are shown in Table 4. The results show that there was no significant difference in case 2 compared to the case where no cooking was done. In cases 1 and 3, however, the risk significantly increased compared to the case where no cooking was done. In particular, the cancer risk increased by 30.8% in the kitchen and by 26.2% in the living room when mechanical ventilation was applied, which confirms the importance of the ventilation plan. While case 1 showed the highest health risk in the kitchen, case 3 with mechanical ventilation showed the highest health risk in the living room. Overall, the risk was higher in the kitchen than in the living room, but there was no significant difference in health risk between the kitchen and the living room. In the kitchen, however, a large increase in buoyancy occurs due to the strong heat generated by cooking; as such, the contaminants can spread quickly despite the use of a ventilation system. Therefore, proper ventilation planning is required to prevent the cooking-generated particles from being diffused to other spaces. In this study, occupational exposure scenarios with one cooking method were applied due to the limitation of the laboratory application. In the future study, detailed evaluation by various cooking methods and residents’ activities is needed in actual situation.

5. Study Limitations

Exposure scenarios and a health risk assessment were proposed in this study. Nonetheless, due to realistic constraints, there were some limitations in terms of the research process. The limitations of this study are as follows:
(1)
Field measurement: There were some limitations in the field measurement process. First, Korean cuisine is comprised of a variety of dishes and styles. However, it was difficult to measure particle concentration for every particular type of food. The study was done using grilled fish, which has a large range of effects in terms of fine particles among the various available dishes that could have been chosen. In addition, it was difficult to perform long-term measurement due to logistical problems, so the measurement was performed for 30 min. After that, the prediction model was applied to the decay rate of the fine particles.
(2)
Exposure scenario: The main focus of the study is to suggest a method concerning the possible health risks according to the occupant scenario. The amount of time an occupant may stay at home varies depending on the occupant’s job or schedule. In this study, we constructed an exposure scenario for homemakers. The minimum concentration (20 µg/m3) was applied under the remainder of the conditions, assuming that there is no particle generating behavior other than cooking.

6. Conclusions

The objective of this study was to evaluate the distribution of cooking-generated particles over time, and their diffusion to the adjacent spaces, and to quantitatively evaluate the impact of fine-particle inhalation on the human respiratory system through health risk assessment. To achieve this, the distributions of fine particles (PM2.5) over time under the conditions of natural and mechanical ventilation, respectively, were measured and compared. In addition, human risk assessment was performed based on the findings. As a result of the study, it was found that the particle concentrations in the kitchen and the living room increase due to cooking, and, notably, the concentration in the kitchen is similar to that in the living room. The results of this study are summarized below:
(1)
The fine-particle emissions rapidly increase after food is heated for a certain amount of time since after the start of cooking.
(2)
The concentration of indoor fine particles decreases relatively more rapidly with natural ventilation than with mechanical ventilation, but the effect of fine-particle reduction is diminished if cross-ventilation is not performed properly.
(3)
The risk assessment results obtained in this study showed that there is no significant difference in the health risk posed by the contaminants in the kitchen and the living room, and, therefore, it is necessary to devise optimized countermeasures against the diffusion of contaminants into the living room.
In this study, the fine particles (PM2.5) generated by cooking spread faster than those in the other cases and could thus be rapidly diffused to adjacent spaces like the living room, and they consequently have negative impacts on the occupants’ health. Therefore, there is a need for strategies to minimize the diffusion of cooking-generated particles into other spaces through the introduction of proper ventilation systems.

Acknowledgments

This subject is supported by Korea Ministry of Environment (MOE) as “Advanced Technology Program for Environmental Industry”.

Author Contributions

Hyungkeun Kim developed the proposed research, performed field measurement and occupant health risk assessment, and wrote the paper; Kyungmo Kang supported field measurement and reviewed relevant literature; Taeyeon Kim helped to develop the main idea of this study and revised the manuscript.

Conflicts of Interest

The authors declare no conflict of interest.

References

  1. Dennekamp, M.; Howarth, S.; Dick, C.A.; Cherrie, J.W.; Donaldson, K.; Seaton, A. Ultrafine particles and nitrogen oxides generated. Occup. Environ. Med. 2011, 58, 511–516. [Google Scholar] [CrossRef]
  2. Ko, Y.C.; Cheng, L.S.; Lee, C.H.; Huang, J.J.; Huang, M.S.; Kao, E.L.; Wang, H.Z.; Lin, H.J. Chinese food cooking and lung cancer in women nonsmokers. Am. J. Epidemiol. 2000, 151, 140–147. [Google Scholar] [CrossRef] [PubMed]
  3. Yu, K.P.; Yang, K.R.; Chen, Y.C.; Gong, J.Y.; Chen, Y.P.; Shih, H.-C.; Lung, S.-C.C. Indoor air pollution from gas cooking in five Taiwanese families. Build. Environ. 2015, 93, 258–266. [Google Scholar] [CrossRef]
  4. He, C.; Morawska, L.; Hitchins, J.; Gilbert, D. Contribution from indoor sources to particle number and mass concentrations in residential houses. Build. Environ. 2004, 38, 3405–3415. [Google Scholar] [CrossRef] [Green Version]
  5. Chiang, C.M.; Chang, K.F.; Lee, C.Y.; Chou, P.C. Modelling and monitoring natural ventilation for conventional kitchens in Taiwan with transoms replaced with porous screens. Indoor Built Environ. 2006, 15, 173–178. [Google Scholar] [CrossRef]
  6. Lai, A.C.K.; Chen, F.Z. Modeling of cooking-emitted particle dispersion and deposition in a residential flat: A real room application. Build. Environ. 2007, 42, 3253–3260. [Google Scholar] [CrossRef]
  7. Lai, A.C.K.; Ho, Y.W. Spatial concentration variation of cooking-emitted particles in a residential kitchen. Build. Environ. 2008, 43, 871–876. [Google Scholar] [CrossRef]
  8. Gao, J.; Cao, C.; Xiao, Q.; Xu, B.; Zhou, X.; Zhang, X. Determination of dynamic intake fraction of cooking-generated particles in the kitchen. Build. Environ. 2013, 65, 146–153. [Google Scholar] [CrossRef]
  9. Gao, J.; Cao, C.; Zhang, X.; Luo, Z. Volume-based size distribution of accumulation and coarse particles (PM0.1–10) from cooking fume during oil heating. Build. Environ. 2013, 59, 575–580. [Google Scholar] [CrossRef]
  10. Gao, J.; Jian, Y.; Cao, C.; Chen, L.; Zhang, X. Indoor emission, dispersion and exposure of total particle-bound polycyclic aromatic hydrocarbons during cooking. Atmos. Environ. 2015, 120, 191–199. [Google Scholar] [CrossRef]
  11. Nazaroff, W.W. Indoor particle dynamics. Indoor Air 2004, 7, 175–183. [Google Scholar] [CrossRef] [PubMed]
  12. Pope, C.A., III. Epidemiology of Fine Particulate Air Pollution and Human Health: Biologic Mechanisms and Who’s at Risk? Environ. Health Perspect. 2000, 108, 713–723. [Google Scholar] [CrossRef] [PubMed]
  13. Hodas, N.; Loh, M.; Shin, H.M.; Li, D.; Bennett, D.; McKone, T.E.; Jolliet, O.; Weschler, C.J.; Jantunen, M.; Lioy, P. Indoor inhalation intake fractions of fine particulate matter: Review of influencing factors. Indoor Air 2016, 26, 836–856. [Google Scholar] [CrossRef] [PubMed]
  14. Morawska, L.; Afshari, A.; Bae, G.N.; Buonanno, G.; Chao, C.Y.; Hänninen, O.; Hofmann, W.; Isaxon, C.; Jayaratne, E.R.; Pasanen, P. Indoor aerosols: From personal exposure to risk assessment. Indoor Air 2013, 23, 462–487. [Google Scholar] [CrossRef] [PubMed] [Green Version]
  15. United States Environmental Protection Agency (EPA). Risk Assessment Guidance for Superfund Volume 1 Human Health Evaluation Manual (Part A); EPA/540/1-89/002; EPA: Washington, DC, USA, 1989; Volume 1.
  16. Cannistraro, G.; Cannistraro, M.; Cannistraro, A.; Galvagno, A. Analysis of Air Pollution in the Urban Center of Four Cities Sicilian. Int. J. Heat Technol. 2016, 34, S219–S225. [Google Scholar] [CrossRef]
  17. Mauro, C.; Lorenzini, E. The Applications of the New Technologies “E-Sensing” in Hospitals. Int. J. Heat Technol. 2016, 34, 551–557. [Google Scholar]
  18. National Research Council Committee on the Institutional Means for Assessment of Risks to Public Health. Risk Assessment in the Federal Government: Managing the Process; National Academies Press: Washington, DC, USA, 1983; ISBN 0-309-03349-7.
  19. Integrated Risk Information System (IRIS), U.S. Environmental Protection Agency (EPA). Available online: https://www.epa.gov/iris (accessed on 15 March 2018).
  20. Jang, J.Y.; Jo, S.N.; Kim, S.J.; Myung, H.N.; Kim, C.I. General Factors of the Korean Exposure Factors Handbook. J. Prevent. Med. Public Health 2014, 47, 7–17. [Google Scholar] [CrossRef] [PubMed]
  21. United States Environmental Protection Agency (US EPA). Risk Assessment Guidance for Superfund Volume 1: Human Health Evaluation Manual (Part F, Supplemental Guidance for Inhalation Risk Assessment); EPA-540-R-070-002; EPA: Washington, DC, USA, 2009.
  22. Greene, N.A.; Morris, V.R. Assessment of Public Health Risks Associated with Atmospheric Exposure to PM2.5 in Washington, DC, USA. Int. J. Environ. Res. Public Health 2006, 3, 86–97. [Google Scholar] [CrossRef] [PubMed]
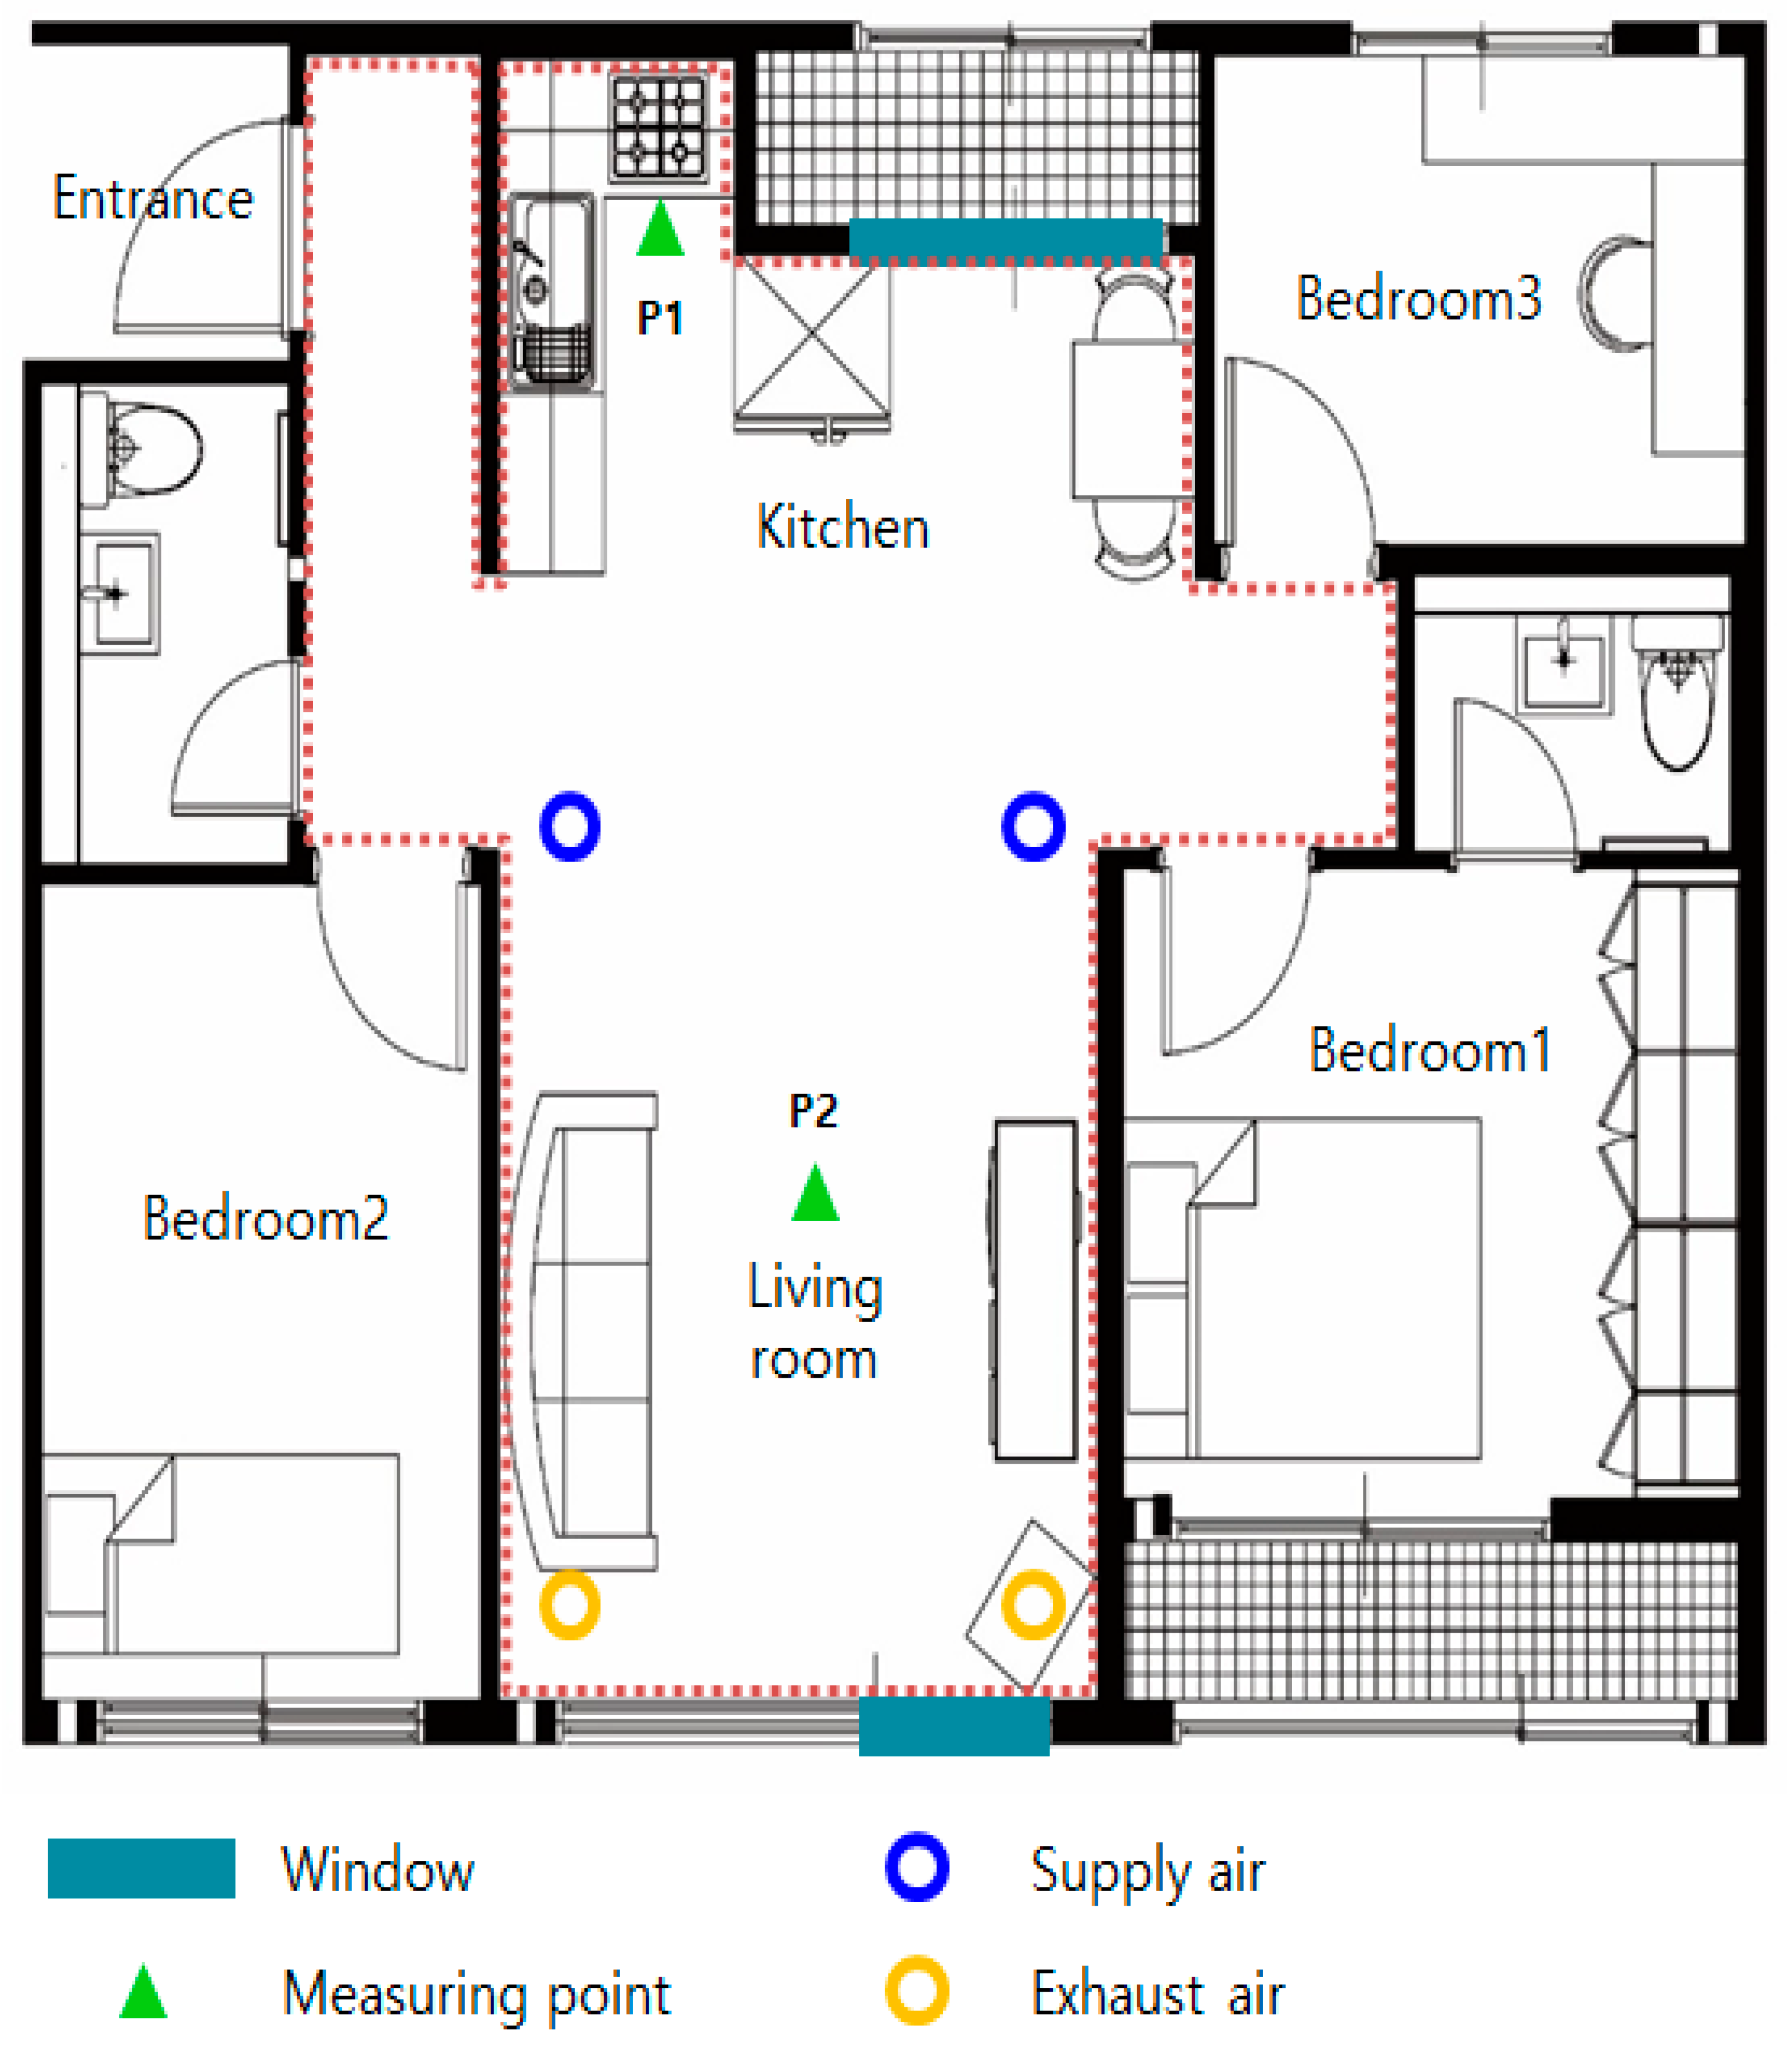
Figure 1. Location of measuring points and ventilation system on the plane section.
Sustainability 10 00843 g001
Figure 2. Position of particle measuring equipment in the living room and kitchen.
Sustainability 10 00843 g002
Figure 3. Measurement schedule of cooking conditions.
Sustainability 10 00843 g003
Figure 4. Assessment of the risk posed by PM2.5 on human health.
Sustainability 10 00843 g004
Figure 5. Emission rate of PM2.5 by cooking condition.
Sustainability 10 00843 g005
Figure 6. Distribution of PM2.5 by cooking condition. (a) distribution of PM2.5 in the kitchen; (b) distribution of PM2.5 in the living room.
Sustainability 10 00843 g006aSustainability 10 00843 g006b
Table 1. Ventilation systems used in the case studies.
VentilationWindow OpeningAirflow Rate (CMH; m3/h)
Case 1NV (supply) + rangehoodSingle-sided (southern window)153
Case 2NV (supply) + rangehoodDouble-sided (southern, northern windows)154
Case 3MV (supply) + rangehood-154
Table 2. Input data for health risk assessment.
FactorsValueReference
Inhalation rate14.25 m3/dayJang et al., 2014 [20]
Body weight62.8 kgJang et al., 2014 [20]
Exposure duration24 h-
Average time70 yearsUSEPA data [21]
Unit risk (PM2.5)0.008 µg/m3Natasha G. et al., 2006 [22]
Table 3. Decay rate and average concentration in each case.
CaseLocationDecay RateAverage Conc. (µg/m3)
Case 1Kitchen−0.0827t + 5.890326.81
Living room−0.0978t + 6.423724.99
Case 2Kitchen−0.0328t + 3.173023.91
Living room−0.0372t + 2.886622.96
Case 3Kitchen−0.0438t + 4.592026.15
Living room−0.0528t + 7.133825.25
Table 4. Results of the health risk assessment.
Risk FactorLocationBaseCase 1Case 2Case 3
SF8.02 × 10−6
LADDKitchen4.546.085.435.93
Living room5.675.215.73
ELCRKitchen3.64 × 10−54.88 × 10−54.35 × 10−54.76 × 10⁻⁵
Living room4.55 × 10−54.18 × 10−54.59 × 10−5