1. Introduction
Urban transportation has a far-reaching influence on a city’s sustainable development, particularly for emerging cities whose economies are developing rapidly alongside massive urban sprawl [
1,
2,
3]. An appropriate transportation system will be able to support the economy and social activities, as well as contribute to environmental protection and resource-effective utilization [
4]. The increasing population of China’s emerging cities has exerted tremendous pressure on the demand for urban transportation [
5]. According to the National Bureau of Statistics of China (NBS), private vehicle ownership in China grew by an average of 19.7% annually between 2006 and 2015 to over 140 million vehicles and is predicted to grow by at least as much into the foreseeable future [
6]. However, during the same period (2006–2015) urban roads in China only grew by 3.5% annually [
6]. The higher rate of increase in car ownership over that of the increase in roads means that the road carrying capacity in emerging cities cannot cope with a further increase in transport demand [
5]. This is evidenced by insufficient transport facilities, inefficient transport systems, urban congestion, and tail gas and noise pollution. As this situation is more serious in emerging cities in China, it is a pressing issue for policy makers in such cities to develop appropriate urban transportation systems to ensure that the cities will be able to develop sustainably [
7]. There are reports suggesting that emerging cities can only enjoy a few more years of booming times because of unsustainable transportation systems. In the case of Seoul for example, which was an emerging city in the 1980s, car ownership per thousand people increased more than 10 times from 1980 to 2000. Despite the local government’s efforts to overcome infrastructural constraints through implementing large-scale urban construction projects, Seoul has become increasingly congested because of the uncontrolled proliferation of private vehicles [
8]. Some emerging cities in Southeast Asia in the 1970s, such as Bangkok, Jakarta, and Manila, attempted to apply the Japanese urban rail transportation system. However, these attempts were not successful because of inadequate strategies. A typical urban area in Japan is characterized by a large urban area and a densely populated city center, with the whole urban region connected by an extensive and prestigious rail network. However, most of the emerging cities in Southeast Asia in the 1970s, such as Manila, were experiencing rapid growth rates and had weak urban centers, for which a rail network system was not suitable or effective [
9]. Cities like Manila still suffer from unsustainable transportation systems. Although emerging cities have taken measures such as parking controls, reserved bus lanes, and carpooling to help deal with unsustainable transportation problems [
9], a study by Rimmer suggested that these measures have little effect [
10]. Another case is that of Bangalore, an Indian city famous for its information and telecommunication industry, which has been attracting migration through providing better employment, education, and higher living standards. In the 1990s, this emerging city witnessed a tremendous rise in the number of motor vehicles, which caused serious transport congestion. As the local government could not formulate sustainable transportation strategies fast enough, urban congestion seriously affected local enterprises’ productivity and many enterprises moved to other cities [
11]. Among the many challenges encountered in emerging cities, the most serious ones include an exponential increase in population, the uncontrolled increase of private vehicles, and insufficient investment in transportation infrastructure, all of which leads to the unsustainable development of emerging cities, especially in Asia [
5]. This further highlights the importance of adopting sustainable strategies for transportation development in emerging cities.
Emerging cities in China have also encountered transportation challenges. Stimulated by rapid urbanization, there have been many emerging urban areas in Beijing since the late 1980s along with a dramatic increase in vehicles. The principal strategy adopted by the government is the development of large-scale road systems to address the pressure on transport. However, studies have shown that the strategy of only emphasizing road development does not ease congestion [
12]. In recent years, the Beijing government has adopted a comprehensive framework of transportation development strategies, including increased investment in transportation, prioritizing public transportation development, implementing transport demand management (TDM), and improving transportation management with innovative technologies. However, the effects of these measures are very limited, and the congestion in the emerging urban areas of Beijing is still serious [
13]. Shenzhen is a typical new city in China that emerged in the late 1980s and has been adopting different transportation development strategies from those used in the new emerging urban areas of Beijing. The total number of urban car ownership in Shenzhen has increased rapidly since the turn of the century, with an average annual growth rate of over 20% [
14]. The Shenzhen government copied the transportation development strategy used in Hong Kong and Singapore by making public transportation a priority. In line with this strategy, specific measures have been implemented, including the development of convenient bus lines, investing in rail transport systems, and improving the efficiency of transport management. All of these measures have been integrated to form an appropriate transport system to support sustainable social and economic development. The above discussion highlights the importance of applying sustainable transport development strategies to emerging cities. The rapid urbanization of China means an increasing number of emerging cities or emerging urban areas, and as a result an increased demand for transportation. However, it appears that sustainable strategies for transport development are being overlooked in China.
Sustainable transportation, an expression of sustainable development in the transportation sector, may be defined in different ways, although it is generally accepted that it must satisfy current transport and mobility needs without compromising the ability of future generations to meet these needs [
15,
16,
17,
18]. Mobility is a fundamental requirement for the satisfaction of the human desire to socially and economically engage in society [
19,
20]. However, many researchers have realized that the growing mobility demand is a severe challenge to the realization of sustainable transportation development.
Banister suggests that transport planning should be flexibly based on the mechanism of travel behavior in order to meet sustainable mobility requirements [
21]. He developed an urban sustainable transportation system to analyze transport policy measures, including reducing travel demand, modal shift, rational land-use, and technological innovations.
Potter performed a macro-level analysis to explore strategic approaches that can achieve overall sustainability for ground level personal transport systems [
22]. He analyzed a separate range of measures involving more of a systems approach, including light rail and innovative public transport systems, publicly shared bicycle schemes, carpooling, car clubs, and pricing mechanisms, concluding that a single approach cannot have a long-term effect on sustainable transport development. Although Potter’s study resulted in a framework to identify targets and strategies for sustainable transport development, it cannot make an integrated assessment of both the positive and negative impacts of transportation. Khattak discussed sustainable transportation policies and assessed their potential in the U.S. context [
23], but failed to address the shortcomings of Potter’s framework.
Borzacchiello [
24], Yigitcanlar [
25] and Rai [
26] evaluated and revised transport policies by developing an information system and analyzing the obtained data. This new approach can assist planners and policy makers with sustainable transport planning by allowing for the consideration of the strategic elements that influence their decision. However, the information system requires financial fund investment, which is not forthcoming from the governments of many emerging cities in China, and most such cities also lack comprehensive statistics for data analysis.
In recent years, Pucher focused his research on the sustainable urban transport policies of European cities by using a case study approach [
27,
28,
29,
30]. He found that the key to the success of these cities is a coordinated package of mutually reinforcing transport and land-use policies that have made car use slower, less convenient, and more costly, while increasing the safety, convenience, and feasibility of walking, cycling, and public transport. This concurs with Koglin [
31,
32]. However, these European cities and China’s emerging cities are at different stages of development. Most European cities have completed urbanization, and urban sprawl has become very slow. In European cities, transport policies focus more on the micro level of traffic improvement, while China’s emerging cities still confront large-scale transport investment and construction to tackle city congestion and promote their economy’s further development. Thus decision-makers in China need to consider both transportation demand and sustainable development rather than simply copying the experience of European cities.
The above review of existing relevant literature reveals a lack of studies presenting an approach for assessing the applicability and effectiveness of different transportation development strategies in China’s emerging cities. It is therefore the aim of this paper to introduce a system dynamics (SD) simulation approach to assist decision makers in assessing the effectiveness of different transportation strategies and selecting one that can support the sustainable development of emerging cities in China. This will be done by simulating the possible outcomes of each type of strategy under different scenarios.
The paper is structured as follows: the following section explains how the system dynamics method is used to analyze the structure of transportation systems in emerging cities and formulate a platform for conducting simulation analysis.
Section 3 uses the emerging city of Shenzhen in China as a case study for an SD simulation approach to analyzing the effectiveness of different types of strategies for supporting the city’s sustainable development.
Section 4 selects and defines the optimum strategies as well as draws a conclusion to the study.
2. Systems Dynamics Methodology
This paper applies a system dynamics approach to simulate and validate the consequences of different transportation development strategies in emerging cities within the context of China. System dynamics, as a methodology developed from system theory, information science, and cybernetics, is specifically designed for analyzing large-scale and complex socio-economic systems [
33,
34]. By using this methodology in previous studies, the behavior of a complex system, such as a transportation system over time, was simulated [
35]. The purpose of conducting a system dynamics simulation is to understand the possible outcomes of different strategies under different circumstances, thus better strategies can be identified and implemented [
36]. The system dynamics simulation methodology has been widely applied in transportation related fields, such as energy policies for alternative fuel vehicles, management for transport supply chain, highway maintenance and construction, and transportation land use [
37,
38,
39].
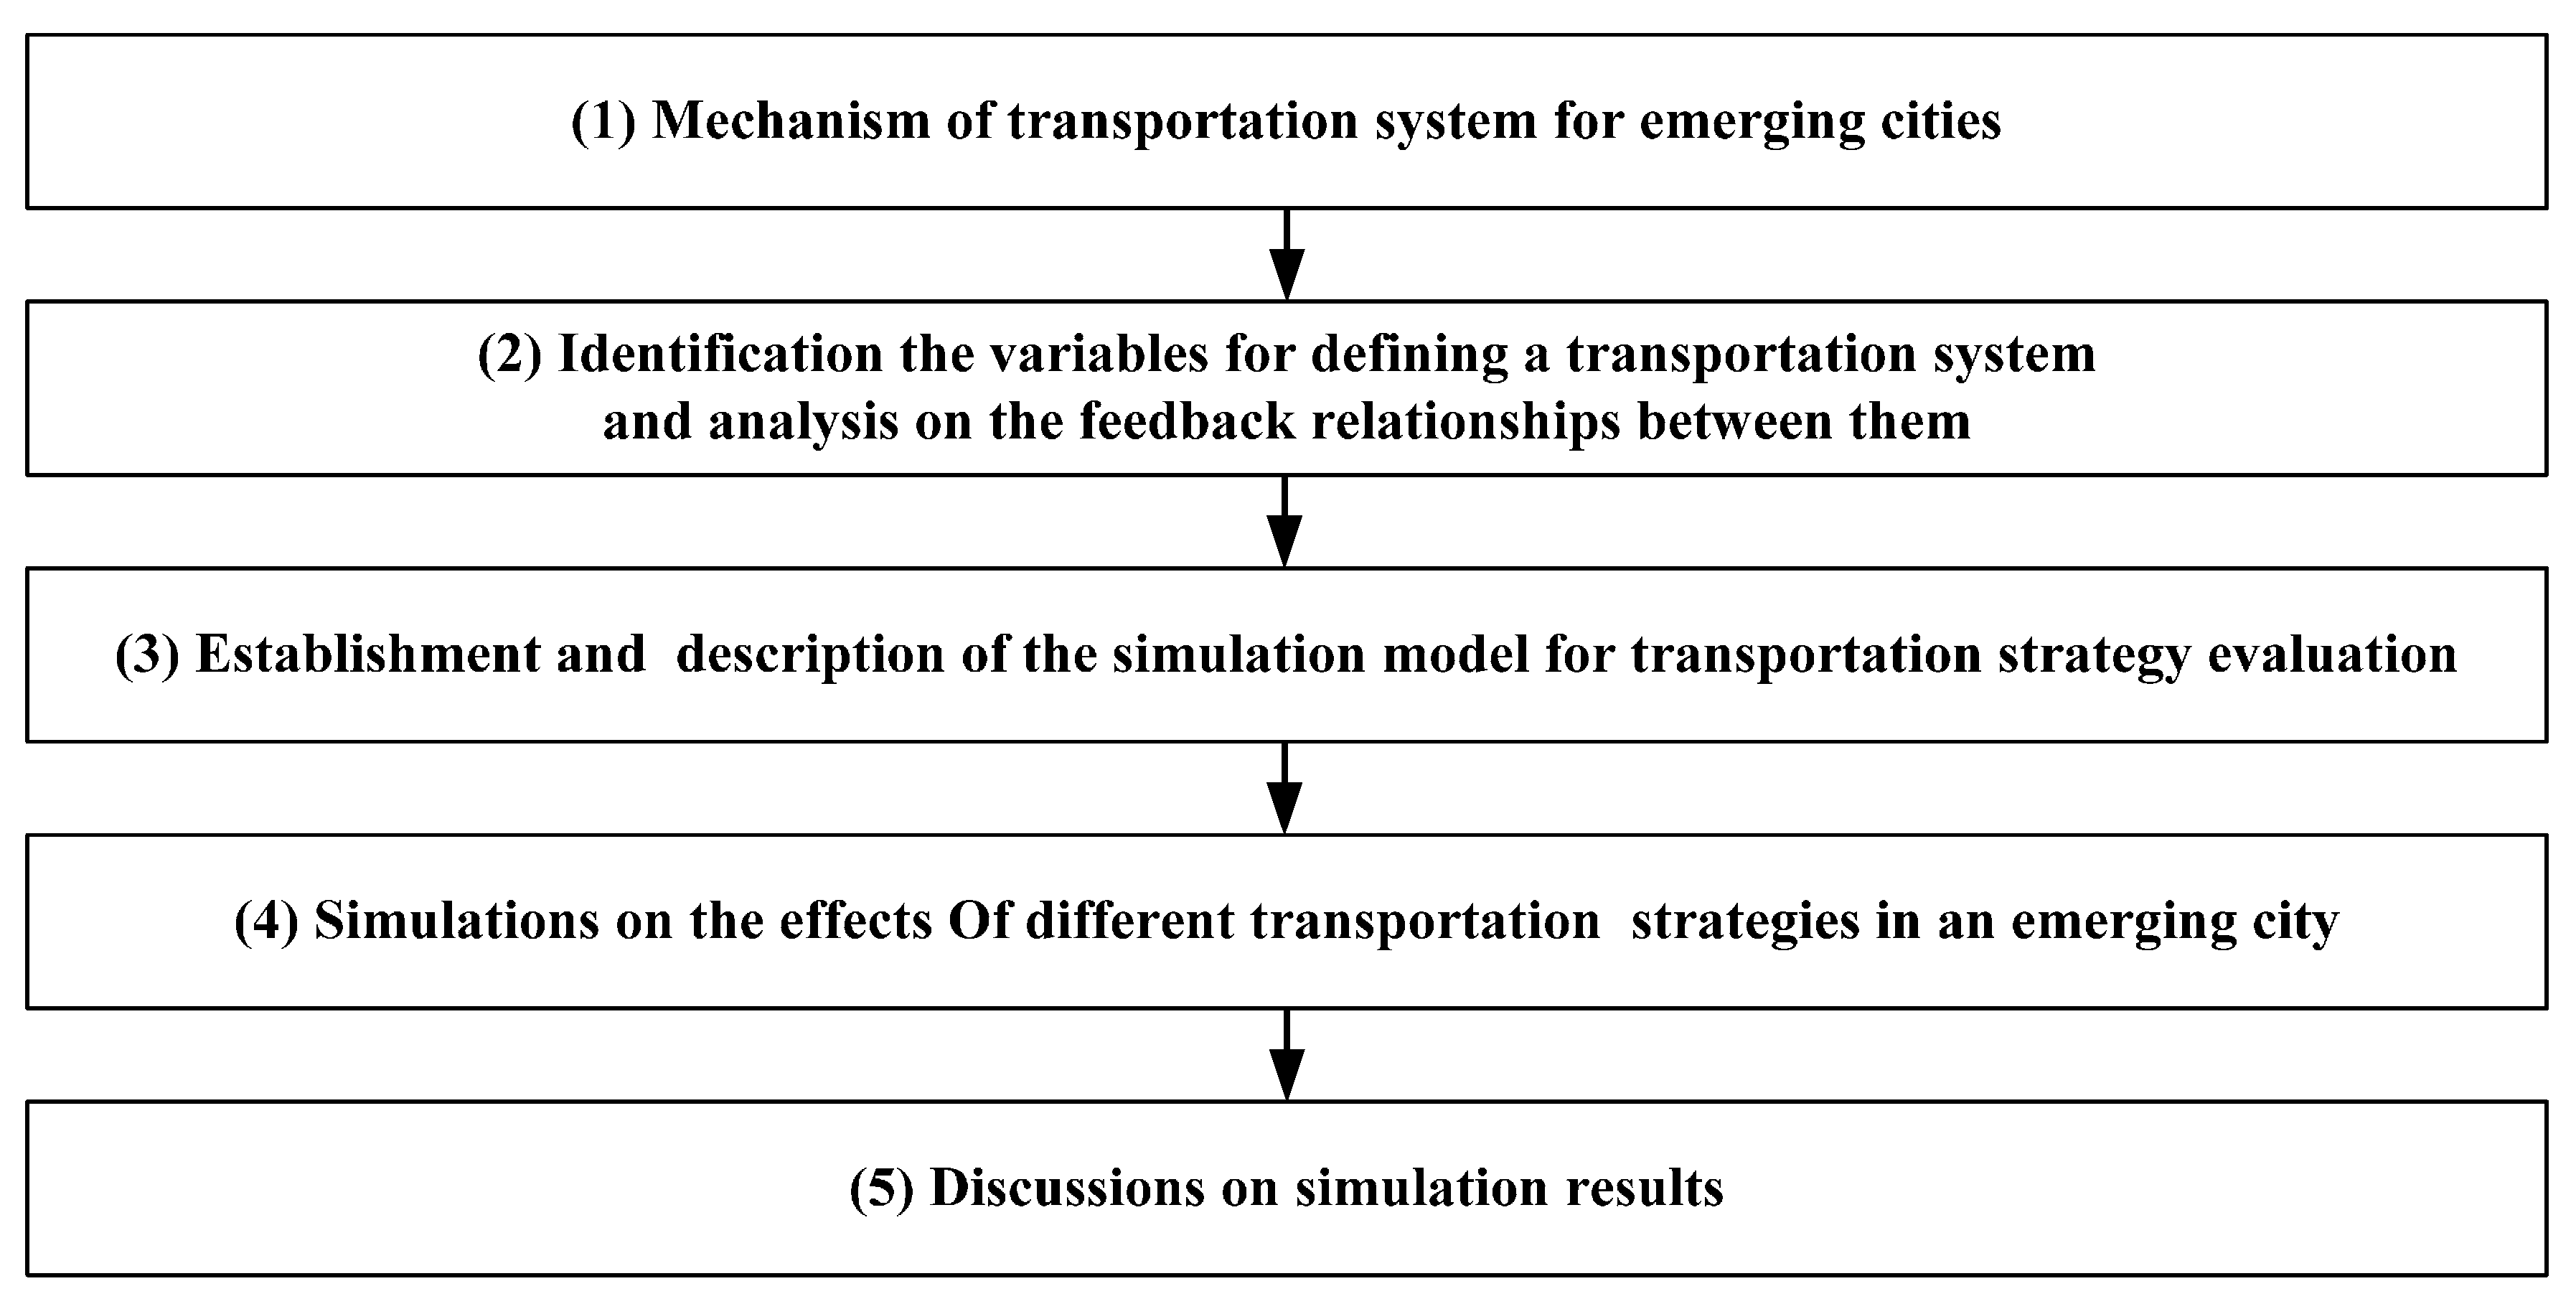
System dynamics is a structured tool of analysis and a simulation methodology. In this study, the simulation approach is applied to assess to what extent defined objectives can be achieved in adopting a specific transportation strategy. There are five procedures involved in the methodology for this study, as shown in
Figure 1. The first procedure is to understand the objective of the transportation system for emerging cities. Secondly, the variables of a transportation system are identified and the relationship between the variables analyzed. Procedure three is the construction of a simulation model for evaluating the consequences of adopting transportation strategies. Procedure four involves a simulation of the possible outcomes of adopting different transportation strategies for the case study city, and procedure five is a discussion of the case study simulation results in order to demonstrate the application of the simulation approach. It should be noted that the case study (Procedures four and five) is independent of
Section 3.
2.1. Mechanism of the Transportation System for Emerging Cities in China
In line with the acceleration of the urbanization process in China in recent years, there are many emerging cities, such as Shenzhen, Zhuhai, and Zhengzhou, where the development of transportation systems is under tremendous pressure. According to a study by Dong and Chen, there is a shortage of transport in emerging cities in China [
40,
41] and there have been loud calls for appropriate transportation development strategies in order to reduce or eliminate the associated urban congestion. High costs are associated with inappropriate transportation strategies in emerging cities [
42].
The goal of transportation development systems should be to “meet the needs of the present without compromising the ability of future generations to meet their own needs” [
43]. The development of transportation needs should not only be to meet the current demand, but to also support long-term development. Therefore, the long-term impacts of transportation development strategies should be properly assessed before their implementation. The urbanization of emerging cities can provide job opportunities, which in turn attract people to migrate to those cities [
11]. The increasing population stimulates the development of the local business, which further promotes people’s movement and induces the demand for transportation infrastructure [
44]. The implementation of transportation projects brings with it an increase of investment in transportation infrastructure, which further stimulates economic growth [
7,
45]. It can be seen that there are complex causal relationships between social economic growth and transport supply and demand in an emerging city. Emerging cities in China are experiencing a rapid urbanization process, with a high rate of economic but also the problem of urban congestion. It has been reported that transport congestion in China is worsening, and that it will continue to intensify [
46].
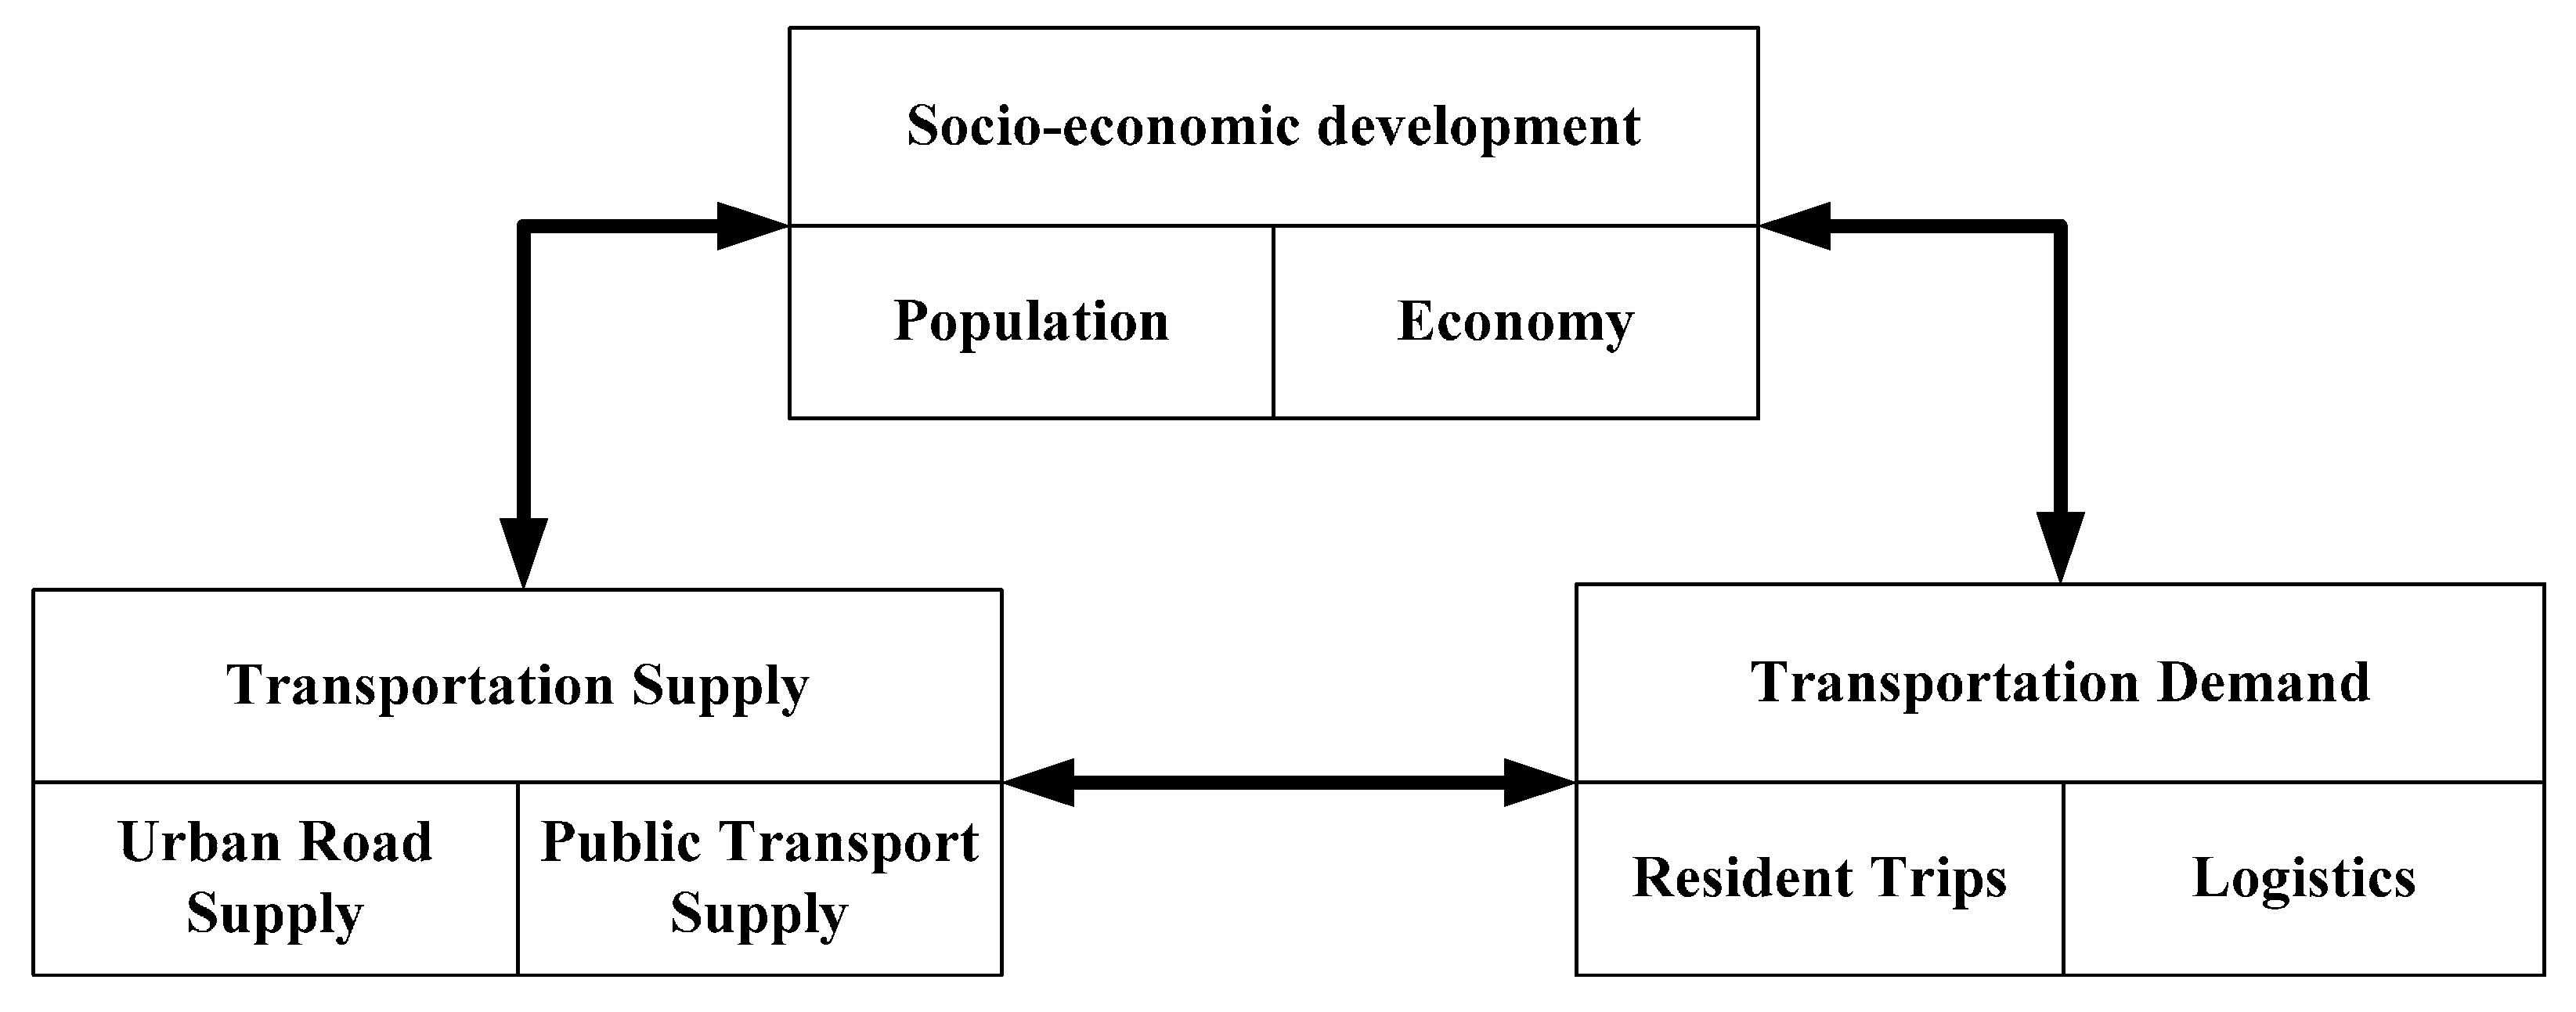
Figure 2 shows a conceptual model that describes an urban transportation system. The socio-economic dimension includes two elements, namely, population and urban economy, which are the main influencing factors of urban transportation development [
47]. Transport demand comes from people’s social life and their economic activities, which can be divided into two parts: resident trips and logistics. In order to meet transport demand, the government must provide the necessary infrastructure and services [
47,
48]. The road system and the public transportation system are the two major aspects of transport supply in China’s emerging cities [
12], which are the two elements for describing the dimensions of transport supply. The performance of these elements is affected by various variables, which are illustrated in the following section.
2.2. Variables and Their Feedback Relationships in a Transportation System
Transport supply is implemented by investing in urban road supply and public transport supply, while transport demand is defined by resident trips and logistics. According to previous studies [
49,
50,
51,
52,
53], the variables required to further analyze the proposed conceptual model are listed in
Table 1.
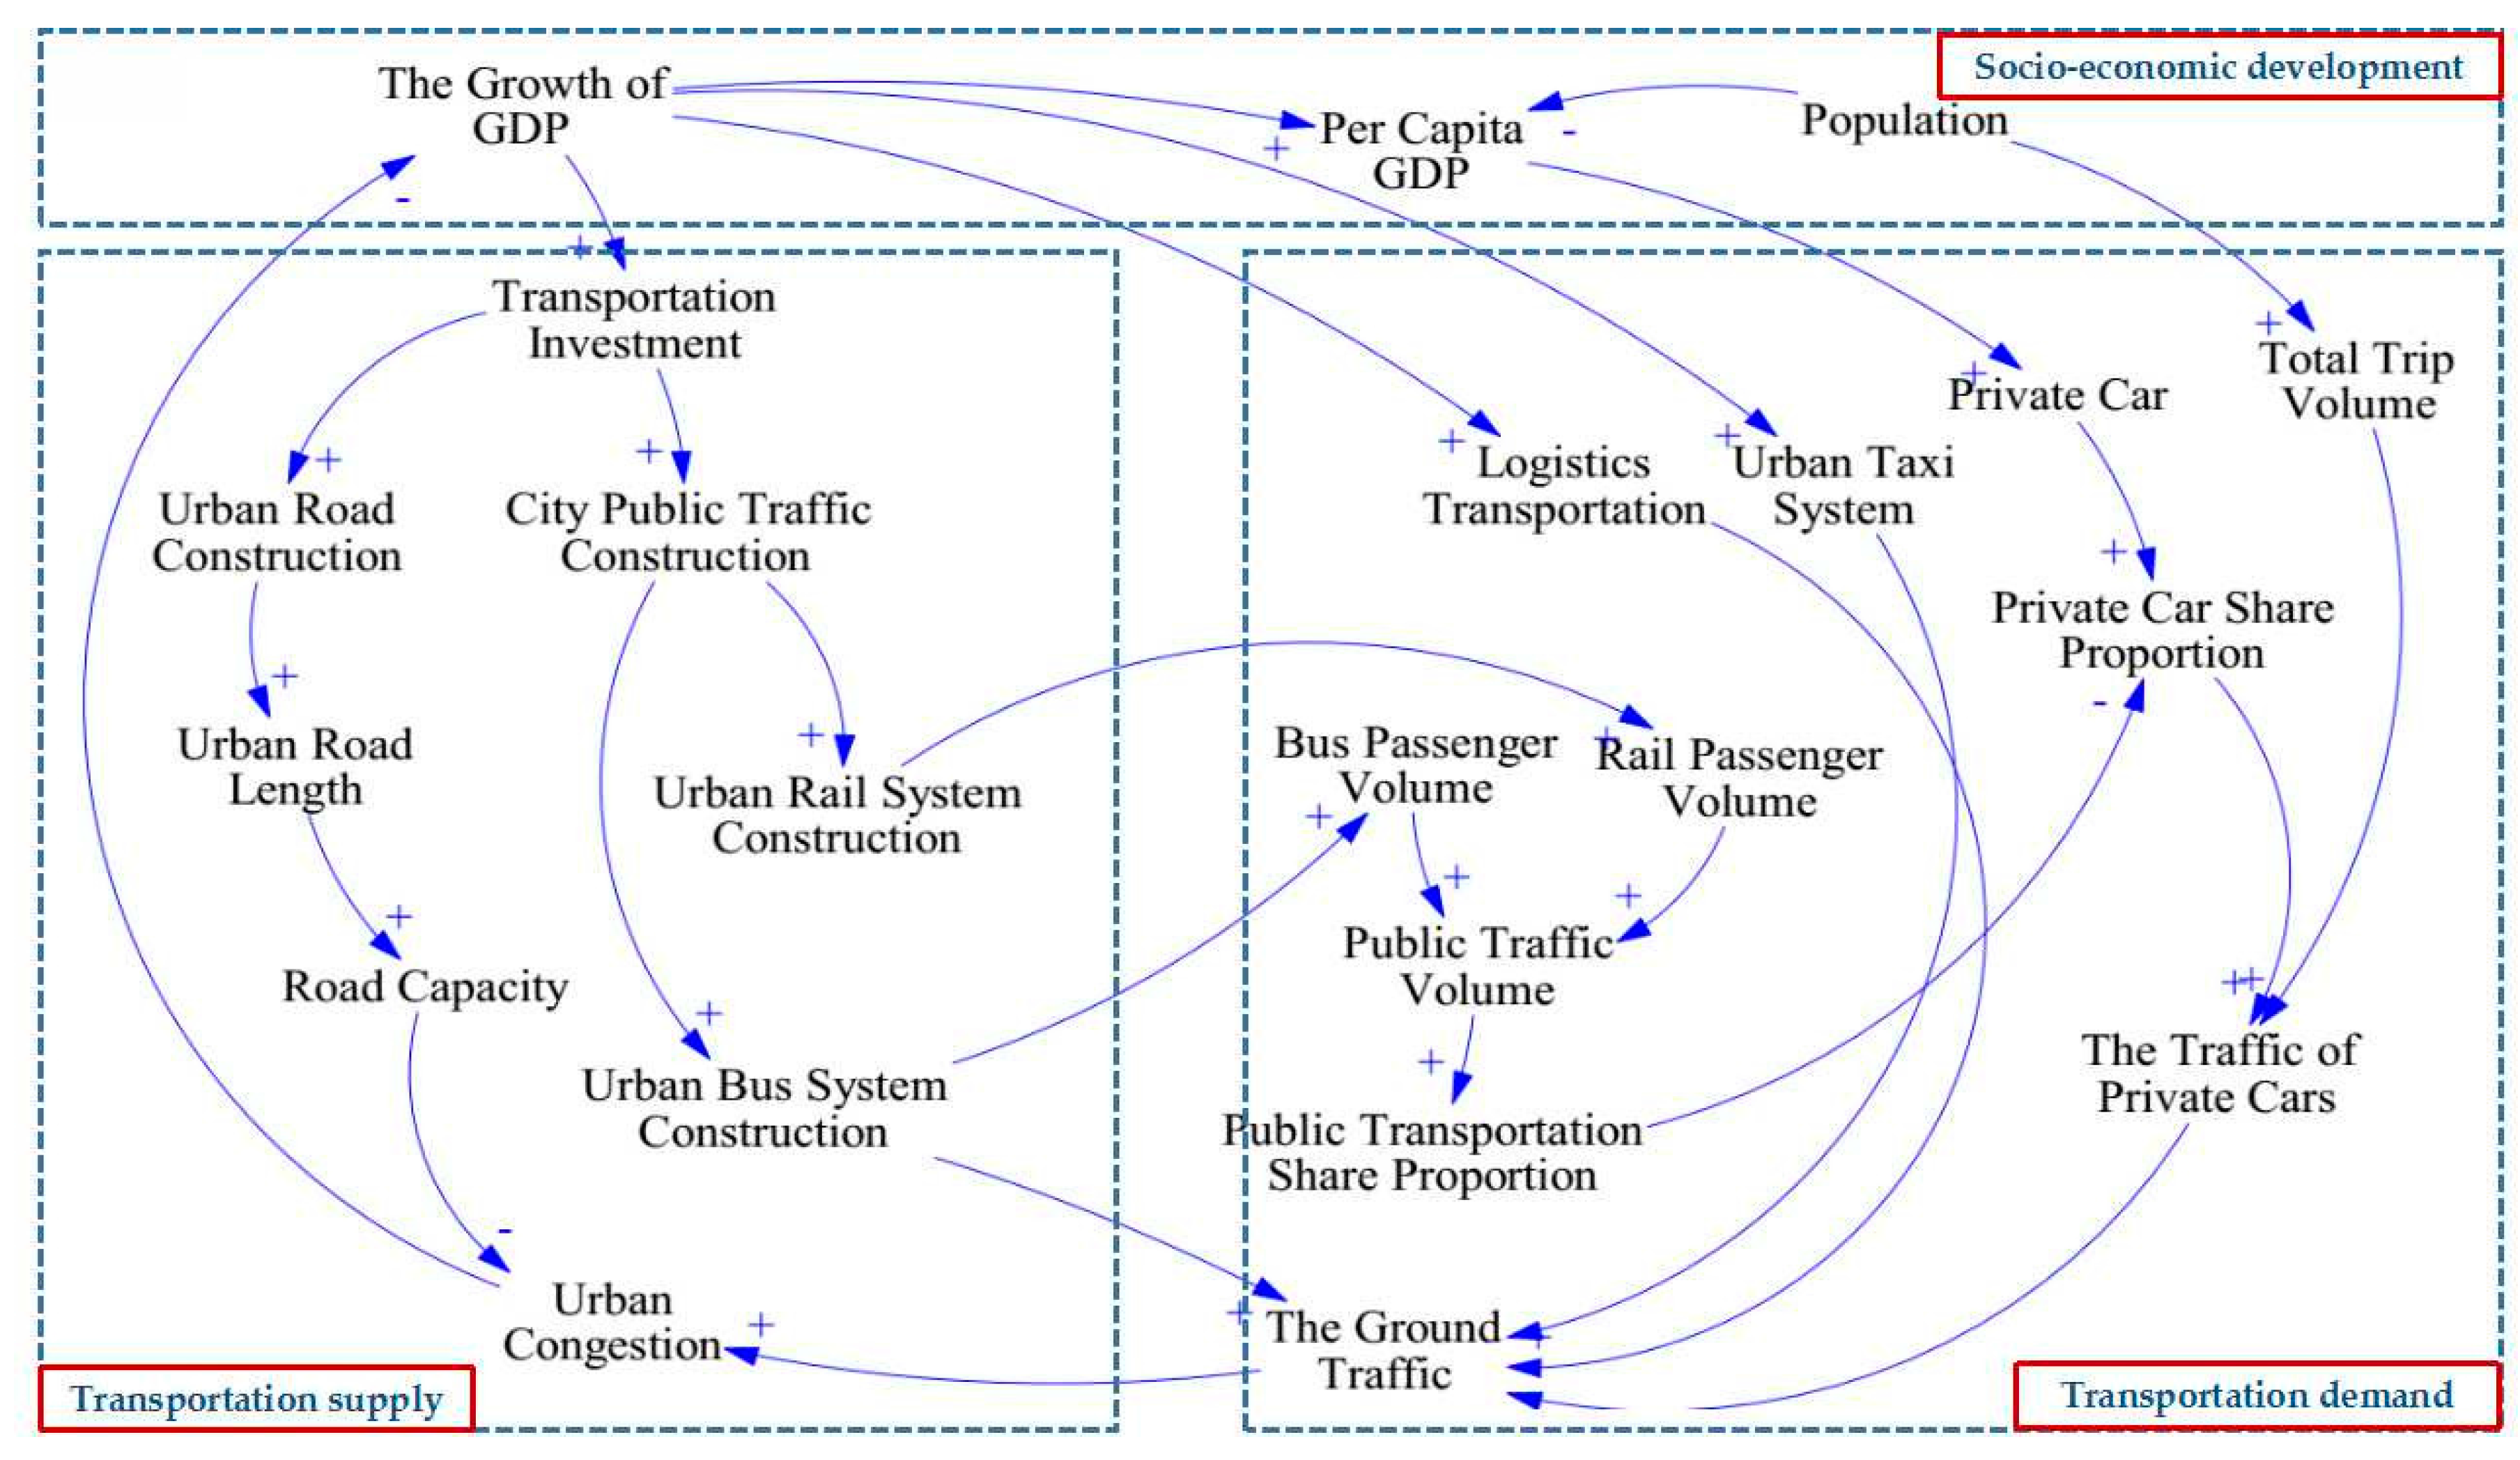
In the process of adopting a SD simulation approach, the interactions among the variables and the feedback mechanisms between the variables can be illustrated with a Causal Loop Diagram (CLD). CLD requirements include defining appropriate feedbacks of the ‘cause’ and ‘effect’ between variables in the form of causal arrow links. A reinforced relationship between two variables is expressed as a positive (+), and a corresponding balancing relationship between two variables is expressed as a negative (−). In line with this approach, the CLD for this study that presents the relationships between the variables and the feedback loops of transportation systems in emerging cities is shown in
Figure 3.
The individual feedback loops have been extracted and are listed in
Table 2, which shows seven such feedback loops. These seven feedback loops are not independent but are interrelated with each other to form a whole and complicated transportation system.
The three reinforcing loops in the CLD could promote the development of transportation systems. Reinforcing Loop 1 includes six variables with the causality of the loop indicating that: if Gross Domestic Product (GDP) growth increased, the government would increase transportation investment to maintain economic growth, a part of the transportation investment increment could be used to build new urban roads, then the capacity of the road network would be improved, urban congestion would be alleviated, and economic development would ultimately be promoted. Reinforcing Loop 2 includes eleven variables and the causality of this loop indicates that: with an improved economy the government would increase investment in public transport, the urban bus system would attract more passengers who would abandon their private cars, ground traffic would then reduce, and the negative impact on economic development would ultimately be reduced. Reinforcing Loop 3 is similar to Reinforcing Loop 2 and includes eleven variables. The causality of this loop indicates that: with an improved economy the government would increase investment in urban rail systems, more residents would use the railway and abandon their private cars, ground traffic would then reduce, and the negative impact on economic development would ultimately be reduced.
Balancing loops could restrain the development of transportation systems. There are four balancing loops in the CLD. Balancing Loop 1 includes four variables and the causality of this loop indicates that: growth of the economy would promote the development of the urban taxi system, which would increase urban congestion and have a negative impact on the economy. Balancing Loop 2 includes four variables and the causality of this loop indicates that: growth of the economy would stimulate the development of logistics, there would be more trucks to meet the demand of logistics, which would increase the pressure on urban roads where congestion would have a negative impact on the economy. Balancing Loop 3 includes six variables and the causality of this loop indicates that: with an improved economy the government would increase investment in the urban bus system, the increment of buses would increase ground traffic and the resulting congestion would have a negative impact on the economy. Balancing Loop 4 includes six variables and the causality of this loop indicates that: with an improved economy more residents could own private cars, usage of cars would increase with private ownership, and the resulting congestion caused by private cars would ultimately have a negative impact on the economy.
2.3. Simulation Model Formulation and Description
In order to analyze the dynamic performance of transportation systems when changing variables are considered, the relationships between variables in the CLD need to be modified by introducing a stock–flow diagram. Vensim DDS 5.6a software, a commonly used tool for conducting system dynamics simulation, is used to construct stock–flow diagrams. The stock–flow structure for the CLD is broken down into three sub-models: the socio-economic development sub-model, the transport demand sub-model, and the transport supply sub-model. These sub-models are explained in detail in the follow sections.
2.3.1. The Socio-Economic Development Sub-Model
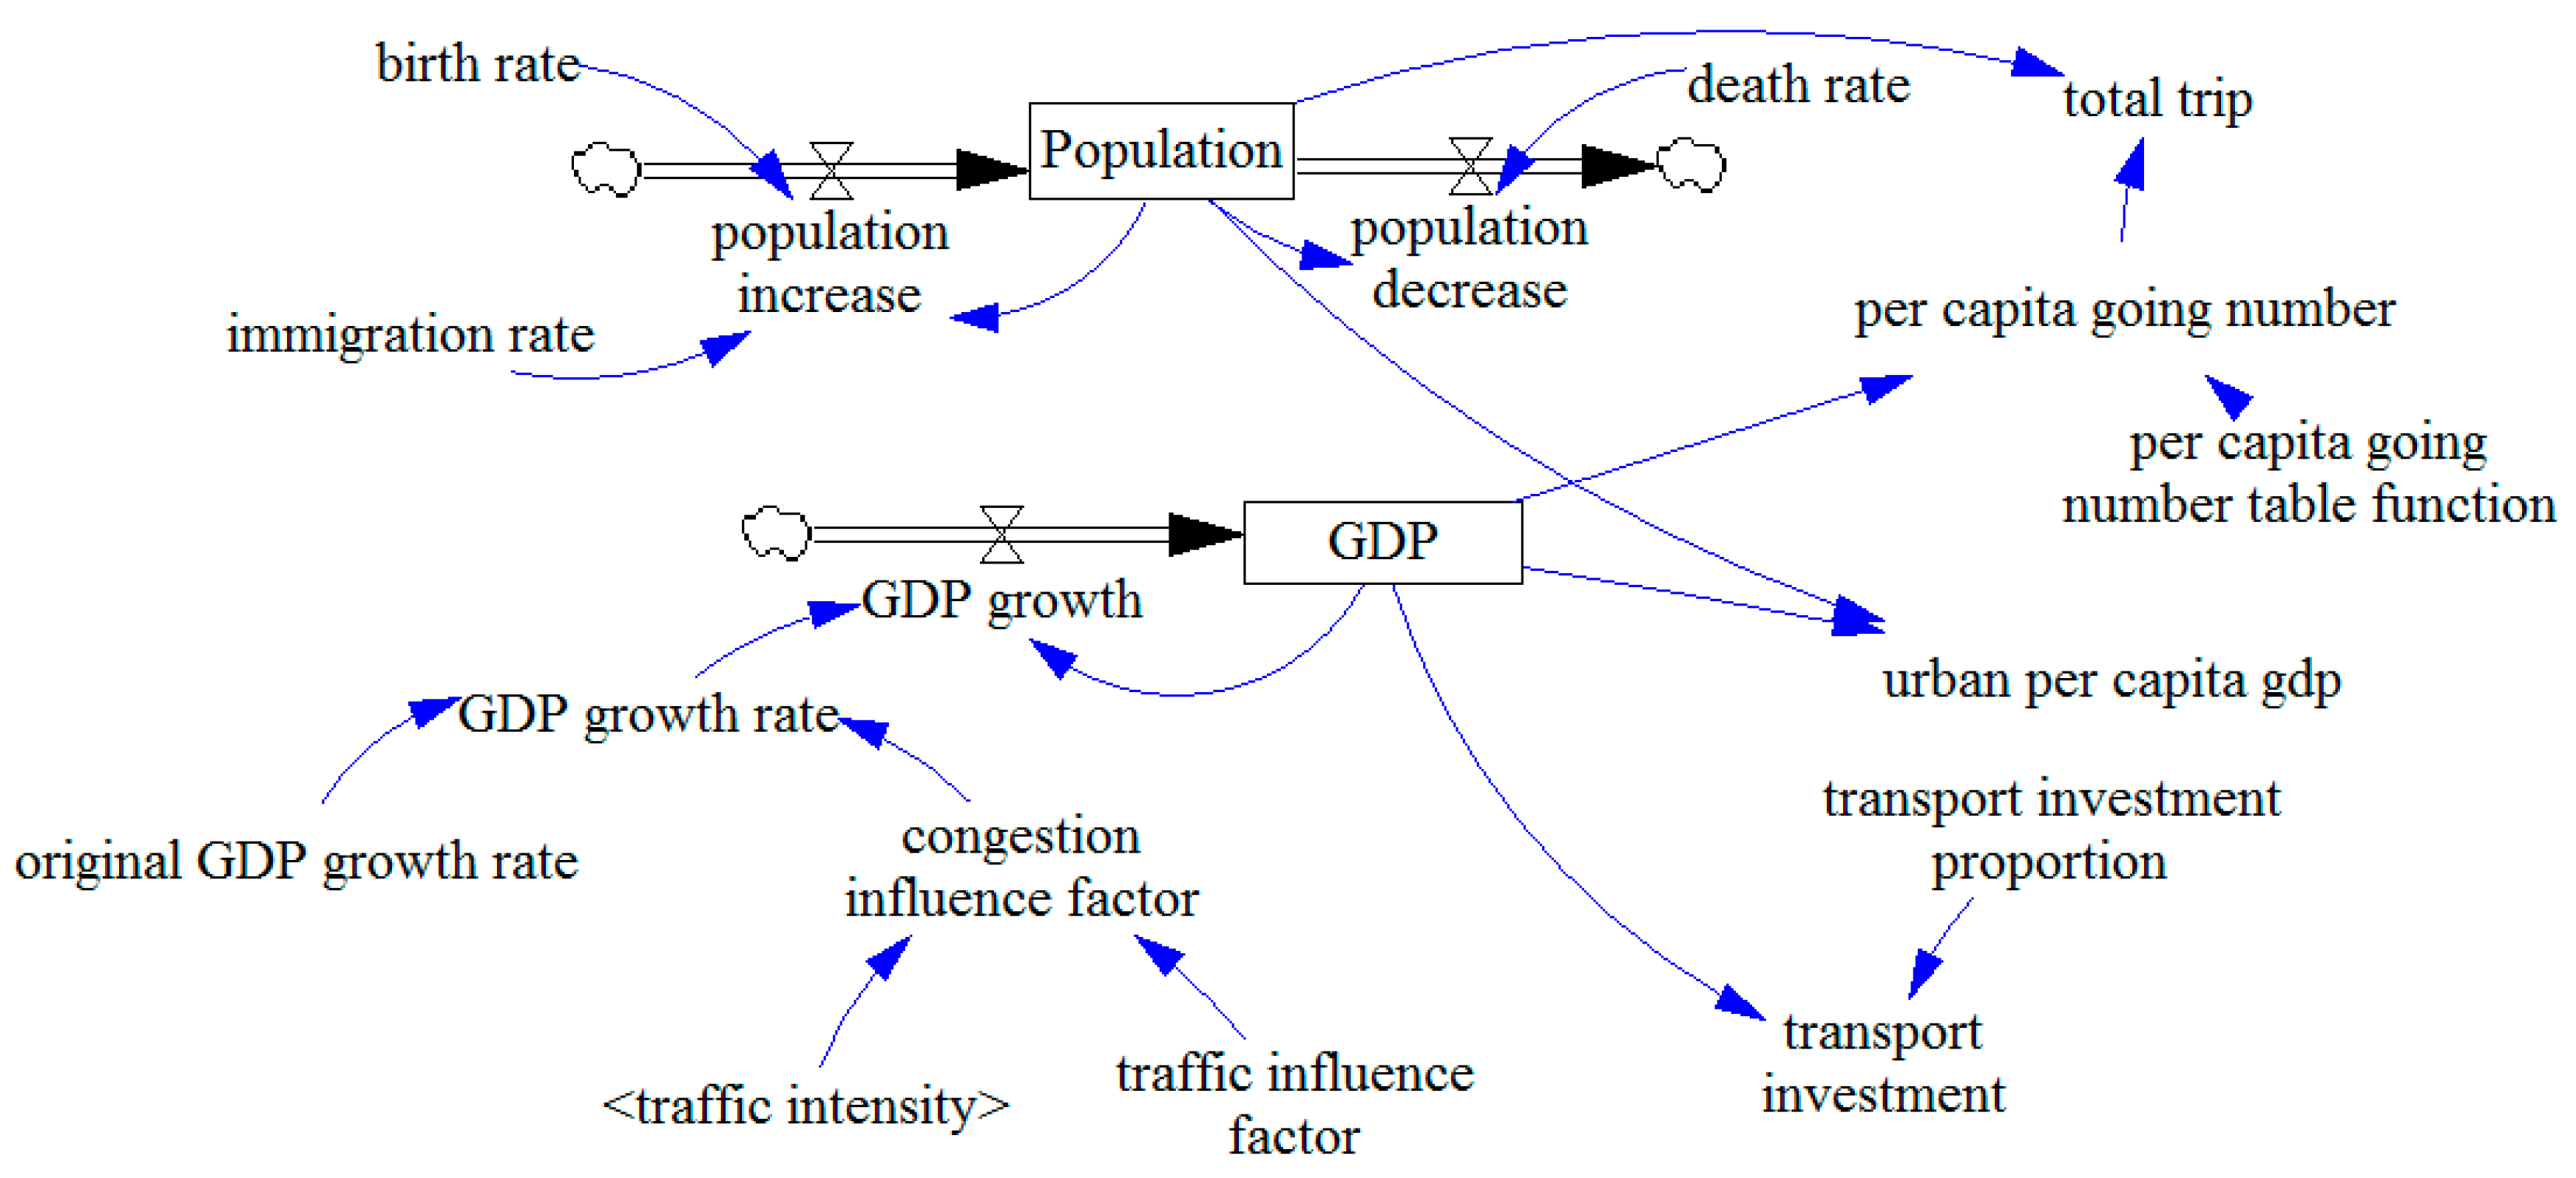
As explained above, economic and social developments are the driving forces for urban transportation development in emerging cities. Both economic development and population growth have significant impacts on urban transport demand. The interrelations between various dynamic variables within the socio-economic development sub-model are presented in
Figure 4. The sub-model includes two stocks, namely, population (P) and GDP. The population stock has one inflow variable, population increase (PI), and one outflow variable, population decrease (PD).
The quantitative relationships between P, PI and PD are shown in Equation (1).
where INTEG means the function of integral,
indicates the population in the start time,
indicates the population in the termination time,
is population increase, and
is population decrease.
The GDP stock has just one inflow variable, GDP Growth (GDPG), in this sub-model. Although GDPG is defined only by the GDP growth rate, GDP growth rate is not only the original GDP growth rate but is also negatively influenced by congestion factors, including road traffic intensity and traffic influence. The quantitative relationships between GDP and GDPG are shown in Equation (2).
where INTEG means the function of integral,
indicates the GDP in the start time,
indicates the GDP in the termination time, and
is GDP Growth. The relevant data of the population and GDP could be obtained from government statistics.
Based on the stock variables of P and GDP, the total trips (TT) of residents could be analyzed. The total trip increases with the growth of population and per capita gonging number (PCGN). PCGN is a function of GDP and derives from the statistics and analysis of historical data. The quantitative relationships of TT, GDP, and P are shown in Equations (3) and (4) respectively.
where WITH LOOKUP means a table function that can establish a functional relation between independent variables and dependent variables through a data table.
indicates the start time,
indicates the termination time.
Through the statistical analysis of historical data, transportation investment (TI) could be obtained from the following Equation (5).
2.3.2. The Transport Demand Sub-Model
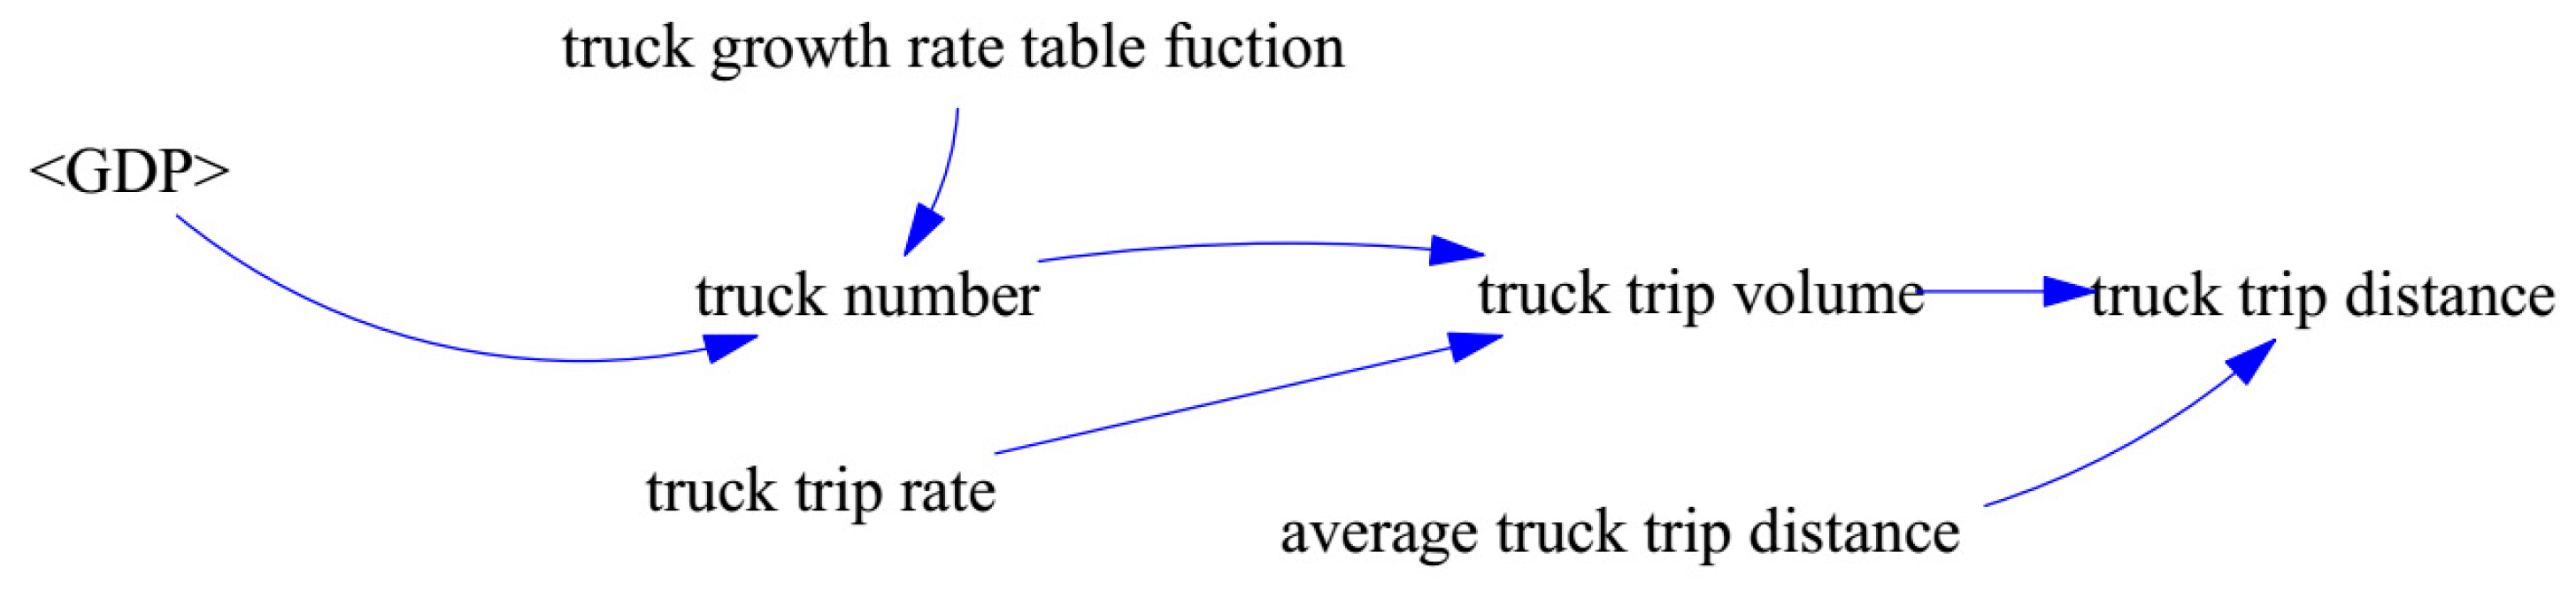
Urban development has brought enormous transport demands in China’s emerging cities. As explained in the previous section, the transport demand consists of resident trips and logistics. The model structure of the logistics transport demand is shown in
Figure 5.
In the stock and flow diagram above, truck is the main conveyance of logistics in emerging cities and should be kept to a certain number for the demand of freight. The truck number (TRN) is defined as the transportation substitute of logistics. The functional relationship between the TRN and GDP is shown in Equation (6). The truck trip volume (TTV) can be calculated by the truck trip rate (TTR), which can be obtained statistically as shown in Equation (7).
where WITH LOOKUP means table function,
indicates the GDP in the start time,
indicates the GDP in the termination time. Truck trip distance can be calculated by the TTV and average truck trip distance, which can be obtained by Origin–Destination (OD) data from the transportation department.
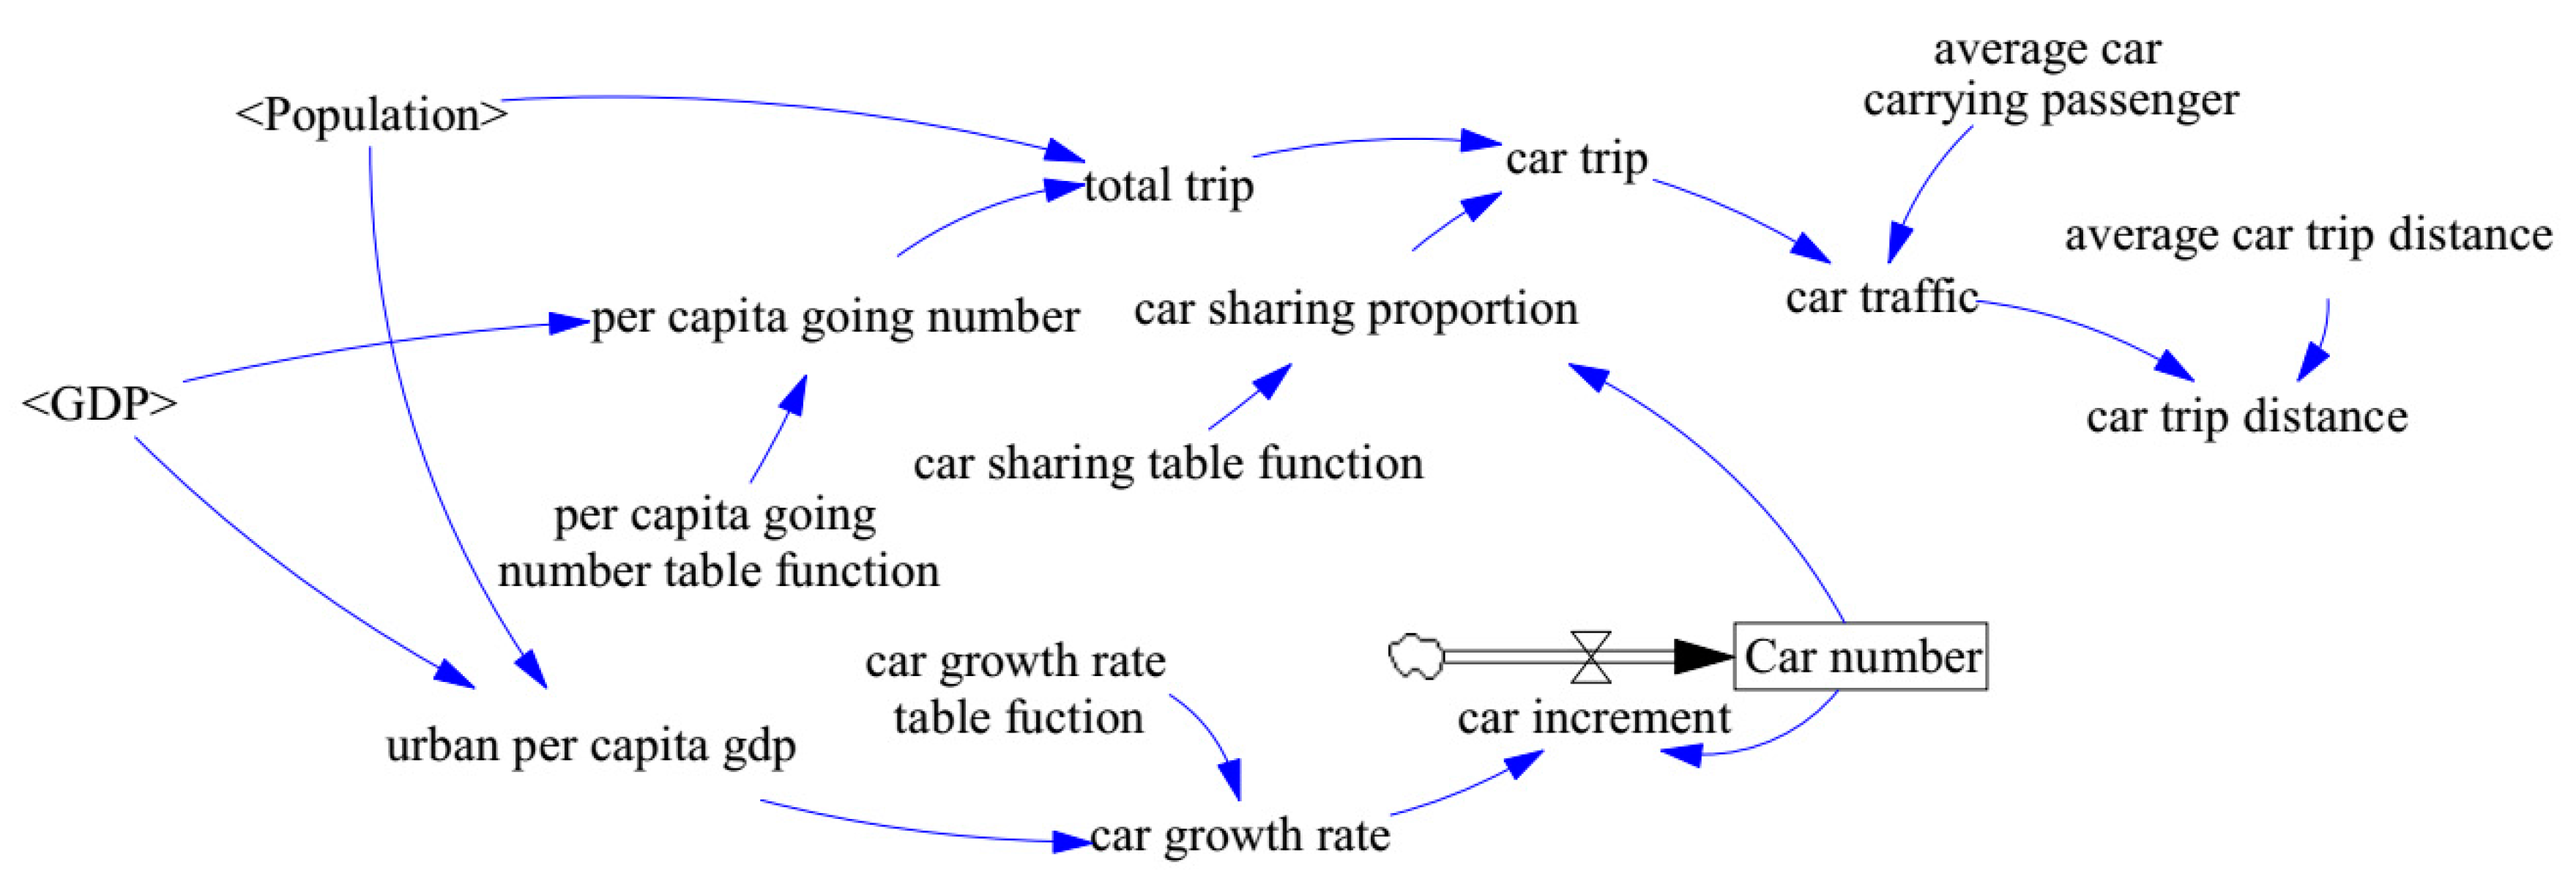
The model structure of private transport demand is shown in
Figure 6. The stock variable, namely car number (CN), has the one inflow variable of car increment (CI).
The quantitative relationships between CN and CI are shown in Equation (8).
where INTEG means the function of integral,
indicates the car number in the start time,
indicates the car number in the termination time. The growth of private cars (CGR) is mainly related to the level of economic development, and the urban per capita GDP (PCGDP) is the main influencing factor of CGR. The quantitative relationship between CGR and PCGDP is shown in Equation (9).
where WITH LOOKUP means table function,
indicates the per capita GDP in the start time,
indicates the per capita GDP in the termination time.
Ownership of more private cars in emerging cities will prompt residents to use private transport. As CN is the main influencing factor of car share proportion (CSP), the quantitative relationship between CN and CSP is shown in Equation (10).
where WITH LOOKUP means table function,
indicates the private car number in the start time,
indicates the private car number in the termination time.
As the resident trip quantity of private cars, namely, car trip (CT) is assumed as a certain proportion of the total trips (TT) of residents, the quantitative relationship between TT and CT is shown as Equation (11).
The stock and flow diagram for private cars also shows that the car traffic rate (CTR) is influenced by the average car passenger capacity (ACPC) and CT, which is represented by Equation (12); the car trip distance can be calculated by the CTR and the average car trip distance, the latter of which can be obtained by Origin–Destination (OD) data.
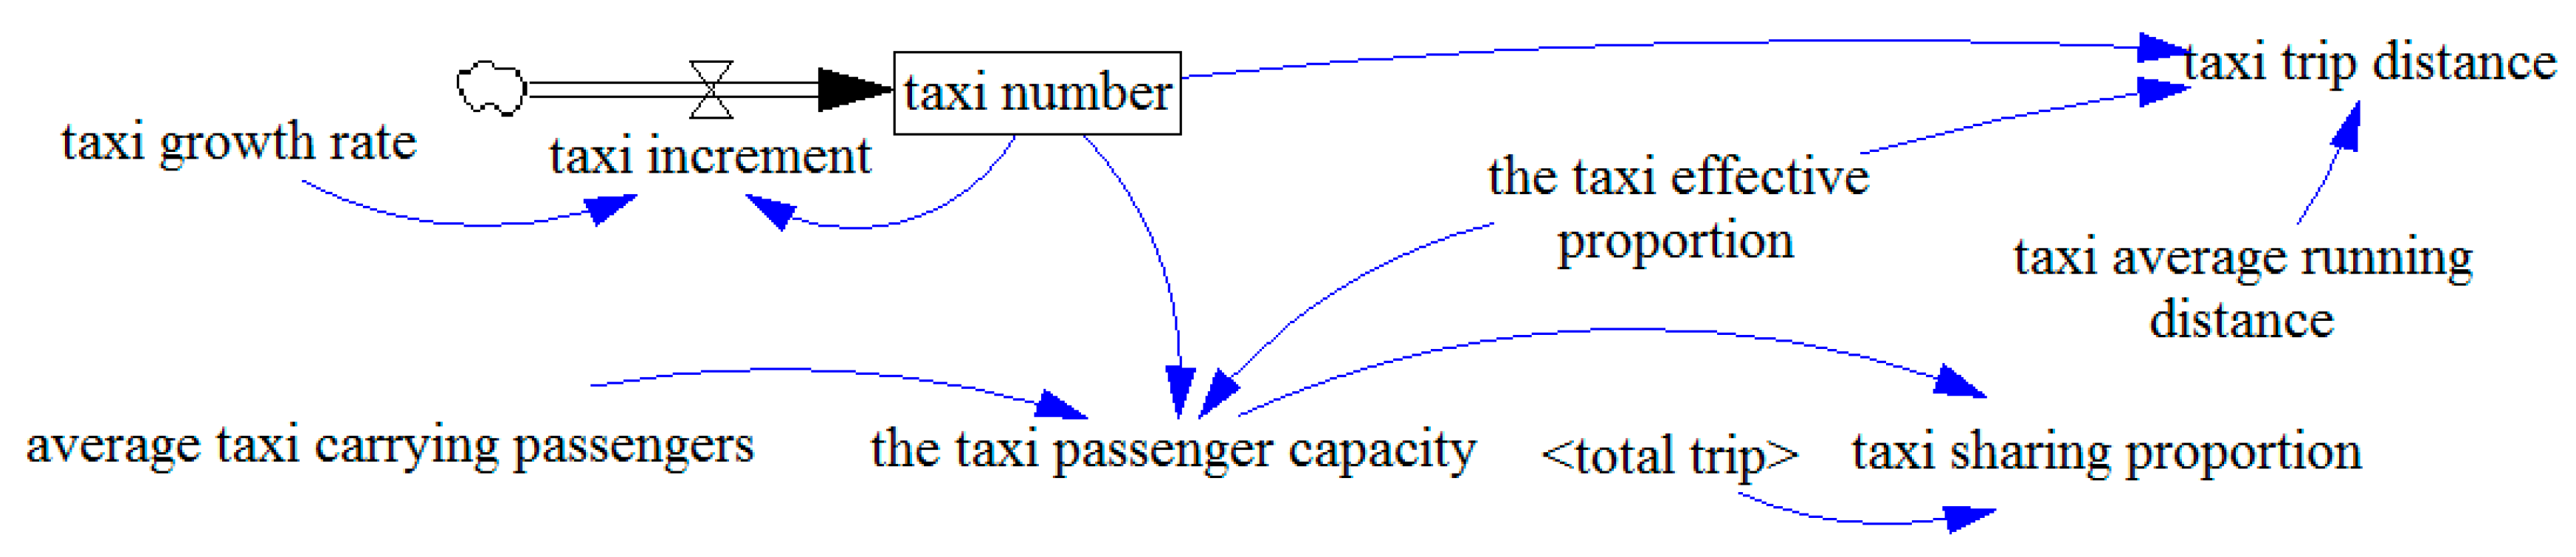
In addition, it should be noted that taking a taxi for a trip is considered as a type of private car trip. The stock and flow diagram for taxi traffic is shown as
Figure 7.
There is one stock variable, taxi number (TN), and one inflow variable, taxi increment (TAI). The formula for TN is shown in Equation (13).
where INTEG means the function of integral,
indicates the taxi number in the start time,
indicates the taxi number in the termination time.
2.3.3. The Transport Supply Sub-Model
Governments have an obligation to supply enough transportation infrastructure for the development of emerging cities. Most government transportation investments are used for developing road networks and public transport construction in China’s emerging cities [
54].
Although bus systems are commonly considered the preferred mode of public transport in emerging cities, urban rail transportation systems are expected to play a greater role in the future. In recent years, more and more cities in China have been constructing their own urban rail transportation systems. In this study, public transport includes bus and urban rail systems, which are described graphically in
Figure 8.
The model above includes two stocks, namely, bus number (BN) and rail length (RL). The BN stock has one inflow variable, bus increment (BI). The quantitative relationship between BN and bus increment is shown in Equation (14).
where INTEG means the function of integral,
indicates the bus number at the start time,
indicates the bus number at the termination time.
It can be seen that BI is influenced by investment and conversion (the output of unit investment). Investment in buses (BUI) can be analyzed as a public investment. The quantitative relationships between BUI and bus investment conversion (BUIC) are shown in Equation (15).
By using a similar method for analyzing BN, the RL stock can be analyzed. Public transport investment can be analyzed by considering the proportion of transport investment in GDP. Data on the proportion variables can be obtained from statistics and historical data. On the base of statistical data from the transport department, the passenger capability of every unit of public transport mode, including the passenger capacity of bus (PCB) and the passenger capacity of rail (PCR), could be calculated. Taking the bus system as an example, PCB could be calculated by the average daily passenger volume of bus (ADPB) and BN, as shown in Equation (16). The formula for bus sharing proportion (BSP) is shown in Equation (17). The rail sharing proportion could be obtained by the same method.
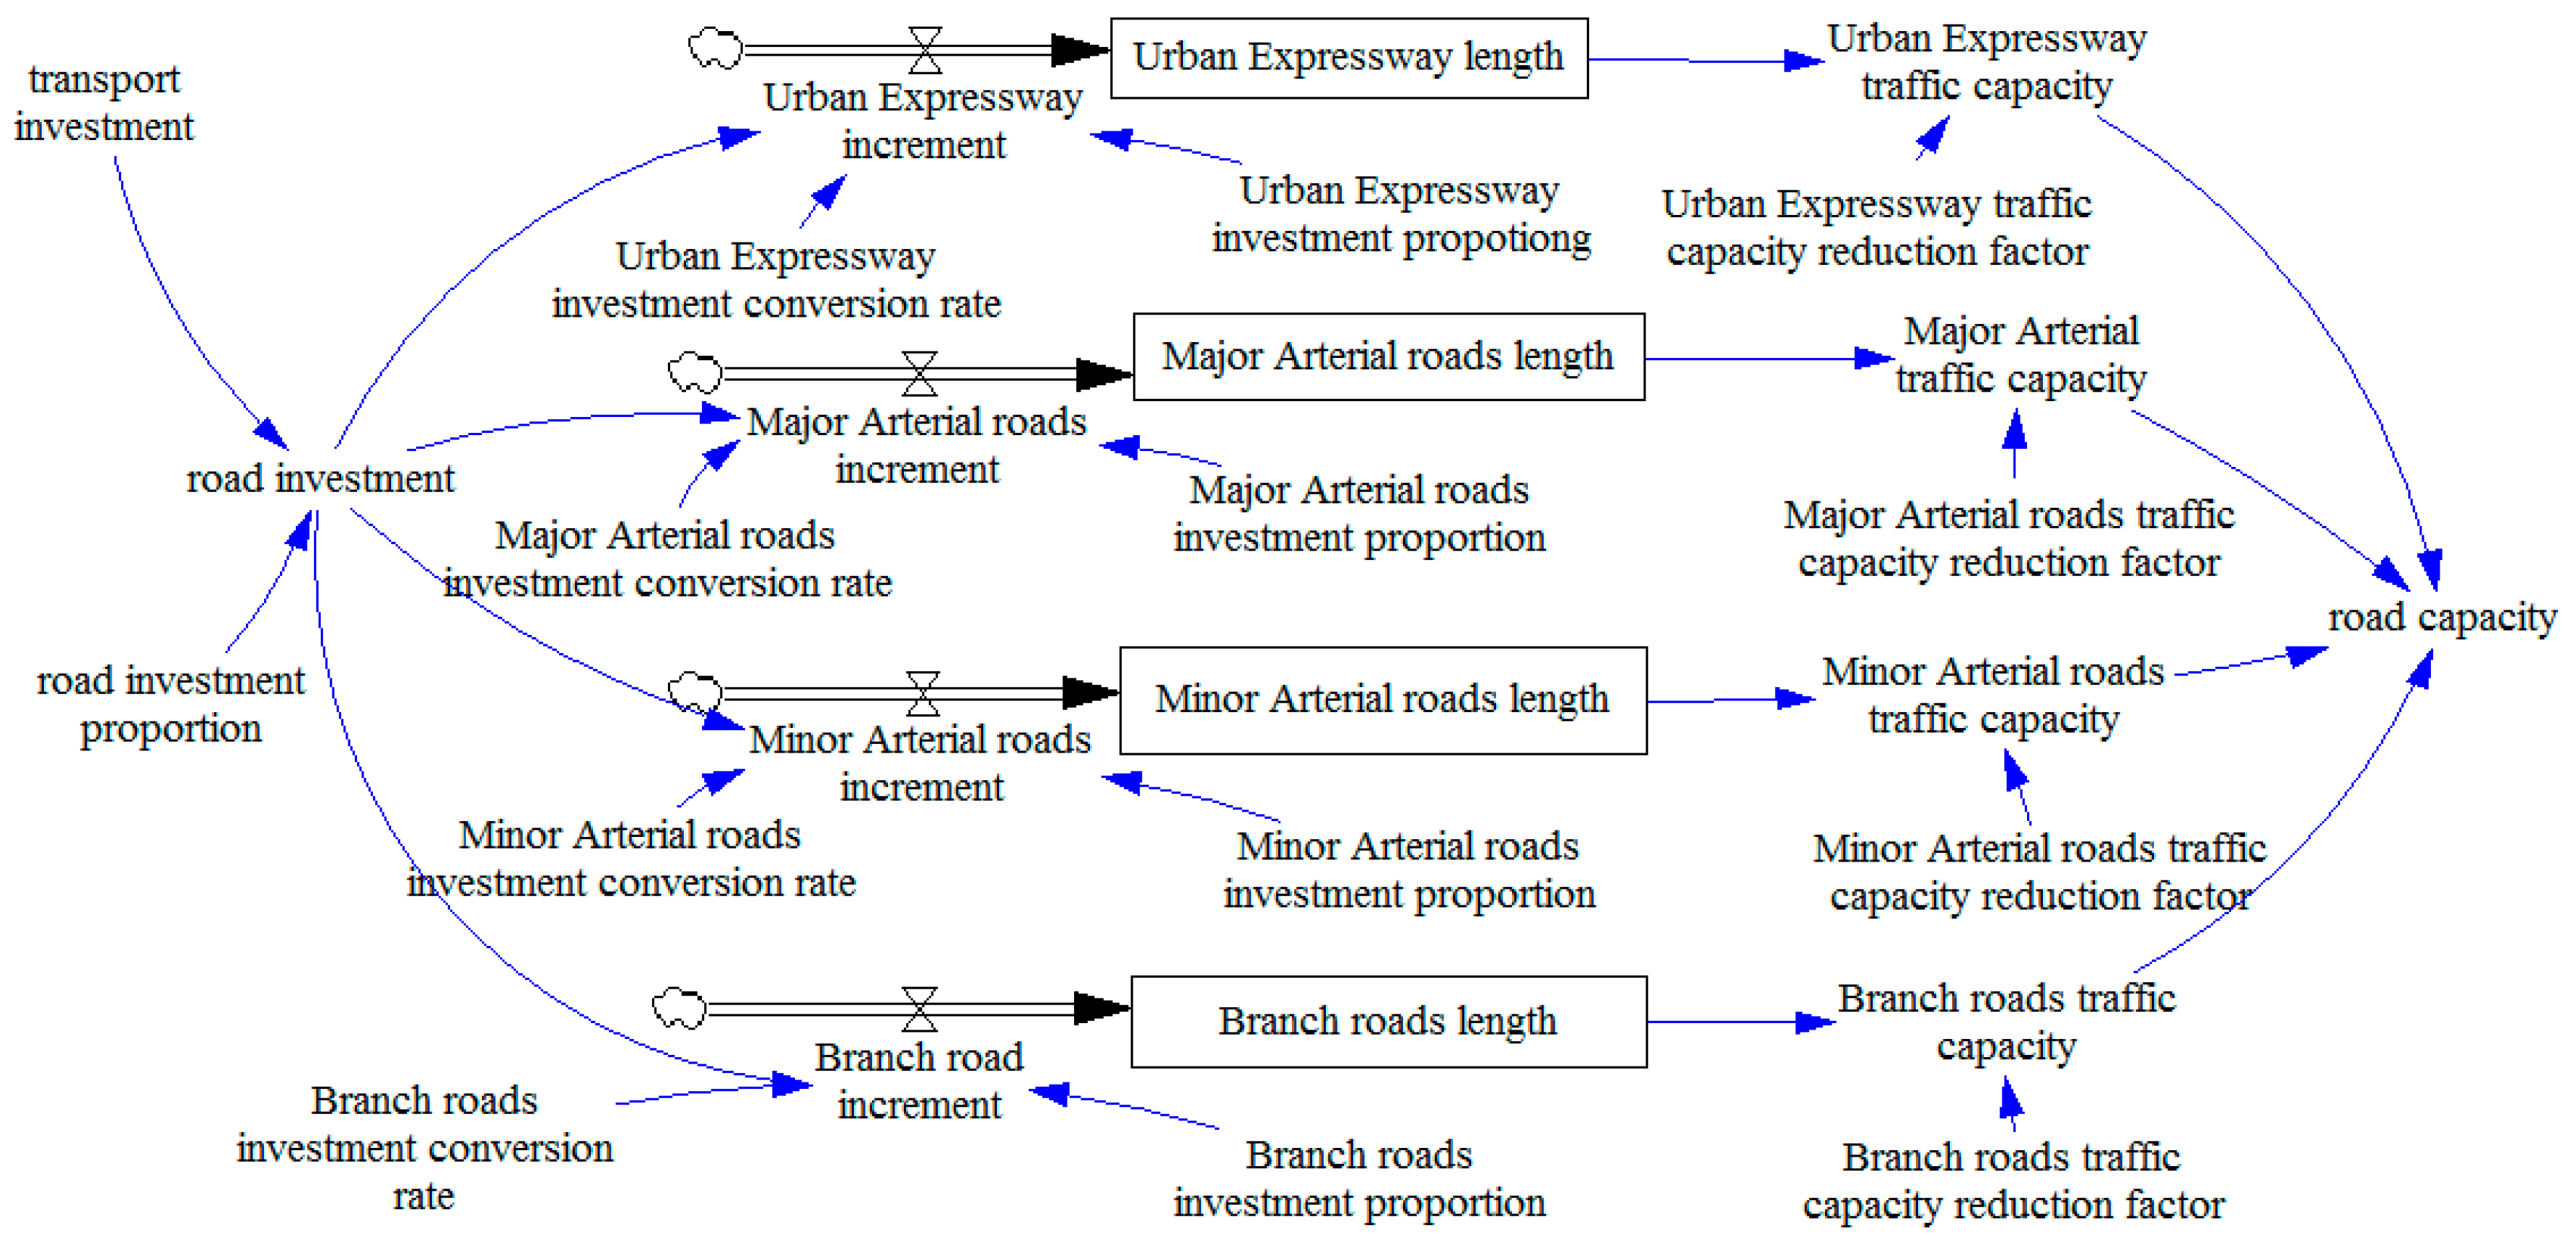
Urban road construction is another major direction of government investment in transportation. There are four levels of urban roads in China’s urban road network, including urban expressway, major arterial roads, minor arterial roads, and branch roads [
55], as shown in
Figure 9.
Different road levels in the city play different roles, which form the urban road network. The urban expressway (UE) system links the cities’ major areas, the main suburban areas, the satellite towns, and simultaneously serves as the major external roads. Major arterial road systems act as the skeleton of the urban road network, connecting the urban areas with the national and provincial freeways, and linking urban landmarks. Minor arterial roads mainly serve regional traffic, connect the urban districts, and gather and distribute traffic from the major arterial roads. Branch roads are the traffic routes of residents and industrial areas, connecting minor arterial roads and residential buildings.
The above diagram for urban road construction includes four stocks, namely, urban expressway (UE) length, major arterial road length, minor arterial road length, and branch road length. Road investment proportion (IP) can be used to analyze the road investment (ROI). The increment length of different roads is defined by the investment and unit costs (UC). The traffic capacity (TC) of different levels of road is influenced by the traffic capacity reduction factor (TCRF). Taking UE system as an example, the formulas for urban expressway traffic capacity are shown in Equations (18)–(20).
where
indicates the urban expressway length in the start time,
indicates the urban expressway length in the termination time. The same method could obtain the traffic capacity of other roads. Subsequently, the road capacity could be calculated by summing from the four levels of road.
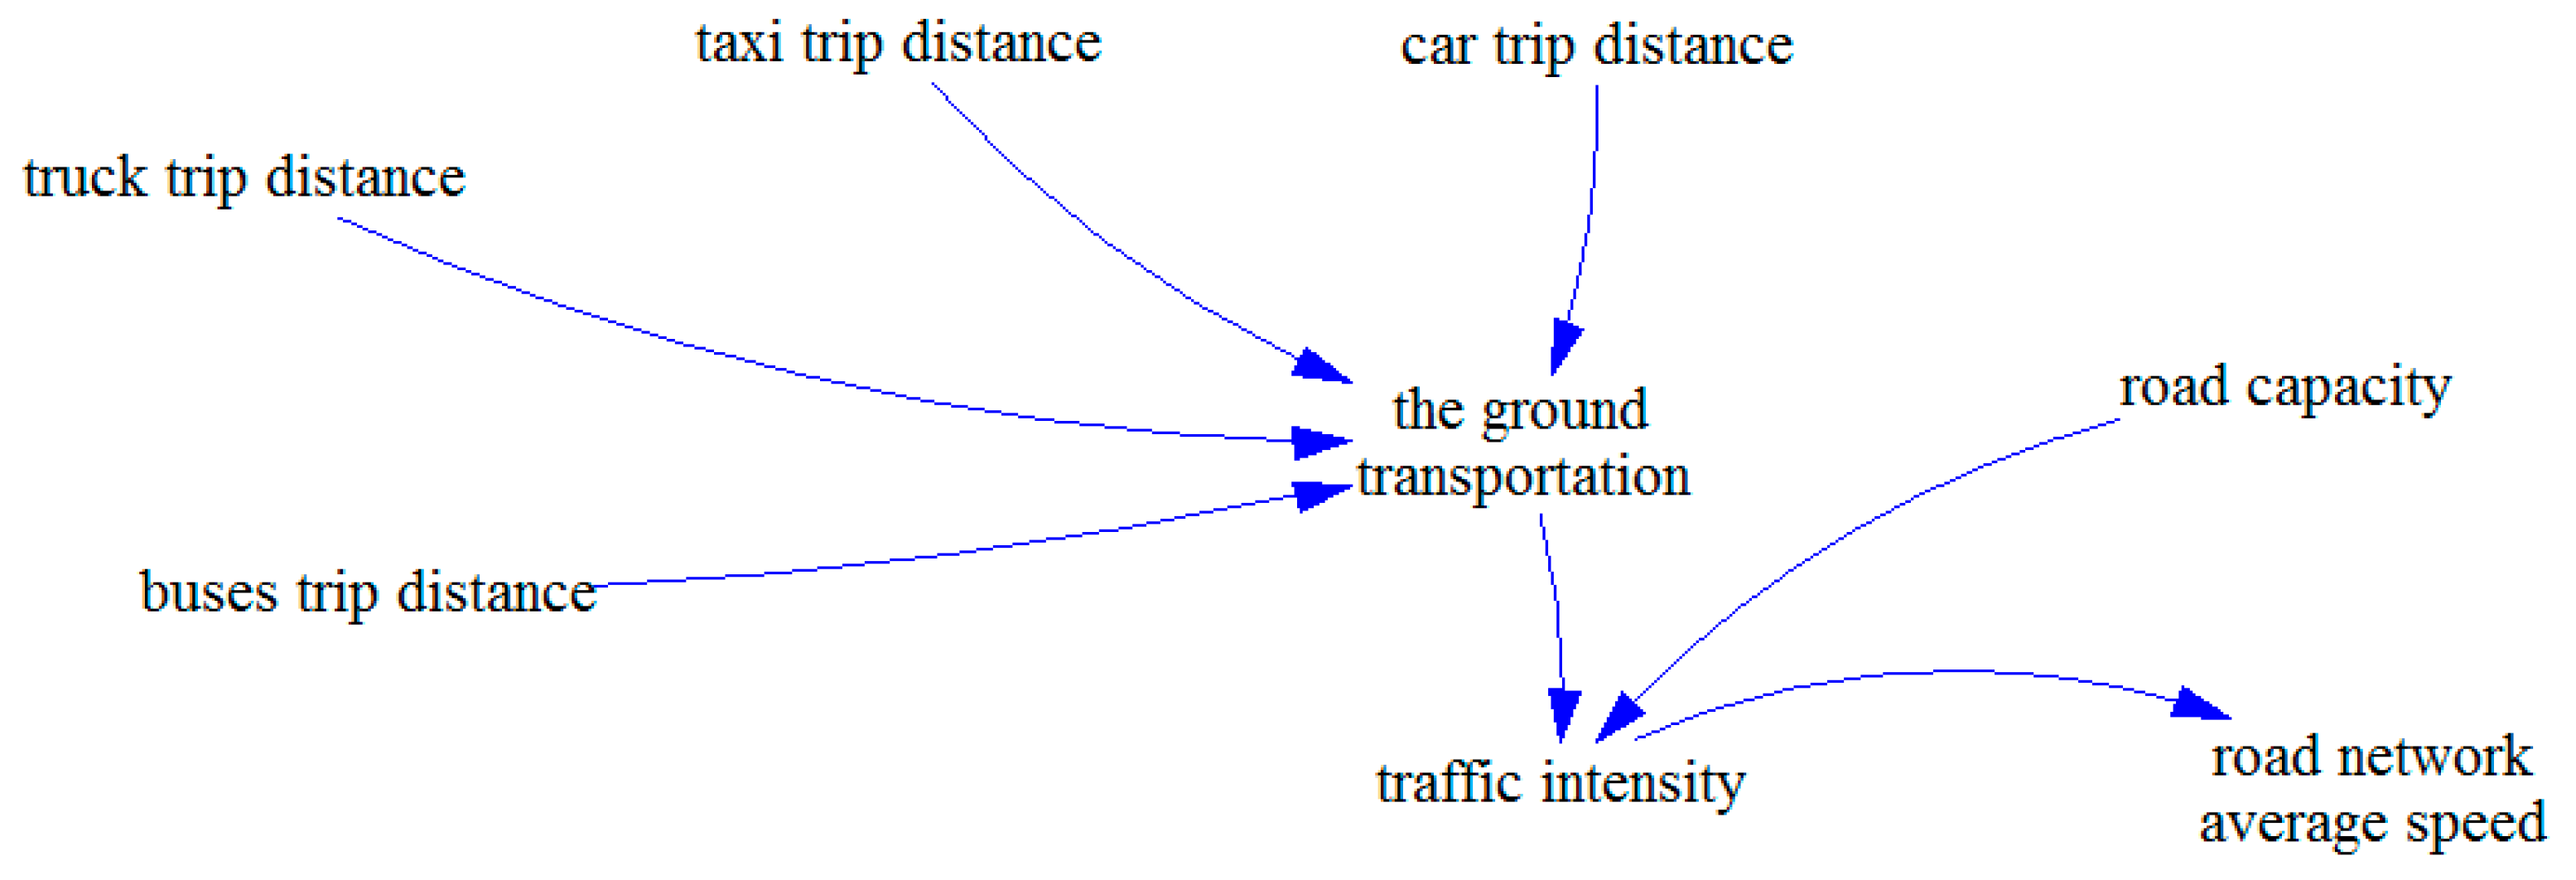
The purpose of urban road construction is to meet the demand of urban ground transport, which is mainly composed of four parts, namely, car trip, truck trip, taxi trip, and buses trip, as shown in
Figure 10.
The mean speed of the road network is often used to evaluate the condition of ground transportation supply and demand. The mean speed of the road network (RNMS) can be calculated by a function of the traffic density [
56], as shown in Equation (21). The traffic intensity (TRI) is defined as the ratio of the ground transport (GT) to road capacity (RC), as shown in Equation (22).
2.3.4. Model Validation
The stock–flow diagram models, as shown in
Figure 4,
Figure 5,
Figure 6,
Figure 7,
Figure 8,
Figure 9 and
Figure 10, are used for simulation analysis. Before their application, the models’ reliability must be checked. The main stock variables requiring examination include car number, taxi number, bus number, rail length, and urban expressway length. The reliability of these models is verified by referring to the case of Shenzhen city. The historical data of the main stock variables were collected from the “Shenzhen Statistical Yearbook (2010–2016)” [
57], and the “Shenzhen Urban Traffic Annual Report (2010–2016)” [
58]. The data is used to simulate the operation of the urban transportation system in Shenzhen from 2010 to 2016, by considering the value of time steps as one year.
Table 3 provides a comparison between the simulated values and the historical data of the main stock variables. The errors of mean absolute percentage error (MAPE) are within 5%. Based on commonly used statistical theory, a 95% confidence level is recognized as an objective criterion. Therefore, if the reliability level is used as a test standard, the prediction error of the simulation models should be within 5% in order to meet the accuracy requirements [
59]. According to the check results, the precision of the models built for this study satisfies the demands of policy analysis and are therefore considered reasonable.
4. Discussion and Conclusions
To compare the performance of different transportation development policies in Shenzhen, this study designed three kinds of scenarios: urban road construction, public transport development, and restricting private transport. The results of the simulation analysis suggest that the following urban transportation sustainable development strategies should be adopted:
- (1)
Strengthening urban road construction will improve the effectiveness of transportation policy. Over the past few decades Shenzhen has invested in building an urban road network system, which has greatly improved the effectiveness of the traffic system, thereby indicating that the construction of roads should continue over the next few years. However, the city should take note that the simulation results indicate that increasing investment in major arterial roads is more effective than other types of roads. The fact that the urban road network system in Shenzhen is mainly formed by urban expressways means that investment in major arterial roads should be increased in the new long-term road construction plan to be implemented over the next 10 years.
- (2)
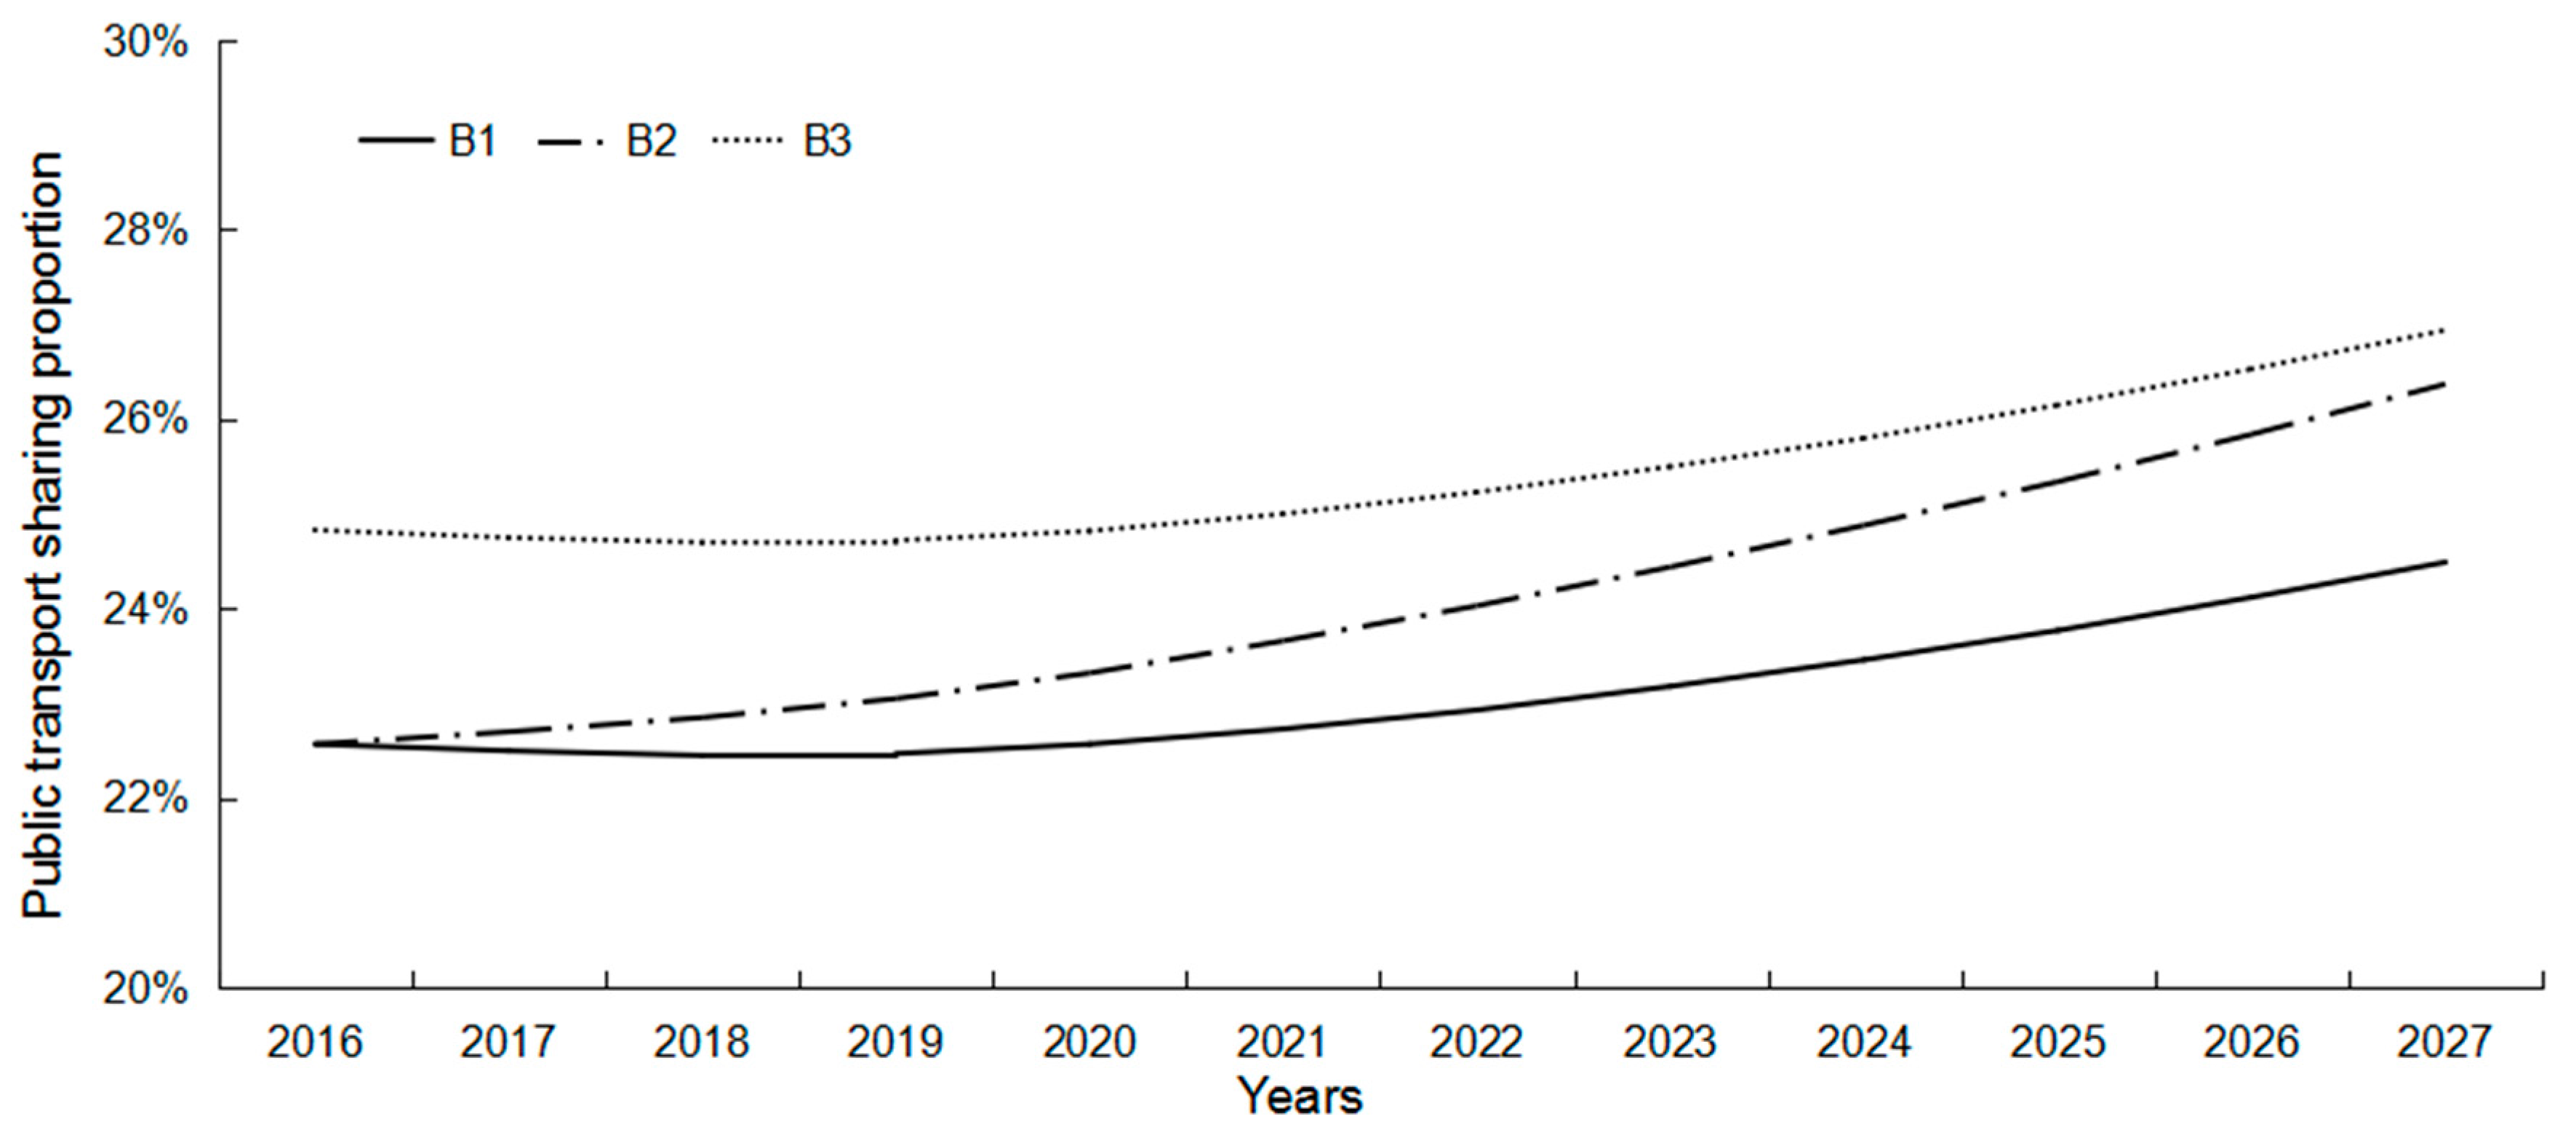
The effectiveness of transportation policy by strengthening public transport systems can be achieved. The simulation results reveal that operating mileage and operational efficiency are equally important to public transport systems. Investment in public transport should be improved not only by expanding the scale of operating mileage, but also by improving operational efficiency. Although the Shenzhen government has paid attention to the construction of public transport, the practical operational efficiency of the system is still far from the public’s expectations. As a lack of good connection between different public transport modes is the main reason for this, some measures that could improve operational efficiency should be taken into consideration, such as bus and rail transit line planning, the operation and management of public transport, and the application of new technologies.
- (3)
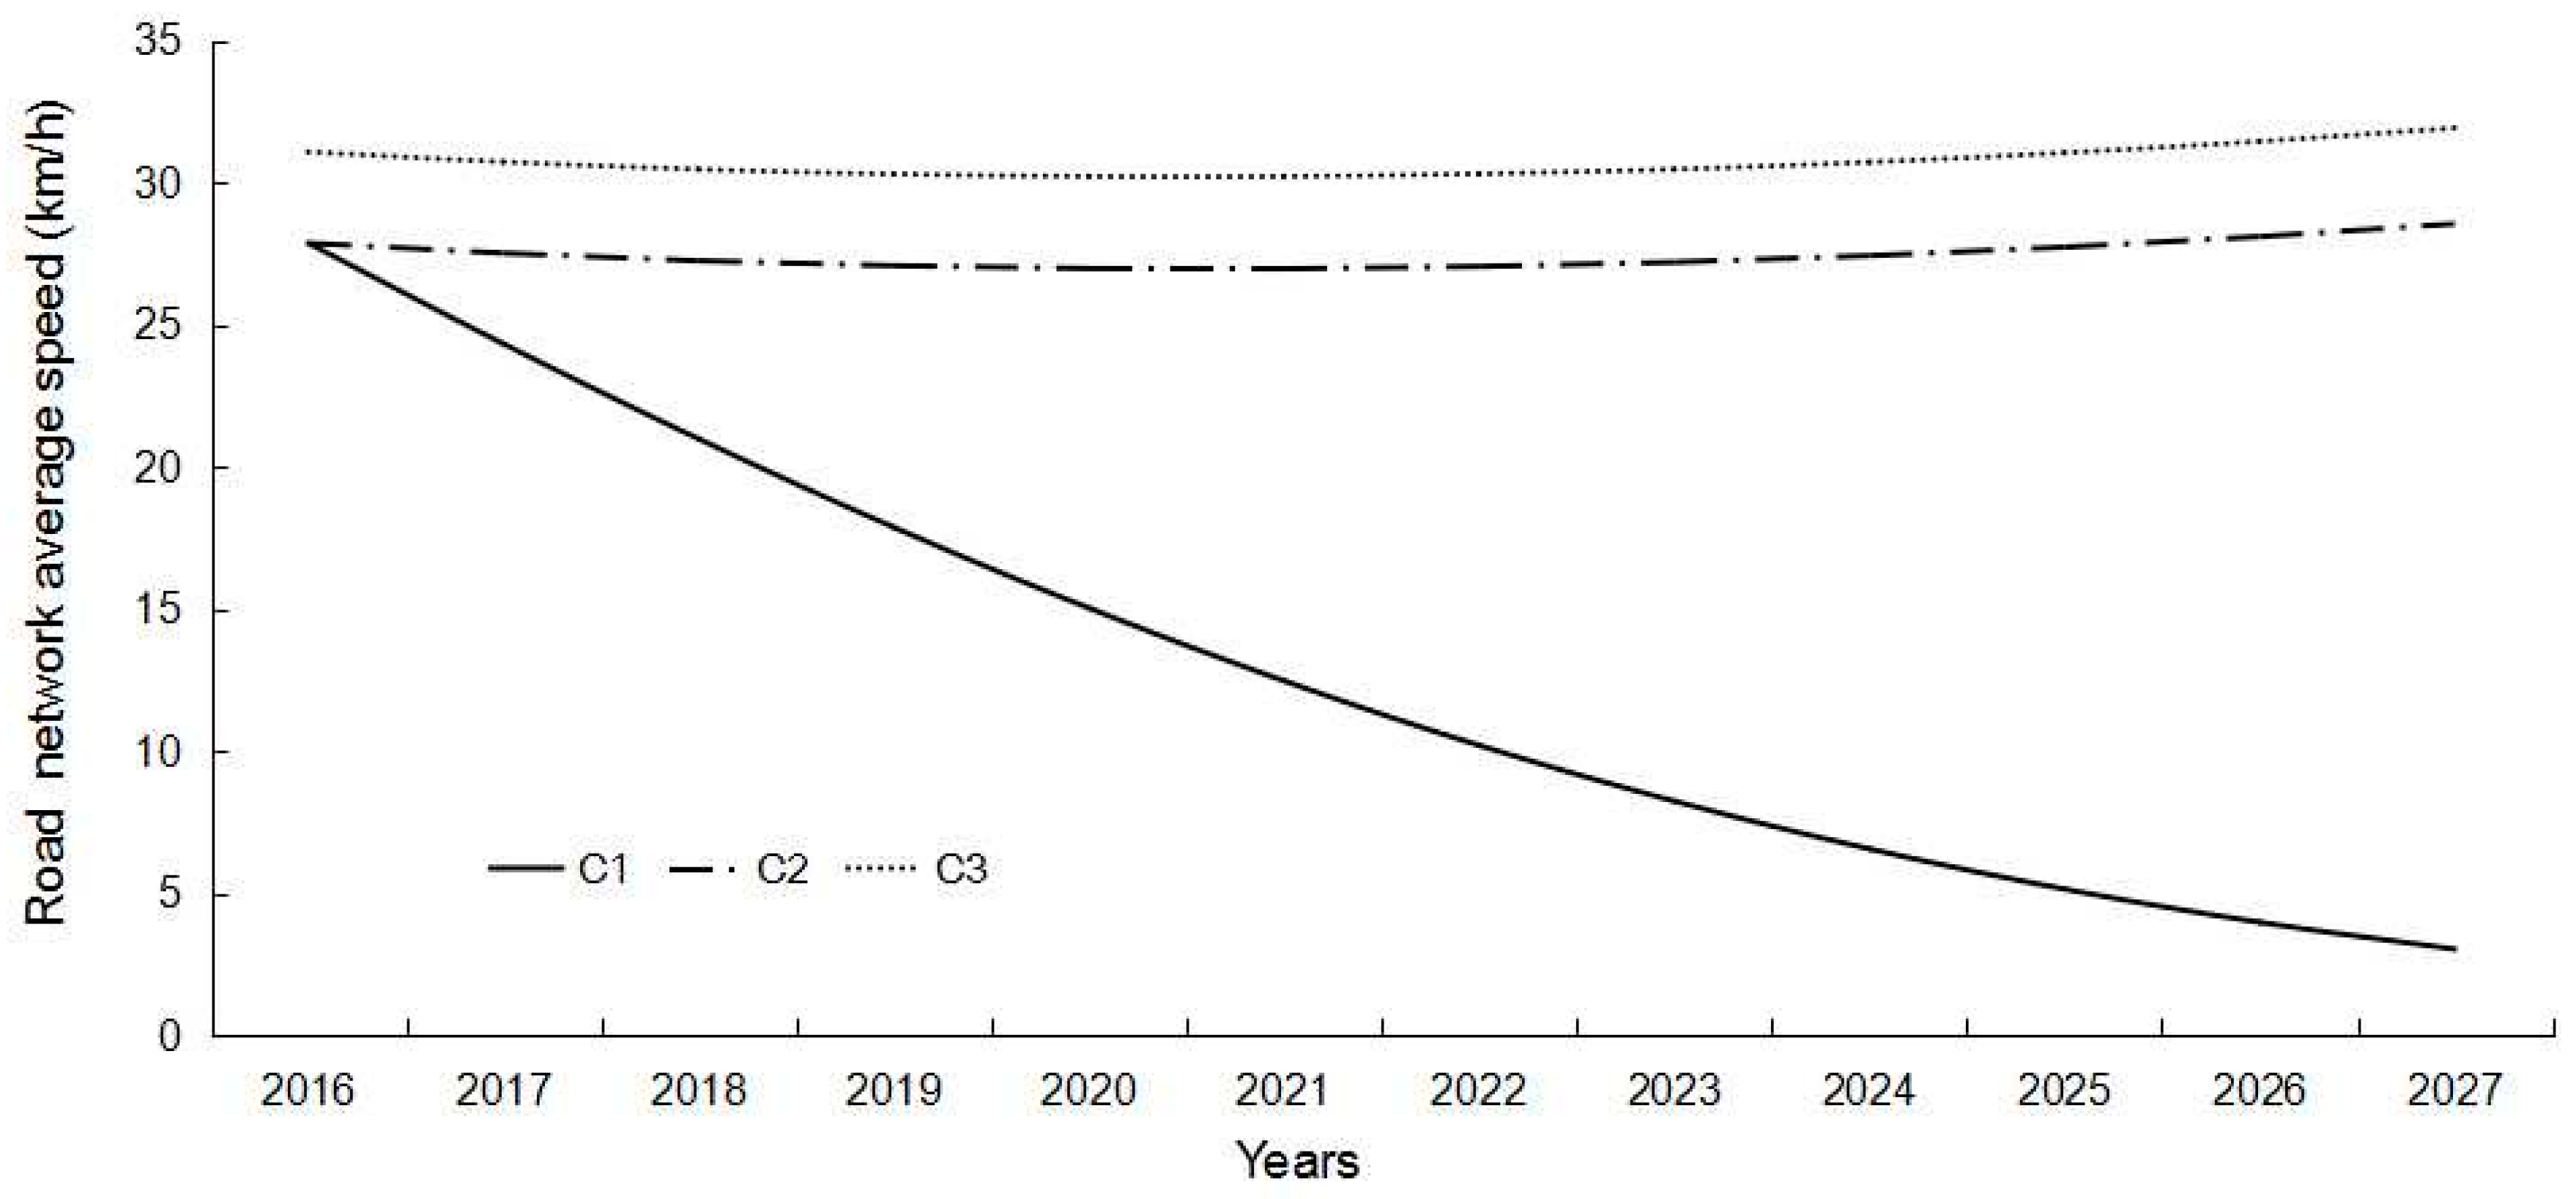
Private traffic restrictions play a significant role in urban transportation, since the simulations show that if there were none, the congestion caused by the growth of private cars would be irreversible. Fortunately, the Shenzhen government has implemented restriction measures to avoid this issue. Before the private car became a major trip mode, Shenzhen’s government had invested heavily in public transport in order to encourage residents to give up their cars and choose public transport for their travel. To encourage even more use of public transport, private car purchases in Shenzhen are currently limited to approximately 100 thousand each year [
66], the immediate effect of which was revealed by simulation.
According to previous studies, it is not a good strategy to increase the supply of urban roads to meet ground traffic demand through massive infrastructure construction [
67,
68,
69]. While China’s emerging cities lack adequate transport infrastructure to support urban development [
70,
71,
72], it is imperative for decision-makers to consider both the demand and supply of transport to choose sustainable development strategies, which could improve the efficiency of government investments. This study has found that it is more effective for Shenzhen to simultaneously improve the capacity of its road networks, strike a balance between the scale expansion and operational efficiency of public transport systems, and restrict private traffic.
This study has identified sustainable strategies for transportation development in China’s emerging cities by using a simulation approach. The SD simulation model was developed and applied to predict the performance of different strategies for urban transportation systems. The SD simulation approach has proved effective for providing sustainable strategies for the development of urban transportation. Most of China’s emerging cities have encountered various problems relating to transportation. These problems are often due to a lack of integrative consideration of sustainable development in making strategies for the urban transportation. The approach presented in this study is useful for answering “What if” questions and is of significance to achieving the goal of sustainable development of urban transportation in emerging cities. The study provides an innovative approach to solving macro strategic issues, such as urban transportation development, and although this study used Shenzhen as a case study, the simulation approach could be adopted in other emerging cities for devising transportation development strategies.
To reduce the complexity of the SD model and improve the study’s feasibility, some simplifications were made in the research, which should be taken into account when considering whether to adopt any of the strategies suggested by the study’s simulation results. One of the simplifications, or limitations, was that the study mainly focused on strategies for transport supply, while not considering the environment, land system, or a slow traffic system. Another limitation of the study is that only three kinds of strategies were selected for analysis in order to simplify the scenario settings. Finally, the simulation process did not consider changeable conditions, such as the latest technological progress in transport (including traffic information systems and renewable energy vehicles). Thus, future related research should analyze more strategies and include changeable factors in the simulation model, such as environmental protection, land use, short-distance travel, and technical innovations.


