Article

Optimization of Passive Envelop Energy Efficient Measures for Office Buildings in Different Climate Regions of China Based on Modified Sensitivity Analysis

School of Environmental Science and Engineering, Tianjin University, Tianjin 300072, China
*
Author to whom correspondence should be addressed.
Sustainability 2018, 10(4), 907; https://doi.org/10.3390/su10040907
Submission received: 4 February 2018 / Revised: 16 March 2018 / Accepted: 19 March 2018 / Published: 21 March 2018
(This article belongs to the Collection Sustainable Built Environment)

Abstract

:
With the growing desire for new buildings and better indoor comfort, the amount of energy consumption of office buildings in China is increasing rapidly, which will lead to the great challenge for energy supply and sustainable development. Building passive envelop energy efficient measures (PEEEMs), mainly including exterior wall insulation, roof insulation, different glazing types, and shading system, were widely applied. However, the specific energy efficient performance of PEEEMs was various in different climate conditions that have not been evaluated clearly yet. The priority order of PEEEMs was not recommended in relative standards. The economic benefits cannot be considered synchronously with PEEEMs optimization. This paper modified the sensitivity analysis to fit the building energy efficiency evaluation. By combining the modified method with a simulation tool, the energy efficiency and economic effects of PEEEMs of office buildings in various climate regions can be considered at the same time. Four case buildings in Shenyang, Tianjin, Ningbo, and Shenzhen were proved to reach the energy-saving potentials of 9.44%, 7.75%, 20.87%, and 13.27% respectively, with the payback period of no more than 1.5 years. Finally, the recommended application priority rankings and the recommended ranges of thermal performance properties of PEEEMs in the four typical climate regions were presented.

1. Introduction

Building energy consumption, which has already taken as much as 40% of the total energy use and 36% of the carbon dioxide emissions all over the world [1] and is estimated to quickly augment with future building development, is a significant sector, influencing sustainable development of the whole society. Among all the buildings with different functions, office buildings have already been one of the fastest growing groups, especially in large cities. The total energy consumption of office buildings with full sets of air-conditioning systems is about 70–300 kWh/ (m2·a), 10–20 times more than that of residential buildings in China [2]. Building energy efficiency has been paid great attention to realize sustainable development during the rapid urbanization phase. Passivhaus is one of the fastest growing energy efficient buildings with the strength of simplicity of the concept [3] and low costs. Voss K. et al. [4] estimated the active and passive cooling measures in 22 demonstration projects. Results showed that 1/3 energy consumption has been saved by passive measures without greatly increased cost. Building envelop plays an extremely significant role in passivhaus. The main principle of building passive envelop energy efficient measures (PEEEMs) is preventing heat loss during the heating period and reducing heat gain while cooling. Exterior wall insulation, roof insulation, glazing types, and shading systems are the four typical PEEEM that are widely applied. The energy performance of the PEEEMs is usually considered as a premise of other building energy efficient measures, for example, heating and cooling systems and renewable energy. So, the optimization of PEEEMs is of great significance during building energy efficient design.
Many building energy efficient design standards have clarified the technical indexes of these PEEEMs internationally, nationally, and locally [5,6]. For example, the limits of U-value of exterior walls, windows, roof, and sun-shading coefficient of exterior windows are clearly listed in Chinese national standard series of GB 50189 [7,8]. However, the limited values in national standards are generally low because of various building features. Based on the standards, if the building designers want to partially improve the building energy efficient performance, the optimization order or recommended range of thermal performance properties of exterior walls, windows, and roof should be recommended. In addition, the recommended value ranges can be properly improved in local standards. The selection of indexes should be improved must be based on the energy efficiency performance of PEEEMS.
It is fairly difficult to estimate the performance of PEEEMs with various designs in different climate conditions [9,10,11]. Related to the effect evaluation of these PEEEMs, many scholars have made their points. Zhou S. and Zhao J. [12] studied the building envelop energy saving technologies for office buildings in different climate regions by establishing virtual building models. However, the study cases were experimental rather than real buildings. Wang Z., Ding Y. et al. [13] analyzed a retrofit office building in cold regions of China and pointed out that the building envelop energy efficiency retrofit, including exterior walls, roof and windows, was an important premise to realize the energy efficient effects. Otherwise, the energy-saving goal would not be reached or even ending up with low energy efficiency because of the overload of building itself. Østergård T. et al. [14] proposed a systematic model to perform, analyze, and visualize simulations of a global design space in order to guide decision-making in a multi-collaborator context. Even in early design stage, the key factors of envelopes such as wall structure and materials, roofs, windows, shading, etc. were significantly considered. Yang L. et al. [15] conducted research on energy performance of office building envelop designs through overall thermal transfer value (OTTV) method. It was confirmed that certain building envelopes tended to obtain more heat gain/loss than those specified by the local design/energy codes and some useful recommendations were proposed to improve the energy efficiency of the building. Yu J. et al. [16] used eQUEST to analyze envelop design on air-conditioning energy-saving of residential buildings. Energy efficient technologies including exterior wall thermal insulation, solar radiation absorptance of exterior wall, area ratio of window to wall, categories of glazing and kinds of shading system, and two combined strategies were evaluated. The results indicated that envelope shading and exterior wall thermal insulation were the best strategies in hot summer and cold winter zone to decrease the air conditioning electricity consumption. In the case study, the saving rate of 11.31 and 11.55% were achieved respectively. The optimization of different strategies could decrease the annual cooling and heating electricity consumption by 21.08% and 34.77% respectively. In the above research, the study emphases were energy-saving potential of different strategies. Economic benefits were taken as a posterior condition, and were calculated after deciding the energy efficiency strategies. It means if the design scheme is not available from the aspect of investment, the design scheme and economic calculation should be reworked. However, the economic analysis may be complicated for various design schemes. Additionally, the priority orders of energy efficient measures are generally decided by the economic benefits of PEEEMs. A method considering the energy efficient performance and economic benefits of PEEEMs at the same time is necessary during design stage.
In order to evaluate the energy efficient effects of PEEEMs in the different climate regions, sensitivity analysis, combining with building energy simulation software, was applied. Sensitivity analysis can help understanding of the relative influence of input parameters on the outputs [17]. In the field of energy efficiency, sensitivity analysis can be significantly useful for selecting the most appropriate energy efficient measures and balancing the energy-saving effect and economic benefits [18,19]. Previous research mainly focused on the suitability of different PEEEMs in specific climate regions, while the optimum combinations of various PEEEMs in different climate regions were seldom concerned [20]. Therefore, this paper focused on the optimization of PEEEMs applied in office buildings in different climate regions of China to realize maximum effect by limited costs.
PEEEMs are widely applied in four typical climate regions in China, namely the severe cold (SC) region, cold (CC) region, hot summer and cold winter (HS/CW) region, hot summer and warm winter (HS/WW) region. Four office buildings in Shenyang (SC region), Tianjin (CC region), Ningbo (HS/CW region) and Shenzhen (HS/WW region) were selected as case buildings. Based on the four case buildings, the following sections were organized as follows. Building energy simulation models were established and verified for case buildings in each climate region respectively in Section 2.1. Sensitivity coefficient suitable in building energy efficiency field was defined in Section 2.2. Based on the above methodologies, different dimensions for each PEEEM and corresponding energy consumption were listed. Sensitivity coefficient values for each PEEEM were calculated in Section 3. The PEEEMs application priority rankings suitable for the four typical climate regions of China were presented in Section 4. Some supplement and explanation, including theoretical economic benefits, indoor comfort and other passive building energy efficient measures, were discussed in Section 5. Conclusions were summarized in Section 6.

2. Methodology

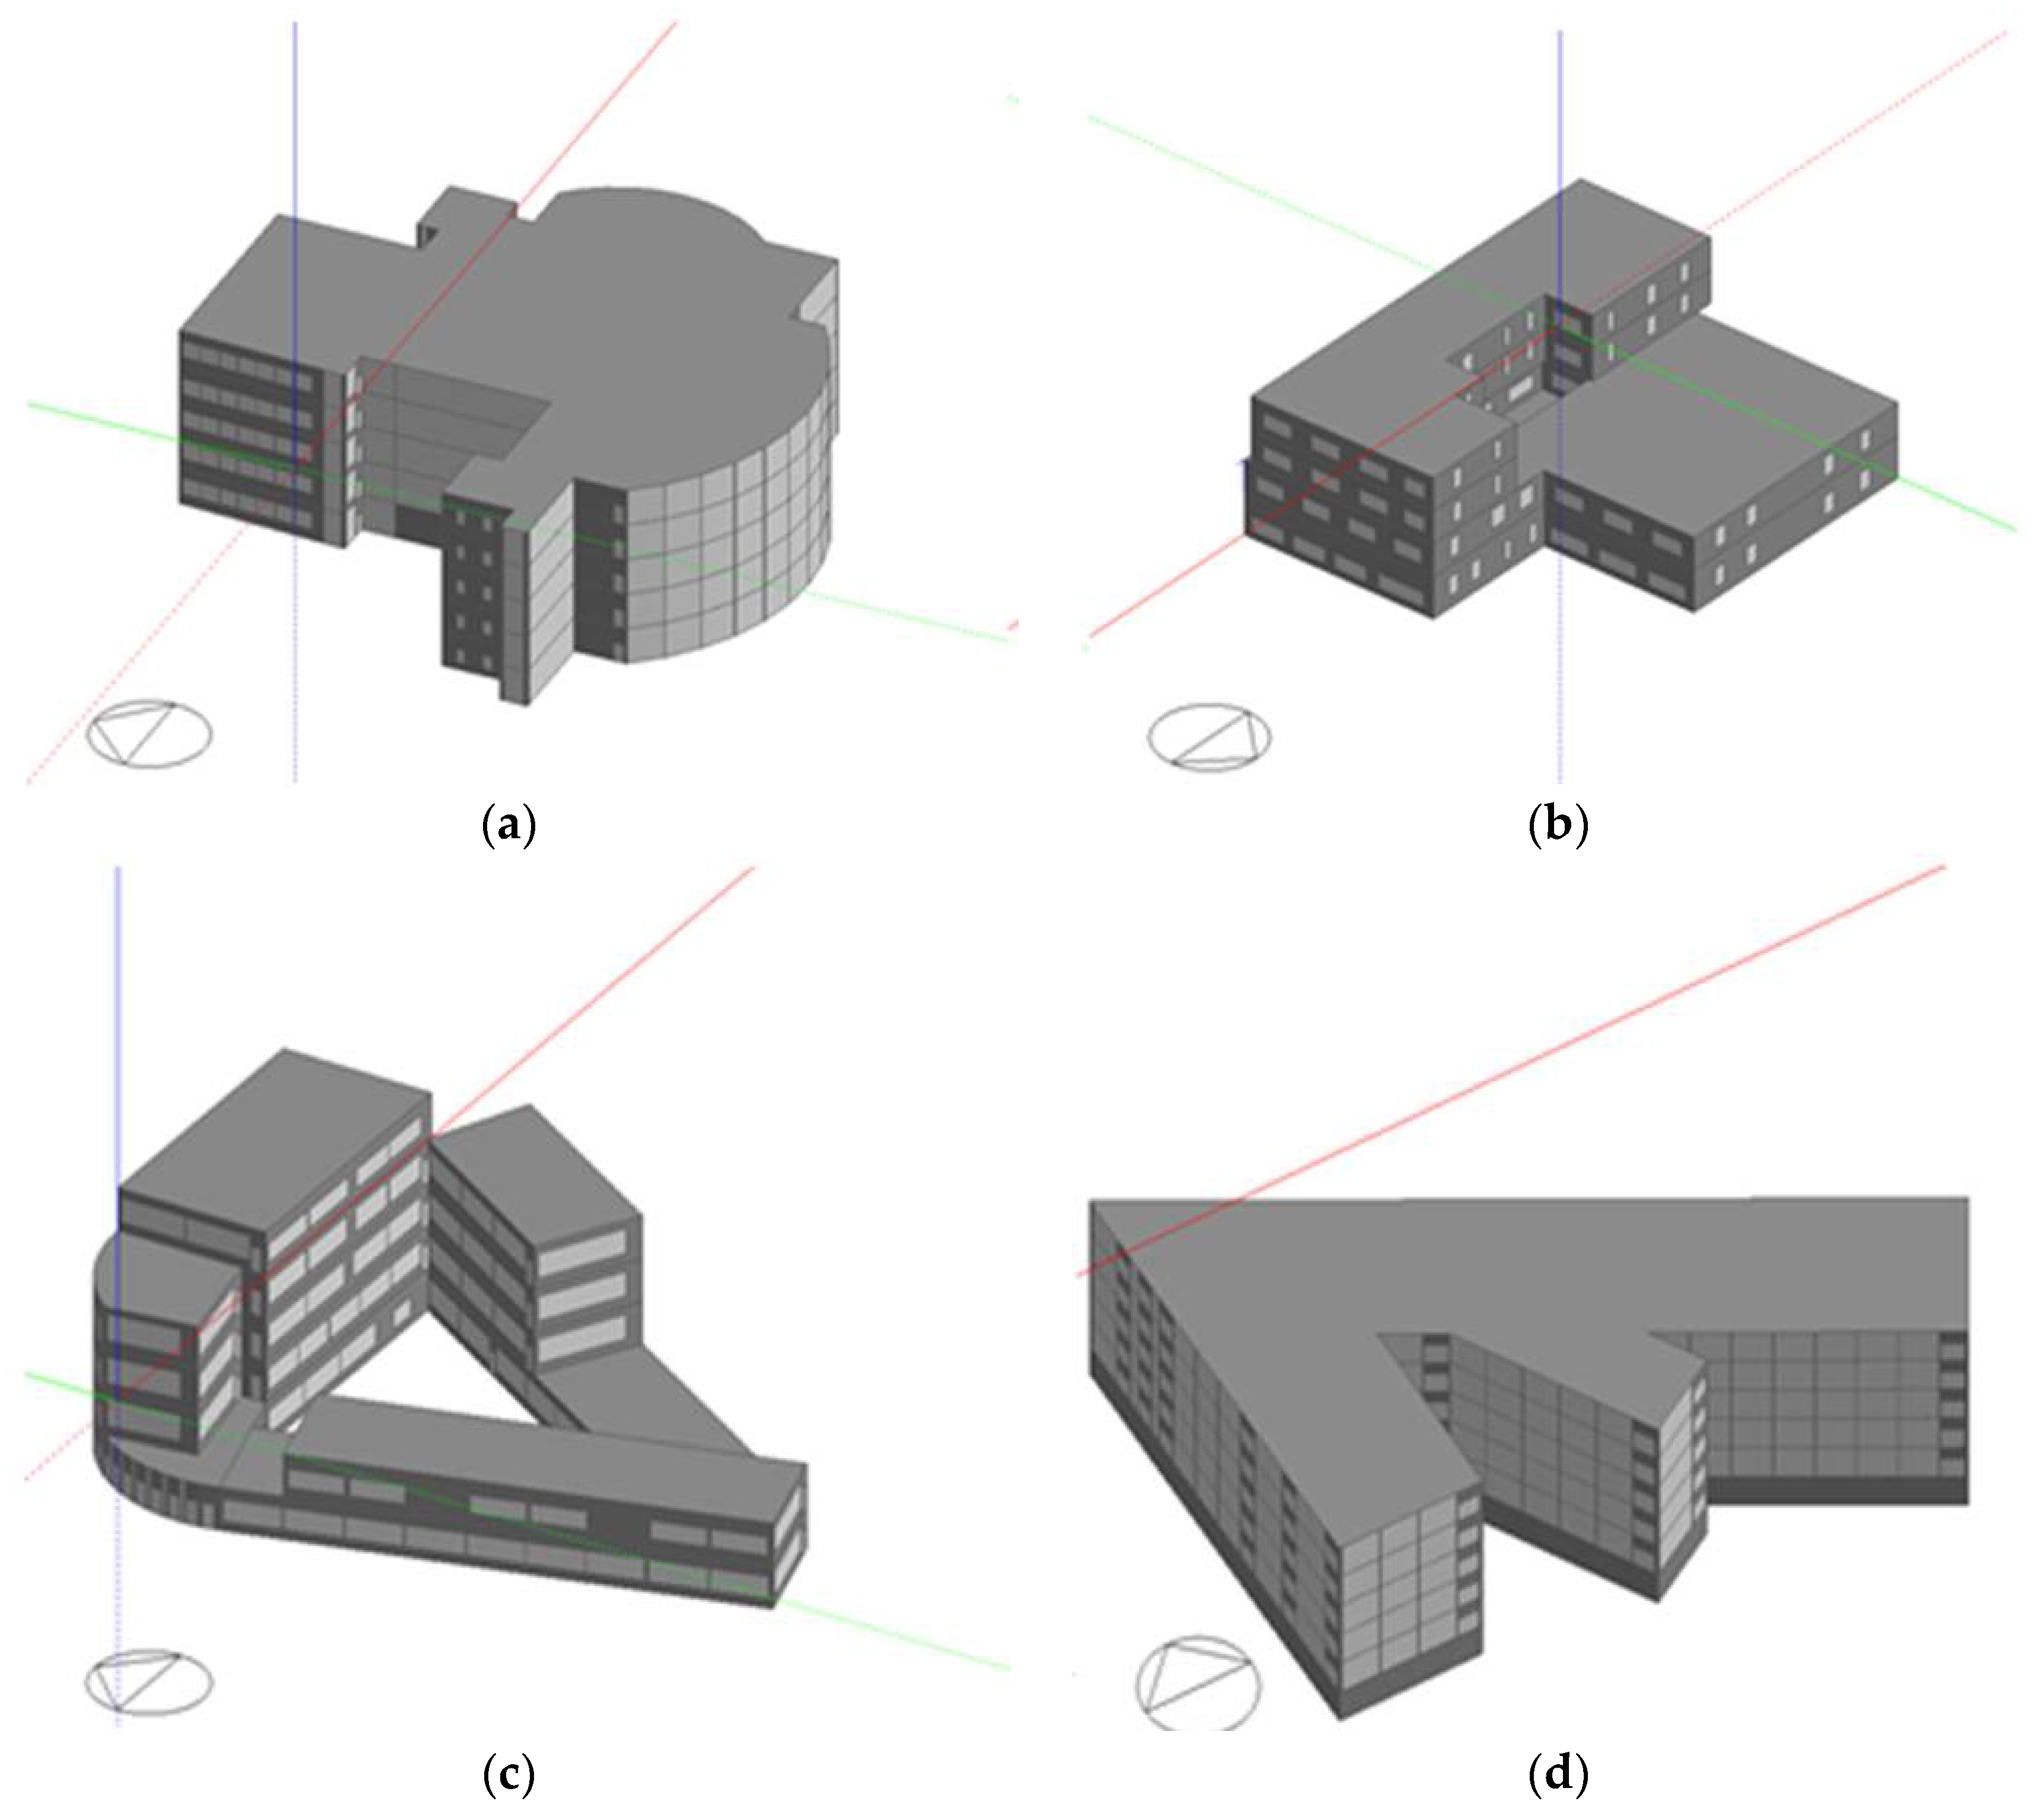
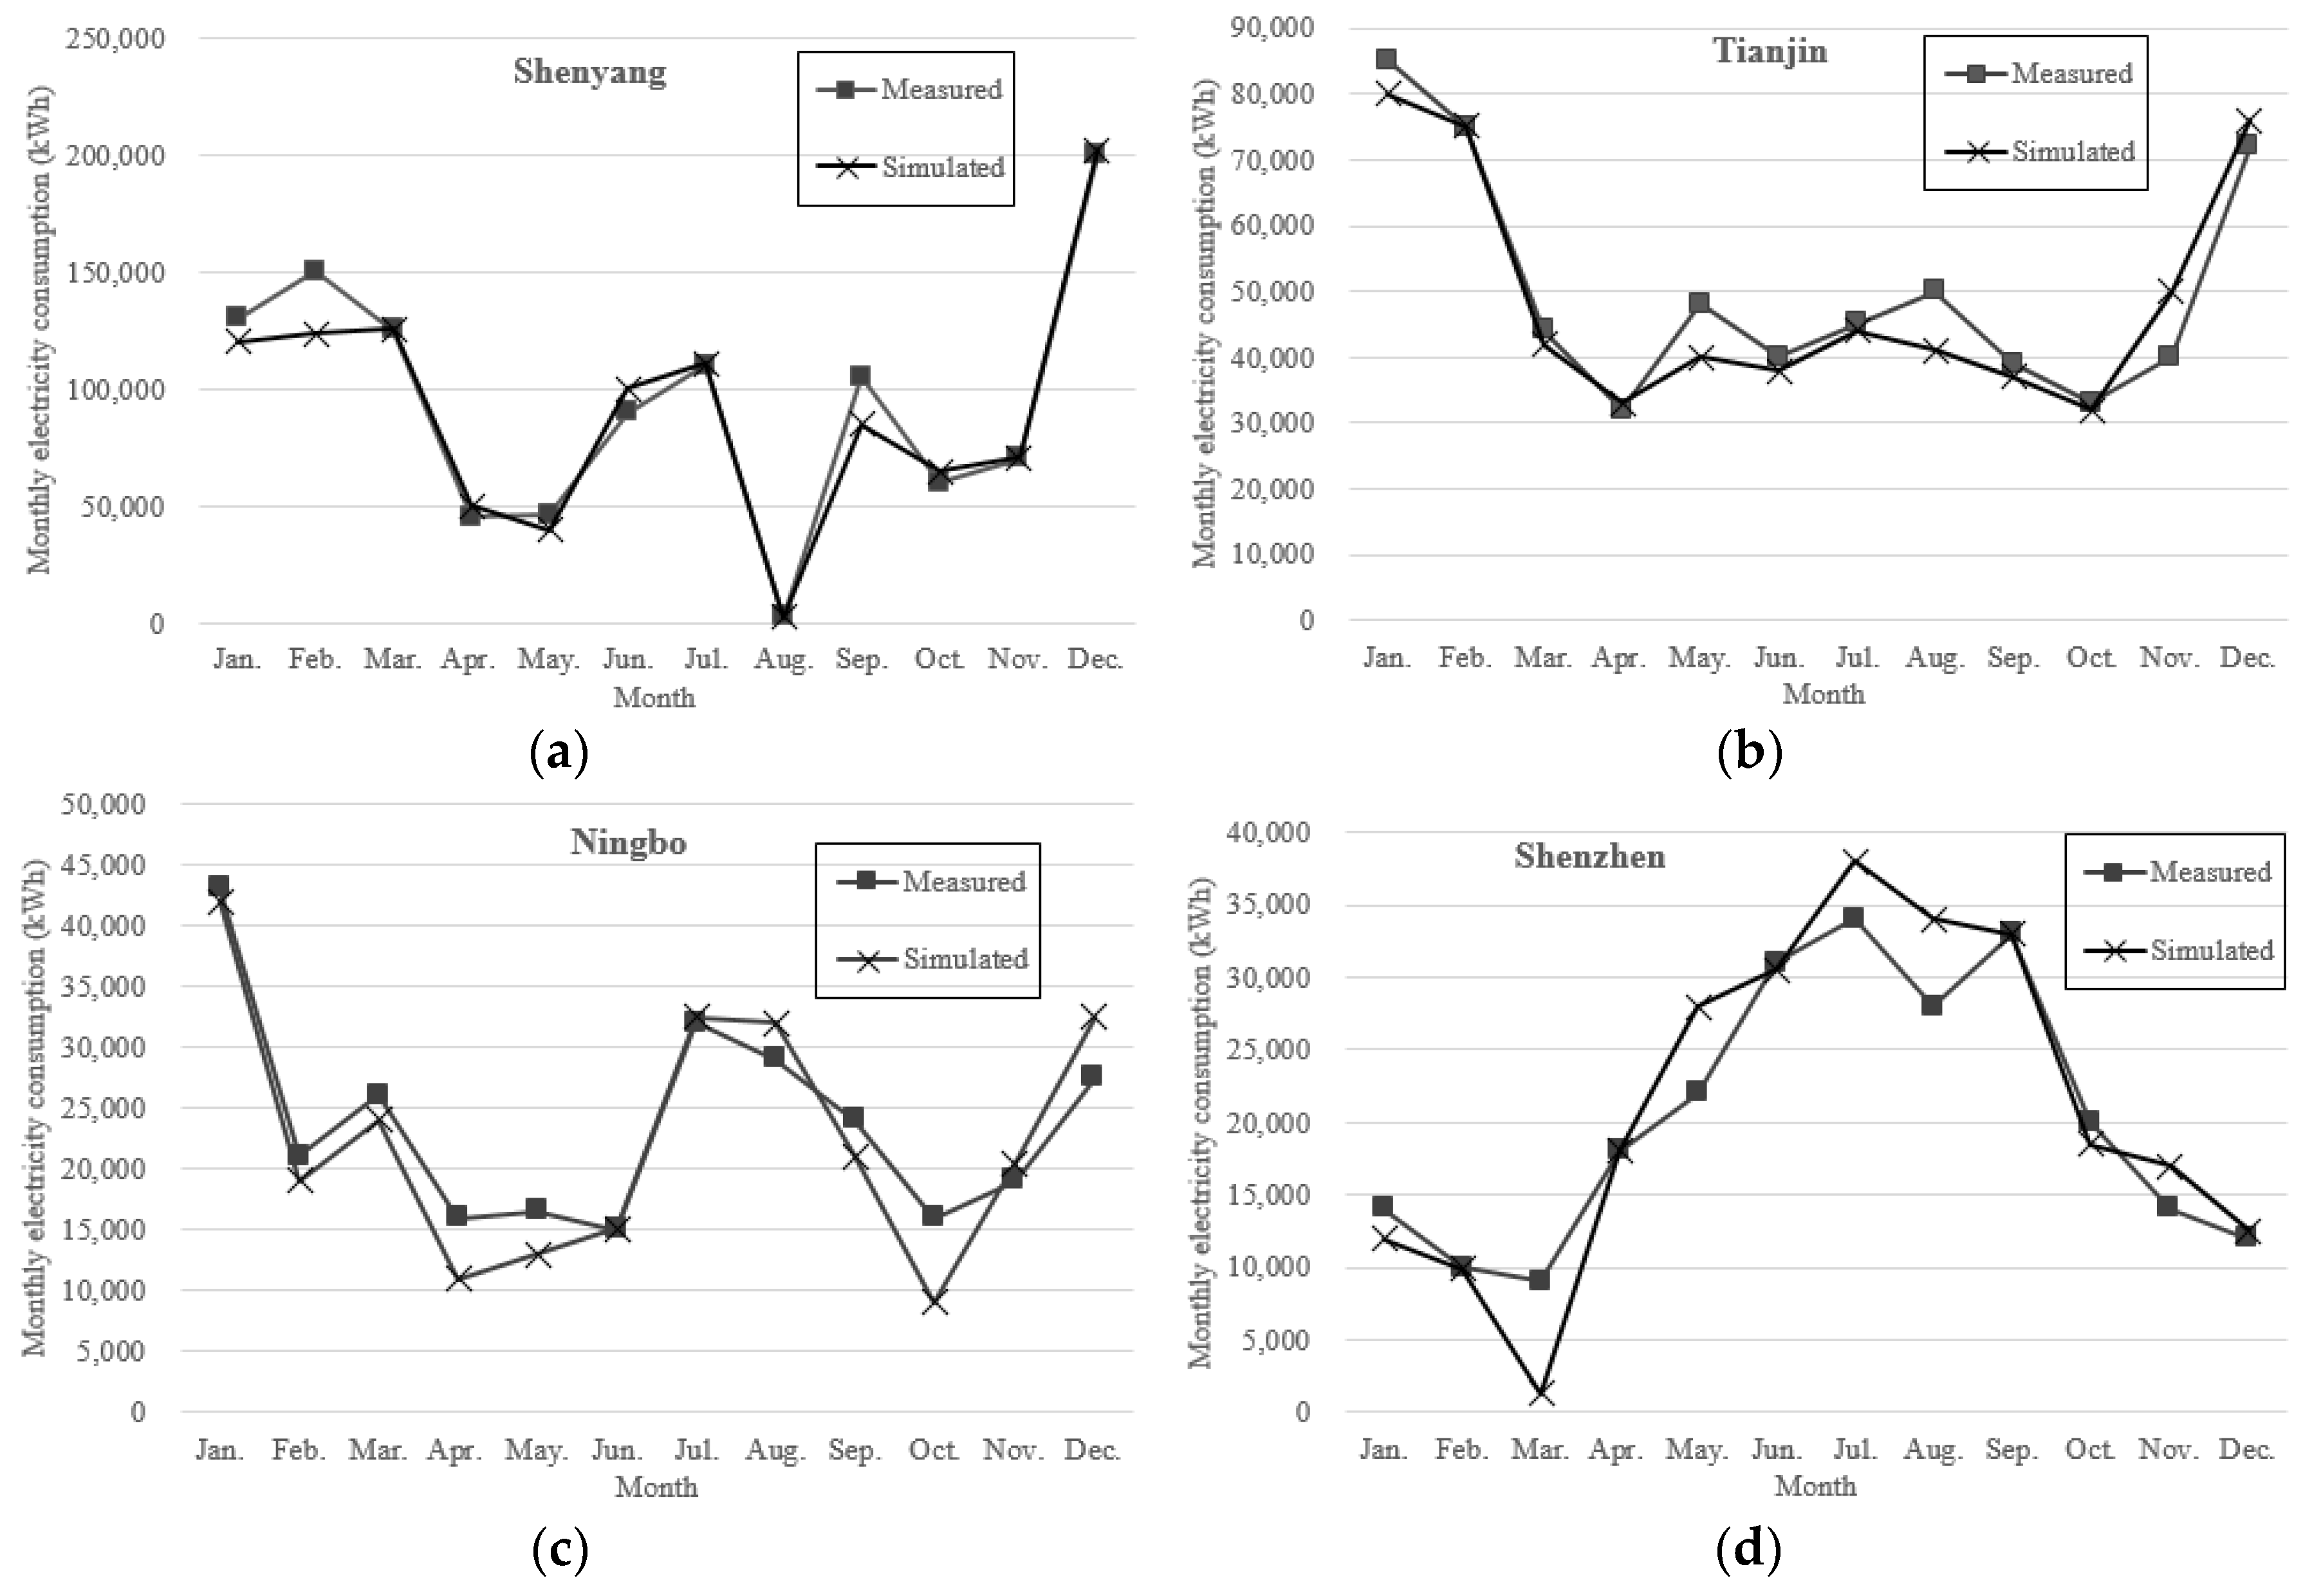
2.1. Building Energy Consumption Simulation and Verification

In order to recommend the best measures for passive building energy efficient technologies, various levels of PEEEMs should be explored. Building energy simulation is an important measure to explore various conditions that cannot be complemented in reality. DesignBuilder is one of the most comprehensive user interfaces for EnergyPlus dynamic thermal simulation engine [21,22,23]. It can generate detailed building energy performance data for a whole year. ASHRAE (American Society of Heating, Refrigerating and Air Conditioning Engineers) conducted a series of special testing programs for application range of building energy consumption simulation & thermal environment on simulation ability and building environment control system based on ANSI/ASHRAE Standard 14-2002 [24]. The evaluation results of DesignBuilder were consistent with that of EnergyPlus, which indicates that DesignBuilder is appropriate for most cases of building energy consumption simulation [25].
After establishing the energy simulation model, the simulated results should be verified. Normalized mean bias error (NMBE) and coefficient of variation of the root mean square error (CVRMSE) are introduced in ASHRAE Guideline 14-2002 [24], whose expressions are presented as Equations (1) and (2) [24]. ASHRAE Guideline 14-2002 suggests that the simulation results compared with the measured energy consumption should be reliable under the condition that the NMBE and CVRMSE were less than 5% and 15% respectively [24].
N M B E = i = 1 n ( E s i E m i ) ( n p ) × E ¯ m × 100
C V R M S E = 100 × [ ( E s i E m i ) 2 / ( n p ) ] 1 2 / E ¯ m
where E s i is the simulated energy consumption of month i (kWh); E m i is the measured energy consumption of month i (kWh); E ¯ m is the average value of measured monthly energy consumption (kWh); i is month and n is the total month of a year, n = 12; p = 1.
Five typical climate regions are classified in China, generally the severe cold (SC) region, cold (CC) region, hot summer and cold winter (HS/CW) region, hot summer and warm winter (HS/WW) region and mild region. The climate regions are divided based on monthly average temperature and heating degree days (HDD 18, °C·day) and cooling degree days (CDD 26, °C·day). The climate characteristics are listed in Table 1 [26]. Specifically, the climate in temperate regions is relatively comfortable for human beings and heating and cooling requirements for buildings are weak. So, in this research, the temperate region is not discussed.
Four office buildings were selected as case study buildings in this study. All of the four office buildings are medium sized and air-conditioned, with 60–80% practical occupancy rate. They are located in Shenyang, Tianjin, Ningbo, and Shenzhen, which can respectively represent the belonging typical climate regions of China. It is important that the case buildings are all well designed and constructed according to the 2005 edition of Design Standard for Energy Efficiency of Public Buildings (GB 50189-2005) [7]. Though this standard has been modified in 2014 [14], the 2005 edition was the mandatory standard when the buildings were built. The annual energy usage intensity (EUI) of case buildings, quotient of the energy consumption and the corresponding gross floor area, representing the building energy consumption level, are relatively low among office buildings in each climate region. A summary of main information of the case buildings, including general building information, air-conditioning system, energy efficient technologies and annual energy consumption, was shown in Table 2.
Dynamic energy simulation tool DesignBuilder was applied in the energy efficiency performance simulation of the case buildings. Based on the design drawings and practical information, four case building models were established by DesignBuilder, as shown in Figure 1. The building information, including envelop parameters, window-wall ratio, working schedule of the air-conditioning systems, occupancy densities, lighting densities, equipment densities of the building models, were set exactly according to the practical status of the case buildings, as shown in Table 2. The typical meteorological year weather data in the four cities was adopted as the input outdoor weather data.
After built the energy consumption model, the accuracy of simulation results should be tested. Comparison between the actual monthly energy consumption data and simulation data was conducted and shown in Figure 2.
The energy form of case buildings is electricity. The actual energy consumption of case buildings was collected from their energy bills based on electricity meters. As illustrated in Figure 2, the simulated energy consumption tends to follow the measured data quite closely and their variation trends seem the same. The major reasons of the variations could be considered as the following. Firstly, the climate conditions of the simulation models were typical meteorological year weather data, which were different with actual weather data. Secondly, the operation time of the simulation models were certain values while the actual operation time might be various because of special activities. Above all, the variations between simulated energy consumption and measured ones were not caused by PEEEMs of case buildings.
In order to reveal the degree of difference between simulated and measured energy consumption more visually, a summary of the NMBEs and CVRMSEs of the case buildings according to the calculation based on Equations (1) and (2) was listed in Table 3. So, the influences of building energy consumption caused by the envelop parameter changes of the building models can be reflected and predicted in the practical situation of case buildings. The verification provided scientific and rational foundation of sensitivity analysis adopted in this research below.

2.2. Modified Sensitivity Analysis

Sensitivity analysis theory refers to the observation method on responsive variations caused by motivation changes. It originally is an economic analysis method to select significant parameters from various uncertain ones and validate the influent effects on economic benefits [27]. Application of the method is growing in various fields of science in recent years, such as physics, electronics, and environics [28,29,30]. In particular, sensitivity analysis is also used in building energy efficiency study [31,32]. This method especially aims at deciding the best parameter value for an optimized selection by altering a certain parameter while keeping others remain unchanged [33]. Sensitivity coefficient, the measurement of sensitivity indicating the importance of input parameters to the outputs, can be calculated by Equation (3).
S e n s i t i v i t y   C o e f f i c i e n t = O P c h a n g e % I P c h a n g e % Δ O P ÷ O P B Δ I P ÷ I P B
where I P c h a n g e % and O P c h a n g e % are the differential rate of input and output value comparing with the base case; Δ O P and Δ I P are the variation of output and input value; O P B and I P B are the base cases of output and input value.
If the input parameters are more than one and cannot be divided, the sensitivity coefficient calculation equation should be modified. The sensitivity analysis was modified to fit the situation of more than one input parameters. The significance level of these input parameters should be evaluated first. The non-significant parameters can then be ignored. For significant parameters, the contribution weight of each parameter should be calculated, and the modified sensitivity coefficient can be calculated by the weighted sensitivity coefficient of each parameter. The weighted sensitivity coefficient was defined as
W e i g h t e d   S e n s i t i v i t y   C o e f f i c i e n t = 2 λ w j × ( Δ O P ÷ O P B Δ I P ÷ I P B ) j
where j is one of the input parameters and λ is the number of the significant input parameters.
Sensitivity analysis requires reference object, which is called base case for sensitivity coefficient calculation. With the purpose of obtaining the precise sensitivity coefficients of all types of PEEEMs in each climate regions of China, the values of initial building envelop input parameters of the four case buildings were defined as the base case values.
In order to identify the influence on building energy efficiency performance of particular changes imposed by building envelopes, the characteristic parameters of building envelop were set as input variables. According to Equations (3) and (4), the detailed calculation of modified sensitivity coefficient for PEEEMs is shown as follows.
(1) Insulation of exterior walls and roof. The comprehensive heat transfer coefficient (U-value) is the main thermal parameter of exterior wall and roof. So, the sensitivity coefficient of insulation of exterior walls and roof was defined as Equation (5).
S e n s i t i v i t y   C o e f f i c i e n t w a l l / r o o f = Δ E U I ÷ E U I B Δ U - v a l u e ÷ U - v a l u e B
where Δ E U I is the variation of energy usage intensity (EUI), kWh/(m2·a); E U I B is the baseline of EUI, kWh/(m2·a); Δ U v a l u e   is the variations of the comprehensive heat transfer coefficient of exterior walls and roof, W/(m2·K); U - v a l u e B is the baseline of the comprehensive heat transfer coefficient of exterior walls and roof, W/(m2·K).
(2) Exterior windows. Shading and glazing are the two main parts of exterior windows which influencing the building energy consumption. The influence mechanism of the two parts is different. The shading system mainly influences the radiation heat from the sun to indoor air. Heat transfer through glazing includes heat conduction, convection and radiation at the same time. In addition, the type of glazing can influence the energy consumption of HVAC and lighting at the same time. So, shading system and glazing of exterior windows were discussed separately in this paper.
The overall shading coefficient (OSC) of shading system is the characteristic parameter of shading system. So the sensitivity coefficient of shading system is
S e n s i t i v i t y   C o e f f i c i e n t s h a d i n g = Δ E U I ÷ E U I B Δ O S C ÷   O S C B
where Δ O S C is the variation of the overall shading coefficient of building shading system; O S C B is the baseline of the overall shading coefficient.
The comprehensive heat conduction coefficient (U-value) and solar heat gain coefficient (SHGC) are two important parameters describing the thermal performance of glazing [26]. Visible transmittance of glazing is the rate of visible light transmitting through glasses from outdoor to indoor to the total luminous flux illuminating on the glasses. It is the parameter describing the light transmittance performance of glazing [26]. So the HVAC energy consumption is influenced by U-value and SHGC at the same time. SHGC and visible transmittance may impact the lighting energy consumption based on lighting control. Total energy consumption can be influenced by the three parameters, which are certain values if a type of glass is selected. So the parameters cannot be analyzed separately and weighted sensitivity coefficient was adopted. As for the glazing of exterior windows, the weighted sensitivity coefficient to total energy consumption can be calculated by Equation (7).
S e n s i t i v i t y   C o e f f i c i e n t g l a z i n g = w U v a l u e Δ E U I ÷ E U I B Δ U v a l u e ÷ U v a l u e B + w S H G C Δ E U I ÷ E U I B Δ S H G C ÷ S H G C B + w v t Δ E U I ÷ E U I B Δ v t ÷ v t B
where Δ U - v a l u e   , Δ S H G C and Δ v t are the variations of the comprehensive heat transfer coefficient of exterior windows, W/(m2·K), the solar heat gain coefficient of glazing and the visible transmittance of glazing respectively; U - v a l u e B , S H G C B and v t B are the baseline of the comprehensive heat transfer coefficient of exterior walls and roof, W/(m2·K), the solar heat gain coefficient of glazing and the visible transmittance of glazing respectively.
If the parameters of U - v a l u e , S H G C or v t are evaluated as non-significant, the relative weight should be 0.
Balancing of costs and energy savings is important in energy efficiency. The optimizing goal is to find the strategy with the best energy efficiency effects and economic benefits. Because the prices of materials and structures are related to the thermal characteristics, the sensitivity coefficients have the meaning of ratio of output energy savings and costs. The economic benefits are also included in the modified sensitivity analysis. So the optimized strategy can realize the best energy efficient effect and economic benefits at the same time.

3. Results

In this section, the energy efficiency effects were evaluated based on the modified sensitivity analysis. The sensitivity analysis schemes for exterior walls, roof, glazing of windows and shading system have been designed based on the general applied forms. The energy consumption of each scheme has been calculated based energy consumption model in DesignBuilder. The process and results of exterior wall insulation, roof insulation, exterior windows glazing, and shading system were described in detail in Section 3.1, Section 3.2, Section 3.3 and Section 3.4 respectively.

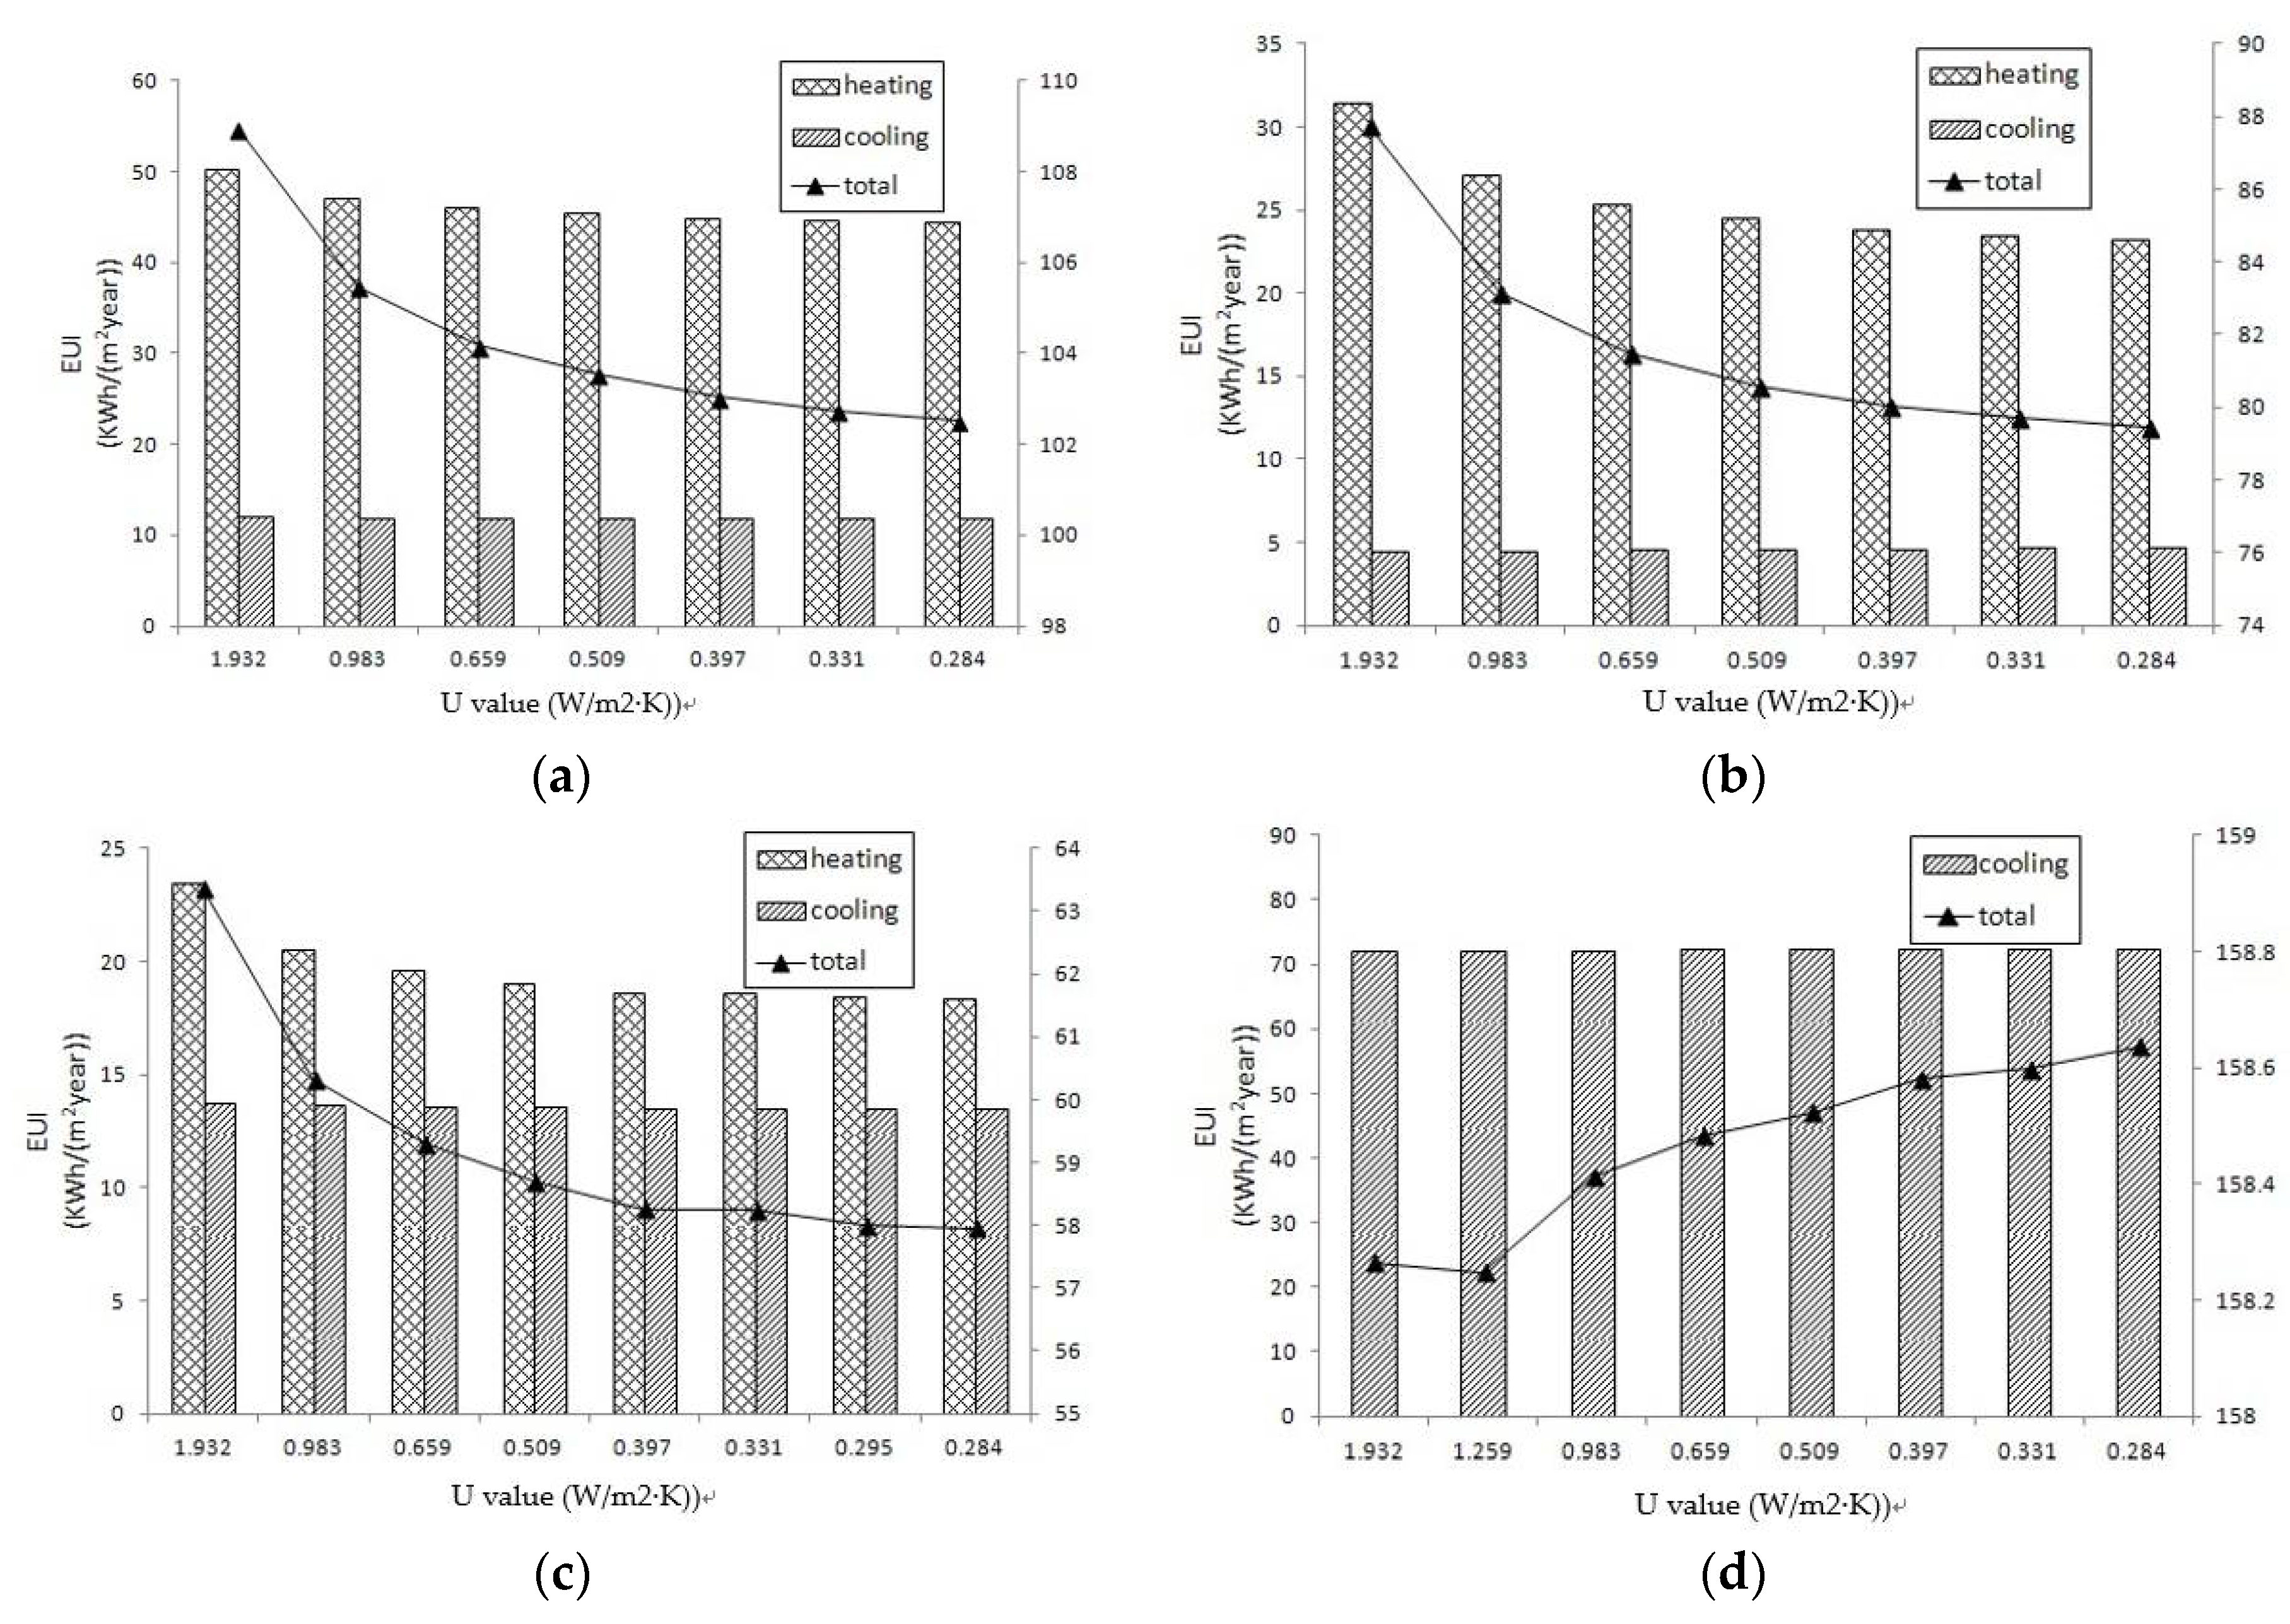
3.1. Exterior Wall Thermal Insulations

Extrusion polystyrene (EPS) is the most commonly applied and mature insulation system for exterior wall in China because of the reasonable price and great thermal performance such as low density and low thermal conductivity [34]. In this paper, all of the case buildings are installed with EPS as the exterior wall insulation material as shown in Table 2. EPS Layer is located between an inside layer of 100 mm concrete block and an outside layer of 100 mm brickwork.
In order to compare the building energy consumption simulation results of the four case buildings, the sensitivity analysis scheme of exterior wall insulation was designed. According to the practical construction experience on building envelop insulation, the U-value of common exterior wall with 120 mm EPS insulation can reach 0.284 W/(m2·K), which meets the requirements of the newest edition of design standard for energy efficiency of public buildings in China perfectly [26]. So eight levels of EPS thickness from 0 mm to 120 mm with a 20 mm step-length increment were applied for building model simulation. The U-values of the exterior walls with eight different EPS insulation thicknesses were from 1.932 W/ (m2·K) with 0 mm to 0.284 W/ (m2·K) with 120 mm, as shown in Table 4.
Building energy simulation results of total energy consumption include HVAC (cooling and heating) electricity, lighting and plug electricity, driving system electricity and specific energy consumption. The influence of different U-values of exterior wall on heating, cooling, and total energy consumption was shown in Figure 3. It is obvious that the cooling energy consumption varies little with the U-values change. The largest variation of cooling EUI is only 0.34 kWh/ (m2·a), which only accounts for 0.47% of the total EUI of the building in Shenzhen. Compared with the cooling energy consumption, heating energy consumption decreases quite a few along with the reduction of U-value. The conclusion can be drawn that the impact of the U-value of the exterior wall is mainly on heating energy consumption. Except for building in Shenzhen without heating supply, the total EUIs of other three case buildings decrease as much as 5.88%, 9.47%, and 9.03% respectively with the exterior wall insulation thickness changing from none to 120 mm EPS insulation.
The sensitivity analysis results of the U-value of the exterior wall were shown in Table 4. The sensitivity coefficient values of buildings in Shenyang, Tianjin and Ningbo are positive, indicating that lower U-value can realize better building energy efficiency mainly by reducing HVAC energy consumption. While the sensitivity coefficient values of building Shenzhen are almost negative and the average value is 10% smaller than that of the other three buildings, which means that exterior wall insulation can slightly increase building energy consumption in HS/WW region of China. The reason is that the average outdoor air temperature is much higher than that of other climate regions, so exterior walls with lower heat transfer coefficient cannot make a great contribution to energy efficiency of the building in HS/WW region. On the other hand, the temperature difference between day and night in the HS/WW region is smaller than other climate regions in summer, so thermal insulation could enhance the thermal storage capacity of the exterior wall, which can result in a large amount of heat released into the room at night, leading to the increase of the cooling load as well as the cooling energy consumption.
The sensitivity coefficients, illustrated in Table 4, present stable growth trend with the increment of the exterior wall insulation thickness (reduction of the U-value). So, the level of exterior wall insulation with the largest value of sensitivity coefficient is selected as the best choice in SC region, CC region, and HS/CW region. The second primary option is 100 mm EPS insulation with the large change of sensitivity coefficient from that of 80 mm EPS insulation. As for HS/WW region, the insulation layer of 10 mm thickness or no insulation layer are considered better than others. So, no insulation layer is recommended in HS/WW region because of low costs.

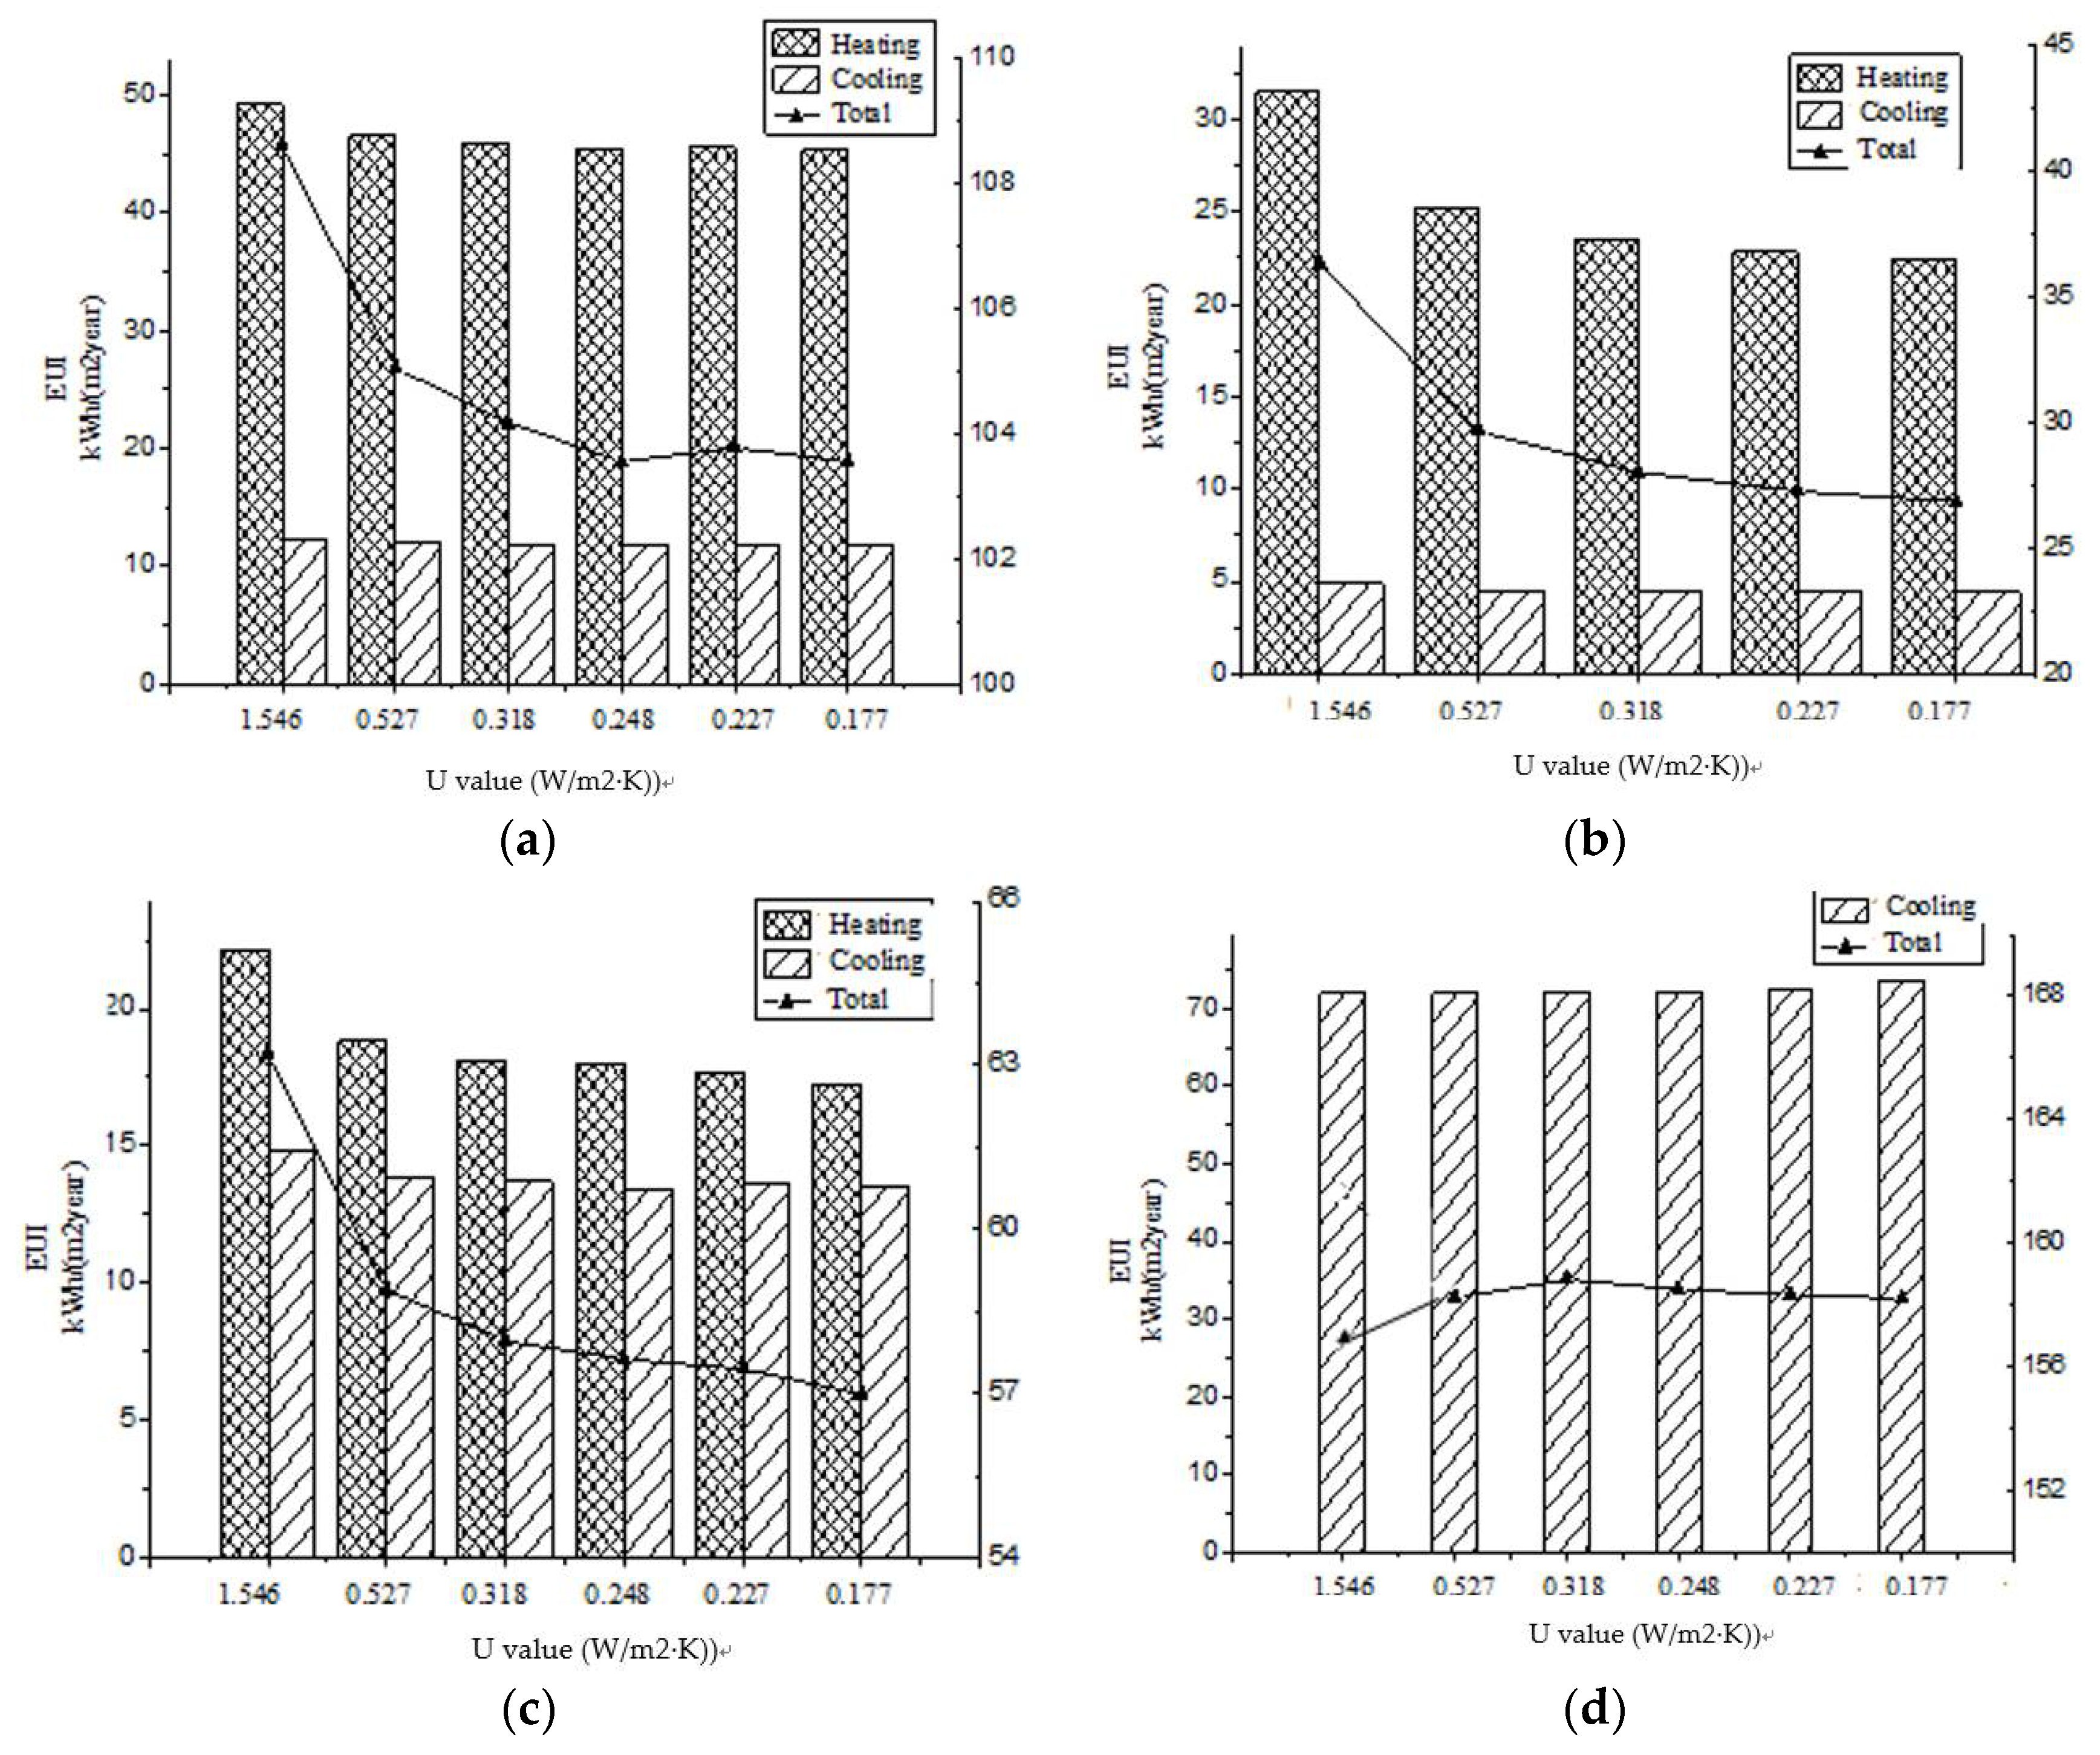
3.2. Roof Thermal Insulation

All of the case buildings also selected EPS as the roof insulation material. Table 2 shows the roof insulation information of the case buildings. In order to compare the building energy consumption simulation results of the four case buildings, this paper designed the sensitivity analysis scheme of roof insulation measures. According to the practical construction experience on building envelop insulation, the U-value of roof with 200 mm EPS insulation is 0.177 W/(m2·K), which meets the requirements of the latest edition of design standard for energy efficiency of public buildings in China perfectly [26]. Six levels of EPS thickness from 0 mm to 200 mm with a 50 mm step-length including the thickness values of the case buildings were applied for building model simulation and the U-values of the roofs with six different EPS insulation thicknesses were from 1.546 W/(m2·K) with 0 mm to 0.177 W/(m2·K) with 120 mm.
The influence of different U-values of exterior roof on heating, cooling and total energy consumption was shown in Figure 4. It is obvious that the cooling energy consumption varies little with the U-values change. Comparing with the buildings without roof insulation layer (the thickness of the roof insulation layer is 0 mm), the largest energy-saving rates of the three buildings in Shenyang, Tianjin and Ningbo are 4.47%, 8.93% and 9.84% respectively. However, the energy consumption increases with the thickness of insulation layer in building in Shenzhen. It means that the effect of insulation is mainly to reduce heat loss during heating. When heating is not considered in warm winter regions, the insulation will result in increasing energy consumption on the contrary. The mechanism is similar to the insulation of exterior walls for buildings in HS/WW regions.
Table 5 shows the sensitivity analysis results of the U-value of the roof of the case buildings respectively. The sensitivity coefficient values of building in Shenyang, Tianjin and Ningbo are almost positive, which, similar to the exterior wall, means lower U-value can realize better building energy efficiency, mainly by reducing HVAC system energy consumption in a certain range. The rate of the sensitivity coefficient values turns rapid increasing since 135 mm EPS insulation in Shenyang, 100 mm EPS insulation in Tianjin and 135 mm EPS insulation in Ningbo. The corresponding U-values are inflection points. So the recommended U-value range of roof is considered to be more than 0.318 W/(m2·K).
While the sensitivity coefficient values of building Shenzhen are almost negative and the average value is 1–2 magnitude smaller than that of the other three buildings, indicating that roof insulation can slightly increase building energy consumption in HS/WW region of China. That is because in HS/WW region, preventing heat transfer through building roofs in summer is much more important than heat storage in winter. Combining with EUI, 30 mm insulation layer is recommended. The sensitivity coefficients of building in Shenyang, Tianjin, and Ningbo present stable growth trend with the increment of the roof insulation thickness (reduction of the U-value). Especially for the building in Tianjin, the sensitivity coefficients are more stable and the average value is higher than that of buildings in Shenyang and Ningbo, which means that buildings in CC region have the greatest energy efficiency contribution in the aspect of roof insulation.
Based on the above analysis, the level with the most sensitive for roof insulation layers are selected as recommended option for case buildings, 200 mm, 200 mm, 200 mm, 30 mm respectively.

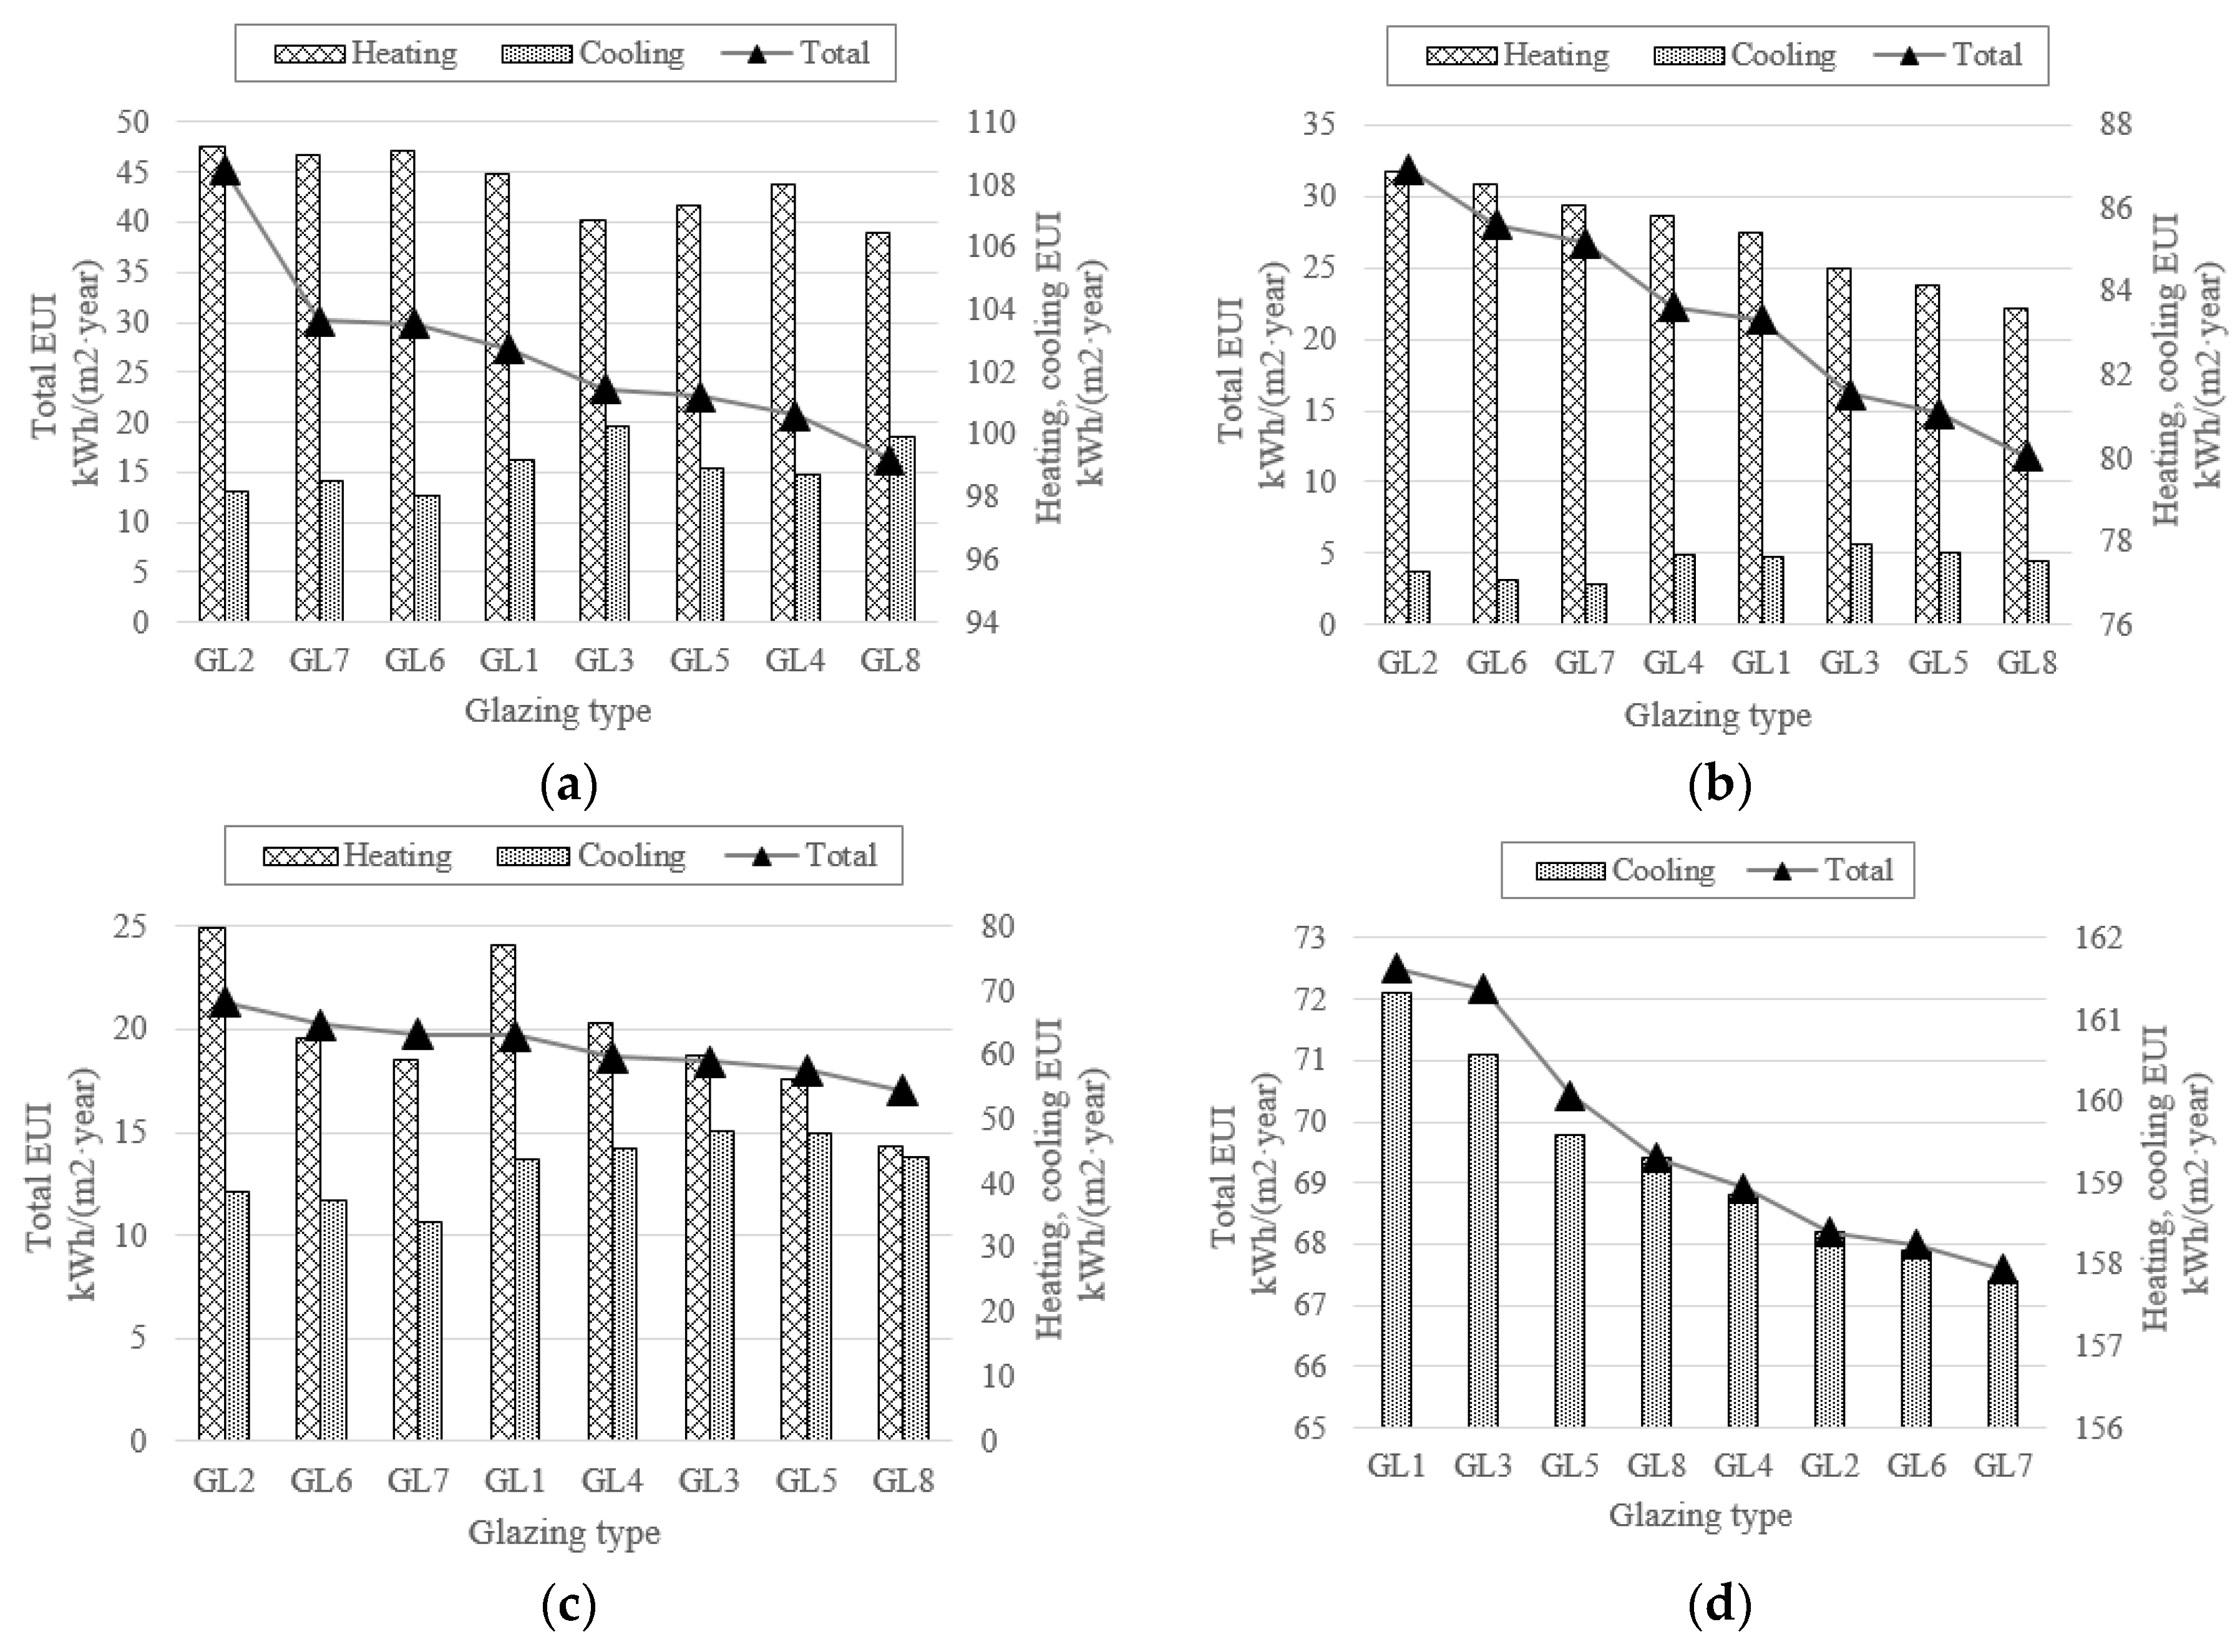
3.3. Glazing of Exterior Windows
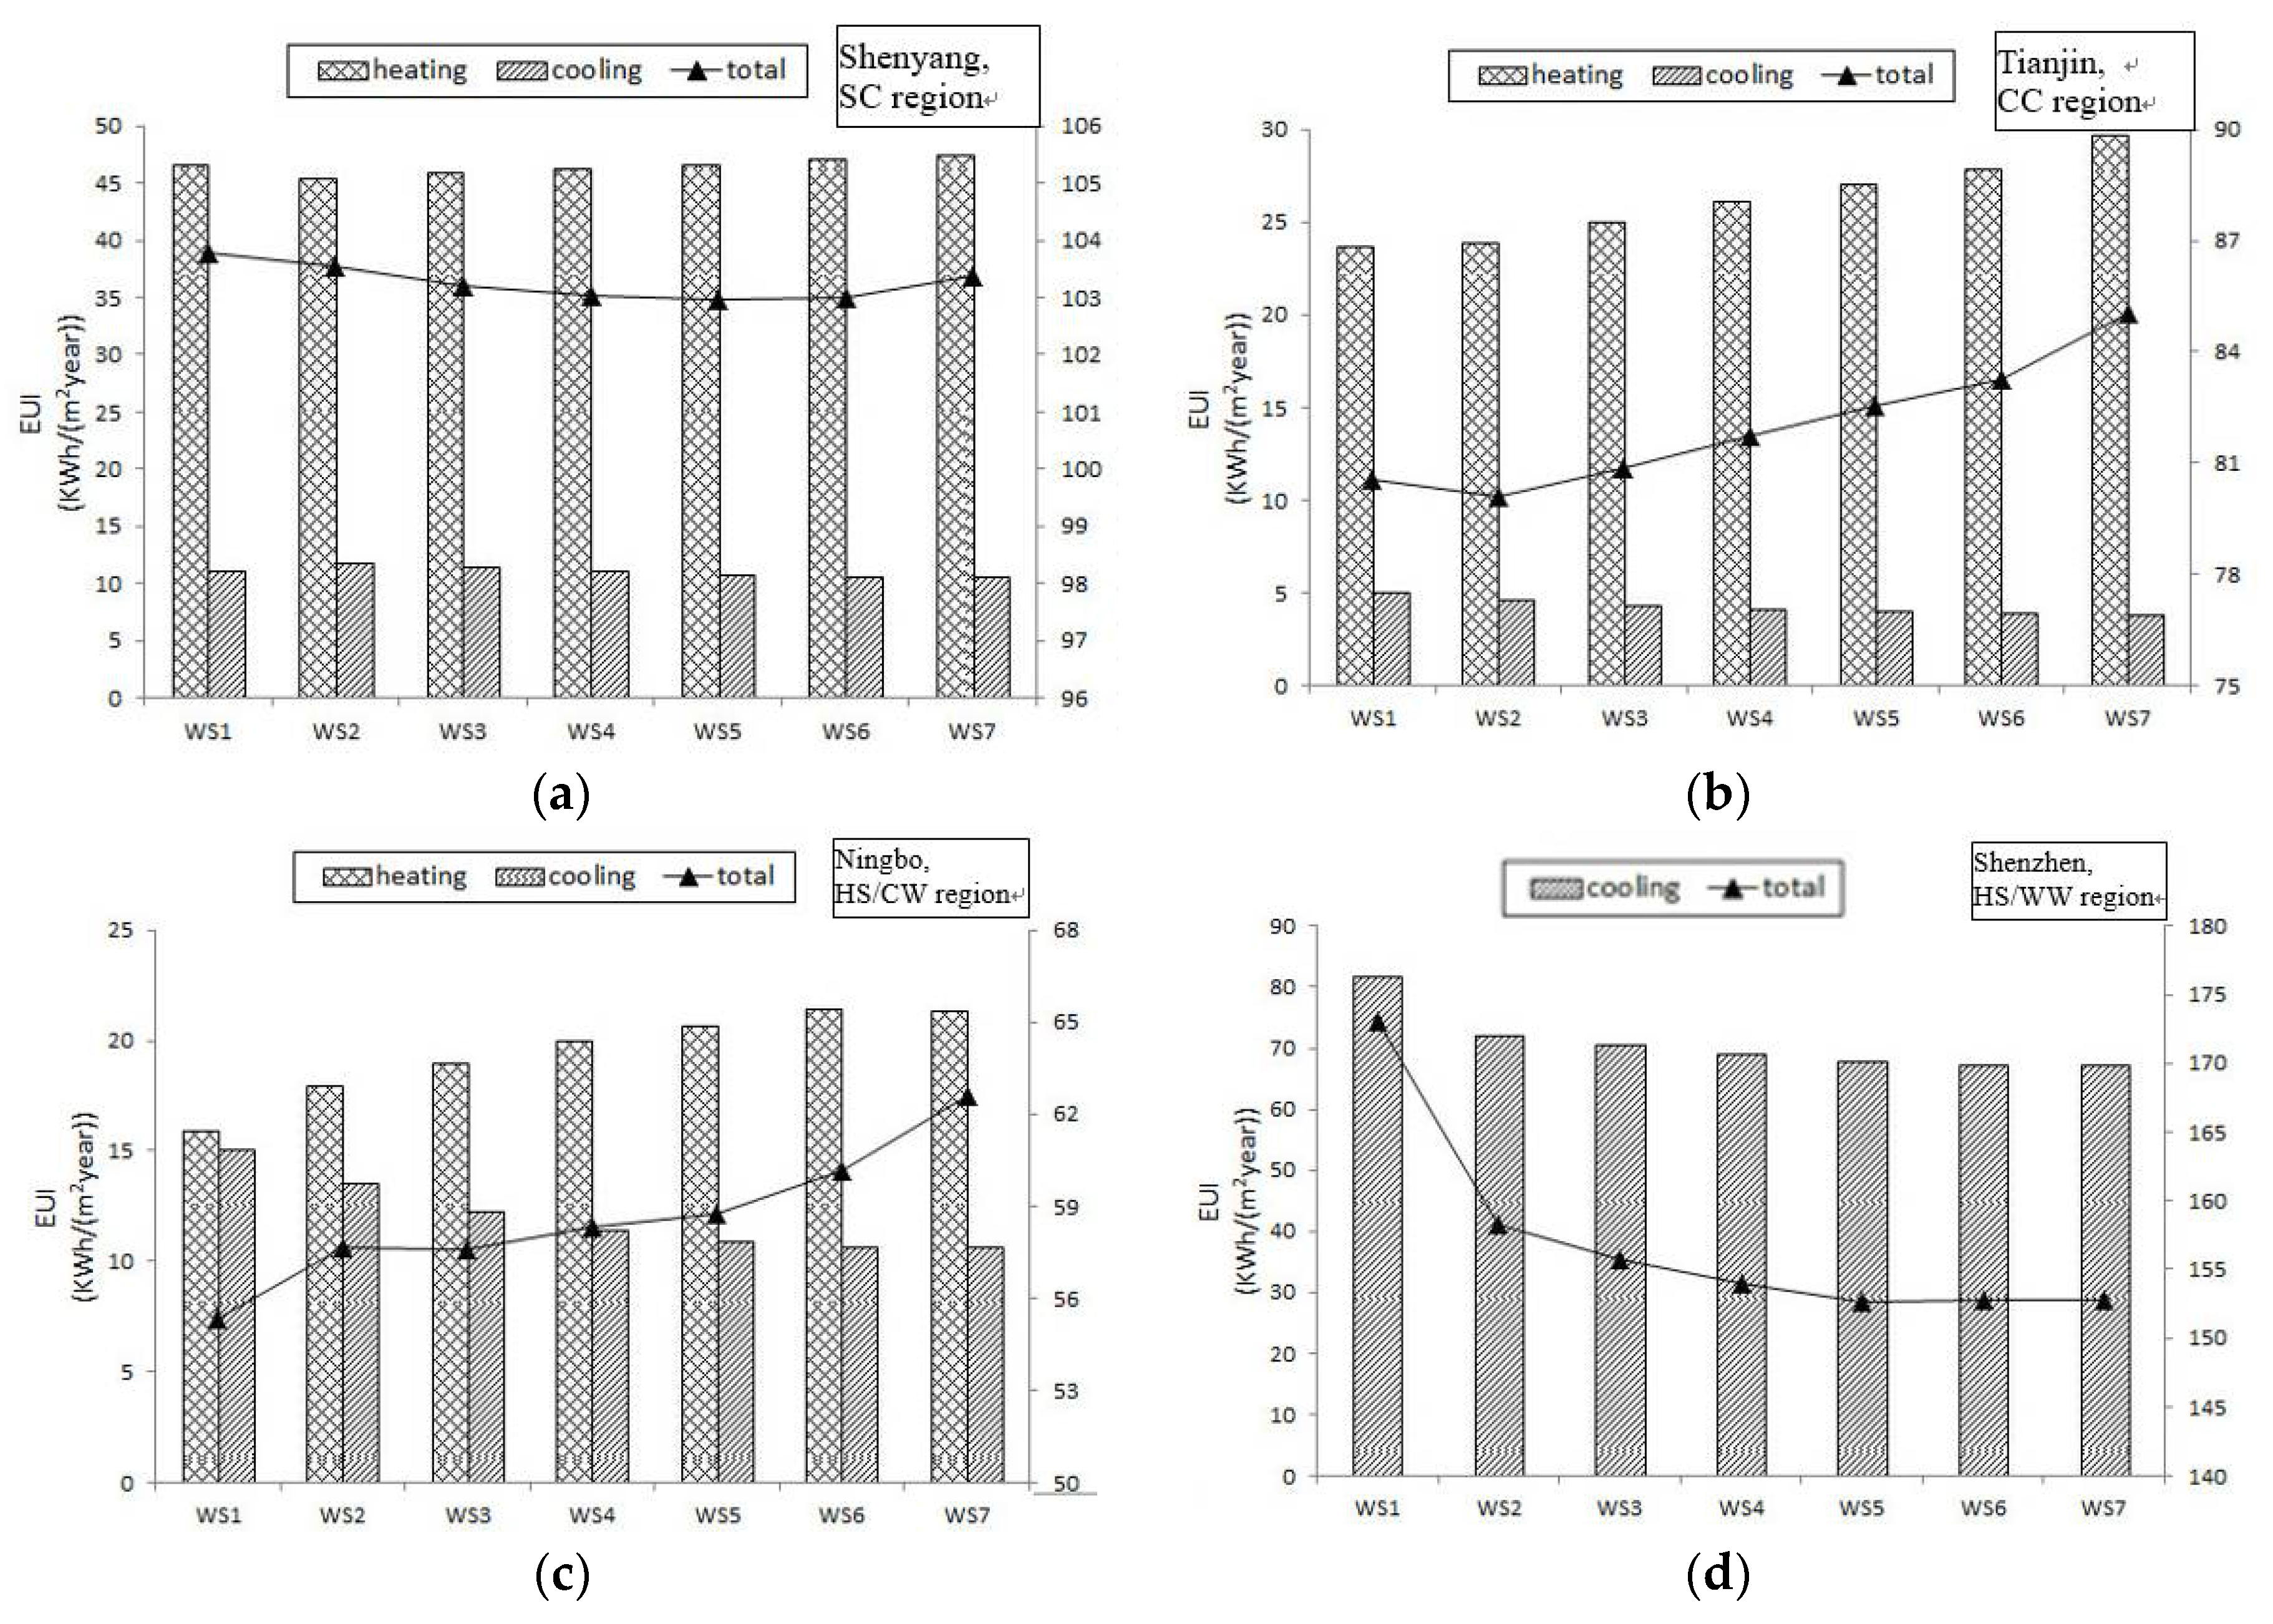
The type of glazing can influence the energy consumption of HVAC and lighting at the same time. In this analysis, the lighting was setting controlled with the indoor illuminance. The variation of total energy consumption imposed by glazing type was evaluated. Single, double and triple layer glazing types with different coating materials such as clear, reflective, Low-E, green and electrochromism were selected as glazing scheme experienced in energy consumption models [35]. In addition, the glazing layer and filling gas were also different from each other. The certain values of U-value, SHGC and visible transmittance of different glazing types were shown in Table 6.
Total EUI with different types of glazing in four case buildings were calculated and shown in Table 6. With the glazing types changing, simulation results of the four case buildings present fluctuating variation, which is different with the results of the exterior wall and roof insulation, as shown in Figure 5. So the energy efficient effects should be evaluated comprehensively. The significant level of U-value, SHGC and visible transmittance were conducted by “Weight Estimation” in SPSS 22. The results were shown in Table 7 indicates that SHGC is a significant parameter in all climate regions. U-value is significant for buildings located in Shenyang, Tianjin and Ningbo. It means that U-value and SHGC mainly influence heating and cooling energy consumption respectively. It is reasonable for the perspective of heating and cooling load formation mechanism. For SC and CC regions, heating load is much higher than cooling load because of the large difference of indoor and outdoor temperature. Solar radiation is relatively weak in cold winter regions than hot summer regions. So, the influence of U-value turns weak while SHGC turns strong from north to south in China. Visible transmittance is not significant for all case buildings because the lighting energy consumption is relatively low comparing with heating and cooling energy consumption.
The weighted sensitivity analysis results of glazing types on total EUI of the four case buildings were calculated according to Equation (7) and shown in Table 8 and Table 9. As shown in Table 8 and Table 9, the tendency of weighted sensitivity coefficient in the four case buildings is different.
(1) The weighted sensitivity coefficients in Shenyang and Tianjin are generally negative, which means glazing with low U-value and high SHGC has the tendency of reducing energy consumption in cold regions. This tendency turns weak from north to south climate regions. The turning point is Ningbo with the positive weighted sensitivity coefficients of most glazing types. The weighted sensitivity coefficients are positive in Shenzhen because only SHGC is the significant parameter influencing building energy consumption of glazing. Based on the above tendency, the glazing types with the minimum negative weighted sensitivity coefficients should be considered as the best choices in the SC, CC and HS/WW regions. The glazing type with the minimum positive weighted sensitivity coefficient should be selected as the optimal one in HS/CW region.
(2) GL5 is the eligible glazing type in Shenyang and Tianjin. In Shenzhen, GL7 should be the best choice based on the weighted sensitivity coefficient. However, GL5 is more commonly used and the sensitivity coefficient of GL5 is similar with GL7. So GL5 is considered as proper too. The growth tendency of sensitivity coefficients gets faster since GL3. So the glazing type with SHGC more than 0.710 is not recommended. In Ningbo, GL3 is the best choice. So low-E glasses are proper for all regions. Because GL5 is the base case of building in Ningbo and the coefficient varies little of GL3, so GL5 can also be considered proper for buildings in Ningbo. In general, GL5, namely double glazing with 3 mm low-E, 3 mm clear and 6 mm air, can be considered as the best glazing type for the four climate regions. If considering costs, GL3, namely low-E glazing, can also be a good choice for HS/CW and HS/WW regions. To clarify the selecting process, the index ranges of U-value and SHGC were recommended as follows. The glazing types with the U-value more than 2.577 W/(m2·K) and SHGC less than 0.687 was proper for SC region and CC regions. The glazing type with SHGC between 0.490 and 0.687 was recommended for building in HS/WW region. The glazing type with SHGC around 0.7 and U-value less than 4.233 W/(m2·K) was suitable for buildings in HS/CW region.

3.4. Shading System

The most commonly used shading systems are fixed shading systems, so movable shading systems, as well as artificial regulations, are not considered in this paper. Traditional fixed shading system includes interior shading and exterior shading, generally diffusing blinds, overhanging board, and louver respectively. Shading system can reasonably prevent sunlight shining through the windows. Overall shading coefficient (OSC) is the main parameter to describe the shading effect of shading system and windows [26]. Buildings with lower OSC usually obtain less radiant heat. So the energy efficient effect of shading system is a balancing problem [36]. Research has demonstrated the fact that shading system can effectively reduce cooling energy consumption in summer [37,38]. However, the influence of shading system on heating energy consumption in winter was seldom studied. In fact, the lighting energy consumption is also influenced by the shading system. In this paper, six levels of simulation schemes including no shading system, interior shading, and exterior shading system were proposed to discuss the influence of different shading systems on total energy consumption, including heating and cooling energy consumption and lighting energy consumption. OSC is the multiplication of shading coefficient of glasses and exterior shading coefficient of building (SD). The glass of double layer with 3 mm low-E, 3 mm clear and 6 mm air has been proved as the best in Section 3.3. So in this section, this type of glazing, with the shading coefficient of 0.52, were adopted in simulation. OSC for each type of shading was shown in Table 10. The occupant usage pattern of the interior shading is extremely complex and random [39,40]. So the usage rate was assumed as 1 in the simulation of WS2–WS7.
Table 10 shows the detail information of the 7 shading combination forms from no shading to long length of overhanging board and louver of exterior shading. The sizes of horizontal overhanging board and louver altered in each level in order to accurately test the influence on building energy consumption. The energy consumption simulation results are shown in Figure 6.
Comparing no exterior shading system of WS1 with the basic shading of WS2, cooling energy consumption can be reduced by 0.99%, 16%, 18.55% and 13.78% respectively while the heating consumption increasing by 5.68%, 19.54% and 12.06% for buildings in Shenyang, Tianjin and Ningbo. The total energy consumption in a whole year of the case buildings presents approximate linear distributions with the length increment of the overhanging board. Comparing with louver shading of WS6, overhang shading of WS3 with the same length of overhanging board can reduce the annual total energy consumption by 3.82% and 6.86% respectively in the building in Tianjin and Ningbo. While for building in Shenzhen, louver shading performs better energy-saving effect than the overhanging board shading.
The sensitivity coefficients of shading systems to EUI are calculated in Table 9. The variation trends of four case buildings are quite different. This is because the base cases are at different levels. For building in Shenyang, the base case is diffusing blinds of interior shading. The sensitivity coefficient of Shenyang is negative; however, it changes from positive to negative in Tianjin. This means, in Shenyang, the high level of shading system cannot make better effects on energy efficiency and no shading is the best choice. In Tianjin, only the value of WS1 is positive and the absolute values of negative ones tend smaller. This means a high level of shading can just make limited effects on energy efficiency. So, the base case is the best choice. The sensitivity coefficients of building in Ningbo and Shenzhen are positive. This means for buildings in hot summer climate regions, the high-level shading system tends to make the energy consumption lower. So WS6 with the largest sensitivity coefficient is the best choice. As for building in Shenzhen, the value of sensitivity coefficient is almost positive because the base case is WS7. So, the base case is recommended. It means that OSC is recommended to be less than 0.35 in hot summer regions.
From the systemic view, the sensitivity of buildings in Shenyang and Tianjin are generally negative and data of Ningbo and Shenzhen is positive. This means that the energy efficient effect of shading system in Ningbo and Shenzhen is more significant than in Shenyang and Tianjin. So the shading system in hot summer regions, especially HT/WW region, is essential.

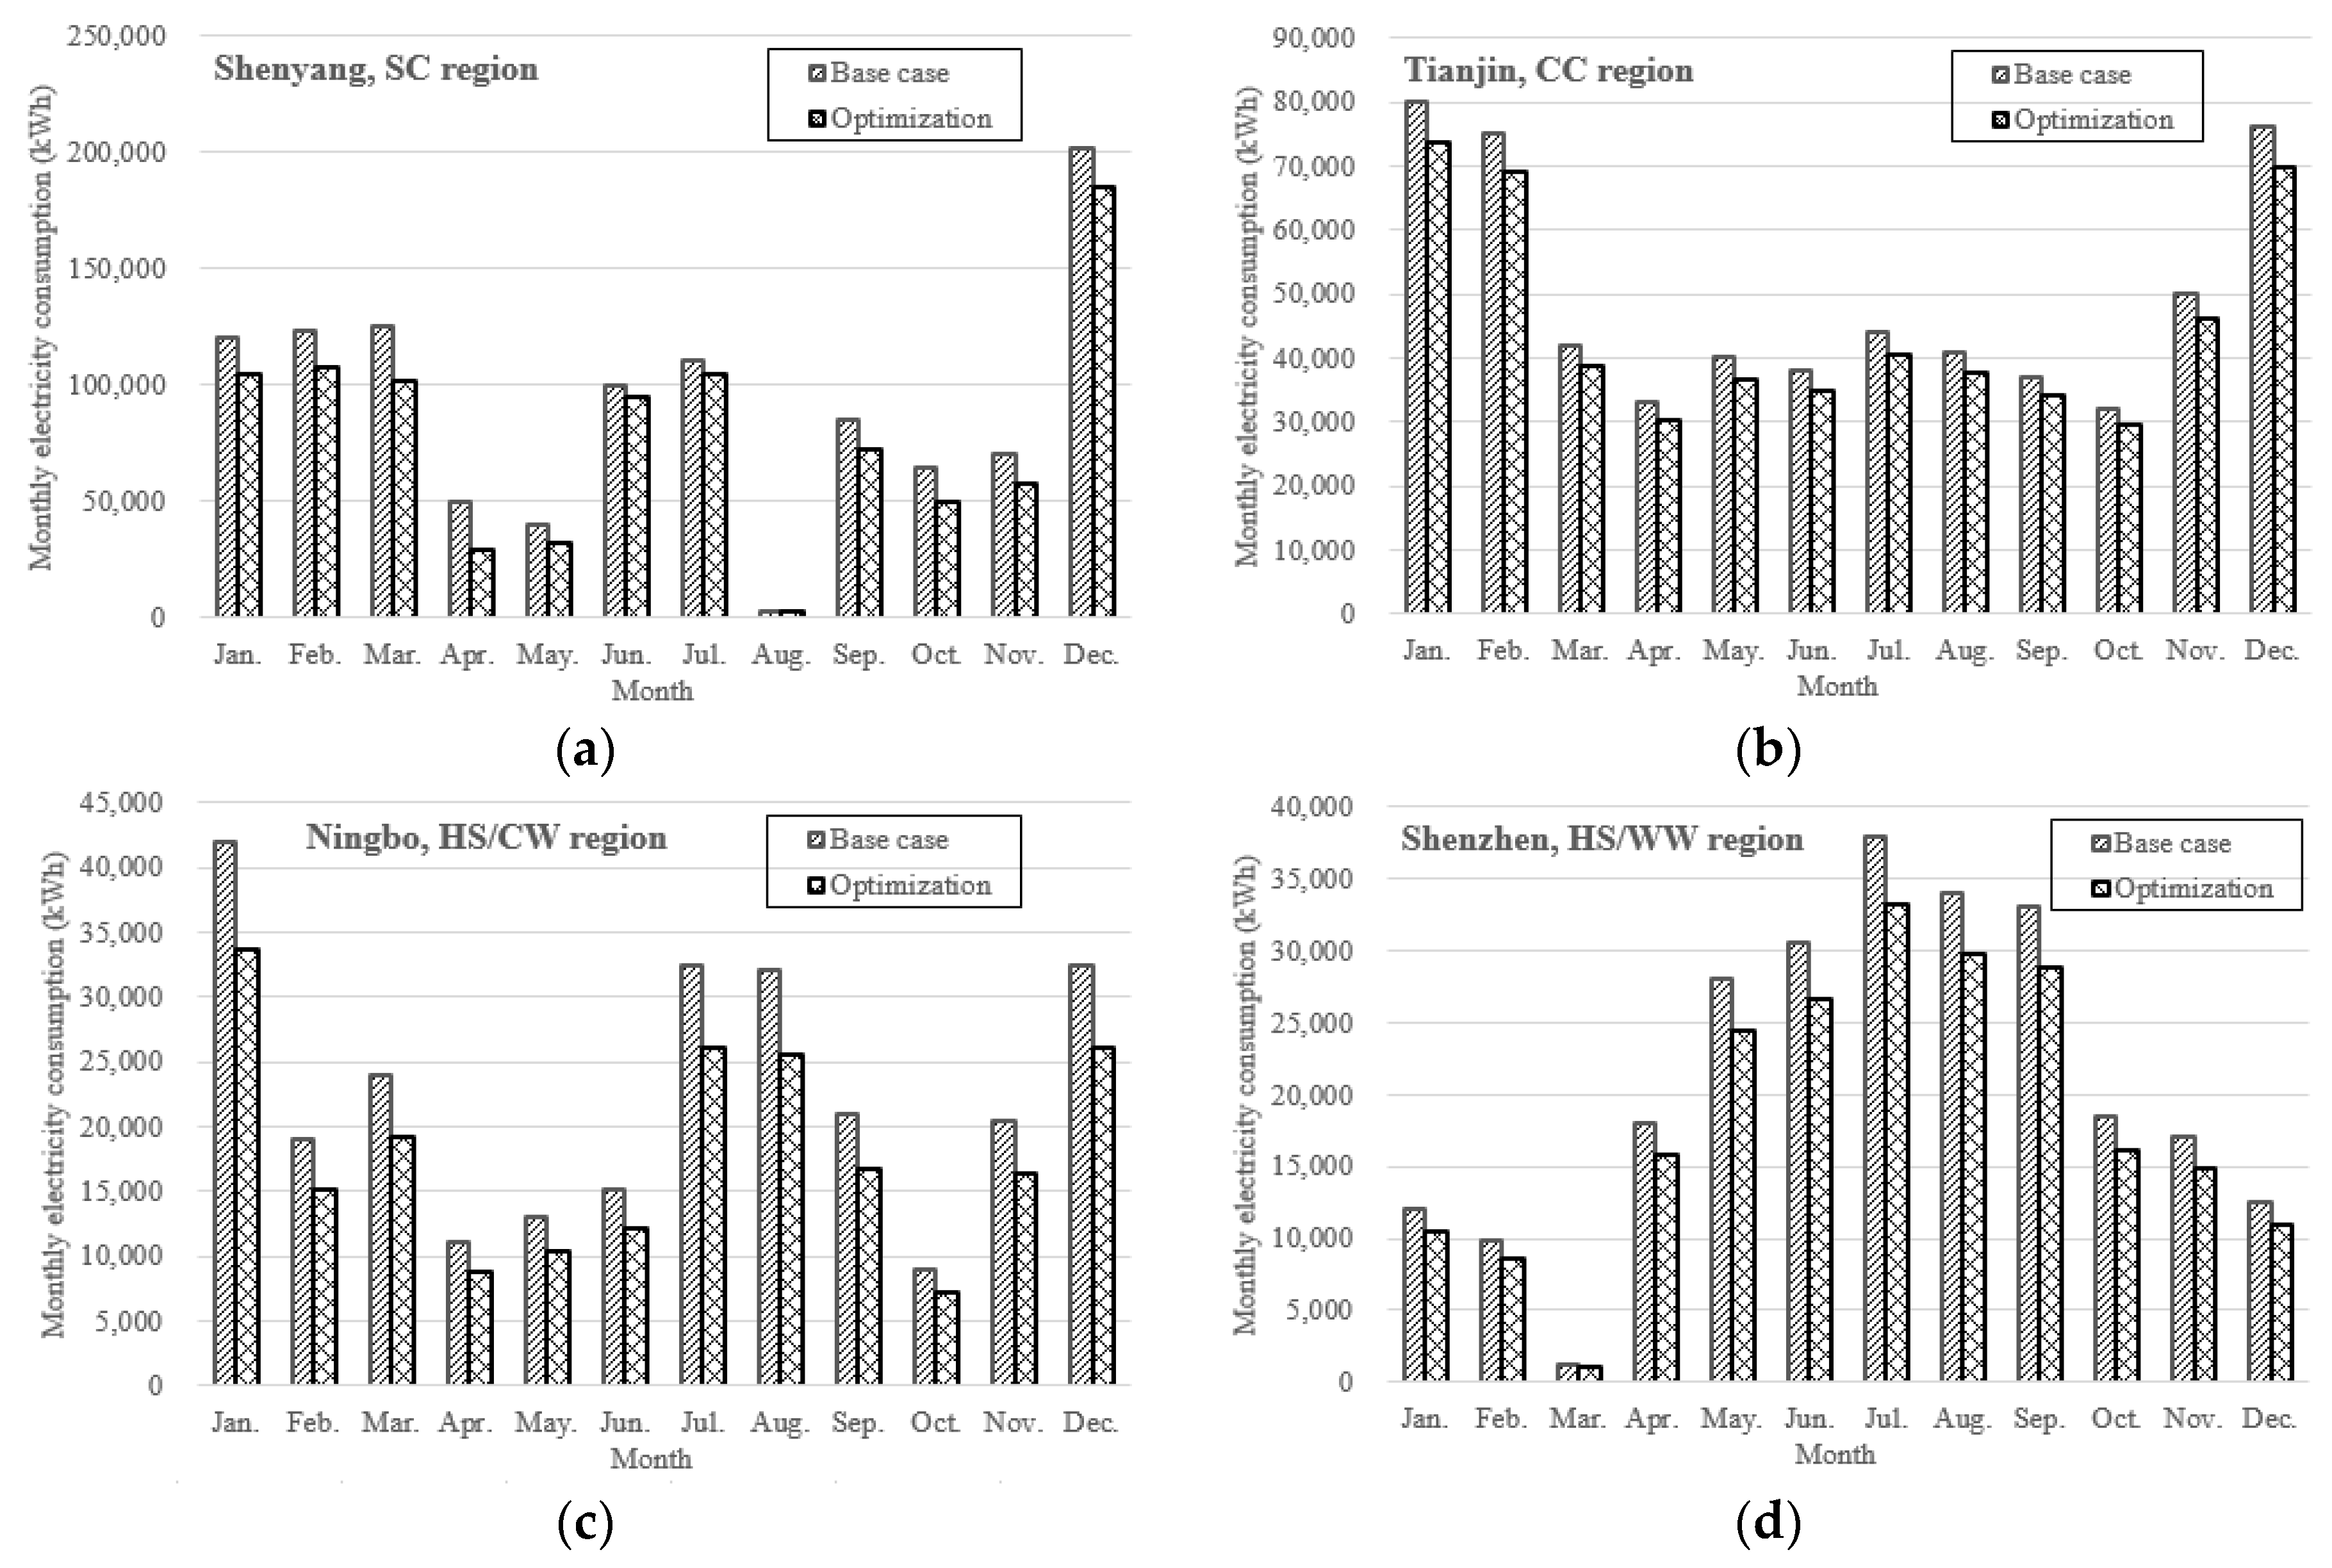
4. Priority Ranking and Optimum Energy Efficiency Strategy of PEEEMS

The principle of building energy efficiency for PEEEMs is to prevent heat losing during heating and reducing heat gain while cooling. Because the various exterior climate conditions, the emphasis of the thermal performance of building envelop should be different. So the solutions of PEEEMs must be optimized depending on climate. The optimizing goal is to find the strategy with the best energy-saving effects and economic benefits simultaneously.
According to the results of sensitivity analysis above, the optimum building envelop energy efficiency strategies can be proposed for the four case buildings, as shown in Table 11. The effects of the four kinds of PEEEMs on building energy consumption were analyzed separately. The optimized strategies with the average values of sensitivity coefficients were summarized.
As shown in Table 11, the following conclusions can be drawn.
(1) PEEEMs priority rankings for the climate regions.
Based on the sensitivity analysis results and energy efficiency rate of the optimized exterior wall insulation, roof insulation, glazing type of different SHGC & U-value and the influence of shading system on total energy consumption, the application priority rankings for buildings in each climate regions were concluded as follows.
  • Buildings in SC region: Exterior wall insulation > roof insulation > glazing; Shading is not recommended.
  • Buildings in CC region: Roof insulation > exterior wall insulation > glazing > shading system.
  • Buildings in HS/CW region: Glazing > roof insulation > exterior wall insulation > shading system.
  • Buildings in HS/WW region: Shading system > glazing. Insulation is not recommended.
The recommended ranges of the thermal performance properties of PEEEMs were listed in Table 12.
The high energy-saving rates demonstrated that the thermal insulation technology of exterior walls or roof can both fairly realize effective application results on reducing building energy consumption in climate regions which need heating supply. Based on the sensitivity coefficient of PEEEMs shown in Table 10, the sensitivity coefficients of roof insulation is higher than that of exterior wall for buildings in Shenyang and Tianjin. Especially in Shenyang, the sensitivity coefficient of roof insulation is 4 times more than that of exterior wall. So the insulation of roof is more important than exterior wall for building in Shenyang and Tianjin.
In Ningbo, the sensitivity coefficient is almost equal of insulation of exterior walls and roof. The weighted sensitivity coefficient of the second optimized glazing is equal with insulation of exterior walls and roof. As the best strategy of exterior walls has already been applied in base case, the glazing of exterior windows is considered to be more significant than exterior walls and roof.
In Shenzhen, glazing and shading should be put more emphasis on than other PEEEMs because the sensitivity is much prominent, especially shading. Insulation of exterior walls and roof is not recommended because it would increase building energy consumption on the contrary.
(2) The energy efficiency rate of optimum strategies.
Monthly energy consumption comparisons for the four case buildings were calculated and shown in Figure 7. The energy efficiency rate of case buildings between the initial and the optimum building envelop energy efficiency strategies are various with the four cases.
As illustrated in the figure, the energy consumption of the optimum strategies of case buildings is various for the four cases, from 7.75% (Tianjin) to 20.87% (Ningbo). The energy efficiency rates are much depended on the initial condition of case buildings. Three kinds of situations were involved in the optimum strategy. Firstly, if the key PEEEMs adopted in the case buildings are as good as the recommended ones, the original measures will be reserved in energy efficiency evaluation simulation, thus resulting in relatively low energy efficiency rate. Such as the case of Shenzhen, because the inside shading of diffusing blinds and the outside shading with 1.0 m louver have been applied in case building, the energy efficiency rate will not be higher than that of Ningbo. Secondly, the optimum strategies were partially adopted in the base case. In Ningbo, the sensitivity coefficients of the insulation of exterior walls and roof are almost equal. The optimum of exterior walls has been set as the best strategy, however, the slight changing of roof insulation from 135 mm to 200 mm results in more than 20% energy efficiency rate. Thirdly, the changing rates of optimum strategies are different for cases. When optimizing the roof insulation from 135 mm to 200 mm, the energy efficiency rate of nearly 10% has been achieved comparing with the case building in Tianjin, even though the roof insulation is optimized from 70 mm to 120 mm while other optimizing is similar. In addition, the outdoor temperature in Tianjin is lower than that of Shenyang, so the similar PEEEM in Tianjin will get less energy efficiency.

5. Discussion

5.1. Theoretical Economic Benefits

The price of PEEEMs varies with not only material, manufacturing technique but also location, transportation, brand et al. So, the price of each PEEEM is difficult to be estimated. However, it is certain that the price is always positive corrected with operation performance for mature technologies. So, the economic elements are also considered involving in the input parameters in sensitivity analysis.
To verify the economic benefit of the optimum energy efficiency strategies in the design stage, the theoretical payback periods of each case building were calculated by Equation (8).
P t = S a v i n g   e n e r g y   f e e I n c r e m e n t a l   i n v e s t m e n t = ( E U I o p E U I b ) × F a e I o p I b
where P t is the theoretical payback period, h; E U I o p is the energy consumption with optimum strategies, kWh/m2; F a e is the average electricity price, RMB/kWh; I o p is the cost of optimum strategies in design stage, RMB; I b is the initial cost of case building, RMB.
The incremental costs are the increasing investments of the optimum strategies on the basis of the initial strategy in design stage. They are theoretical values aiming at evaluating the feasibility of optimized strategies in design stage instead of energy efficiency retrofit. So the costs of construction and labor are similar with initial strategies. The incremental costs are mainly material fee. Same brands for each PEEEM were selected. The economic benefits calculation is shown in Table 13.
As shown in Table 13, the payback period is no more than 1.5 years if the measures had been improved during design stage for new buildings. Because the dismantling and reconstruction fee were not included in costs, the theoretical payback period is extremely shorter than that of traditional energy efficient retrofit. Certainly, the factors of building models and the initial envelope system of the case buildings both influence the value of energy-saving rate. The aim to calculate the theoretical payback periods is to demonstrate that the optimized PEEEMs can be in favor of building energy efficiency and economic benefit at the same time. It can be proved that the sensitive analysis combined with building energy consumption simulation tool is a suitable method for evaluating the energy efficiency effects of PEEEMs during building design stage.

5.2. Indoor Thermal Comfort

Except for economic benefits, the indoor thermal comfort is also taken as an important factor in building energy efficiency. Two kinds of patterns are widely used in dealing with indoor thermal comfort. One is considering the comfortable indoor environment as a necessary condition in energy efficient buildings, such as the above articles. The other is taking the indoor air quality as an influencing factor of building energy consumption and exploring the quantification relationship. Salvalai G. et al. [41] assessed different cooling concept of cooling in six European climate zones by carrying out dynamic simulations in Trnsys 17. Cooling technologies, including natural ventilation, mechanical night ventilation, fan-coils, suspended ceiling panels and concrete core conditioning, were evaluated from the aspects of indoor thermal comfort and energy consumption. Pfafferott J. et al. [42] adopted Monte-Carlo simulation and significance analysis to calculate the night ventilation effects on indoor temperature. Comparing the two kinds of research, most articles in the second kind is related to natural ventilation. This is because the effect of natural ventilation greatly relies on the outdoor climate condition and architecture design of building shape, spatial organization et al. The effects may be various. So the variety must be limited in the comfort range of indoor environment.
The topic of this research generally related to the first kind. Certain values shown in Table 2 of indoor air temperature were designed in case buildings. Thus, the simulation results of DesignBuilder models are under the condition of 26 °C in summer and 20 °C in winter, which can satisfy the comfort environment of PMV = ±0.5, PPD ≤ 20%.

5.3. Other Passive Building Energy Efficient Measures

Architecture design is another hot topic in building energy efficiency design recently. Xie X. and Gou Z. [43] proposed an integrated design process involving building architecture design and building performance. Early intervention and late verification methods were established to solve the energy performance simulation problems for architects. Friess W. A. and Rakhshan K. [44] reviewed the passive envelop measures in the hot climate regions from the aspects of building orientation and layout, wall and roof, windows and natural ventilation and estimated the energy efficiency potential for each aspect. However, the exact optimum parameters were not proposed for those measures.
This paper focuses on the thermal performance of building envelop, which generally refers to insulation of exterior walls, windows and roof and solar radiation rejection. Sensitivity analysis was proved to be the proper method for addressing the quantification problems between building energy efficient effects and economic benefits. As for other passive building energy efficient measures, building shape, natural ventilation for example, it is difficult to propose an index to represent energy performance characteristics and price at the same time. Other methods should be explored, CFD for example. Based on the controllable, quantifiable and optimizable selection principle for variables, such kinds of passive building energy efficient measures were not discussed in this paper.
The results in this study are applicable for multi-story, mid-rise buildings with relatively small and medium sizes and regular shape. Super high, large buildings or bizarre shape buildings will need pointedly and further research. The research conclusions can provide case references and technical recommendations for building energy efficiency engineers to optimize the design schemes based on relative building energy efficiency standards. In addition, local design standards can be adequately improved based on the national standards. The priority order this paper proposed can make reference for the selection of indexes to be improved. For example, for cities in SC region, insulation of exterior walls should be optimized rather than shading, while shading should be optimized for cities in HS/WW region and insulation is not recommended.

6. Conclusions

In this paper, the modified sensitivity analysis based on building energy simulation was conducted to evaluate the energy-saving effect of PEEEMs in severe cold, cold, hot summer and cold winter, hot summer and warm winter climate regions in China. Four case buildings located in Shenyang, Tianjin, Ningbo and Shenzhen, typical cities representing the severe cold (SC) region, cold (CC) region, hot summer and cold winter (HS/CW) region, and hot summer and warm winter (HS/WW) region in China respectively, were selected. The energy-saving effects of different building envelope strategies including exterior wall insulation, roof insulation, glazing, and shading system on building energy consumption were calculated and analyzed based on the modified sensitivity analysis. This paper focuses on the energy-saving and economic effects of PEEEMs in design stage and conclusions were drawn and summarized as follows:
(1) An effective method for the research on PEEEMs in different climate regions of China was provided. Building energy simulation of single PEEEM cooperating with sensitivity analysis with comprehensive heat transfer coefficient (U-value), the solar heat gain coefficient (SHGC) and overall shading coefficient (OSC) on building energy consumption has been proved as a reliable approach for building energy efficiency research. U-value and OSC were the characteristic parameters describing the thermal performance of insulation of exterior walls, roof and shading system respectively. As for glazing of exterior windows, U-value and SHGC were both significant parameters for buildings in SC, CC and HS/CW regions while U-value is not significant in HS/WW regions.
(2) Based on the values of weighted sensitivity coefficient of exterior wall thermal insulation, roof thermal insulation, glazing type of different SHGC & U-value and shading system to total energy consumption, the application priority rankings for buildings in each climate regions were summarized. The thermal insulation of exterior walls and roof were considered to be the most important measures in SC regions and CC regions respectively. As for regions with hot summer, shading and glazing were more important than insulation. In hot summer and cold winter regions, glazing was the most significant measure while shading was the key measure in hot summer and warm winter regions. The recommended ranges of the thermal performance properties of PEEEMs were also proposed. Both the priority orders and the recommended ranges of thermal performance properties can be adopted for designers to optimize the design scheme on the base of relative standards. Similarly, relative standards can be improved based on the priority order.
(3) According to the best value of PEEEM parameters based on the results of sensitivity analysis results, the optimum energy efficiency strategies were proposed for the four case buildings in different climate regions of China. The energy efficiency rates of 9.44% (Shenyang, SC region), 7.75% (Tianjin, CC region), 20.87% (Ningbo, HS/CW region) and 13.27% (Shenzhen, HS/WW region) can be achieved respectively from the view of base cases. The optimum strategies show relatively remarkable performance of energy efficiency. The theoretical payback periods, considering the increasing investments of the optimum strategies on the basis of the initial strategies in design stage, were proved to be no more than 1.5 years. The economic benefits were proper if the PEEEMs strategies were optimized during design phase.

Acknowledgments

The work is supported by the National Key R&D Program of China (Project No. 2016YFB0601700). The authors are particularly grateful to the owners of case buildings for providing building information.

Author Contributions

Zhaoxia Wang conducted the simulation, analyzed the data and wrote the manuscript; Jing Zhao conceived and designed the research and improved the paper.

Conflicts of Interest

The authors declare no conflict of interest.

References

  1. Hasan, O.A.; Defer, D.; Shahrour, I. A simplified building thermal model for the optimization of energy consumption: Use of a random number generator. Energy Build. 2014, 82, 322–329. [Google Scholar] [CrossRef]
  2. Liu, L.; Zhao, J.; Liu, X.; Wang, Z. Energy consumption comparison analysis of high energy efficiency office buildings in typical climate zones of China and U.S. based on correction model. Energy 2014, 65, 221–232. [Google Scholar] [CrossRef]
  3. Hopfe, C.; McLeod, R. The Passivhaus Designer’s Manual: A Technical Guide to Low and Zero Energy Buildings; Routledge: Lindon, UK, 2015; pp. 1–2. [Google Scholar]
  4. Voss, K.; Herkel, S.; Pfafferott, J.; Lohnert, G.; Wagner, A. Energy efficient office buildings with passive cooling—Results and experiences from a research and demonstration programme. Sol. Energy 2007, 81, 424–434. [Google Scholar] [CrossRef]
  5. Gou, Z.; Lau, S.Y. Contextualizing green building rating systems: Case study of Hong Kong. Habitat Int. 2014, 44, 282–289. [Google Scholar] [CrossRef]
  6. Zhang, M.; Wang, M.; Jin, W.; Xia-Bauer, C. Managing energy efficiency of buildings in China: A survey of energy performance contracting (EPC) in building sector. Energy Policy 2018, 114, 13–21. [Google Scholar] [CrossRef]
  7. Ministry of Housing and Urban-Rural Development of the People’s Republic of China (MOHURD); General Administration of Quality Supervision, Inspection and Quarantine of the People’s Republic of China(AQSIQ). Design Standard for Energy Efficiency of Public Buildings (GB50189-2005); China Architecture & Building Press: Beijing, China, 2005; pp. 5–12. [Google Scholar]
  8. Ministry of Housing and Urban-Rural Development of the People’s Republic of China (MOHURD); General Administration of Quality Supervision, Inspection and Quarantine of the People’s Republic of China(AQSIQ). Design Standard for Energy Efficiency of Public Buildings (GB50189-2015); China Architecture & Building Press: Beijing, China, 2015; pp. 8–13. [Google Scholar]
  9. Geng, G.; Wang, Z.; Zhao, J.; Zhu, N. Suitability assessment of building energy saving technologies for office buildings in cold areas of China based on an assessment framework. Energy Convers. Manag. 2015, 103, 650–664. [Google Scholar] [CrossRef]
  10. Lu, S.; Wang, R.; Zheng, S. Passive Optimization Design Based on Particle Swarm Optimization in Rural Buildings of the Hot Summer and Warm Winter Zone of China. Sustainability 2017, 9, 2288. [Google Scholar] [CrossRef]
  11. Lu, S.; Tang, X.; Ji, L.; Tu, D. Research on Energy-Saving Optimization for the Performance Parameters of Rural-Building Shape and Envelope by TRNSYS-GenOpt in Hot Summer and Cold Winter Zone of China. Sustainability 2017, 9, 294. [Google Scholar] [CrossRef]
  12. Zhou, S.; Zhao, J. Optimum combinations of building envelop energy-saving technologies for office buildings in different climatic regions of China. Energ. Build. 2013, 57, 103–109. [Google Scholar] [CrossRef]
  13. Wang, Z.; Ding, Y.; Geng, G.; Zhu, N. Analysis of energy efficiency retrofit schemes for heating, ventilating and air-conditioning systems in existing office buildings based on the modified bin method. Energy Convers. Manag. 2014, 77, 233–242. [Google Scholar] [CrossRef]
  14. Østergård, T.; Jensen, R.L.; Maagaar, S.E. Early Building Design: Informed decision-making by exploring multidimensional design space using sensitivity analysis. Energy Build. 2017, 142, 8–22. [Google Scholar] [CrossRef]
  15. Yang, L.; Lam, J.C.; Tsang, C.L. Energy performance of building envelopes in different climate zones in China. Appl. Energy 2008, 85, 800–817. [Google Scholar] [CrossRef]
  16. Yu, J.; Yang, C.; Tian, L. Low-energy envelope design of residential building in hot summer and cold winter zone in China. Energy Build. 2008, 40, 1536–1546. [Google Scholar] [CrossRef]
  17. Moon, D.; Sagisaka, M.; Tahara, K.; Tsukahara, K. Progress towards Sustainable Production: Environmental, Economic, and Social Assessments of the Cellulose Nanofiber Production Process. Sustainability 2017, 9, 2368. [Google Scholar] [CrossRef]
  18. Ghione, A.; Noel, B.; Vinai, P.; Demazière, C. Uncertainty and sensitivity analysis for the simulation of a station blackout scenario in the Jules Horowitz Reactor. Ann. Nucl. Energy 2017, 104, 28–41. [Google Scholar] [CrossRef]
  19. Shirvan, K.M.; Soroush Mirzakhanlari, S.; Mamourian, M.; Hamdeh, N.A. Numerical investigation and sensitivity analysis of effective parameters to obtain potential maximum power output: A case study on Zanjan prototype solar chimney power plant. Energy Convers. Manag. 2017, 136, 350–360. [Google Scholar] [CrossRef]
  20. Lam, C.; Wan, K.; Yang, L. Sensitivity analysis and energy conservation measures implications. Energy Convers. Manag. 2008, 49, 3170–3177. [Google Scholar] [CrossRef]
  21. Aranda, J.; Zabalza, I.; Conserva, A.; Millán, G. Analysis of Energy Efficiency Measures and Retrofitting Solutions for Social Housing Buildings in Spain as a Way to Mitigate Energy Poverty. Sustainability 2017, 9, 1869. [Google Scholar] [CrossRef]
  22. Stutterecker, W.; Blumel, E. Energy plus standard in buildings constructed by housing associations. Energy 2012, 48, 56–65. [Google Scholar] [CrossRef]
  23. Arima, Y.; Ooka, R.; Kikumoto, H. Proposal of typical and design weather year for building energy simulation. Energy Build. 2017, 139, 517–524. [Google Scholar] [CrossRef]
  24. ASHRAE. Measurement of Energy and Demand Savings; ASHRAE Guideline 14-2002; American Society of Heating, Refrigerating and Air-Conditioning Engineers Inc.: Atlanta, GA, USA, 2012. [Google Scholar]
  25. Zhang, A.; Bokel, R.; Dobbelsteen, A.; Sun, Y.; Huang, Q.; Zhang, Q. The Effect of Geometry Parameters on Energy and Thermal Performance of School Buildings in Cold Climates of China. Sustainability 2017, 9, 1708. [Google Scholar] [CrossRef]
  26. Ministry of Housing and Urban-Rural Development. Design Standard for Energy Efficiency of Public Buildings (GB 50189-2005); China Architecture & Building Press: Beijing, China, 2005; pp. 4–14. [Google Scholar]
  27. Tian, W.; Song, J.; Li, Z.; Wilde, P. Bootstrap techniques for sensitivity analysis and model selection in building thermal performance analysis. Appl. Energy 2014, 135, 320–328. [Google Scholar] [CrossRef]
  28. Xiao, S.; Lu, Z.; Xu, L. Multivariate sensitivity analysis based on the direction of eigen space through principal component analysis. Reliab. Eng. Syst. Saf. 2017, 165, 1–10. [Google Scholar] [CrossRef]
  29. Shao, Q.; Younes, A.; Fahs, M.; Mara, T.A. Bayesian sparse polynomial chaos expansion for global sensitivity analysis. Comput. Methods Appl. Mech. Eng. 2017, 318, 474–496. [Google Scholar] [CrossRef]
  30. Lammoglia, S.; Makowski, D.; Moeys, J.; Justes, E.; Barriuso, E.; Mamy, L. Sensitivity analysis of the STICS-MACRO model to identify cropping practices reducing pesticides losses. Sci. Total Environ. 2017, 580, 117–129. [Google Scholar] [CrossRef] [PubMed]
  31. Rodriguez, G.C.; Andres, A.; Munoz, F.; Lopez, J.; Zhang, Y. Uncertainties and sensitivity analysis in building energy simulation using macroparameters. Energy Build. 2013, 67, 79–87. [Google Scholar] [CrossRef]
  32. Sanchez, D.G.; Lacarriere, B.; Musy, M.; Bourges, B. Application of sensitivity analysis in building energy simulations: Combining first-and second-order elementary effects methods. Energy Build. 2014, 68, 741–750. [Google Scholar] [CrossRef]
  33. O’Neill, Z.; Niu, F. Uncertainty and sensitivity analysis of spatio-temporal occupant behaviors on residential building energy usage utilizing Karhunen-Loève expansion. Build. Environ. 2017, 115, 157–172. [Google Scholar] [CrossRef]
  34. Fang, Z.; Li, N.; Li, B.; Luo, G.; Huang, Y. The effect of building envelope insulation on cooling energy consumption in summer. Energy Build. 2014, 77, 197–205. [Google Scholar] [CrossRef]
  35. Reda, F.; Tuominen, P.; Hedman, Å.; Ibrahim, M.G.E. Low-energy residential buildings in New Borg El Arab: Simulation and survey based energy assessment. Energy Build. 2015, 93, 65–82. [Google Scholar] [CrossRef]
  36. Zhang, N.; Smith, S.; Bulatov, I.; Klemes, J. Sustaining high energy efficiency in existing processes with advanced process integration technology. Appl. Energy 2013, 101, 26–32. [Google Scholar] [CrossRef]
  37. Laurent, M.; Fariborz, H. Multiobjective optimization of building design using TRNSYS simulations, genetic algorithm, and Artificial Neural Network. Build. Environ. 2010, 45, 739–746. [Google Scholar]
  38. Dhaka, S.; Mathur, J.; Garg, V. Combined effect of energy efficiency measures and thermal adaptation on air conditioned building in warm climatic conditions of India. Energy Build. 2012, 55, 351–360. [Google Scholar] [CrossRef]
  39. Yao, J.; Zhu, N. Evaluation of indoor thermal environmental, energy and daylighting performance of thermotropic windows. Build. Environ. 2012, 49, 283–290. [Google Scholar] [CrossRef]
  40. Sadeghi, S.A.; Karava, P.; Konstantzos, I.; Tzempelikos, A. Occupant interactions with shading and lighting systems using different control interfaces: A pilot field study. Build. Environ. 2016, 97, 177–195. [Google Scholar] [CrossRef]
  41. Salvalai, G.; Pfafferott, J.; Sesana, M.M. Assessing energy and thermal comfort of different low-energy cooling concepts for non-residential buildings. Energy Convers. Manag. 2013, 76, 332–341. [Google Scholar] [CrossRef]
  42. Pfafferott, J.; Herkel, S.; Wambsganß, M. Design, monitoring and evaluation of a low energy office building with passive cooling by night ventilation. Energy Build. 2004, 36, 455–465. [Google Scholar] [CrossRef]
  43. Xie, X.; Gou, Z. Building performance simulation as an early intervention or late verification in architectural design: Same performance outcome but different design solutions. J. Green Build. 2017, 12, 45–61. [Google Scholar] [CrossRef]
  44. Friess, W.A.; Rakhshan, K. A review of passive envelope measures for improved building energy efficiency in the UAE. Renew. Sustain. Energy Rev. 2017, 72, 485–496. [Google Scholar] [CrossRef]
Figure 1. Photos of simulation models of case buildings in DesignBuilder. (a) Simulation model of case building in Shenyang; (b) Simulation model of case building in Tianjin; (c) Simulation model of case building in Ningbo; (d) Simulation model of case building in Shenzhen.
Sustainability 10 00907 g001
Figure 2. Comparison of measured and simulated monthly energy consumption. (a) Building in Shenyang, SC region; (b) Building in Tianjin, CC region; (c) Building in Ningbo, HS/CW region; (d) Building in Shenzhen, HS/WW region.
Sustainability 10 00907 g002
Figure 3. Influence of the U-value of exterior wall on building energy consumption. (a) Case building in Shenyang, SC region; (b) Case building in Tianjin, CC region; (c) Case building in Ningbo, HS/CW region; (d) Case building in Shenzhen, HS/WW region.
Sustainability 10 00907 g003
Figure 4. Influence of the U-value of roof on building energy consumption. (a) Case building in Shenyang, SC region; (b) Case building in Tianjin, CC region; (c) Case building in Ningbo, HS/CW region; (d) Case building in Shenzhen, HS/WW region.
Sustainability 10 00907 g004
Figure 5. Influence of the glazing on building energy consumption. (a) Case building in Shenyang, SC region; (b) Case building in Tianjin, CC region; (c) Case building in Ningbo, HS/CW region; (d) Case building in Shenzhen, HS/WW region.
Sustainability 10 00907 g005
Figure 6. Influence of shading types on total energy consumption. (a) Case building in Shenyang, SC region; (b) Case building in Tianjin, CC region; (c) Case building in Ningbo, HS/CW region; (d) Case building in Shenzhen, HS/WW region.
Sustainability 10 00907 g006
Figure 7. Energy consumption comparisons between the initial and optimum strategies of the case buildings. (a) Case building in Shenyang, SC region; (b) Case building in Tianjin, CC region; (c) Case building in Ningbo, HS/CW region; (d) Case building in Shenzhen, HS/WW region.
Sustainability 10 00907 g007
Table 1. Climate regions in civil building thermal design [26].
NameIndexesTypical City
Leading IndexAuxiliary Index
Severe cold (SC) regions Average temperature of the coldest month ≤ −10 °CHDD ≥ 145 °C·dayShenyang
Cold (CC) regions−10 °C <Average temperature of the coldest month ≤ 0 °C90 °C·day ≤ HDD ≤ 45 °C·dayTianjin
Hot summer and cold winter (HS/CW) regions−10 °C < Average temperature of the coldest month ≤ 0 °C;
25 °C ≤ Average temperature of the hottest month ≤ 30 °C
HDD ≤ 90 °C·day;
40 °C·day ≤ CDD ≤ 110 °C·day
Ningbo
Hot summer and warm winter (HS/WW) regionsAverage temperature of the coldest month > 10 °C;
25 °C < Average temperature of the hottest month ≤ 29 °C
100 °C·day ≤ CDD ≤ 200 °C·dayShenzhen
Temperate regions (not discussed)0 °C <Average temperature of the coldest month ≤ 13 °C;
18 °C ≤ Average temperature of the hottest month ≤ 25 °C
HDD ≤ 90 °C·daySanya
Table 2. Case building description.
LocationShenyangTianjinNingboShenzhen
Climate parameters of typical meteorological year
Climate regionSevere cold regionCold regionHot summer and cold winter regionHot summer and warm winter region
Average temperature of the coldest month (Jan.)−11.5 °C−2.4 °C 3.7 °C16.2 °C
Average temperature of the warmest month (Jul.)24.5 °C26.1 °C27.8 °C29.8 °C
HDD18 (°C·day)40622738981272
CDD26 (°C·day)48656616502141
Building information
Gross floor area (m2)10,997.387525476016,600
Building typeOffice OfficeOfficeOffice
Building height (m)19.823.8520.220.5
Number of floors5655
Floor height (m)3.93.53.53.9
Building operation information
Working time8:00–17:009:00–18:009:00–18:009:00–17:30
Occupant density of working zone (people/m2)0.080.1250.150.25
Commonly occupant numberAround 650Around 400Around 300Around 700
Indoor equipment power density (W/m2)6.220620
Lighting density (W/m2)3.8945.2
Envelop form and thermal parameters
Exterior wall
FormEPSEPSEPSEPS
EPS layer thickness (mm)608011510
U value of the exterior walls (W/m2·K)0.510.390.2951.26
Roof
FormEPSEPSEPSEPS
EPS layer thickness (mm)1357013530
U value of the roof (W/m2·K)0.250.420.2480.67
Exterior window
Glazing typeDouble layers, reflective + Clear 6 mm/13 mm airDouble layers, electrochromism +Clear 6 mm/13 mm AirDouble layers, low-E + 3 mm/6 mm airDouble layers, reflective + Clear 6 mm/13 mm air
Solar heat gain coefficient (SHGC)0.1760.60.6870.176
U value of the windows (W/m2·K)2.21.722.582.2
Ratio of window to wall (%)20255090
Shading Interior shading of diffusing blinds, no exterior shadingInterior shading of diffusing blinds, no exterior shadingInterior shading of diffusing blinds, exterior shading of 0.5 m overhanging boardInterior shading of diffusing blinds, exterior shading of 1.0 m louver
Indoor design parameters
Indoor temperature in summer (°C) 26262626
Indoor relative humidity in summer (%)55556060
Indoor temperature in winter (°C)20202020
Indoor relative humidity in winter (%)35353535
Design fresh air volume (m3/person/h)30303030
Heating and cooling information
Cooling supply period1 June–30 September1 June–30 September1 June–30 September1 April–1 November
Heating supply period1 November–31 March15 November–15 March 1 December–15 Februarynone
Heating and cooling unit typeGround source heat pump (GSHP)GSHPVAV systemElectrical air-handling unit
Design systematic COP5.34.53.3.2.5
Total energy consumption
Annual energy consumption (kWh)1,099,123612,427.38283,124.82,544,400
Annual EUI (kWh/ (m2·a))99.9481.3759.48153.27
Table 3. Comparison between measured value and simulated value [24].
CriteriaASHRAEShenyangTianjinNingboShenzhen
NMBE (%)±52.841.843.40−3.54
CVRMSE (%)±1512.049.1112.1611.16
Table 4. Sensitivity analysis of exterior wall insulation to total energy usage intensity (EUI) of the case buildings.
Insulation Layer Thickness (mm)U-Value (W/(m2·K))HVAC EUI (kWh/(m2·a))Total EUI (kWh/(m2·a))Sensitivity Coefficient to Total EUI
Building in Shenyang (SC region)
01.93262.27108.920.018550
200.98358.96105.470.019911
400.65957.73104.170.020317
60 (base case)0.50957.17103.55-
800.39756.67103.040.022383
1000.33156.39102.740.022368
1200.28456.19102.520.022502
Average---0.022326
Building in Tianjin (CC region)
01.93235.8487.730.024403
200.98331.5083.170.025967
400.65929.8681.480.026585
600.50929.0080.590.026656
80 (base case)0.39728.4380.01-
1000.33128.1179.700.026274
1200.28427.8579.420.027102
Average---0.026709
Building in Ningbo (HS/CW region)
01.93237.1963.350.016619
200.98334.1660.320.017150
400.65933.1459.300.018168
600.50932.5358.690.017485
800.39732.1058.260.012814
1000.33132.0858.240.034515
115 (base case)0.29531.9158.00-
1200.28431.7957.950.020410
Average---0.019594
Building in Shenzhen (HS/WW region)
01.93272.01158.260.000201
10 (base case)1.25972.02158.25-
200.98372.16158.41−0.004760
400.65972.23158.48−0.003110
600.50972.26158.52−0.002860
800.39772.31158.58−0.003070
1000.33172.32158.60−0.003000
1200.28472.35158.64−0.003170
Average---−0.002820
Table 5. Sensitivity analysis of roof insulation to total EUI of the case buildings.
Insulation Layer Thickness (mm)U-Value (W/(m2·K))HVAC EUI (kWh/(m2·a))Total EUI (kWh/(m2·a))Sensitivity Coefficient to Total EUI
Building in Shenyang (SC region)
01.54661.51106.310.009355
500.52758.50105.050.012876
1000.31857.73103.780.007896
135 (base case)0.24857.39103.55-
1500.22757.27102.980.065007
2000.17757.18101.550.101196
Average---0.039261
Building in Tianjin (CC region)
01.54635.3485.710.040538
500.52732.6483.120.054323
70 (base case)0.4230.4381.12-
1000.31829.0679.340.034660
1500.22728.2678.520.040559
2000.17727.8478.060.042139
Average---0.042444
Building in Ningbo (HS/CW region)
01.54636.9763.200.018469
500.52732.6658.890.019419
1000.31831.7357.950.020028
135 (base case)0.24831.4057.63-
1500.22731.2257.450.036803
2000.17730.7656.980.039084
Average---0.026761
Building in Shenzhen (HS/WW region)
01.54671.94156.660.016534
30 (base case)0.67172.02158.25-
500.52772.16158.83−0.017160
1000.31872.24158.52−0.003180
1500.22772.36158.33−0.000810
2000.17773.68158.220.000271
Average---−0.000870
Table 6. Simulation scheme of glazing type and energy consumption of case buildings.
No.LayerSpecificationSHGCU-Value (W/m2·K)Visible TransmittanceTotal EUI (kWh/(m2·a))
ShenyangTianjinNingboShenzhen
GL1SingleClear0.8106.1210.898102.7683.3263.10159.31
GL2SingleReflective0.2355.0050.080108.5086.9368.35175.65
GL3SingleLow-E0.7104.2330.811101.4681.5359.06160.07
GL4DoubleGreen 6 mm/6 mm Air0.4903.1570.664100.6483.6359.72155.94
GL5DoubleLow-E+Clear 3 mm/6 mm Air0.6872.5770.769101.2281.0957.63 (base case)158.40
GL6DoubleReflective+Clear 6 mm/13 mm Air0.1762.2080.073103.55 (base case)85.5964.74158.25 (base case)
GL7DoubleElectrochromism +Clear 6 mm/13 mm Air0.1551.7720.752103.6685.18 (base case)63.21158.03
GL8TripleLow-E+Clear+Clear 3 mm/13 mm Air0.5741.2700.69899.2280.0454.48157.01
Table 7. Sensitivity analysis of glazing type to total EUI of the case buildings.
Case BuildingBuilding in ShenyangBuilding in TianjinBuilding in NingboBuilding in Shenzhen
Glazing ParameterU-ValueSHGCVisible TransmittanceU-ValueSHGCVisible TransmittanceU-ValueSHGCVisible TransmittanceU-ValueSHGCVisible Transmittance
Correlation coefficient R20.9430.9630.9720.903
Standard weight1.116−0.5610.1690.841−0.858−0.1370.875−0.635−0.247−0.037−0.888−0.345
Significance coefficient0.001 0.005 0.1920.001 0.000 0.193 0.000 0.001 0.031 0.865 0.007 0.139
Significant level***************************
Note: *** respects highly significant, ** means significant, * indicates non-significant.
Table 8. Sensitivity analysis of glazing type to total EUI of the case buildings in Shenyang, Tianjin and Ningbo.
No.U-Value (W/(m2·K))SHGCTotal EUI (kWh/(m2·a))Sensitivity Coefficient to Total EUI (U Value)Sensitivity Coefficient to Total EUI (SHGC)Weighted Sensitivity Coefficient to Total EUI
Building in Shenyang (SC region)
GL52.5770.687101.22−0.134210−0.089853 −0.119371
GL43.1570.490100.64−0.065400−0.080502 −0.070452
GL34.2330.710101.46−0.021960−0.083099 −0.042413
GL16.1210.810102.76−0.004290−0.035381 −0.014691
GL71.7720.155103.66−0.005660.000935 −0.003454
GL6 (base case)2.2080.176103.55---
GL81.2700.57499.220.098368−0.142327 0.017849
GL25.0050.235108.500.0378020.060916 0.045534
Average−0.013620−0.052759−0.026714
Building in Tianjin (CC region)
GL52.5770.68781.09−0.105640−0.223553 −0.165186
GL34.2330.71081.53−0.030840−0.205070 −0.118827
GL81.2700.57480.040.105335−0.237813 −0.067956
GL16.1210.81083.32−0.00886−0.116659 −0.063299
GL43.1570.49083.63−0.023260−0.058591 −0.041102
GL7 (base case)1.7720.15585.18---
GL62.2080.17685.590.0195110.005439 0.012405
GL25.0050.23586.930.0112930.030521 0.021003
Average−0.004640−0.100716−0.060423
Building in Ningbo (HS/CW region)
GL62.2080.17664.74−0.8621100.028135 −0.487735
GL71.7720.15563.21−0.3104600.019917 −0.171527
GL5 (base case)2.5770.68757.63---
GL34.2330.71059.060.0386790.025023 0.032936
GL81.2700.57454.480.107770−0.048309 0.042134
GL16.1210.81063.100.0690860.102208 0.083015
GL43.1570.49059.720.1613600.024961 0.104000
GL25.0050.23568.350.1974050.053650 0.136952
Average−0.0854700.025698−0.037175
Table 9. Sensitivity analysis of glazing type to total EUI of the case building in Shenzhen, HS/WW region.
No.SHGCTotal EUI (kWh/(m2·a))Sensitivity Coefficient to Total EUI (SHGC)Weighted Sensitivity Coefficient to Total EUI
GL10.81161.630.005805 0.005805
GL30.71161.370.006372 0.006372
GL40.49158.940.002933 0.002933
GL20.235158.40.002825 0.002825
GL80.574159.310.002442 0.002442
GL50.687160.070.001916 0.001916
GL70.155157.940.001645 0.016450
GL6 (base case)0.176158.25--
Average0.0058210.005821
Table 10. Simulation scheme of shading system.
No.Interior ShadingExterior ShadingSDOSCTotal EUI (kWh/(m2·a))Sensitivity Coefficient to Total EUI
Building in Shenyang (SC region)
WS1No shadingNo shading0.900.52103.80−0.029607
WS2 (base case)Diffusing blindsNo shading0.890.46103.58-
WS3Diffusing blinds0.5 m Overhanging board0.840.44103.20−0.007712
WS4Diffusing blinds1.0 m Overhanging board0.720.38103.05−0.019442
WS5Diffusing blinds1.5 m Overhanging board0.650.34102.96−0.013560
WS6Diffusing blinds2.0 m Overhanging board0.610.32103.00−0.013058
WS7Diffusing blinds1.0 m Louver0.190.10103.36−0.005902
Average---−0.014880
Building in Tianjin (CC region)
WS1No shadingNo shading0.900.5280.580.054403
WS2 (base case)Diffusing blindsNo shading0.890.4680.01-
WS3Diffusing blinds0.5 m Overhanging board0.840.4480.59−0.144210
WS4Diffusing blinds1.0 m Overhanging board0.720.3881.39−0.093719
WS5Diffusing blinds1.5 m Overhanging board0.650.3482.15−0.098753
WS6Diffusing blinds2.0 m Overhanging board0.610.3282.84−0.113813
WS7Diffusing blinds1.0 m Louver0.190.1084.62−0.073341
Average---−0.078239
Building in Ningbo (HS/CW region)
WS1No shadingNo shading0.900.5258.340.079200
WS2Diffusing blindsNo shading0.890.4657.980.213512
WS3 (base case)Diffusing blinds0.5 m Overhanging board0.860.4557.63-
WS4Diffusing blinds1.0 m Overhanging board0.760.3957.300.045906
WS5Diffusing blinds1.5 m Overhanging board0.690.3656.780.071568
WS6Diffusing blinds2.0 m Overhanging board0.650.3456.130.104850
WS7Diffusing blinds1.0 m Louver0.190.1055.590.045357
Average---0.093399
Building in Shenzhen (HS/WW region)
WS1No shadingNo shading0.900.42173.000.031529
WS2Diffusing blindsNo shading0.890.36158.250.009887
WS3Diffusing blinds0.5 m Overhanging board0.870.35155.760.005545
WS4Diffusing blinds1.0 m Overhanging board0.770.30153.990.002643
WS5Diffusing blinds1.5 m Overhanging board0.710.27153.270.001224
WS6Diffusing blinds2.0 m Overhanging board0.670.25152.810.000105
WS7 (base case)Diffusing blinds1.0 m Louver0.190.14152.77-
Average---0.008489
Table 11. Optimum strategy of passive envelop energy efficient measures (PEEEMs) of the case buildings.
PEEEMIndexBuilding in Shenyang, SC RegionBuilding in Tianjin, CC RegionBuilding in Ningbo, HS/CW RegionBuilding in Shenzhen, HS/WW Region
Exterior wallType120 mm EPS120 mm EPS100 mm EPSNo exterior wall insulation
U-value (W/(m2·K))0.2840.2840.3311.932
Energy efficiency rate (%)5.889.47--
Sensitivity coefficient0.0225020.0271020.0345150.000201
Roof Type200 mm EPS200 mm EPS200 mm EPS30 mm EPS
U-value (W/(m2·K))0.1770.1770.1770.671
Energy efficiency rate (%)7.0334.8416.8-
Sensitivity coefficient0.1011960.0421390.039084-
GlazingTypeDouble layers, low-E + Clear 3 mm/6 mm AirDouble layers, low-E + Clear 3 mm/6 mm AirDouble layers, low-E + Clear 3 mm/6 mm Air /or low-EDouble layers, low-E + Clear 3 mm/6 mm Air
U-value (W/(m2·K))0.6870.6870.574/4.2330.687
SHGC4.2334.2331.270/0.7104.233
Visible transmittance0.7690.7690.698/0.8110.769
Sensitivity coefficient (U-value)−0.134210−0.105640−/0.038679-
Sensitivity coefficient (SHGC)−0.089853−0.223553−/0.025023−0.507640
Weighted sensitivity coefficient−0.119371−0.165186−/0.032936−0.507640
ShadingTypeNo shadingDiffusing blinds of interior shadingDiffusing blinds, 2.0 m overhanging boardDiffusing blinds, 1.0 m louver
OSC0.520.460.340.25
Sensitivity coefficient−0.029607-0.104850-
Total energy efficiency rate (%)9.447.7520.8713.27
Table 12. Recommended ranges of the thermal performance properties of PEEEMs.
PEEEMsThermal Performance PropertyBuildings in SC RegionBuildings in CC RegionBuildings in HS/CW RegionBuildings in HS/WW Region
Exterior wallsU-value (W/(m2·K))≤0.331≤0.331≤0.331-
RoofU-value (W/(m2·K))≤0.318≤0.318≤0.318-
Glazing typeU-value (W/(m2·K))≤2.577≤2.577≤4.233-
SHGC≤0.687≤0.687Around 0.7≤0.687
Shading systemOSC--≤0.35≤0.35
Table 13. Economic benefits analysis of the case buildings.
BuildingBuilding in ShenyangBuilding in TianjinBuilding in NingboBuilding in Shenzhen
Energy consumption of initial strategy (kWh/m2)103.5580.0157.63158.25
Energy consumption of optimum strategy (kWh/m2)93.7773.8145.60137.24
Energy-saving rate (%)9.447.7520.8713.27
Average electricity price (RMB/kWh)0.80680.99250.89290.8512
Incremental investment (RMB/m2)8.704.2415.601.87
Insulation of exterior walls (RMB per insulation area)453000
Insulation of roof (RMB per insulation area)00650
Glazing of exterior windows (RMB per window area)3030030
Shading (RMB per shading material area)00400
Theoretical payback period (year)1.100.691.450.10

