Article

Spatio-Temporal Variation of Land-Use Intensity from a Multi-Perspective—Taking the Middle and Lower Reaches of Shule River Basin in China as an Example

College of Geography and Environmental Science, Northwest Normal University, Lanzhou 730000, China
*
Author to whom correspondence should be addressed.
Sustainability 2018, 10(3), 771; https://doi.org/10.3390/su10030771
Submission received: 31 December 2017 / Revised: 1 March 2018 / Accepted: 9 March 2018 / Published: 11 March 2018

Abstract

:
The long-term human activities could influence land use/cover change and sustainability. As the global climate changes, humans are using more land resources to develop economy and create material wealth, which causes a tremendous influence on the structure of natural resources, ecology, and environment. Interference from human activities has facilitated land utilization and land coverage change, resulting in changes in land-use intensity. Land-use intensity can indicate the degree of the interference of human activities on lands, and is an important indicator of the sustainability of land use. Taking the middle and lower reaches of Shule River Basin as study region, this paper used “land-use degree (LUD)” and “human activity intensity (HAI)” models for land-use intensity, and analyzed the spatio-temporal variation of land-use intensity in this region from a multi-perspective. The results were as follows: (1) From 1987 to 2015, the land use structure in the study region changed little. Natural land was always the main land type, followed by semi-natural land and then artificial land. (2) The LUD in the study region increased by 35.36 over the 29 years. It increased the most rapidly from 1996 to 2007, and after 2007, it still increased, but more slowly. A spatial distribution pattern of “low land-use degree in east and west regions and high land-use degree in middle region” changed to “high land-use degree in east and middle regions and low land-use degree in west region”. (3) The human activity intensity of artificial lands (HAI-AL) in the study region decreased from 1987 to 1996, and then increased from 1996 to 2015. The human activity intensity of semi-artificial lands (HAL-SAL) in the study region increased over the 29 years, and more rapidly after 1996. (4) 1996–2007 was a transition period for the land-use intensity in the study region. This was related to the implementation of the socio-economy, policies such as “Integrated Development of Agricultural Irrigation and Immigrant Settlement in Shule River Basin (1996–2006)”, and technologies.

1. Introduction

The unprecedented growth in the human population in the last centuries translates to escalated resource consumption, as manifested in relatively high rates of agriculture and food production, industrial development, energy production, and urbanization. These human enterprises lead to local land-use and land-cover changes [1]. Land use is one of the main ways through which human activities act on natural environment [2]. It directly reflects the relationship between human activities and environmental changes [1,2,3]. However, palaeoecological and palaeoenvironmental records show that land use changes are the main driving force of long-term changes in biodiversity, and in the stability and function of ecosystem services [4,5,6,7]. They include land-cover change and land-use intensity change [8]. Current research on land-use changes mainly focuses on land-cover change, such as its pattern and process, driving mechanism, spatio-temporal prediction, dynamic simulation, and ecological and environmental effects, and many valuable results have been obtained [7,8,9,10]. As a comparison, land-use intensity and its spatial variation have not yet become a mainstream topic for research during the past several decades [8]. Land-use intensity can indicate the degree of the interference of human activities on lands, and its variation has important influence on biodiversity and ecosystem service function [9,10,11,12,13,14].
During the past decades, developed countries have experienced unprecedented industrialization and urbanization. Populations in these countries increase rapidly, and urban land area continues to expand. In order to meet the growing needs of humans for products and services, ways of land investment become more diversified, leading to increased spatial difference in land-use intensity [15,16,17]. An agreement on the importance of land-use intensity and its changes has been reached. From the perspective of interaction between humans and natural environment, some researchers selected land cover, social economy, and ecological environment as indexes, and built an index system for land-use intensity [18,19,20], on which basis they studied the land-use intensity and its spatial variation on different scales [21,22,23], regions [15,24], and objects [25,26,27]. Since 2000, China has experienced rapid industrial and urban transformation, and its economic development has been greatly promoted. However, problems also occur: the shortage of cultivated land, along with the expansion of urban land area, as well as unbalanced regional development and food safety issues caused by unreasonable utilization of lands [28,29,30]. At the same time, under limited land resources, population and consumption of food have been continuously increased, and led to an increase in demands for products and services. Thus, many methods have been proposed to improve the output of limited land resources and its efficiency. For example, by increasing investment in production factors, such as fertilizer, farm chemicals, and labor force, and increasing the density and volume of buildings, the utilization of land resources can be intensified and exhibit certain spatial variation. In fact, reasonably improving current land-use intensity is the main way to guarantee balanced regional development and national food safety [6]. Research on land-use intensity mainly focuses on grading evaluation, as well as intensive use of cultivated lands, construction lands, and other lands where human activities are concentrated [31,32,33]. However, most research only explores comprehensive, large-scale land use from a single perspective. Although they can reflect land-use intensity on a macro scale, there is a lack of analysis of internal spatial heterogeneity and the use intensity of single type of land. Moreover, quantitative descriptions of land use intensity and its spatial pattern in most regions still lack a clear understanding [11,34,35,36]. Thus, developing an evaluation system for regional land-use intensity and analyzing its spatio-temporal variation, as well as the use intensity of different types of land, are very necessary.
The middle and lower reaches of Shule River are located at the westernmost part of Hexi Corridor, where population and social economic activities are the most concentrated. We did not find relevant research on the land (or land-use) transformations over the millennia in the Shule River Basin; indeed, we know that there were no large-scale human activities before the last 30 years in the area, and therefore, we assume that the observed changes in the ecological environment may be related to both natural factors and human activities [37,38,39]. The development of artificial oasis in Han and Tang dynasties led to the lake drying up, and the river receded of lower reaches, but the river diversion caused by the war and man-made water conservancy facilities made the ancient artificial oasis become desertified and barren [37]. Humans did not learn from history. After 1949, around the development of oil and agricultural land, the population was continuously moved into Guazhou County and Yumen City. The influence of human activities after the 1980s gradually increased. In 1983 and 1996, “Agricultural Construction and Immigrant Settlement Project in Two West Regions” and “Integrated Development of Agricultural Irrigation and Immigrant Settlement in Shule River Basin” were implemented in Shule River Basin, respectively. After 1997, Chinese government implemented a series of policies emphasizing regional development and environmental protection, such as “Reconstruction of Hexi Corridor”, “Western Development”, “Three-North Shelterbelt Project”, “Grain for Green Project”, etc., which directly or indirectly influenced land use in Shule River Basin. Recently, a lot of research on Shule River Basin has been carried out from perspectives of land use/cover changes, quality of ecosystem, ecological and environmental effects and so on [37,38,39,40]. Nonetheless, these studies do not consider spatio-temporal variation of land-use intensity and variation caused by immigration, national policies, technologies, and other human activities.
Taking Guazhou County and Yumen City at the middle and lower reaches of Shule River Basin as examples, the main objective of this article is to use “land-use degree (LUD)” and “human activity intensity (HAI)” models for land-use intensity on the basis of land type classification indexes, then analyze the spatio-temporal variation of land-use intensity from a multi-perspective, reveal the impact of human activities, especially socio-economic, national policies, and technologies on the change of land-use intensity, and clarify how the human activities influence land use/cover change. Generally, it is suggested to analyze the long-term variation of land-use intensity in the middle and lower reaches of Shule River Basin considering its long history. However, using remote sensing imagery, we mainly focused on the period (1987–2015), when human activities had the most significant influence on the variation of land-use intensity. The results could also reflect the long-term changes of land and environment. On the one hand, this study provides a new perspective for the study on the change of land-use intensity in arid and semi-arid areas; on the other hand, it has effectively revealed the spatio-temporal heterogeneity of land use intensity in arid and semi-arid areas, it helps to deeply understand the interactive pattern and eco-environmental effects of human beings and natural ecosystems and provides a scientific basis for the formulation of future sustainable land use policy in arid and semi-arid areas.

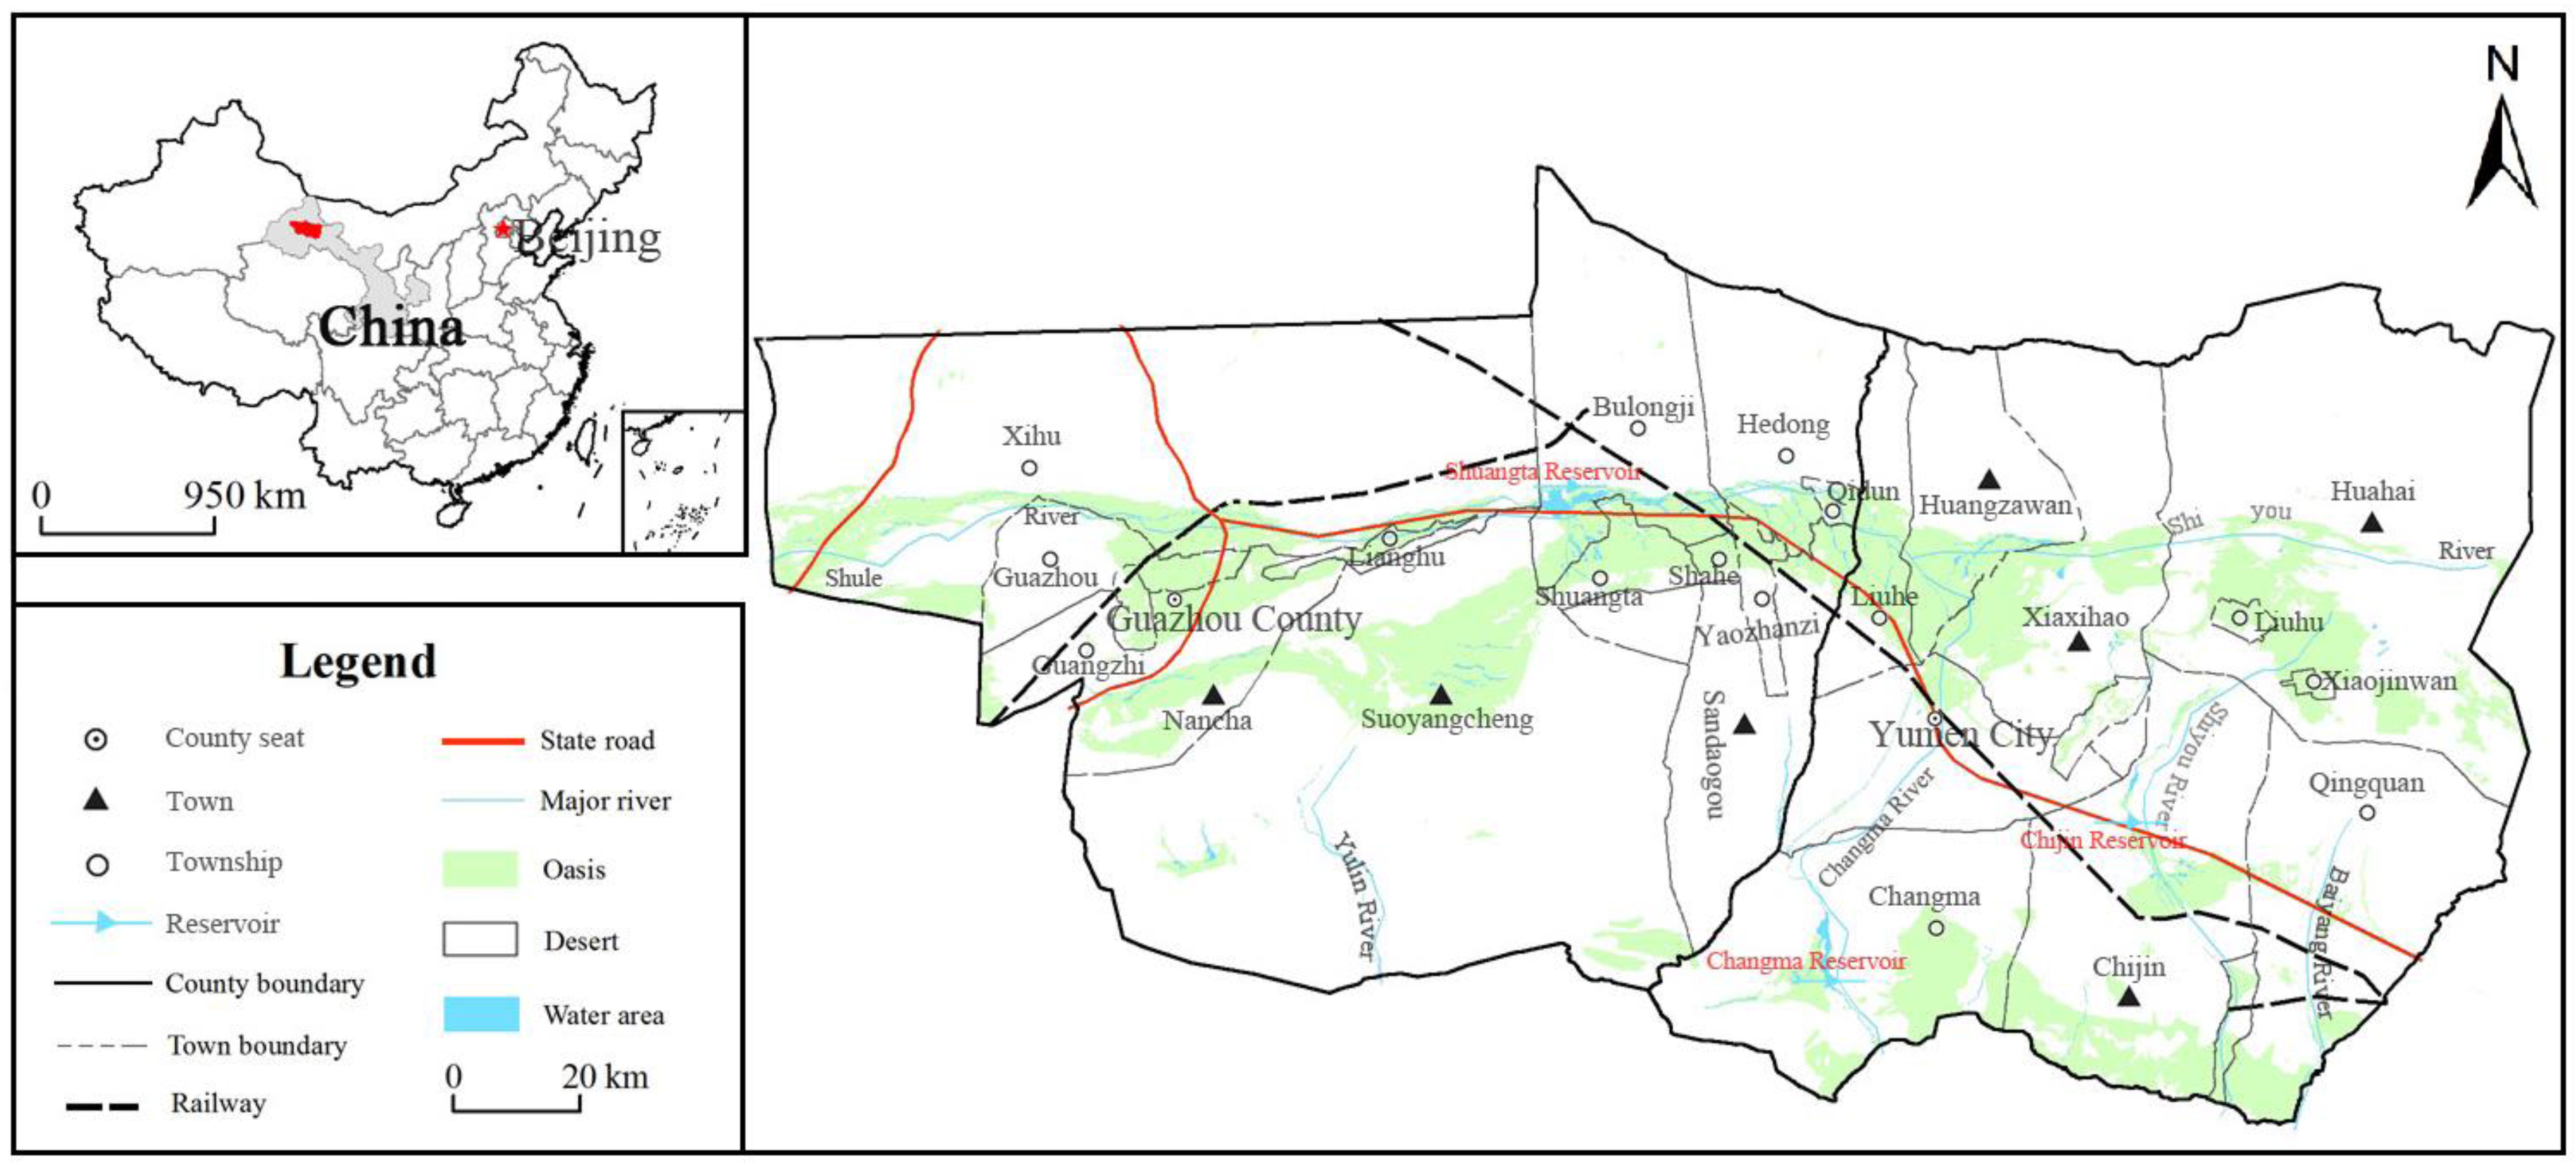
2. Overview of the Study Region

2.1. Natural Geography

Shule River is located between 92°11′ E and 98°30′ E and between 38°0′ N and 42°48′ N, at the westernmost of Hexi Corridor, a transition zone between Qinghai–Tibet Plateau and Alashan Plateau of Inner Mongolia. It is one of the three inland rivers in Hexi Corridor, and occupies an area of 100,000 km2. Shule River Basin has a temperate arid climate, with sufficient and strong solar radiation. Since this inland region is located far away from sea areas, it has only a little rainfall, with large temperature difference and strong evaporation. The annual average temperature is 7–9 °C. The annual average rainfall is less than 60 mm, but the evaporation amount reaches 1500–3000 mm. The rainfall is often concentrated in June–September, accounting for 80% of the rainfall in a whole year. The annual temperature difference ranges from 31.5 to 34.1 °C. The highest temperature exceeds 40.0 °C, and the lowest temperature is lower than −30.0 °C. Changma Valley and Shuangta Reservoir divide Shule River into upstream portion, midstream portion, and downstream portion. Specifically, the upstream portion is between the source and Changma Valley, the midstream portion is between Changma Valley and Shuangta Reservoir, and the downstream portion is portion at the downstream of Shuangta Reservoir. In the upstream region, Shule River has abundant water and flows rapidly through mountains that are steep. There are typical polar continental glacier and a large permafrost region. Thus, the upstream region is as the water source area. In the midstream and downstream regions of Shule River, the terrain is very flat. Oasis and desert coexists. Since Han Dynasty, there has been agricultural development and water conservancy construction in the middle and lower reaches of Shule River. Irrigated agriculture is well developed in Yumen City, Guazhou County, and Dunhuang City. The branches of Shule River include Yulin River, Shiyou River, etc. Four reservoirs, including Changma reservoir, Shuangta reservoir, Chijin reservoir, and Yulin reservoir, are built around Shule River, and they provide water for agricultural irrigation in three irrigation areas, including Changma irrigation district, Shuangta irrigation district, and Huahai irrigation district. In this paper, the region at the south of Yumen City and Guazhou County (94.81–98.25° E; 39.63–41.47° N) was studied. The region is adjacent to Jinta County at its east and to Dunhuang City at its west, with an area of 27,160.2 km2 (Figure 1).

2.2. Social Economy

In 2015, the total population in Yumen City and Guazhou County was 289,800. Among them, agricultural population was 197,600, accounting for 73.76% of the total population. The GDP of this region was 17.747 billion Yuan. Gross agricultural output was 19.47 billion Yuan, accounting for 10.97% of the GDP. The ratio of primary, secondary, and tertiary sectors was 11.54:49.61:38.85. Per capita GPD was 66,254 Yuan (Per capita GDP of Gansu Province was 26,165 Yuan). Rural per capita income was 13,351 Yuan (Rural per capita income of Gansu Province was 6936 Yuan). Clearly, this region develops relatively well in Gansu Province. Guazhou County and Yumen City have jurisdiction over 15 towns in 1987, 16 towns in 1996, 21 towns in 2007, and 23 towns in 2015.

3. Data Sources and Research Methods

3.1. Data Sources

The data used in this paper came from four sources: (1) Remote sensing data. Landsat5 TM remote sensing images for 1987, 1996, 2007, and 2015 were obtained from United States Geological Survey (USGS) website and Institute of Remote Sensing and Digital Earth (RADI), Chinese Academy of Sciences. The path/row of the images are 135/32, 136/31, 137/31, and 137/32, respectively. A total of 20 images were obtained for the four years. The images were taken in July or August when the vegetation coverage rate is the highest. The average cloud cover of the images was no higher than 10%, so the quality of the data can meet the requirements. (2) Basic maps. Topographic map for Guazhou County and Yumen City (1:250,000), and vector administrative boundary (1:250 000) were obtained from Gansu Province Surveying and Mapping Bureau. Land use survey data (1: 1,000,000) in 1998 and 2008 were obtained from Gansu Province Land and Resources Department. Land use change data (vector format) in 2015 were also obtained from Gansu Province Land and Resources Department. (3) Social economy statistics. Statistics about population, social economy, labor force, agricultural machinery, fertilizer, and agricultural film from 1987 to 2015 were obtained from Yumen Statistics Bureau and Guazhou Statistics Bureau. The basic data of Immigrant Development in Shule River Basin Project were obtained from Gansu Province Shule River Construction Administration Bureau (Project Completion Report of the World Bank Loan Project for Hexi Corridor (Shule River) in Gansu Province of China). (4) Field survey data. From 2007 and 2015, we carried out field survey for seven times in the study region and interviewed the staff in local related departments, such as agriculture, forestry, water conservancy, and nature reserves, etc.

3.2. Data Processing

Geometric correction and visual interpretation of the remote sensing images for 1987, 1996, 2007, and 2015 were performed. The classification results were checked according to the field survey data and land use survey data. Interpretation precisions (Kappa coefficient) were 0.752, 0.761, 0.861, and 0.865, respectively, all higher than the minimum allowable precision (0.7). ArcGIS10.2 (dissolve tool) was used to perform spatial overlap and field fusion of interpreted remote sensing data and vector administrative boundary of Guazhou County and Yumen City. Then, land use type data for Guazhou County and Yumen City were obtained. According to the requirements of this study, the interference of human activities on the lands, and the degree of difficulty of restoring natural lands, the lands were classified into four types: (1) Artificial lands. They are characterized by water impervious surface and can hardly restore a natural state. Typical example is urban construction land. (2) Semi-artificial lands. The topsoil is frequently disturbed, and they can be restored to natural state. Typical example is cultivated land. (3) Semi-natural lands. The topsoil is sometimes disturbed, and the vegetation is frequently disturbed. Typical examples include woodland, grassland, wetlands, etc. (4) Natural lands. The topsoil and vegetation are seldom disturbed. Typical examples include Gobi Desert and sandy land.

3.3. Research Methods

Land-use intensity indicates the degree of the interference of human activities on lands. The spatio-temporal variation of land-use intensity in the middle and lower reaches of Shule River Basin was analyzed from the perspective of “land-use degree (LUD)” and “human activity intensity (HAI)”. LUD mainly reflects the breadth and depth of land use. It not only reflects the natural attributes of land, but also reflects the combined effect of human factors and natural environment factors. HAI reflects the impact of human economic and social activities on a certain geographical natural environment. First, land use process was analyzed. The land use structure and it changes were used to characterize LUD and its variation. Second, human activities were considered. The land-use intensity under the influence of human activities was analyzed. HAI and its changes were used to characterize the use intensity of single type of land and its variation.

3.3.1. Land-Use Degree (LUD)

According to the natural balance of land under the influence of social factors, LUD was classified into three grades, and a value was assigned for each grade (Table 1). On this basis, LUD was calculated and used to indicate land-use intensity. The detailed method was explained as follows [41].
L a = 100 × i = 1 n A i × C i   L a ( 100 , 400 )
where La is the comprehensive LUD index of the study region, Ai is the grading index of land type i in the study region, Ci is the percentage of the area of land type i in the study region, and n is the number of land types. La values can be classified into five groups: low land-use degree (La < 125), relatively low land-use degree (125 < La < 150), medium land-use degree (150 < La < 175), relatively high land-use degree (175 < La < 200), and high land-use degree (La > 200).

3.3.2. Human Activity Intensity (HAI)

In the middle and lower reaches of Shule River Basin, human activities are mainly concentrated in artificial lands and semi-artificial lands. Thus, human activity intensity of artificial land and semi-artificial land were mainly analyzed.
(1) Human activity intensity of artificial lands (HAI-AL)
HAL-AL includes breadth, depth, and frequency. In order to ensure the comparability of the three indicators, they were standardized and turned into dimensionless values. A combination of arithmetic mean method and geometric mean method were used to calculate HAL-AL.
B i = 1 2 ( B g + B s + B p 3 + B g B s B p 3 )
where Bi is HAL-AL, Bg is the breadth of artificial land use, Bs is the depth of artificial land use, and Bp is the frequency of artificial land use. HAL-AL can be classified into five groups: low land-use intensity (Bi < 0.075), relatively low land-use intensity (0.075 < Bi < 0.15), medium land-use intensity (0.15 < Bi < 0.225), relatively high land-use intensity (0.225 < Bi < 0.3), and high land-use intensity (Bi > 0.3).
B g = S B / S * 100 %
B s = S B / G 23
B p = P / S B
where SB is the total construction area (km2), S is the total land area (km2), G23 is the added value of secondary and tertiary industries (10,000 Yuan), and P is the population.
(2) Human activity intensity of semi-artificial lands (HAI-SAL)
HAL-SAL was calculated according to investment per unit area of cultivated land. Investment includes labor force, agricultural machinery, fertilizer, and agricultural film. These indicators have different dimensions, which makes it difficult for comparison. Thus, the concept of “emergy” was introduced which is proposed by Odum [42]. Emergy is defined as available energy consumed by both direct and indirect manufacturing services and products, and it is usually quantified as the equivalent of solar energy and expressed as solar joules (sej) [42].
P i = ( L E + Q E + F E + B E ) / S P
where Pi is cultivated land-use intensity (sej/km2), Sp is total cultivated area (km2), LE is the emergy of labor force (sej), QE is the emergy of agricultural machinery (sej), FE is the emergy of fertilizer (sej), and BE is the emergy of agricultural film (sej). The emergy values were obtained according to Odum [42] and Lan [43]. By using natural breakpoint method, HAL-SAL can be classified into five groups: low land-use intensity (Pi < 50), relatively low land-use intensity (50 < Pi < 100), medium land-use intensity (100 < Pi < 200), relatively high land-use intensity (200 < Pi < 300), and high land-use intensity (Pi > 300).
(a) Emergy of labor force:
L E = T l · C l · N l
where Tl is the conversion rate of the emergy of labor force (taken as 3.8 × 10⁵ sej/J in this paper), Cl is energy transformation coefficient for labor force (taken as 1.26 × 10⁷ J/person), and Nl is the total amount of labor force (persons).
(b) Emergy of agricultural machinery
Q E = T q · C q · N q · Q · 0.1
where Tq is the conversion rate of the emergy of agricultural machinery (7.5 × 10³ sej/J), Cq is energy transformation coefficient for agricultural machinery (taken as 2.1 × 10⁸ J/kg), Nq is the total amount of input power of agricultural machinery (KW), Q is the mass-to-energy conversion coefficient (taken as 04.72 kg/KW), and 0.1 is depreciation coefficient.
(c) Emergy of fertilizer
F E = R N · T N + R P · T P + R K · T K + R F · T F
where RN, RP, RK, and RF are the total use amounts of nitrogen fertilizer, phosphate fertilizer, potash fertilizer, and compound fertilizer (t), respectively; TN, TP, TK, and TF are the emergy conversion rates of nitrogen fertilizer, phosphate fertilizer, potash fertilizer, and compound fertilizer, respectively (taken as 3.8 × 10¹⁵ sej/t, 3.9 × 10¹⁵ sej/t, 1.1 × 10¹⁵ sej/t and 2.8 × 10¹⁵ sej/t, respectively).
(d) Emergy of agricultural film
B E = T B · N B
where TB is the emergy conversion rate of agricultural film (taken as 3.8 × 10¹⁴ sej/t) and NB is the total use amount of agricultural film (t).

4. Results

4.1. The Overall Characteristics of Land Use in the Middle and Lower Reaches of Shule River Basin

From 1987 to 2015, land use structure in the middle and lower reaches of Shule River Basin changed little (Figure 2 and Table 2). Natural land was always the main land type, whose area accounted for more than 80% of the total land area, followed by semi-natural land, and then artificial land (area less than 1%). From 1987 to 2015, the area of oasis consisting of semi-natural land, semi-artificial land, and artificial land increased by 549.16 km2, with an average annual increase of 18.94 km2. From 1996 to 2007, oasis area increased the most, by 398.75 km2, accounting for 72.61% of the total increase in oasis area, with an average annual increase of 36.25 km2. After 2007, oasis area still increased, but more slowly, and the average annual increase decreased by 36.88% compared with that from 1996 to 2007. From 1987 to 2015, the artificial and semi-artificial land areas increased with increase in oasis area, whereas the semi-natural land area decreased. The semi-artificial land area increased more rapidly than artificial land area, by 977.96 km2 over the 29 years with an average annual increase of 33.72 km2. Especially from 1996 to 2007, the semi-artificial land area increased by 593.61 km2, accounting for 60.70% of the total increase, with an average annual increase of 53.96 km2.
After 2007, the artificial land area increased rapidly, by 46.40 km2 from 2007 to 2015, accounting for 51.69% of the total increase, with an average annual increase of 5.80 km2.

4.2. Spatio-Temporal Variation of LUD in the Middle and Lower Reaches of Shule River Basin

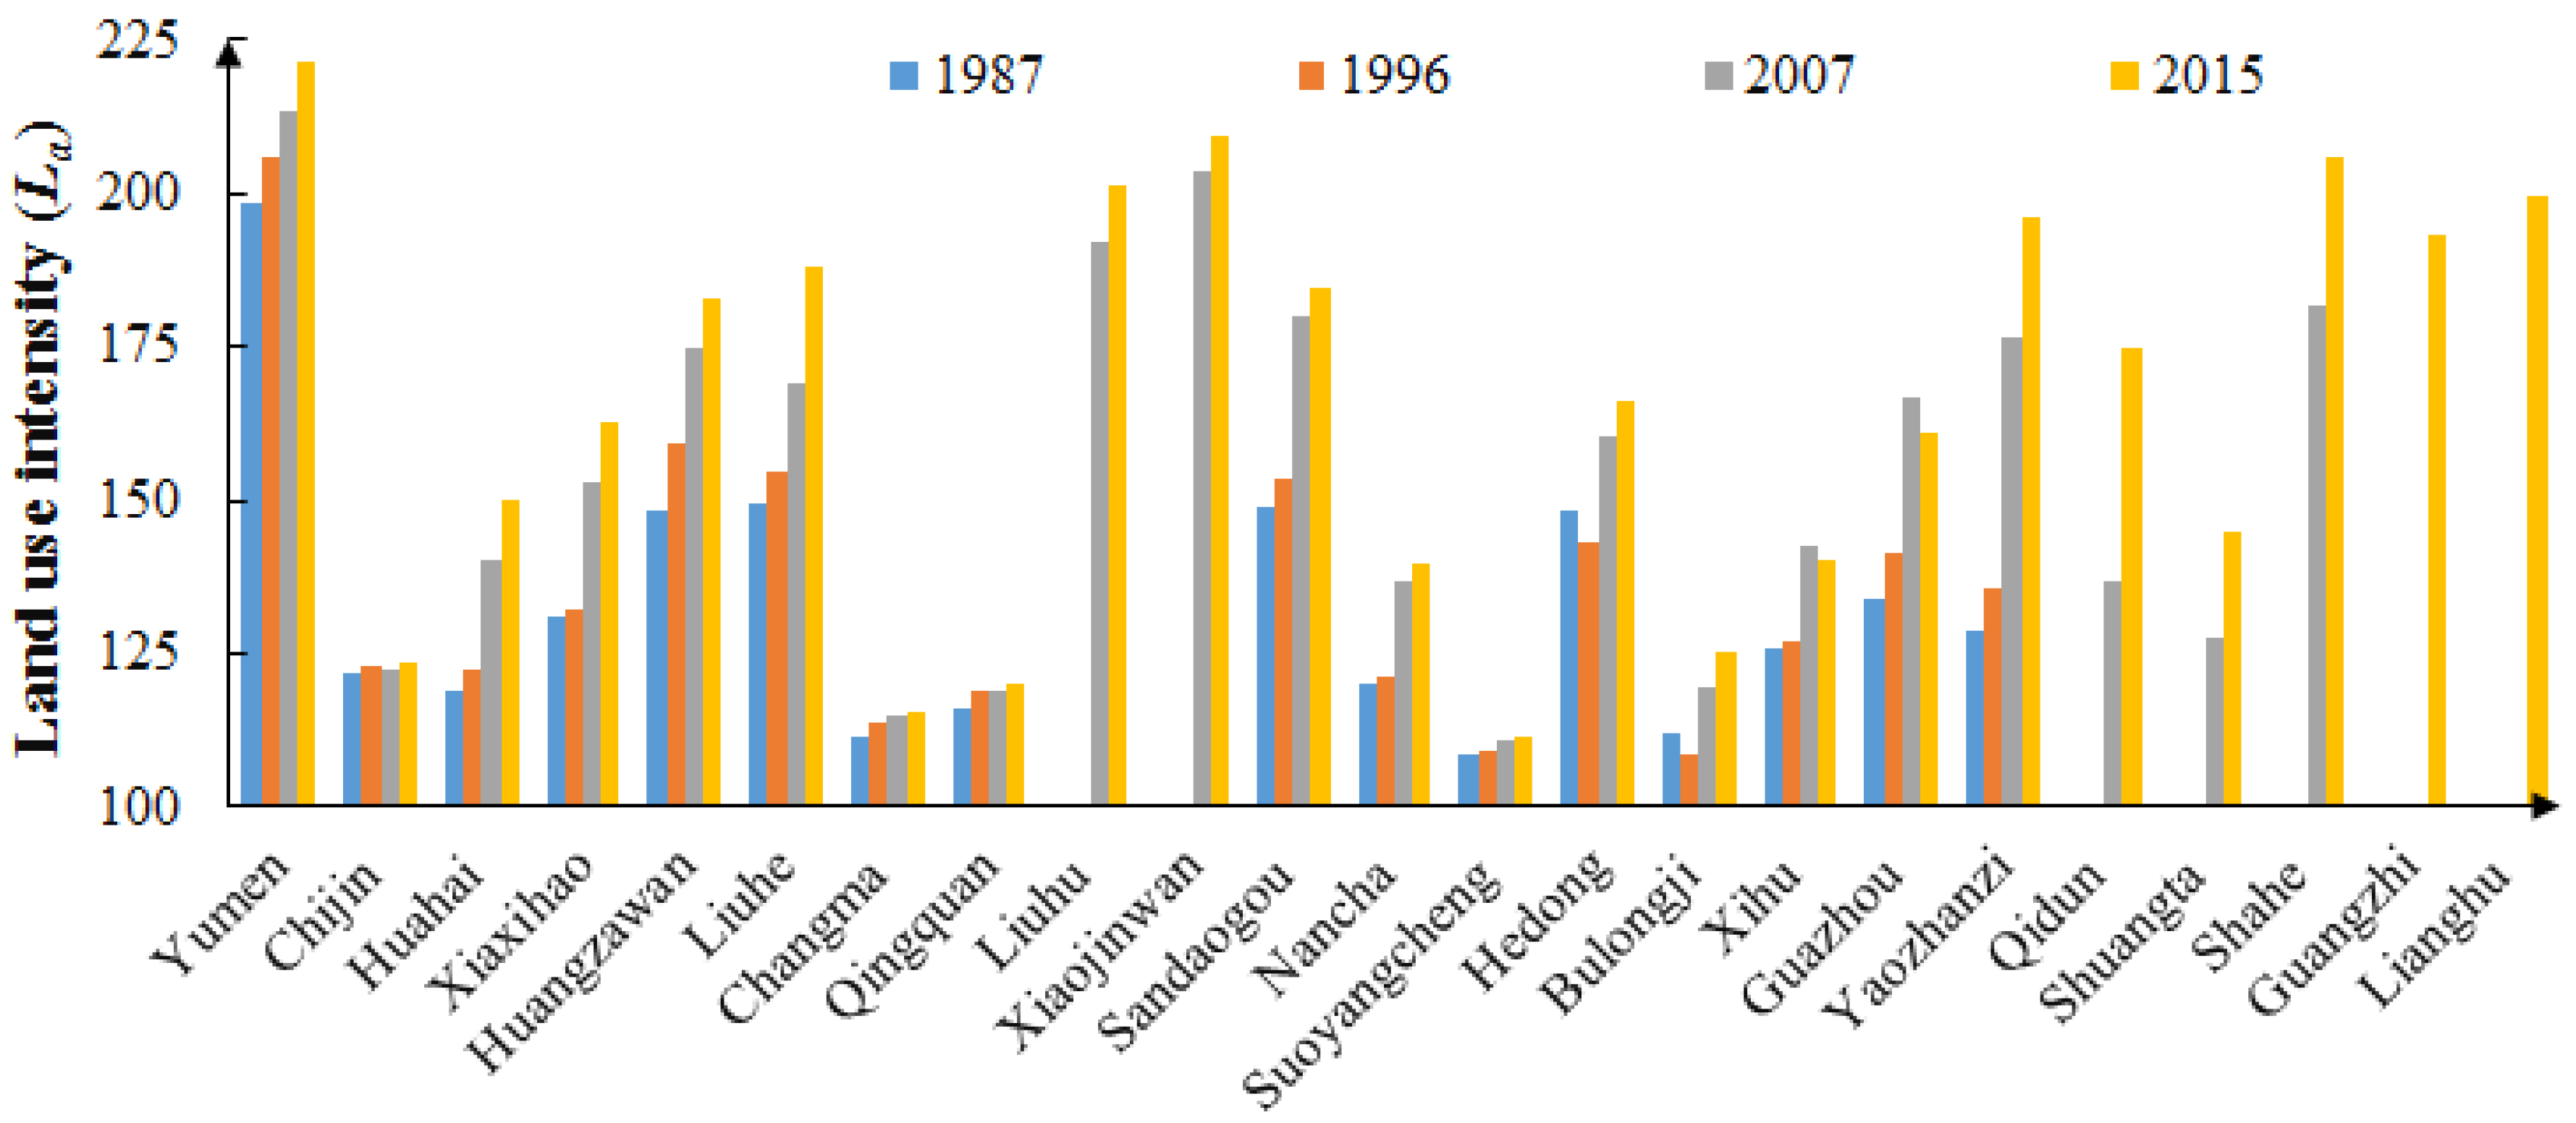
4.2.1. Temporal Variation of LUD

From 1987 to 2015, LUD of the middle and lower reaches of Shule River Basin increased by 35.36, with an average annual increase of 1.22 (Figure 3). There was a transition of LUD from relatively low level to medium level. Especially, LUD increased the most rapidly from 1996 to 2007, by 24.17, accounting for 68.35% of the total increase. After 2007, LUD still increased, but more slowly.
From 1987 to 2015, the LUD of the towns in the study region also increased. In the four years, the LUD of Yumen Town was always the highest, with an average intensity of 209.73, indicating high land-use intensity. The LUD of Suoyang Town was always the lowest, and was 111.64 in 2015, indicating low land-use intensity. Over the 29 years, the LUD of Yaozhanzi Town increased the most, by 67.42, with an average annual increase of 2.32. Following Yaozhanzi Town, Liuhe Town, Sandaogou Town, Huangzhawan Town, and Huahai Town also experienced significant increases in LUD, which were 38.33, 35.91, 34.40, and 31.05, respectively. The increase in LUD of Suoyang Town was the smallest (2.88). The LUD of 86.36% of the towns increased more rapidly from 1996 to 2007 than in other periods. From 1996 to 2007, Yaozhanzi Town experienced the greatest increase in LUD, which was 40.82, accounting for 60.55% of the total increase (newly constructed towns were not included). In the same period, the increase in the LUD of Hedong Town accounted for 91.5% of its total increase.

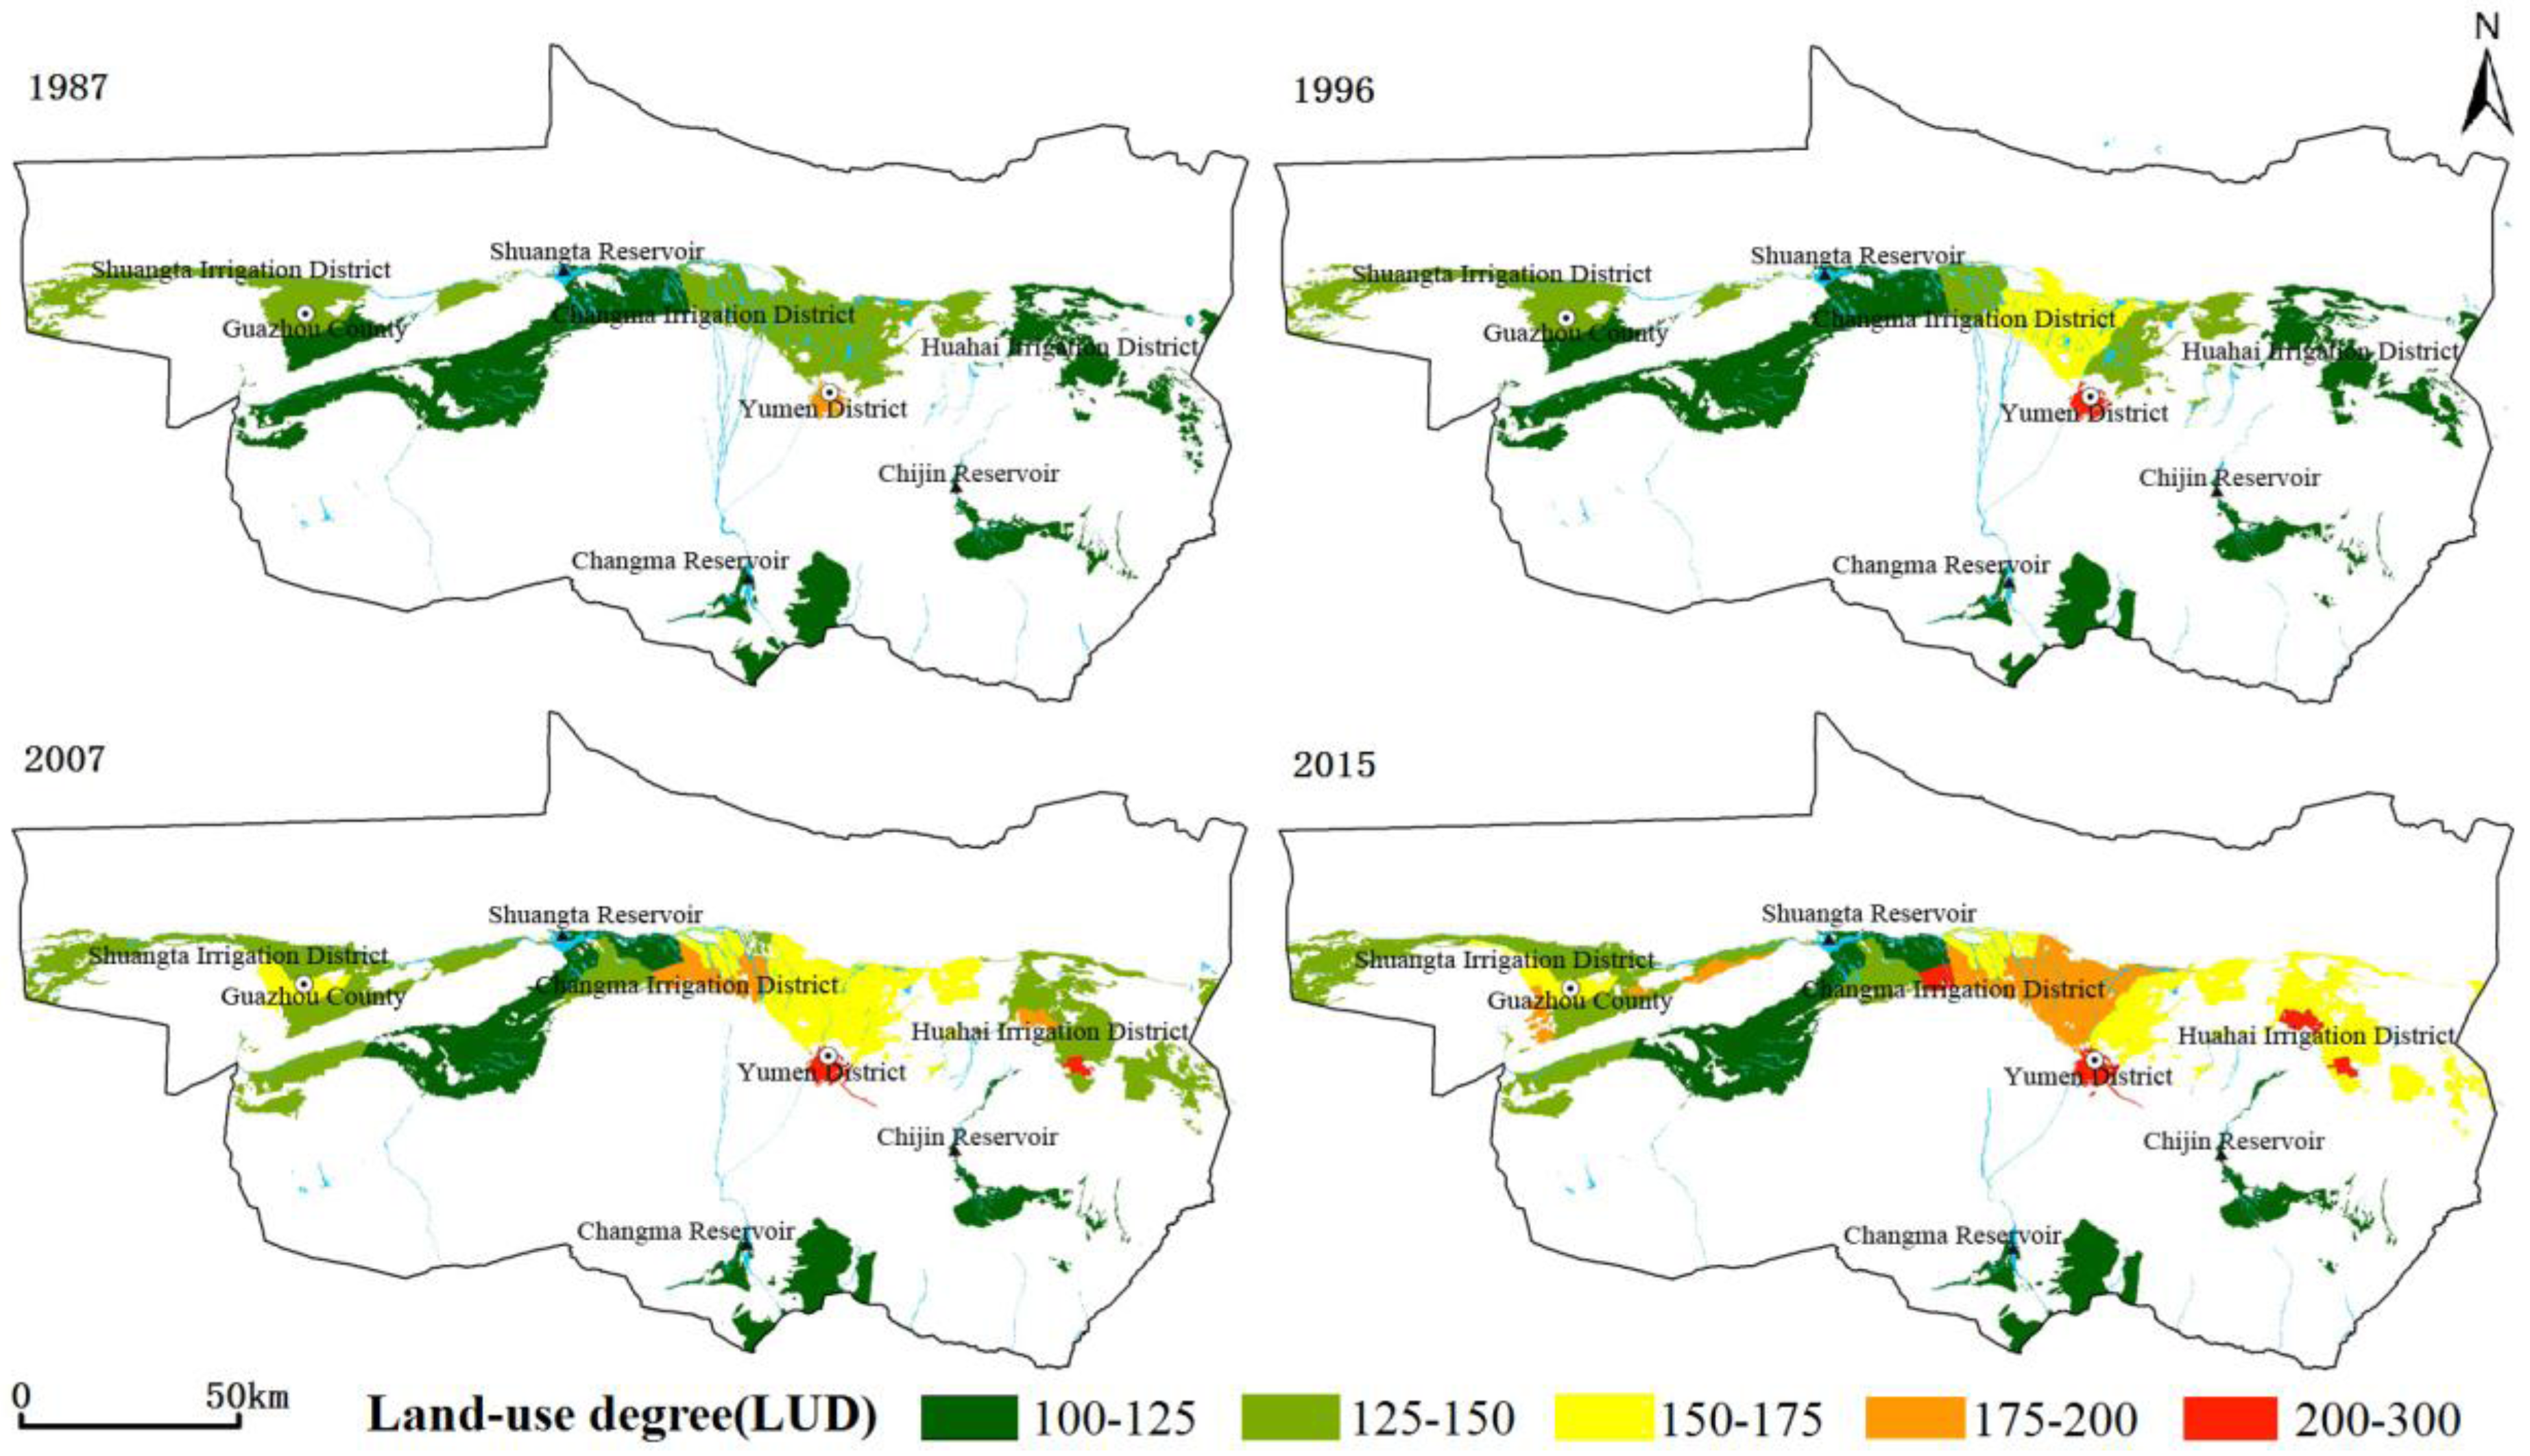
4.2.2. Spatial Variation of LUD

In order to study the spatial distribution of LUD on town scale, the study region was divided into three irrigation areas: Huahai irrigation district, Changma irrigation district, and Shuangta irrigation district. On this basis, the difference in LUD among three irrigation areas can be observed (Figure 4). In 1987, the development of land was slow. Except Yumen Town, with relatively high land-use degree, other towns had low or relatively low land-use degree. Among the three irrigation areas, Changma irrigation district in the middle of the study region had relatively high land-use degree, whereas the other two irrigation areas had relatively low levels of land development. In 1996, Huahai and Shuangta irrigation districts experienced obvious changes in LUD. Yumen Town in Changma irrigation district experienced a transition from relatively high land-use degree to high land-use degree. Sandaogou Town, Liuhe Town, and Huangzhawan Town experienced a transition from relatively low land-use degree to medium land-use degree. For the study region, there was a distribution pattern of “low land-use degree in east and west regions, and high land-use degree in the middle region”. From 1996 to 2007, the LUD increased significantly and the spatial distribution of LUD changed the most evidently than in other periods. In 2007, the LUD of Changma irrigation district was the highest, with concentrated regions of medium or high land-use degree. Huahai irrigation district experienced a transition from low land-use degree to relatively low land-use degree, and the LUD of some towns even reached relatively high or high levels. In Shuangta irrigation district, all the towns except Suoyang Town, had low or medium land-use degree. From 2007 to 2015, the LUD of the study region further increased. Changma irrigation district and the region of Huahai irrigation district at the north of Chijin reservoir experienced significant changes in LUD. The LUD of 95% of the towns reached medium or high levels, showing a spatial distribution pattern of “high land-use degree in east and middle regions and low land-use degree in west region”.

4.3. Spatio-Temporal Variation of HAL-AL and HAL-SAL in the Middle and Lower Reaches of Shule River Basin

In the middle and lower reaches of Shule River Basin, human activities are mainly concentrated in artificial and semi-artificial lands. This paper also investigated the HAL-AL and HAL-SAL under the influence of human activities.

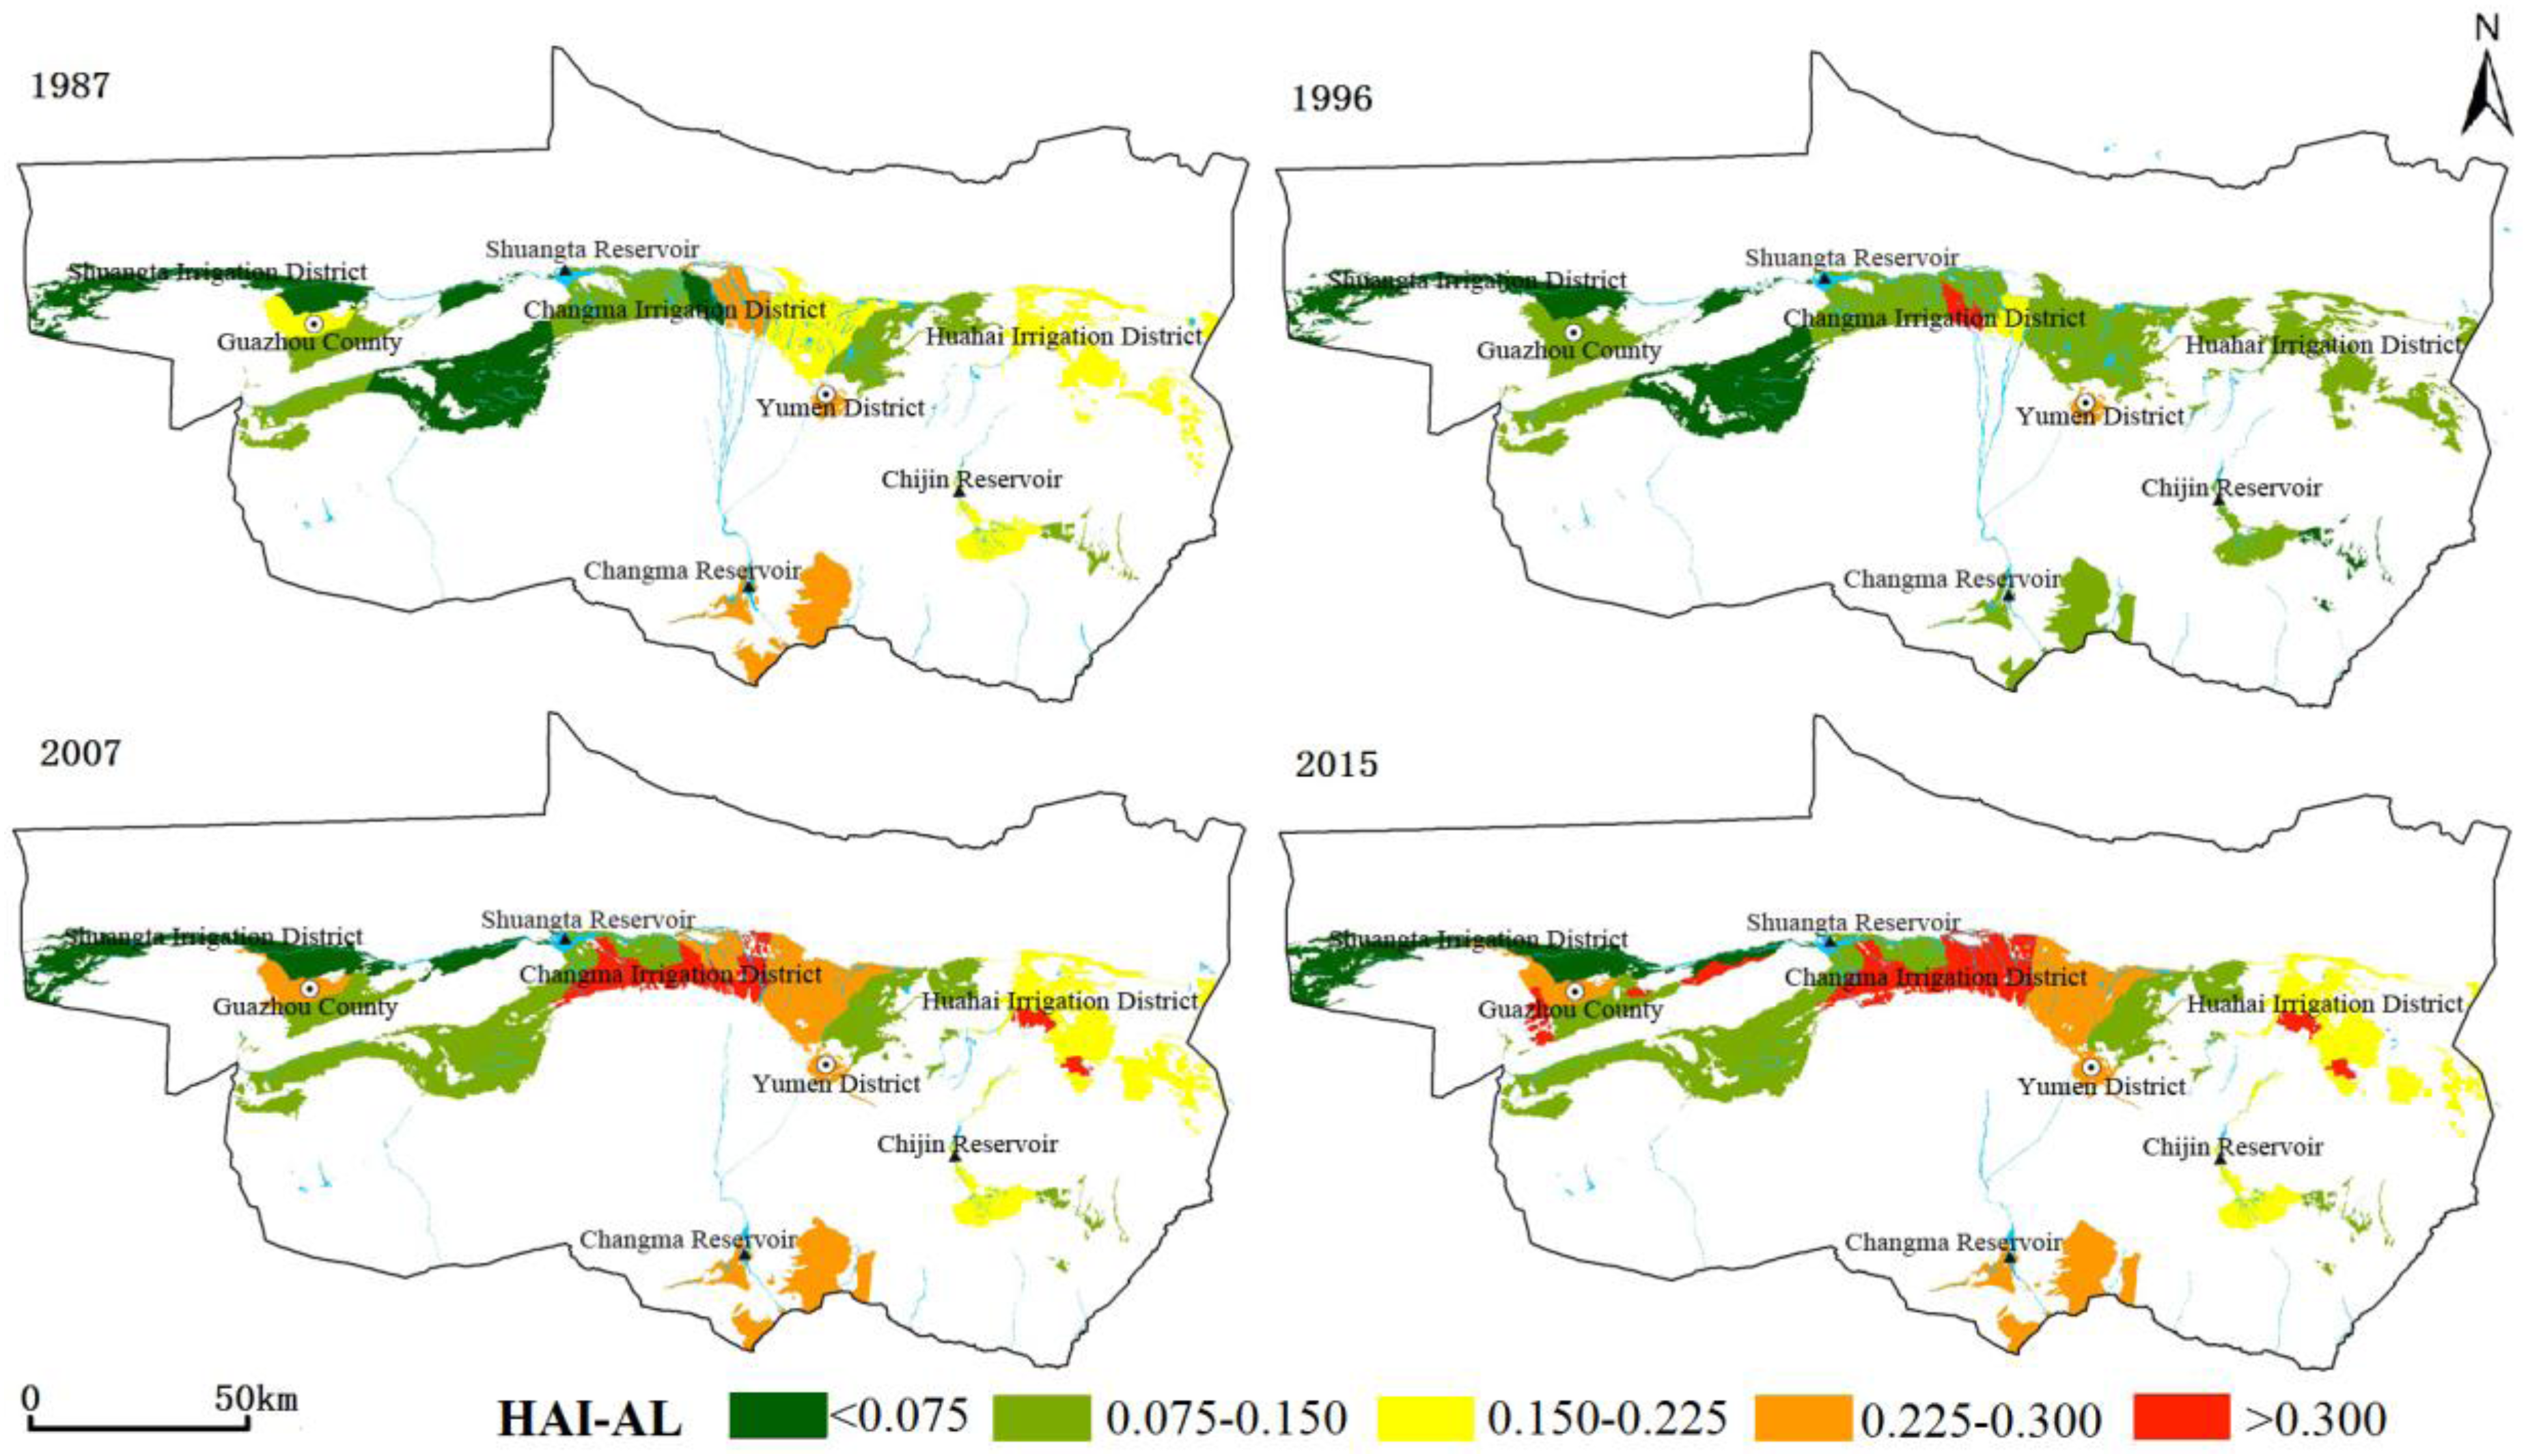
4.3.1. Spatio-Temporal Variation of HAL-AL

(1) Temporal variation of HAL-AL
HAL-AL decreased from 1987 to 1996, and then increased from 1996 to 2015 (Table 3 and Figure 5). In 1987, HAL-AL was low. There were no towns with high HAL-AL. Eleven towns had low or medium HAL-AL, accounting for 73.33% of all towns. From 1987 to 1996, HAL-AL of all the towns decreased. Fourteen towns had low or medium HAL-AL, accounting for 87.5% of all towns. The newly constructed Yaozhanzi Town had the highest HAL-AL, which was 0.376. From 1996 to 2007, five new towns were constructed, and the HAL-AL of all towns increased. In 2007, towns with low or medium HAL-AL accounted for only 38.1%, a decrease of 49.4% compared with that in 1996. The number of towns with relatively high or high HAL-AL reached 13, accounting for 61.9% of all towns. From 2007 to 2015, HAL-AL of all the towns still increased, but very slowly. In 2015, there were still eight towns with low or medium HAL-AL. However, two new towns were constructed. Thus, the proportion of towns with low or medium HAL-AL decreased to 34.78%. The number of towns with relatively high or high HAL-AL reached 15, accounting for 65.22% of all towns.
(2) Spatial variation of HAL-AL
From 1987 to 2015, the difference in HAL-AL between towns and between irrigation areas became more and more evident (Figure 5). In 1987, Huahai and Changma irrigation districts mainly had high HAL-AL, whereas Shuangta irrigation district had low or relatively low HAL-AL. From 1987 to 1996, the HAL-AL decreased in general. HAL-AL in Huahai irrigation district and Changma irrigation district decreased from low or medium levels, to low or relatively low levels. In Shuangta irrigation district, HAL-AL changed little, except that HAL-AL of Guazhou Town decreased from medium level to relatively low level. From 1996 to 2007, HAL-AL increased. Changma irrigation experienced the greatest change in HAL-AL. HAL-AL in most towns in Changma irrigation district increased from relatively low levels to relatively high or high levels. The HAL-AL in Huahai irrigation district also increased, from relatively low level to medium level. As a comparison, Shuangta irrigation district experienced the smallest changes in HAL-AL. From 2007 to 2015, the spatial distribution of HAL-AL tended to be stable, reflecting a pattern of “high HAL-AL in east and middle regions and low HAL-AL in west region”.

4.3.2. Spatio-Temporal Variation of HAL-SAL

(1) Temporal variation of HAL-SAL
From 1987 to 2015, the HAL-SAL in the study region increased with fluctuation (Table 3). The HAL-SAL and their changes were different between towns (Figure 6). In 1987, the HAL-SAL was low in all towns. The HAL-SAL was the highest in Guazhou Town (110.70 × 10¹⁵ sej/km2), and the lowest in Qingquan Town (48.96 × 10¹⁵ sej/km2). Except Nancha Town and Guazhou Town, all other towns had HAL-SAL lower than 100 × 1015 sej/km2. The average intensity of semi-artificial land use was only 71.29 × 10¹⁵ sej/km2. From 1987 to 1996, the HAL-SAL increased rapidly, and the average values increased to 125.76 × 10¹⁵ sej/ km2, by 76.41%. The HAL-SAL of Sandaogou Town was 228.04 × 10¹⁵ sej/km2, far higher than the average value and 3.11 times of that of Chijin Town (which was the lowest). From 1996 to 2007, the HAL-SAL of towns (except Yumen Town, Chijin Town, Qingquan Town, Sandaogou Town, Suoyang Town, and Yaozhanzi Town) decreased. In 2007, the average value was 158.33 × 10¹⁵ sej/km2, increased by 25.89% compared with that in 1996. Only five towns had HAL-SAL higher than the average value. In 2015, the average value was 211.51 × 10¹⁵ sej/km2, increased by 33.59% than that in 2007. The HAL-SAL was the highest in Liuhu Town (631.04 × 10¹⁵ sej/km2) and the lowest in Xiaxihao Town (53.02 × 10¹⁵ sej/km2). From 2007 to 2015, the total investment in cultivated lands in most towns increased. Liuhu town experienced the greatest increase in the HAL-SAL, which was 392.23 × 10¹⁵ sej/km2. The HAL-SAL in some towns decreased, and decreased the most (113.33 × 10¹⁵ sej/km2) in Suoyang Town.
(2) Spatial variation of the HAL-SAL
The HAL-SAL in the middle and lower reaches of Shule River Basin increased over the 29 years, but there was difference in the intensity between irrigation areas (Figure 6), which was due to natural and social economic factors. In 1987, all areas, except Nancha Town and Guazhou Town in Shuangta irrigation district, showed relatively low intensity of semi-artificial land use. From 1987 to 1996, Xihu Town in Shuangta irrigation district experienced a transition from low intensity to relatively high intensity of semi-artificial land use. The west and south parts of Changma irrigation district experienced a transition from low to medium intensity of semi-artificial land use. The HAL-SAL in Huahai irrigation district changed little. From 1996 to 2007, the HAL-SAL in three irrigation areas fluctuated, and the intensity basically followed the order: Shuangta irrigation district > Changma irrigation district > Huahai irrigation district. In Shuangta irrigation district, the HAL-SAL in all towns reached medium or higher levels. Notably, the HAL-SAL in some towns decreased. For example, Xihu town in Shuangta irrigation district experienced a transition from relatively high intensity to medium intensity of semi-artificial land use. The HAL-SAL in Huangzhawan Town and Changma Town in Changma irrigation district decreased from medium level to relatively low level. Liuhu Town and Xiaojinwan Town were newly constructed, and they showed relatively high intensity of semi-artificial land use. From 2007 to 2015, the HAL-SAL in three irrigation areas increased. This was especially true for Shuangta irrigation district, Huahai irrigation district, and the west part of Changma irrigation district, accounting for 71.1% of the total area of semi-artificial land. The HAL-SAL in the east part of Changma irrigation district was relatively low. The overall distribution pattern was of “high HAL-SAL in east and west regions and low HAL-SAL in middle region”.

5. Discussion and Conclusions

5.1. Discussion

Land use intensity reveals the extent to which human activities affect natural ecosystems. Revealing the spatio-temporal variation of land-use intensity is the key to monitoring the influences of land use changes on society and the environment, and to identifying the driving factors of land use changes. The driving factors interact with and restrict each other. They function together in the process of exploitation and utilization of land resources, leading to the spatial differentiation of land use intensity [6]. Shule River Basin is an oasis-desert ecosystem in arid area, where scarce water resources and low vegetation coverage are the main characteristics influencing its sustainable development. Meanwhile, because of the double pressure of population growth and rapid economic development, the ecosystem is very fragile, and the land utilization structure can reflect the ecological environmental problems in arid area [44,45]. With the development of society and advancement of technology, the land utilization has been transformed from natural exploitation to complex management model. In other words, driven by economic benefits, more investment has been put into machinery, fertilizer, and technology for agricultural land, new crop types are planted, and new management measures are adopted. Besides, a large number of buildings and water conservancy facilities have been constructed. Trees and grass have also been planted to improve the property of land that can hardly be utilized. All of these lead to increase in the degree and complexity of land utilization, which will inevitably affect regional ecological environment and its response to global changes [46].

5.1.1. Impacts of Socio-Economic Factors on Land-Use Intensity

Population plays an important role in the process of land use, and it is the most dynamic factor influencing land use. Population growth directly leads to land use changes. Specifically, it influences the way and intensity of land use by influencing the demand for food, housing, and products [18,30,47]. First, population growth will inevitably lead to increase in the demand for food. One way to solve this problem is to expand cultivated land area. Meanwhile, population growth will also result in growing demand for housing and living environment. In order to meet these demands, humans will expand land for living, transportation, public service facilities, and exploit unutilized land, leading to the transformation of land use types [48,49].
From 1987 to 2015, the population has increased sharply in the middle and lower reaches of Shule River Basin, from 232.213 to 289.813 thousand, by 24.81%. Among them, the immigrant population accounted for a large proportion. With the increase of population and the change of lifestyle, some families are gradually changed from large ones into smaller ones, and the total number of households has increased from 56,550 in 1987 to 87,436 in 2015. In terms of population composition, the agricultural population was 129.531 thousand in 1987, accounting for 55.78% of the total population, and 148.926 thousand in 2015, accounting for 51.39%. Although the proportion has decreased, the population structure mainly composed of agricultural population has not changed yet. In the background of population growth, household increasing, and dominated agricultural population, the demand for food, clothing, housing, and transportation will inevitably increase [37]. First, in order to meet the demand for food, the increased agricultural production caused by the cultivation of virgin land is the most significant, in addition to that brought by trade input and the advancement of technology. This explains the continuous expansion of arable land in the middle and lower reaches of Shule River Basin. Second, the increasing population and households have led to the expansion of construction land in both rural and urban areas. Especially in rural areas, the new comers often build new homes to meet their housing demand, thus increasing the area of construction land. Third, the transfer of population from villages to towns has driven the development of tourism and other industries in the region, promoted the improvement of infrastructure and the progression of urbanization, accelerated the transformation of land use mode, and increased the land use intensity [50].
Additionally, socio-economic activity is the basis for the existence and development of regions, and is a very important human activity. Economic growth, industrial restructuring, urbanization, and industrialization are all factors influencing the land-use intensity in Shule River Basin, and their influences have increased significantly in recent 30 years. Economic growth causes the adjustment of regional industrial structure and the change of land input, further influencing the total amount and structure of land demanded. In fact, different industrial structures require different lands [51]. The economic development and life quality improvement promote urbanization and industrialization, which accompany the socio-economic development and promotes non-agricultural land use by means of population and industry concentration, as well as the expansion of urban industrial and mining land [15,49,51,52,53]. At the same time, urbanization and industrialization cause the change of lifestyle and value concepts, which leads to changes of the original land use structure, and then affects the land-use intensity [54].

5.1.2. Impacts of Policy Factors on Land-Use Intensity

Land use intensity has a significant relationship with the policy. However, this impact is often overlooked [55,56]. In the past 50 years, the Chinese government has repeatedly put forward the policies concerning local development and protection in the Shule River Basin to realize local development and meet the social demands [37,57,58]. As a macroscopic and external force, policy directly or indirectly influences human behavior in the process of implementation, affecting land use [59,60,61,62,63].
The inland river of arid area not only nourishes watershed creatures, and maintains ecological stability, but also provides an important guarantee for social and economic development [29,37]. As the global climate changes, interference from human activities has exacerbated the regional land use and land coverage, which influences the intensity of land use. However, human activities are mainly affected by the policies as the result of natural background superimposition and artificial influence [38]. From the investigation of three inland river basins in the Hexi Corridor of Gansu Province, development intensity of land resources is different from east to west (Shiyang River development and utilization up to 171%, Hei River development and utilization rate to 92%, Shule River development and utilization rate to 75%), the contradiction between “man and land” also gradually gets slow from the east to the west [39,40,60]. A comprehensive survey of human development process is made in three inland rivers in Gansu Province, we found a large-scale migration development in Shiyang River and Hei River except historical period (especially Han, Tang, Ming and Qing). Meanwhile, no large-scale immigrant development in the two major basins is constructed, and land resources are in a state of incremental development after the founding of the People’s Republic of China. On the contrary, large-scale migration development in the middle and lower reaches of the Shule River basin has been carried out under the promotion of national policies [38,39,44,45]. “The comprehensive development project for agricultural irrigation and resettlement in the Shule River” lasted 10 years, and was initiated in 1996, which was the most recent and largest organized migration to the basin [37]. During the implementation of this 10-year project, 1.848 billion Yuan were invested, 62,000 people immigrated to and settled down in Shule River Basin, forest area increased by 42.19 km2, and cultivated land area increased by 142.12 km2. Additionally, the areas of infrastructure, public service facilities, and residential land for immigrant housing are also increasing, with expected increases of 5.62 hm2 in ten years due to a large number of immigrants. Large-scale immigration and land development changed the ways of land use [37,38,39,40]. Artificial and semi-artificial lands gradually replaced some part of the natural and semi-natural lands. The original water circulation and the original hydrological ecosystem of oasis were disturbed. Moreover, almost all surface water was channeled to farming area for agricultural production. This changed the natural distribution of water resources and the ecological environment which relies on water circulation.
From 1996 to 2007, the development of all the towns was promoted. Changma irrigation district and Huahai irrigation district were the main regions that underwent development. This period was a transition period for the land development and utilization in the middle and lower reaches of Shule River Basin. It can be attributed to the implementation of the “Integrated Development of Agricultural Irrigation and Immigrant Settlement in Shule River Basin (1996–2006)”. Until 31 December 2006, 6 new towns and 46 new villages were built. A total of 62,000 immigrant people settled down in the study region, mainly in Changma irrigation district and Huahai irrigation district. The population in these two irrigation areas accounted for 61.14% and 23.67%, respectively, of the total population in the study region. Total investment reached 1.971 billion Yuan, aiming to support the construction of Changma Reservoir and immigrant settlement. About 93.68% of the investment was spent on agricultural development. After 1996, the implementation of policies such as “Reconstruction of Hexi”, “Western Development”, “Construction of New Countryside” led to further land development and utilization in the study region. National policies can help solve some practical problems, but they might lead to changes in land use, vegetation coverage, and ecosystem [64].
Above results and our field investigation indicate that 1996 was the key year for artificial and semi-artificial land use in the study region [44,45]. After 1996, HAI increased more rapidly. Before 1996 (1987–1996), the development of social economy in Shule River Basin was slow. Urbanization and industrialization lagged. Population mainly increased in rural regions, so the urban construction area did not expand too much [37]. After 1996, because of the implementation of policies such as “Integrated Development of Agricultural Irrigation and Immigrant Settlement in Shule River Basin (1996–2006)”, “Reconstruction of Hexi (1997)”, and “Western Development (2000)”, as well as the progression of industrialization and urbanization, the population increased rapidly and gradually transferred to urban areas. This led to the expansion of the urban construction area and increase in HAL-AL [37,38,39,44]. Meanwhile, because of the immigrant project, people’s needs for food and profits increased. In order to obtain more agricultural output, farmers increased agricultural input and improved food production per unit area of cultivated land. Also, farmers continuously cultivated virgin soils and increased income by expanding the cultivated land area. It can be seen that national policies have indirect, but the most significant influences on the semi-artificial land use intensity.

5.1.3. Impacts of Technological Factors on Land-Use Intensity

Technological progress is a fundamental factor that determines land-use intensity and environmental change in a region. Particularly, the progression of agricultural science and technology has an important influence on land utilization and ecological environment evolution, as it can effectively improve the efficiency of agricultural production and promote the change of land use type [30,44]. This is mainly shown in the following aspects:
In 1987, the amount of fertilizer used in Yumen City and Guazhou County was only 5831.05 t and was 39,408.08 t in 2015, with a total increase by 5.76 times, and an increase in the amount of fertilizer used per unit area by 35.12 t. The amount of agricultural film used was 1017.5 t in 1996 and 4228.8 t in 2015, which was 4.16 times of the former, with the amount of agricultural film used per unit area increasing by 2.62 t. The increasing amount of fertilizer and agricultural film used per unit area has promoted the growth of crops, improved crop yield and land output, promoted agricultural development, and increased the income level of farmers. Increased investment in fertilizer, agricultural film, and other aspects has led to the continuous development of agriculture, which can provide strong economic and technical support for the further development and utilization of land resources, thus promoting the full utilization of land resources [65].
In 1987, the total power of agricultural machinery used in Yumen City and Guazhou County was only 67.7 × 10⁴ KW, which increased by 10.16 times to 755 × 104 KW in 2015. Technological advances have driven the modernization of agricultural machinery, effectively improved the efficiency of agricultural production, and saved a lot of human and financial resources. On this basis, the potential of land resources can be fully exploited, and the transformation of non-agricultural land to agricultural land is accelerated, leading to increase in cultivated land area [66]. Additionally, due to the wide application of machinery in agricultural production, the surplus labor force in rural areas will increase, and the transfer of surplus labor force will affect the use intensity of artificial land to a certain extent. Some research demonstrates that the transfer of rural labors can lead to an “N” shape change of the utilization intensity of cultivated land [26]. The transfer of surplus labor force can result in higher income level of farmers, more intensive utilization of artificial and semi-artificial land, and changes of land-use intensity.

5.2. Conclusions

Taking Guazhou County and Yumen City at the middle and lower reaches of Shule River Basin as the study region, this paper analyzed the spatio-temporal variation of LUD and HAI. The results might provide insights into the theory of land use changes in inland river basin in Hexi Corridor. The results were as follows:
(1)
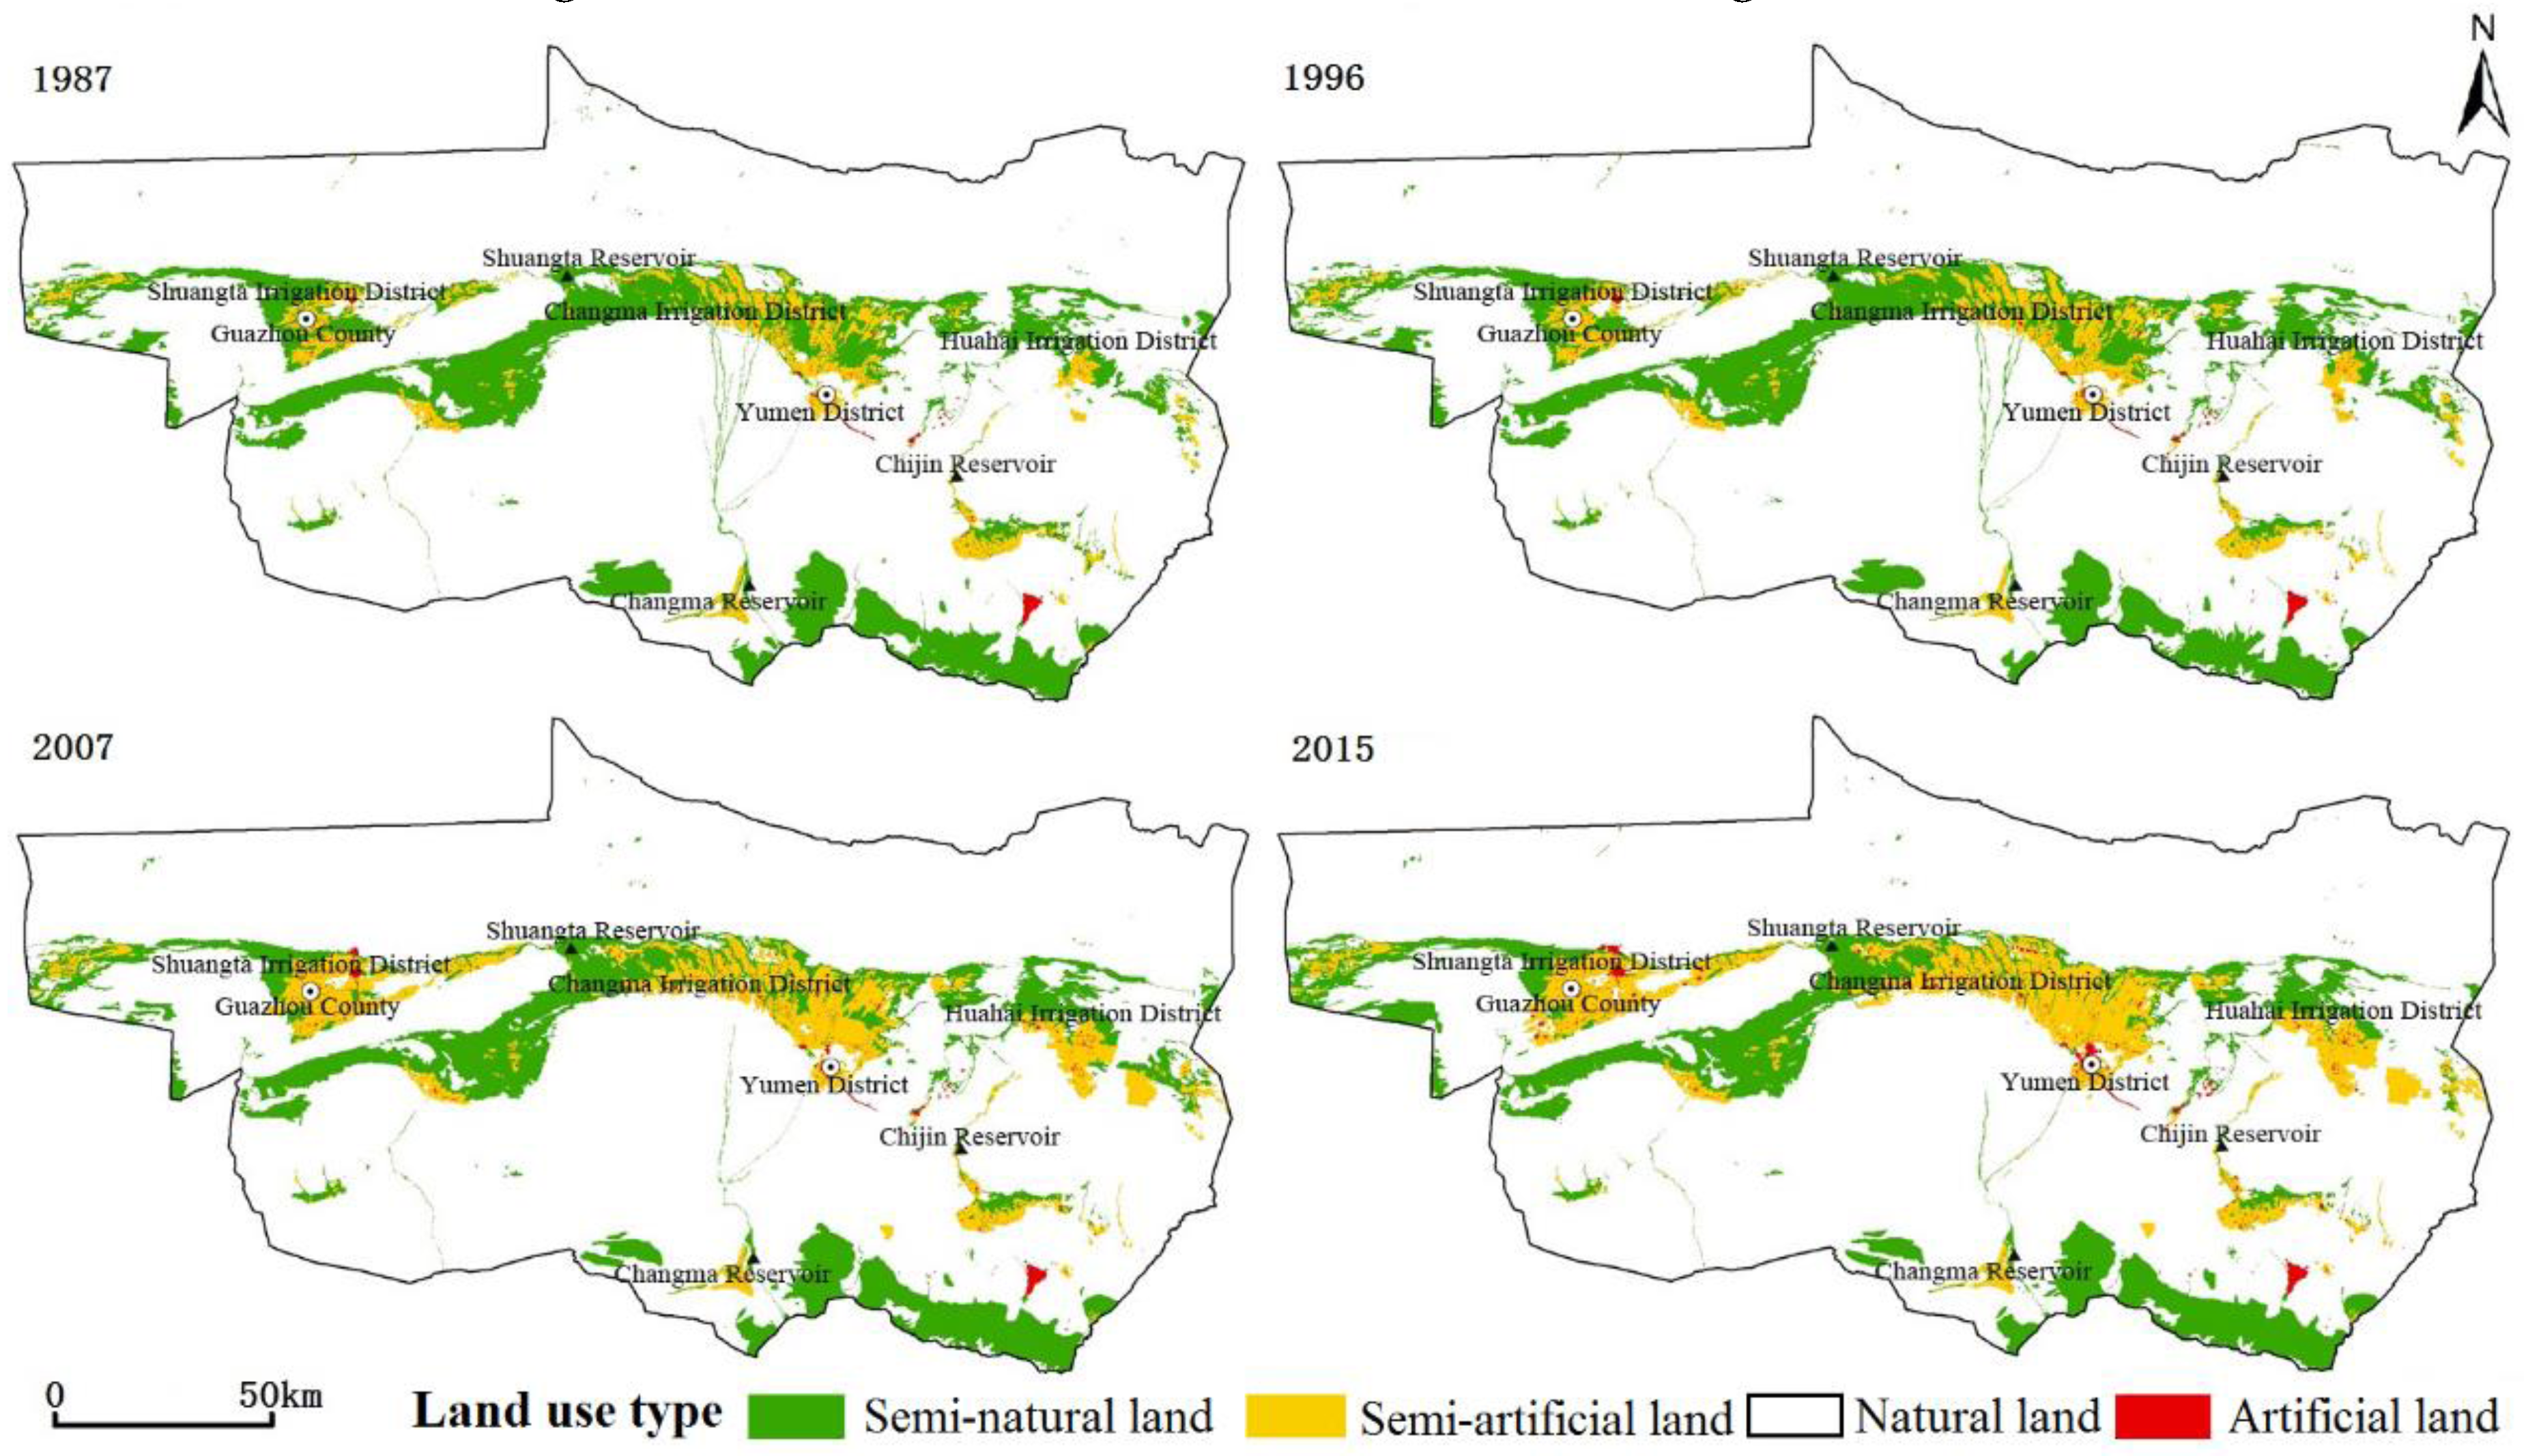
From 1987 to 2015, the land use structure in the middle and lower reaches of Shule River Basin changed little. Natural land was always the main land type, accounting for more than 80% of the total land area, followed by semi-natural land, and then artificial land (less than 1%). The semi-artificial and artificial land areas increased with increase in oasis area, while the semi-natural land area decreased gradually.
(2)
The LUD in the study region increased by 35.36 over the 29 years, with an average annual increase of 1.22. From 1996 to 2007, LUD increased the most rapidly than in other periods, by 24.17, accounting for 68.35% of the total increase. After 2007, the LUD still increased, but more slowly. A spatial distribution pattern of “low land-use degree in east and west regions, and high land-use degree in middle region” changed to “high land-use degree in east and middle regions and low land-use degree in west region”.
(3)
The HAL-AL in the study region decreased from 1987 to 1996, and then increased from 1996 to 2015. In 1987, 73.33% of the towns showed medium or relatively low HAL-AL. In 1996, this percentage increased to 87.5%. From 1996 to 2007, HAL-AL in all towns increased. Towns with relatively high or high HAL-AL accounted for 61.9%. From 2007 to 2015, HAL-AL still increased but only a little. In 2015, towns with relatively high or high HAL-AL accounted for 65.22%. A spatial distribution pattern of “high HAL-AL in east and middle regions and low HAL-AL in west region” was formed.
(4)
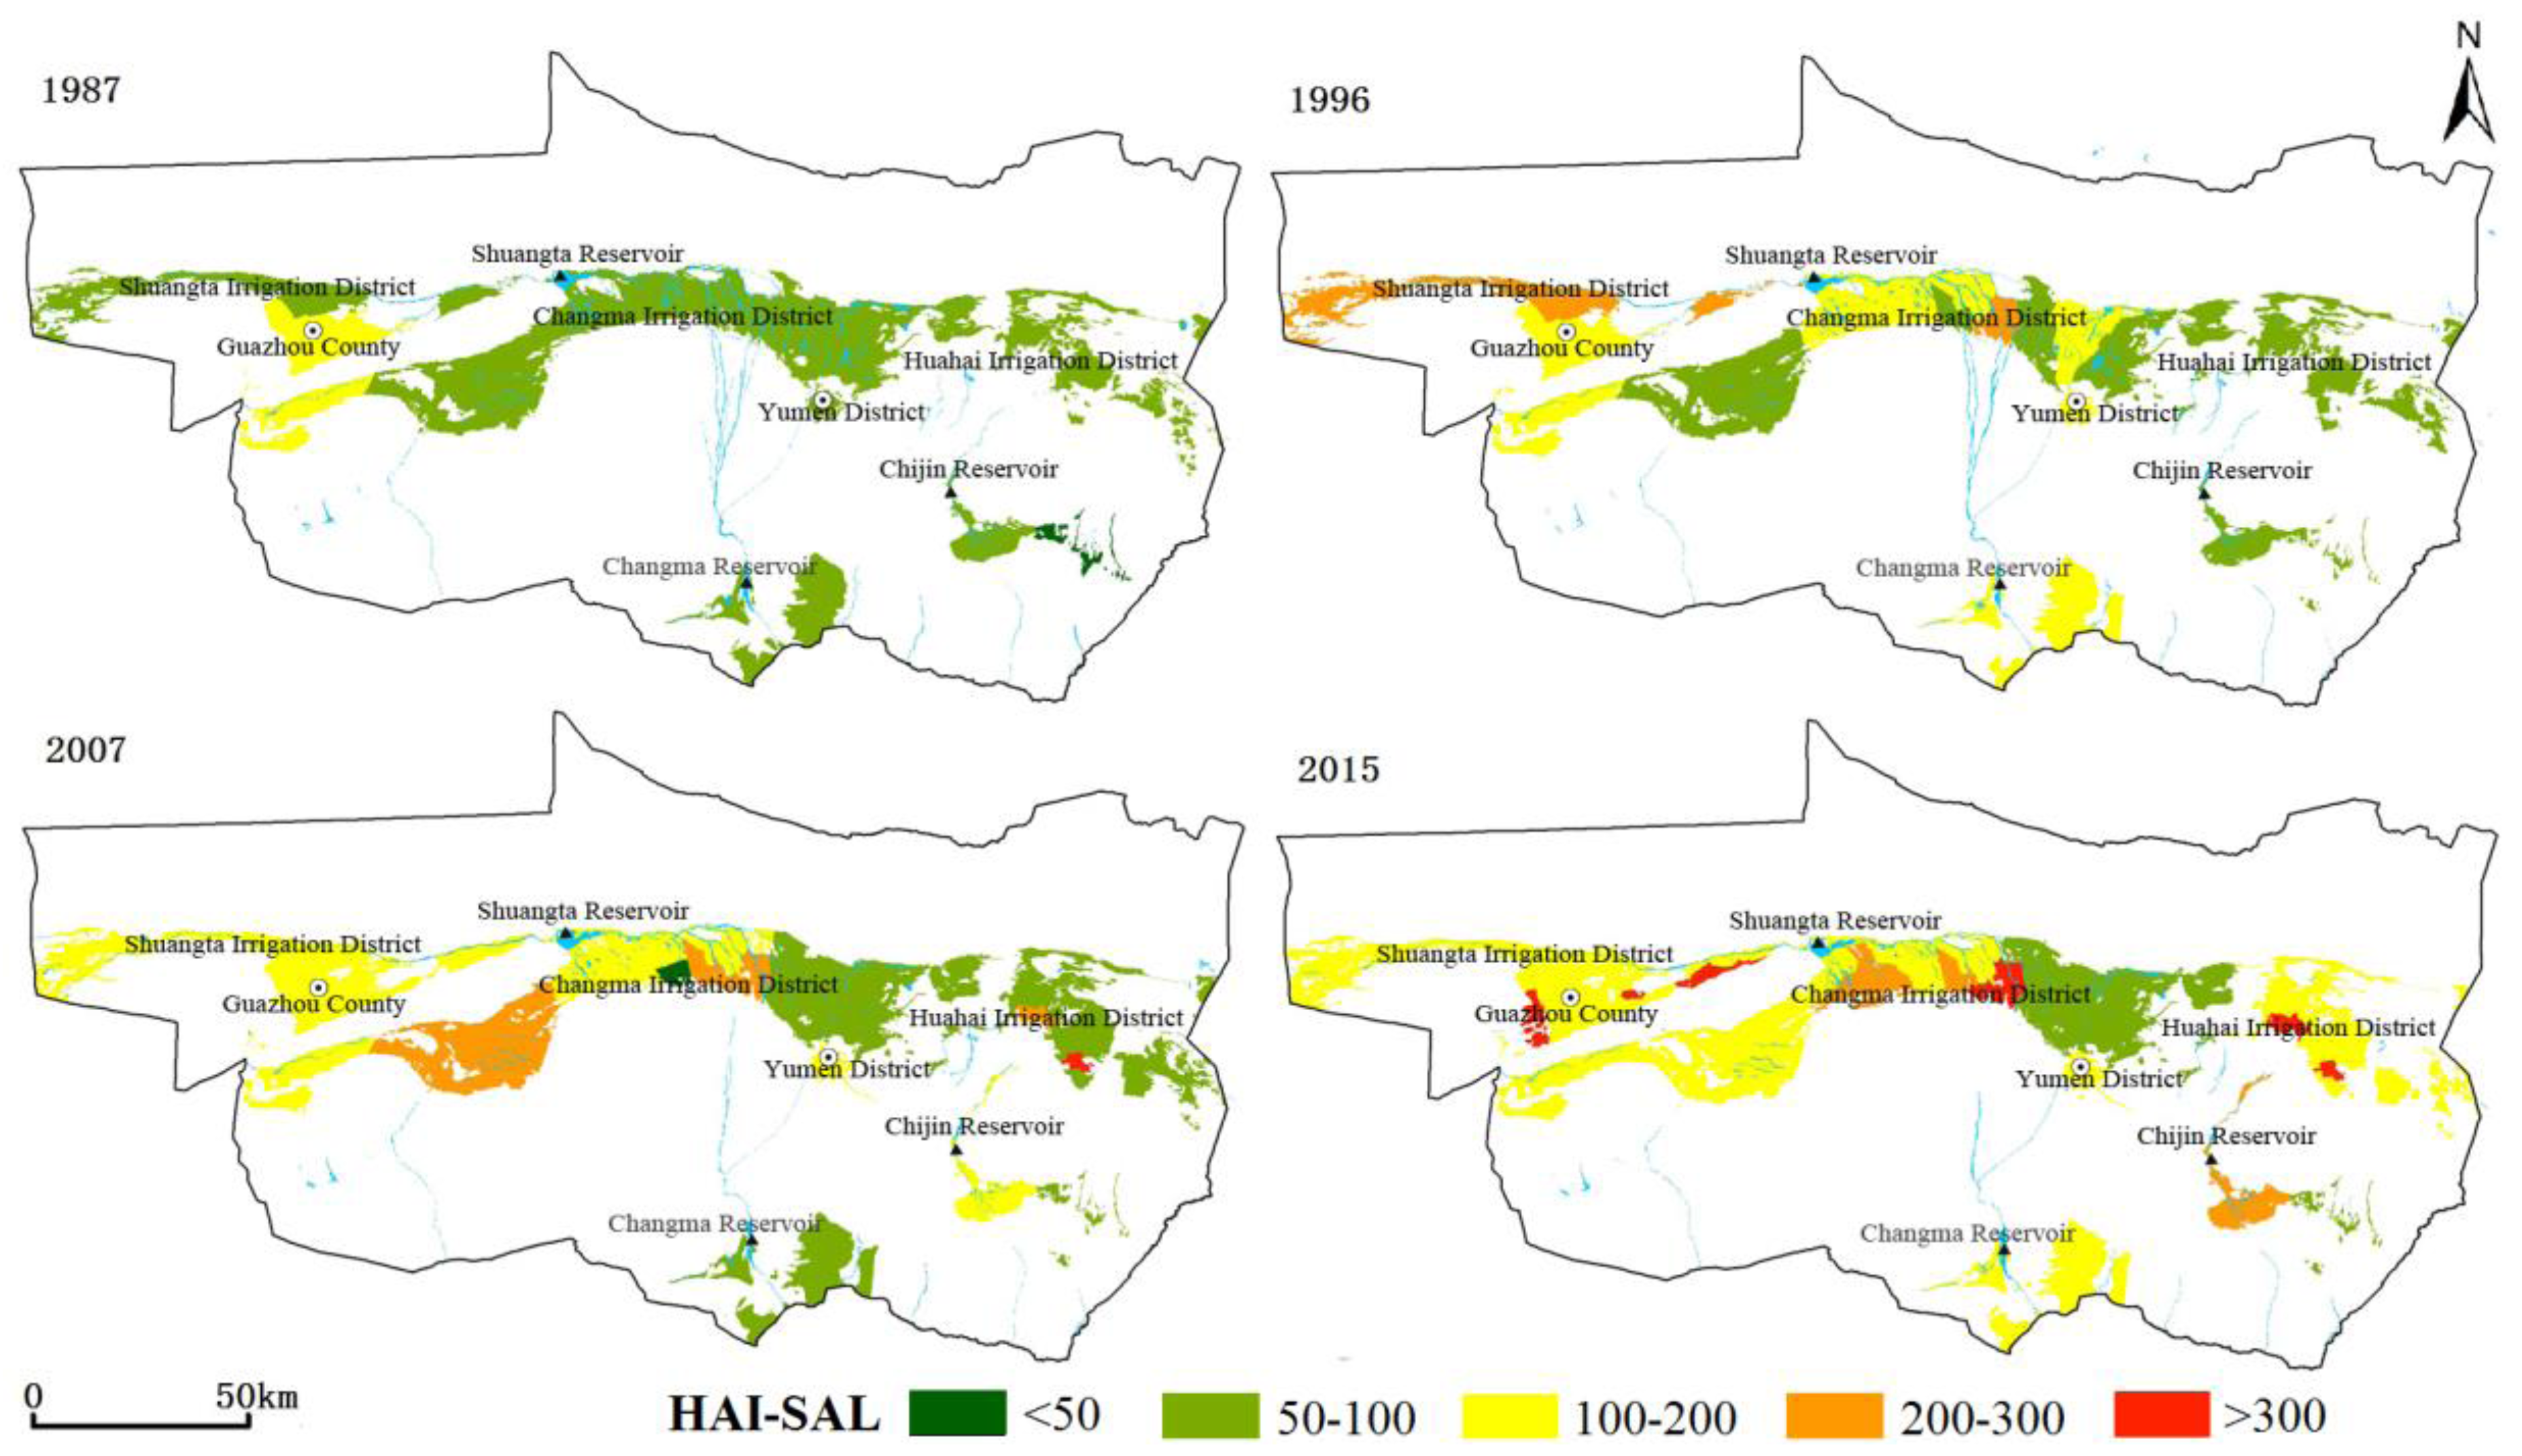
The HAL-SAL in the study region increased from 1987 to 2015. In 1987, the average intensity of semi-artificial land use was 71.29 sej/km2. Except Nancha Town and Guazhou Town in Shuangta irrigation district, all other areas showed relatively low HAL-SAL. From 1987 to 1996, the HAL-SAL increased very rapidly. The average intensity of semi-artificial land use increased to 125.76 sej/km2 (76.41%). From 1996 to 2007, the HAL-SAL still increased, but more slowly than in the previous period. Some towns even showed decreased intensity of semi-artificial land use. From 2007 to 2015, the HAL-SAL in three irrigation areas increased. A spatial distribution pattern of “high HAL-SAL in east and west regions and low HAL-SAL in middle region” was formed.
(5)
1996–2007 was a transition period for the land use intensity in the study region. A spatial distribution pattern of “high land use intensity in two of the three irrigation areas and low land use intensity in one irrigation area” was formed. The LUD and the HAL-AL increased significantly, while the HAL-SAL decreased. These trends were related to immigrant development and other national policies.
It should be pointed out that the spatio-temporal variation of land-use intensity is caused by socio-economic, policy, and technological factors. It is a multi-scale and multi-dimensional process with interaction between humans and land. Therefore, the selection of a multi-perspective in the construction of land-use intensity evaluation system reflects the multi dimensions and characteristics of land-use intensity. In addition, all land use types were considered, on which basis a more systematic assessment of the impact of different land use types and intensities on the ecological environment can be ensured. Still, much attention was paid to the use intensity of artificial land and semi-artificial land, so that we could analyze, in depth, the causes of land use changes and the influences of human activities.

Acknowledgments

This work was supported by the National Natural Science Foundation of China (Grant No. 41661105).

Author Contributions

Libang Ma and Wenjuan Cheng designed the study and processed the data. Jie Bo, Xiaoyang Li and Yuan Gu gave comments on the manuscript. All authors Contributed to the results, related discussions and manuscript writing.

Conflicts of Interest

The authors declare no conflict of interest.

References

  1. Braimoh, A.K.; Osaki, M. Land-use change and environmental sustainability. Sustain. Sci. 2010, 5, 5–7. [Google Scholar] [CrossRef]
  2. Blüthgen, N.; Dormann, C.F.; Prati, D.; Klaus, V.H.; Kleinebecker, T.; Hölzel, N.; Alt, F.; Boch, S.; Gockel, S.; Hemp, A.; et al. A quantitative index of land-use intensity in grasslands: Integrating mowing, grazing and fertilization. Basic. Appl. Ecol. 2012, 13, 207–220. [Google Scholar] [CrossRef]
  3. Lioubimtseva, E.; Henebry, G.M. Climate and environmental change in arid Central Asia: Impacts, vulnerability, and adaptations. J. Arid Environ. 2009, 73, 963–977. [Google Scholar] [CrossRef]
  4. Nd, T.B.; Lambin, E.F.; Reenberg, A. The emergence of land change science for global environmental change and sustainability. Proc. Natl. Acad. Sci. USA 2007, 104, 20666–20671. [Google Scholar]
  5. Reyers, B.; O’Farrell, P.J.; Cowling, R.M.; Egoh, B.N.; Le Maitre, D.C.; Vlok, J.D.C. Ecosystem services, land-cover change, and stakeholders: Finding a sustainable foothold for a semiarid biodiversity hotspot. Ecol. Soc. 2009, 14, 1698–1707. [Google Scholar] [CrossRef]
  6. Ruddiman, W.F. The anthropogenic greenhouse era began thousands of years ago. Clim Chang. 2003, 61, 261–293. [Google Scholar] [CrossRef]
  7. Vitousek, P.M.; Mooney, H.A.; Lubchenco, J.; Melillo, J.M. Human domination of Earth’s ecosystems. Science 1997, 277, 494–499. [Google Scholar] [CrossRef]
  8. Erb, K.; Niedertscheider, M.; Dietrich, J.P.; Schmitz, C.; Verburg, P.H.; Jepsen, M.R.; Haberl, H. Conceptual and empirical approaches to mapping and quantifying land use intensity. In Ester Boserup’s Legacy on Sustainability: Orientations for Contemporary Research; Springer: Dordrecht, The Netherlands, 2014; pp. 61–86. [Google Scholar]
  9. Sala, O.E.; Wall, D.H. Global biodiversity scenarios for the year 2100. Science 2000, 287, 1770–1774. [Google Scholar] [CrossRef] [PubMed]
  10. Burney, J.A.; Davis, S.J.; Lobell, D.B. Greenhouse gas mitigation by agricultural intensification. Proc. Natl. Acad. Sci. USA 2010, 107, 12052–12057. [Google Scholar] [CrossRef] [PubMed]
  11. Wang, G.J.; Liao, S.G. Spatial heterogeneity of land use intensity. Chin. J. Appl. Ecol. 2006, 17, 611–614. (In Chinese) [Google Scholar]
  12. Liiri, M.; Häsä, M.; Haimi, J.; Setälä, H. History of land-use intensity can modify the relationship between functional complexity of the soil fauna and soil ecosystem services—A microcosm study. Appl. Soil. Ecol. 2012, 55, 53–61. [Google Scholar] [CrossRef]
  13. Tardy, V.; Spor, E.; Mathieu, O.; Eque, J.L.E.; Terrat, S.E.; Plassart, P.; Regnier, T.; Bardgett, R.; Putten, W.H.V.D.; Roggero, P.P.; et al. Shifts in microbial diversity through land use intensity as drivers of carbon mineralization in soil. Soil. Biol. Biochem. 2015, 90, 204–213. [Google Scholar] [CrossRef]
  14. Li, Q.; Zhang, X.F.; Liu, Q.F.; Liu, Y.; Ding, Y.; Zhang, Q. Impact of land use intensity on ecosystem services: An example from the agro-pastoral ecotone of central inner mongolia. Sustainability 2017, 9, 1030. [Google Scholar] [CrossRef]
  15. Jiang, L.; Deng, X.Z.; Seto, K.C. The impact of urban expansion on agricultural land use intensity in China. Land Use Policy 2013, 35, 33–39. [Google Scholar] [CrossRef]
  16. Stone, G.D. Theory of the square chicken: Advances in agricultural intensification theory. Asia. Pac. Viewp. 2010, 42, 163–180. [Google Scholar] [CrossRef]
  17. Shriar, A.J. Determinants of agricultural intensity index “scores” in a frontier region: An analysis of data from northern Guatemala. Agr. Hum. Values 2005, 22, 395–410. [Google Scholar] [CrossRef]
  18. Václavík, T.; Lautenbach, S.; Kuemmerle, T.; Seppelt, R. Mapping global land system archetypes. Glob. Environ. Chang. 2013, 23, 1637–1647. [Google Scholar] [CrossRef]
  19. Kühling, I.; Broll, G.; Trautz, D. Spatio-temporal analysis of agricultural land-use intensity across the Western Siberian grain belt. Sci. Total Environ. 2016, 544, 271–280. [Google Scholar] [CrossRef] [PubMed]
  20. Petz, K.; Alkemade, R.; Bakkenes, M.; Schulp, C.J.E.; Velde, M.; Leemans, R. Mapping and modelling trade-offs and synergies between grazing intensity and ecosystem services in rangelands using global-scale datasets and models. Glob. Environ. Chang. 2014, 29, 223–234. [Google Scholar] [CrossRef]
  21. Wellmann, T.; Haase, D.; Knapp, S.; Salbach, C.; Selsam, P.; Lausch, A. Urban land use intensity assessment: The potential of spatio-temporal spectral traits with remote sensing. Ecol. Indic. 2018, 85, 190–203. [Google Scholar] [CrossRef]
  22. Sluis, T.V.D.; Pedroli, B.; Kristensen, S.P.; Cosor, G.L.; Pavlis, E. Changing land use intensity in Europe—Recent processes in selected case studies. Land Use Policy 2016, 57, 777–785. [Google Scholar] [CrossRef]
  23. Wang, F.H.; Antipova, A.; Porta, S. Street centrality and land use intensity in Baton Rouge, Louisiana. J. Transp. Geogr. 2011, 19, 285–293. [Google Scholar] [CrossRef] [Green Version]
  24. Pfestorf, H.; Weiß, L.; Müller, J.; Boch, S.; Socher, S.A.; Prati, D.; Schöning, I.; Weisser, W.; Fischer, M.; Jeltsch, F. Community mean traits as additional indicators to monitor effects of land-use intensity on grassland plant diversity. Perspect. Plant Ecol. 2013, 15, 1–11. [Google Scholar] [CrossRef]
  25. Ge, X.D.; Dong, K.K.; Luloff, A.E.; Wang, L.Y.; Xiao, J. Impact of land use intensity on sandy desertification: An evidence from Horqin Sandy Land, China. Ecol. Indic. 2016, 61, 346–358. [Google Scholar] [CrossRef]
  26. Dietrich, J.P.; Schmitz, C.; Müller, C.; Fader, M.; Lotze-Campen, H.; Popp, A. Measuring agricultural land-use intensity-a global analysis using a model-assisted approach. Ecol. Model. 2012, 232, 109–118. [Google Scholar] [CrossRef]
  27. Berner, D.; Marhan, S.; Keil, D.; Poll, C.; Schützenmeister, A.; Piepho, H.P.; Kandeler, E. Land-use intensity modifies spatial distribution and function of soil microorganisms in grasslands. Pedobiologia 2011, 54, 341–351. [Google Scholar] [CrossRef]
  28. Zhao, X.G.; Pan, Y.J.; Zhao, B.; He, R.F.; Liu, S.F.; Yang, X.Y.; Li, H.X. Temporal-spatial evolution of the relationship between resource-environment and economic development in China: A method based on decoupling. Prog. Geogr. 2011, 30, 456–463. (In Chinese) [Google Scholar]
  29. Yang, Y.T.; Shi, P.J.; Pan, J.H. Analysis of land use difference degree in arid inland river basin—Taking Zhangye, Ganzhou District as an example. J. Arid. Land. Resour. Environ. 2012, 26, 102–107. (In Chinese) [Google Scholar]
  30. Liu, G.S.; Wang, H.M.; Cheng, Y.X.; Zheng, B.; Lu, Z.L. The impact of rural out-migration on arable land use intensity: Evidence from mountain areas in Guangdong, China. Land Use Policy 2016, 59, 569–579. [Google Scholar] [CrossRef]
  31. Liu, J.Y.; Zhang, Z.X.; Xu, X.L.; Kuang, W.H.; Zhang, S.W.; Li, R.D.; Yan, C.Z.; Yu, D.S.; Wu, S.X.; Jiang, N. Spatial patterns and driving factors of land use change in China during the early 21st century. J. Geogr. Sci. 2010, 20, 483–494. [Google Scholar] [CrossRef]
  32. Wu, L.N.; Yang, S.T.; Liu, X.Y.; Luo, Y.; Zhou, X.; Zhao, H.G. Response analysis of land use change to the degree of human activities in Beiluo River basin since 1976. Acta. Geogr. Sin. 2014, 69, 54–63. (In Chinese) [Google Scholar]
  33. Liu, H.; Zhang, R.Q.; Hao, J.M.; Ai, D. Tupu analysis of land use intensity using semi-variance in Yinchuan Plain. Trans. Chin. Soc. Agric. Eng. (Trans. CSAE) 2012, 28, 225–231. [Google Scholar]
  34. Li, Y.F.; Liu, G.H. Characterizing Spatiotemporal Pattern of Land Use Change and Its Driving Force Based on GIS and Landscape Analysis Techniques in Tianjin during 2000–2015. Sustainability 2017, 9, 894. [Google Scholar] [CrossRef]
  35. Zhang, W.W.; Li, H. Characterizing and Assessing the Agricultural Land Use Intensity of the Beijing Mountainous Region. Sustainability 2016, 8, 1180. [Google Scholar] [CrossRef]
  36. Gong, J.Z.; Chen, W.L.; Liu, Y.S.; Wang, J.Y. The intensity change of urban development land: Implications for the city master plan of Guangzhou, China. Land Use Policy 2014, 40, 91–100. [Google Scholar] [CrossRef]
  37. Chang, G.Y.; Zhang, W.X. Ecological civilization-based rethinking of large-scale immigration and land development along Shule River. J. Lanzhou Univ. (Nat. Sci.) 2014, 50, 405–409. (In Chinese) [Google Scholar]
  38. Qi, J.H.; Niu, S.W.; Zhao, Y.F.; Liang, M.; Ma, L.B.; Ding, D. Responses of vegetation growth to climatic factors in Shule River Basin in northwest china: A panel analysis. Sustainability 2017, 9, 368. [Google Scholar] [CrossRef]
  39. Zhang, H.; Yi, S.Z.; Wu, Y.G. Decision Support System and Monitoring of Eco-Agriculture Based on WebGIS in Shule Basin. Energy Procedia 2012, 14, 382–386. [Google Scholar] [CrossRef]
  40. Huang, S.; Feng, Q.; Lu, Z.X.; Wen, X.H.; Deo, R.C. Trend Analysis of Water Poverty Index for Assessment of Water Stress and Water Management Polices: A case study in the Hexi Corridor, China. Sustainability 2017, 9, 756. [Google Scholar] [CrossRef]
  41. Chen, Y.Q.; Li, X.B. Structural change of agricultural land use intensity and its regional disparity in China. Acta. Geogr. Sin. 2009, 64, 469–478. (In Chinese) [Google Scholar] [CrossRef]
  42. Odum, H.T. Environmental Accounting-Emergy and Environmental Decision Making. Child Dev. 1996, 42, 1187–1201. [Google Scholar]
  43. Lan, S.F.; Qin, P.; Lu, H.F. Energy Analysis of Ecological-Economic System; Chemical Industry Press: Beijing, China, 2002. (In Chinese) [Google Scholar]
  44. Qi, J.H.; Niu, S.W.; Ma, L.B.; Wang, W.D. The characteristics and driving forces of LUCC in the middle and lower reaches of Shule River Basin. Chin. J. Ecol. 2014, 33, 2207–2220. (In Chinese) [Google Scholar]
  45. Ding, H.W.; Zhao, C.; Huang, X.H. Ecological environment and desertification in Shule River Basin. Arid. Zone. Res. 2001, 18, 5–10. (In Chinese) [Google Scholar]
  46. Verburg, P.H.; Crossman, N.; Ellis, E.C.; Heinimann, A.; Hostert, P.; Mertz, O.; Nagendra, H.; Sikor, T.; Erb, K.H.; Golubiewski, N.; et al. Land system science and sustainable development of the earth system: A global land project perspective. Anthropocene 2015, 12, 29–41. [Google Scholar] [CrossRef] [Green Version]
  47. Ellis, E.C.; Ramankutty, N. Putting people in the map: Anthropogenic Biomes of the World. Front. Ecol. Environ. 2008, 6, 439–447. [Google Scholar] [CrossRef]
  48. Tilman, D.; Balzer, C.; Hill, J.; Befort, B.L. Global food demand and the sustainable intensification of agriculture. Proc. Natl. Acad. Sci. USA 2011, 108, 20260–20264. [Google Scholar] [CrossRef] [PubMed]
  49. Long, H.L.; Heilig, G.K.; Li, X.B.; Zhang, M. Socio-economic development and land-use change: Analysis of rural housing land transition in the transect of the Yangtse river, China. Land Use Policy 2007, 24, 141–153. [Google Scholar] [CrossRef]
  50. Pan, J.H.; Su, Y.C.; Huang, Y.S.; Liu, X. Land use & landscape pattern change and its driving forces in Yumen City. Geogr. Res. 2012, 13, 1631–1639. (In Chinese) [Google Scholar]
  51. Zhang, B. Empirical study on the relationship between economic development and urban construction land in China: Based on the panel data of provinces. J. Anhui A 2014, 42, 3720–3723. [Google Scholar]
  52. Asselen, S.V.; Verburg, P.H. A land system representation for global assessments and land-use modeling. Glob. Chang. Biol. 2012, 18, 3125–3148. [Google Scholar] [CrossRef] [PubMed] [Green Version]
  53. Zhang, B.L.; Yang, Q.Y.; Lu, C.Y.; Sun, P.L.; Zong, H.M. Effect on economic development of regional land use change in different development phase: Forty counties in Chongqing as the research object. Econ. Geogr. 2011, 31, 1539–1544. (In Chinese) [Google Scholar]
  54. Zhou, Q.; Huang, X.J.; Pu, L.J.; Li, X.W.; Zhou, F. Intensity and mechanism in change of regional agricultural land use-a case study of former Xishan City of Wuxi City. Resour. Environ. Yangtze Basin 2003, 12, 535–540. (In Chinese) [Google Scholar]
  55. Zhu, H.Y.; Li, X.B.; Xin, L.J. Intensity change in cultivated land use in China and its policy implications. J. Nat. Resour. 2007, 22, 907–915. [Google Scholar]
  56. Chen, H.B.; Shao, L.Q.; Zhao, M.J.; Zhang, X.; Zhang, D.J. Grassland conservation programs, vegetation rehabilitation and spatial dependency in Inner Mongolia, China. Land Use Policy 2017, 64, 429–439. [Google Scholar] [CrossRef]
  57. Ji, Y.P. Study on the development and protection of water resources in Shule River Basin. Environ. Stud. Monit. 2016, 3, 53–61. (In Chinese) [Google Scholar]
  58. Sun, T.; Pan, S.B.; Li, J.R.; Den, H.Y. Analysis on the exploitation of water and land resources and its environmental effects in the Shule River Watershed. Arid. Zone. Res. 2004, 21, 313–317. [Google Scholar]
  59. Huang, S.; Zhou, L.H.; Chen, Y.; Lu, H.L. Impacts of polices on eco-environment of Minqin County during the past 60 years. J. Arid Land Resour. Environ. 2014, 28, 73–78. (In Chinese) [Google Scholar]
  60. Lu, D.D.; Liu, W.D. Analysis of Geo-factors behind regional development and regional policy in China. Sci. Geogr. Sin. 2000, 20, 487–493. (In Chinese) [Google Scholar]
  61. Zhao, M.M.; Zhou, L.H.; Chen, Y.; Zhang, J.S.; Guo, X.L.; Wang, R. The influence of ecological policies on changes of land use and ecosystem service value in Hangjinqi, Inner Mongolia, China. J. Desert. Res. 2016, 36, 842–850. (In Chinese) [Google Scholar]
  62. Gan, C.H.; Ma, L.; Nan, Q.J. Spatio-temporal characteristics and driving force of land-use change in Beijing’s ecological environs—A case study of Weichang County, Hebei Province. Chin. J. Eco-Agric. 2007, 15, 165–170. (In Chinese) [Google Scholar]
  63. Spalding, A.K. Exploring the evolution of land tenure and land use change in Panama: Linking land policy with development outcomes. Land Use Policy 2017, 61, 543–552. [Google Scholar] [CrossRef]
  64. Wei, H. Analyze the influence of increases of population and progress of agro-technology on farmland utilization & environment. Ecol. Econ. 2011, 5, 108–112. (In Chinese) [Google Scholar]
  65. Chen, Y.Q.; Li, X.B.; Tian, Y.J.; Tan, M.H. Structural change of agricultural land use intensity and its regional disparity in China. J. Geogr. Sci. 2009, 19, 545–556. [Google Scholar] [CrossRef]
  66. Long, D.P.; Li, T.S.; Miao, Y.Y.; Yu, Z.S. The spatial distribution and types of the development level of Chinese agricultural modernization. Acta. Geogr. Sin. 2014, 69, 213–226. (In Chinese) [Google Scholar]
Figure 1. Survey map of the study region.
Sustainability 10 00771 g001
Figure 2. Spatial distribution of different land types in the middle and lower reaches of the Shule River Basin (1987–2015).
Sustainability 10 00771 g002
Figure 3. Temporal variation of LUD in the middle and lower reaches of the Shule River (1987–2015).
Sustainability 10 00771 g003
Figure 4. Spatial distribution of LUD in the middle and lower reaches of the Shule River Basin (1987–2015).
Sustainability 10 00771 g004
Figure 5. Spatial distribution of HAL-AL in the middle and lower reaches of the Shule River Basin (1987–2015).
Sustainability 10 00771 g005
Figure 6. Spatial distribution of HAL-SAL in the middle and lower reaches of the Shule River Basin (1987–2015).
Sustainability 10 00771 g006
Table 1. The classification values of land use degree.
Land Use TypeSelf-Use LandReclaimed LandNon-Renewable Land
Land typeSemi-natural land (woodland, grassland, wetland)Semi-artificial land (cultivated land)Artificial land (urban construction land)
Grading index123
Table 2. Area and proportion of land type in the middle and lower reaches of the Shule River Basin (1987–2015).
Land Types1987199620072015
Natural landArea (km2)22768.3822801.2222402.2422219.2
Proportion (%)83.8383.9582.4881.81
Semi-natural landArea (km2)3429.693287.943060.242911.12
Proportion (%)12.6312.1111.2710.72
Semi-artificial landArea (km2)902.51001.111594.711880.47
Proportion (%)3.323.695.876.92
Artificial landArea (km2)59.6770.18103.03149.43
Proportion (%)0.220.260.380.55
Table 3. Temporal variation of HAL-AL and HAL-SAL in the middle and lower reaches of the Shule River Basin (1987–2015).
TownHAI-AL (Bi)HAI-SAL (Pi- × 1015)
19871996200720151987199620072015
Yumen Town0.2500.2500.2500.25092.53123.23172.61151.80
Chijin Town0.1790.1230.2140.22250.5073.42135.42221.07
Huahai Town0.2070.0960.1850.21266.6989.4383.74165.16
Liuhe Town0.1640.1340.2820.23257.5696.8693.2380.53
Xiaxihao Town0.1330.0890.1330.12958.0180.6052.6553.02
Huangzhawan Town0.1650.1220.2370.23762.06108.2090.5679.72
Changma Town0.2500.1210.2500.22762.42113.1191.36133.40
Qingquan Town0.1200.0710.1220.11948.9690.6497.4395.84
Liuhu Town 0.4610.472 237.81631.04
Xiaojinwan Town 0.5580.562 333.90348.14
Sandaogou Town0.2530.1750.3140.38098.45228.04296.85343.84
Nancha Town0.1310.0840.1120.127101.45170.69134.58188.53
Suoyang Town0.0660.0570.1040.14751.4588.94261.74148.41
Guazhou Town0.1530.1190.2550.286110.70145.61110.83120.43
Xihu Town0.0740.0560.0620.06855.89217.23112.79122.41
Yaozhanzi Town 0.3760.3940.412 85.53282.01204.81
Hedong Town0.2360.1480.2830.30383.95161.25153.99170.25
Bulongji Town0.1290.0880.1490.14168.78139.41108.4107.21
Shuangta Town 0.3770.300 235.54
Shahe Town 0.5120.493 99.07
Guangzhi Town 0.416 535.84
Qidun Town 0.5420.325 191.45
Lianghu Town 0.374 437.26

