Article

Profiling Human-Induced Vegetation Change in the Horqin Sandy Land of China Using Time Series Datasets

1
Key Laboratory for Geographical Process Analysis & Simulation of Hubei Province, Wuhan 430079, China
2
College of Urban and Environmental Sciences, Central China Normal University, Wuhan 430079, China
3
Key Laboratory of Ecosystem Network Observation and Modeling, Institute of Geographic Sciences and Natural Resources Research, Chinese Academy of Sciences, Beijing 100101, China
*
Author to whom correspondence should be addressed.
Sustainability 2018, 10(4), 1068; https://doi.org/10.3390/su10041068
Submission received: 8 February 2018 / Revised: 30 March 2018 / Accepted: 2 April 2018 / Published: 4 April 2018

Abstract

:
Discriminating the significant human-induced vegetation changes over the past 15 years could help local governments review the effects of eco-programs and develop sustainable land use policies in arid/semi-arid ecosystems. We used the residual trends method (RESTREND) to estimate the human-induced and climate-induced vegetation changes. Two typical regions in the Horqin Sandy Land of China were selected as study areas. We first detected vegetation dynamics between 2000–2014 using Sen’s slope estimation and the Mann–Kendall test detection method (SMK) based on the Moderate Resolution Imaging Spectroradiometer (MODIS) normalized difference vegetation index (NDVI) time series, then used RESTREND to profile human modifications in areas of significant vegetation change. RESTREND was optimized using statistical and trajectory analysis to automatically identify flexible spatially homogeneous neighborhoods, which were essential for determining the reference areas. The results indicated the following. (1) Obvious vegetation increases happened in both regions, but Naiman (64.1%) increased more than Ar Horqin (16.8%). (2) Climate and human drivers both contributed to significant changes. The two factors contributed equally to vegetation change in Ar Horqin, while human drivers contributed more in Naiman. (3) Human factors had a stronger influence on ecosystems, and were more responsible for vegetation decreases in both regions. Further evidences showed that the primary human drivers varied in regions. Grassland eco-management was the key driver in Ar Horqin, while farming was the key factor for vegetation change in Naiman.

1. Introduction

Discriminating between the driving forces of vegetation change is necessary in order to understand the interacting mechanisms between ecosystems and external drivers, and help environmental managers make effective decisions that maintain the sustainable development of ecosystems [1,2]. Complex external driving forces influence the processes of vegetation change, of which climate change and human activities are two main factors within decadal time scales [3,4,5]. Climate variations, such as increases or decrease in precipitation and temperature would result in a corresponding trend of greening and browning in vegetation cover [3,5,6]. Various human activities may also influence the vegetation growth by controlling or modifying ecosystem composition and distribution [3]. Worldwide, urbanization usually causes local vegetation to decrease [7,8,9], while eco-managements such as encouraging afforestation, grazing prohibition, and rest-rotation grazing usually cause vegetation cover to increase [5,10]. Even the price fluctuation of grain and beef in the market would cause vegetation change by influencing farmers’ choices of cultivation regimes [4]. On a scale of decades, human activities may have more deep and dramatic influences on vegetation growth than climate variations [11]. The complicated interaction between human and vegetation is critical for almost all of the research studies that have been done about earth system models [12]. Discriminating human-induced vegetation change has always been a challenging issue [1,13,14], even considering the long-term perspective of palaeoecology [15,16].
Arid/semi-arid ecosystems are fragile and extremely sensitive to external interference [17,18]. Inadvertent human mismanagement, such as overgrazing, over farming, and deforestation may result in irreversible catastrophic changes for arid ecosystems. Discriminating human-induced vegetation change in a quantitative way is essential for managing worldwide arid and semi-arid ecosystems [1,19]. The Horqin Sandy Land of China is a typical semi-arid ecosystem, with a transitional zone between semi-pastoral areas and pastoral areas. Following serious degradation over recent decades, the Chinese government has carried out several grassland conservation programs (eco-programs) in this region. Profiling human-induced vegetation change in the Horqin Sandy Land is important for understanding human influences on vegetation in arid/semi-arid China, and evaluating the effects of the eco-programs.
Remote sensing technology is commonly used to monitor vegetation change on a large scale [13]. The normalized difference vegetation index (NDVI) that is obtained from remote sensing products is very sensitive to arid/semi-arid vegetation variations [20], and is usually used to monitor arid/semi-arid vegetation change [21,22]. Furthermore, the coupling analysis of time series NDVI and climate datasets could help identify the impact of human activities [1,13,23,24,25,26,27,28,29].
A previous study reviewed five quantitative methods to identify human-induced vegetation changes [23], i.e., model analysis, mathematical statistics, framework analysis, index assessment, and difference comparison, within which the difference comparison method (DC) stood out and commonly was used [23]. Rain-use efficiency (RUE) [24,25,26] and the residual trends method (RESTREND) [3,13,27,28] are two of the most effective DC methods that have been used successfully in arid and semi-arid ecosystems, and RESTREND has proved more robust than RUE [23,28,29].
Based on the assumption that climate, i.e., rainfall, is the only driver of vegetation change, the standard RESTREND [1,29] first used the NDVI as an indicator to construct regression models with rainfall, then analyzed the trend of residuals on a per pixel basis to discriminate the human-induced vegetation changes. However, Evans and Geerken (2004) then proposed that standard RESTREND would measure degeneration inaccurately, because the potential rainfall–vegetation relationships and trend analyses were all based on the same time series, which may itself contain uncertain levels of degeneration [1,30,31]. It was necessary to improve the standard RESTREND by establishing a “no change reference” to simulate the potential relationship between rainfall and vegetation.
Establishing an accurate potential vegetation–climate relationship is essential for improving RESTREND. A pixel-level vegetation–climate regression model based on a historical no change reference period, or a no change reference area in the homogeneous spatial neighborhood of the specific pixel, are two alternative strategies. However, the finite temporal accumulation of satellite datasets limits the time that can be used to define a historical no change/less change reference period. The potential vegetation–climate regression model is commonly built based on a no change area in the homogeneous spatial neighborhood [27,32]. The no change area, i.e., area without influence from human activity, refers to the maximum NDVI or net primary productivity (NPP) in the homogeneous spatial neighborhood. The homogeneous spatial neighborhood, within which vegetation has similar growth characteristics, could be determined in the following two ways [31,32,33].
A predetermined window, such as a 5 km × 5 km [33] or a 7 km × 7 km neighborhood [31] is usually suggested to define the homogeneous spatial neighborhood. However, defining a suitable size of window is a subjective task, and it needs accurate and comprehensive field investigations in order to make a suitable decision, which is a time-consuming, laborious, and regional-dependent task. Furthermore, heterogeneous vegetation patterns usually exist within a regular and limited distance, which weakens the applicability of this strategy. An irregular homogeneous neighborhood is a better choice. Prince [32] used a land capability class map, which was defined by a k-prototypes clustering technique using maps of rainfall, soils, and land use, to obtain a homogeneous spatial neighborhood. However, this method still faces two obvious problems. (1) It is hard to control the number of classes in the k-prototypes clustering algorithm, which results in uncertainty in land capability classes. (2) The type of land use within a time series might change from year to year, so it is not reasonable to use a stationary land use map to define a homogeneous area. However, it is difficult to obtain a land use map each year to update the land capability class map.
To overcome the problems of these two methods, this paper optimized the strategy of determining homogeneous spatial neighborhoods in RESTREND by statistical analysis and trajectory analysis to automatically define flexible spatially homogeneous neighborhoods. Based on this, we first used a trend analysis method to find significant vegetation change from 2000 to 2014 in the study areas, and then used the optimized RESTREND in areas with significant changes to identify significant human-induced changes during the past 15 years. By choosing two typical regions in Horqin Sandy Land as study areas, this paper aimed to discover different human–climate–vegetation change mechanisms in arid and semi-arid ecosystems with different levels of human influence.

2. Materials and Methods
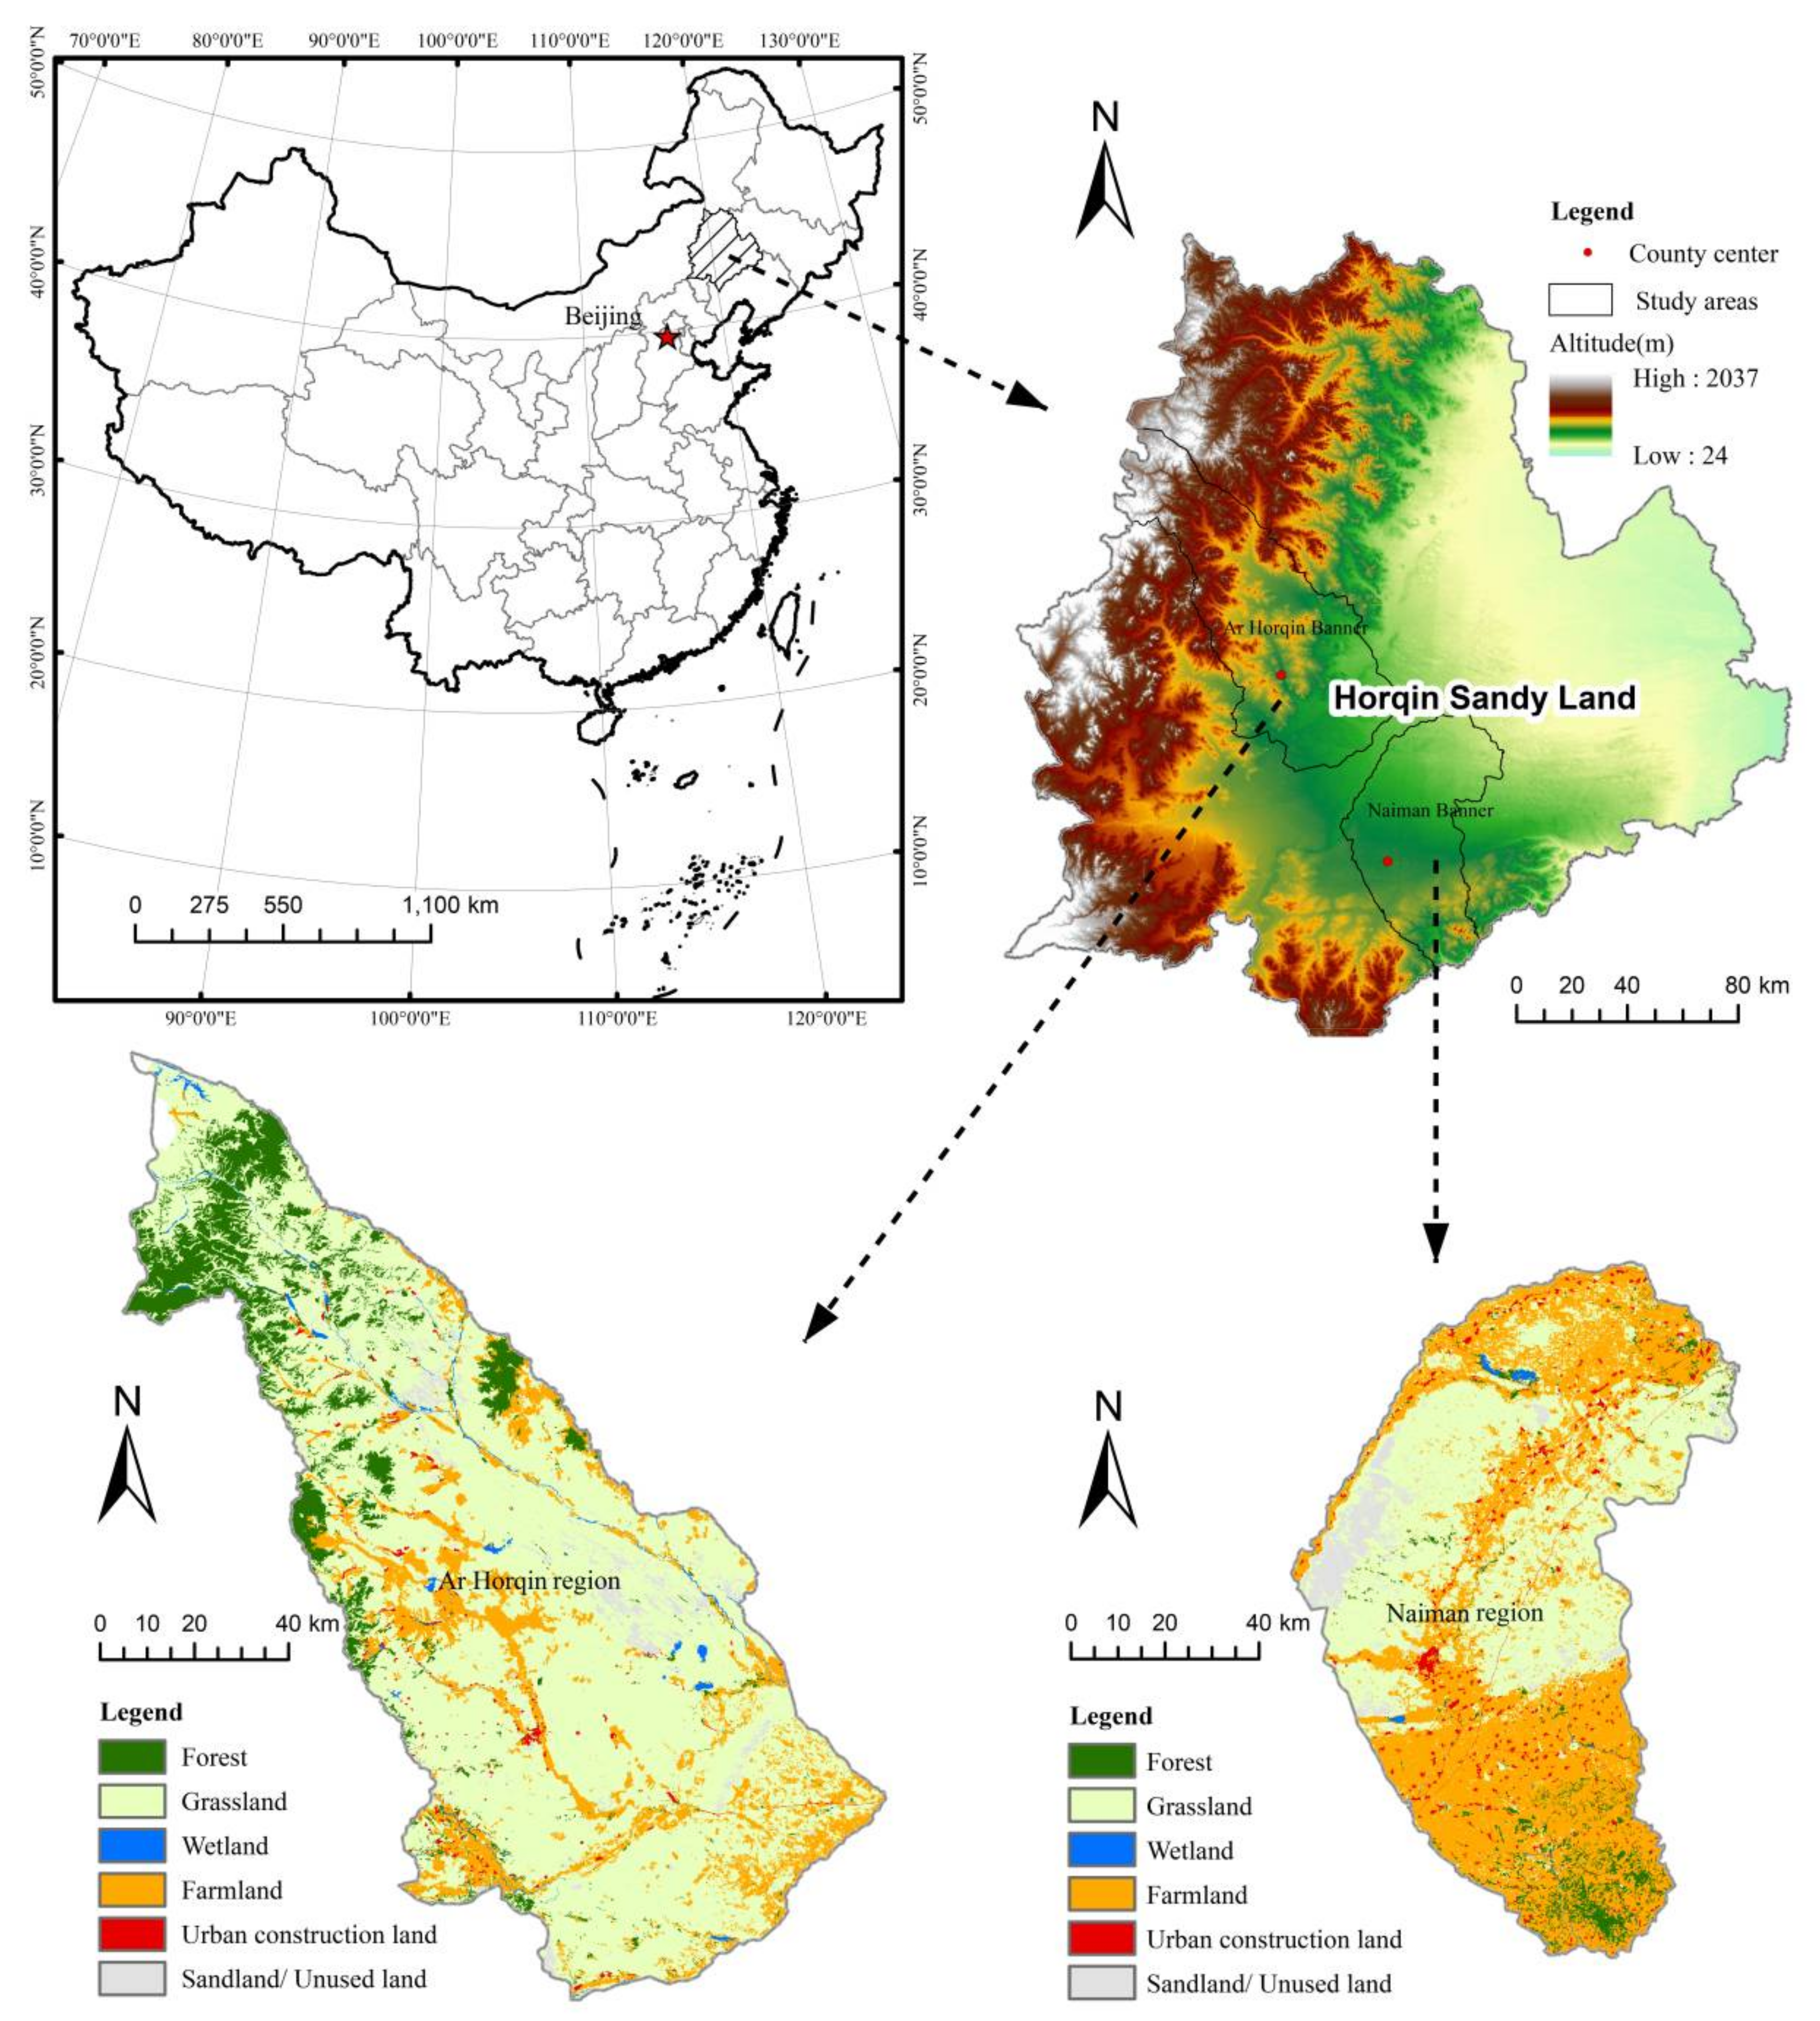
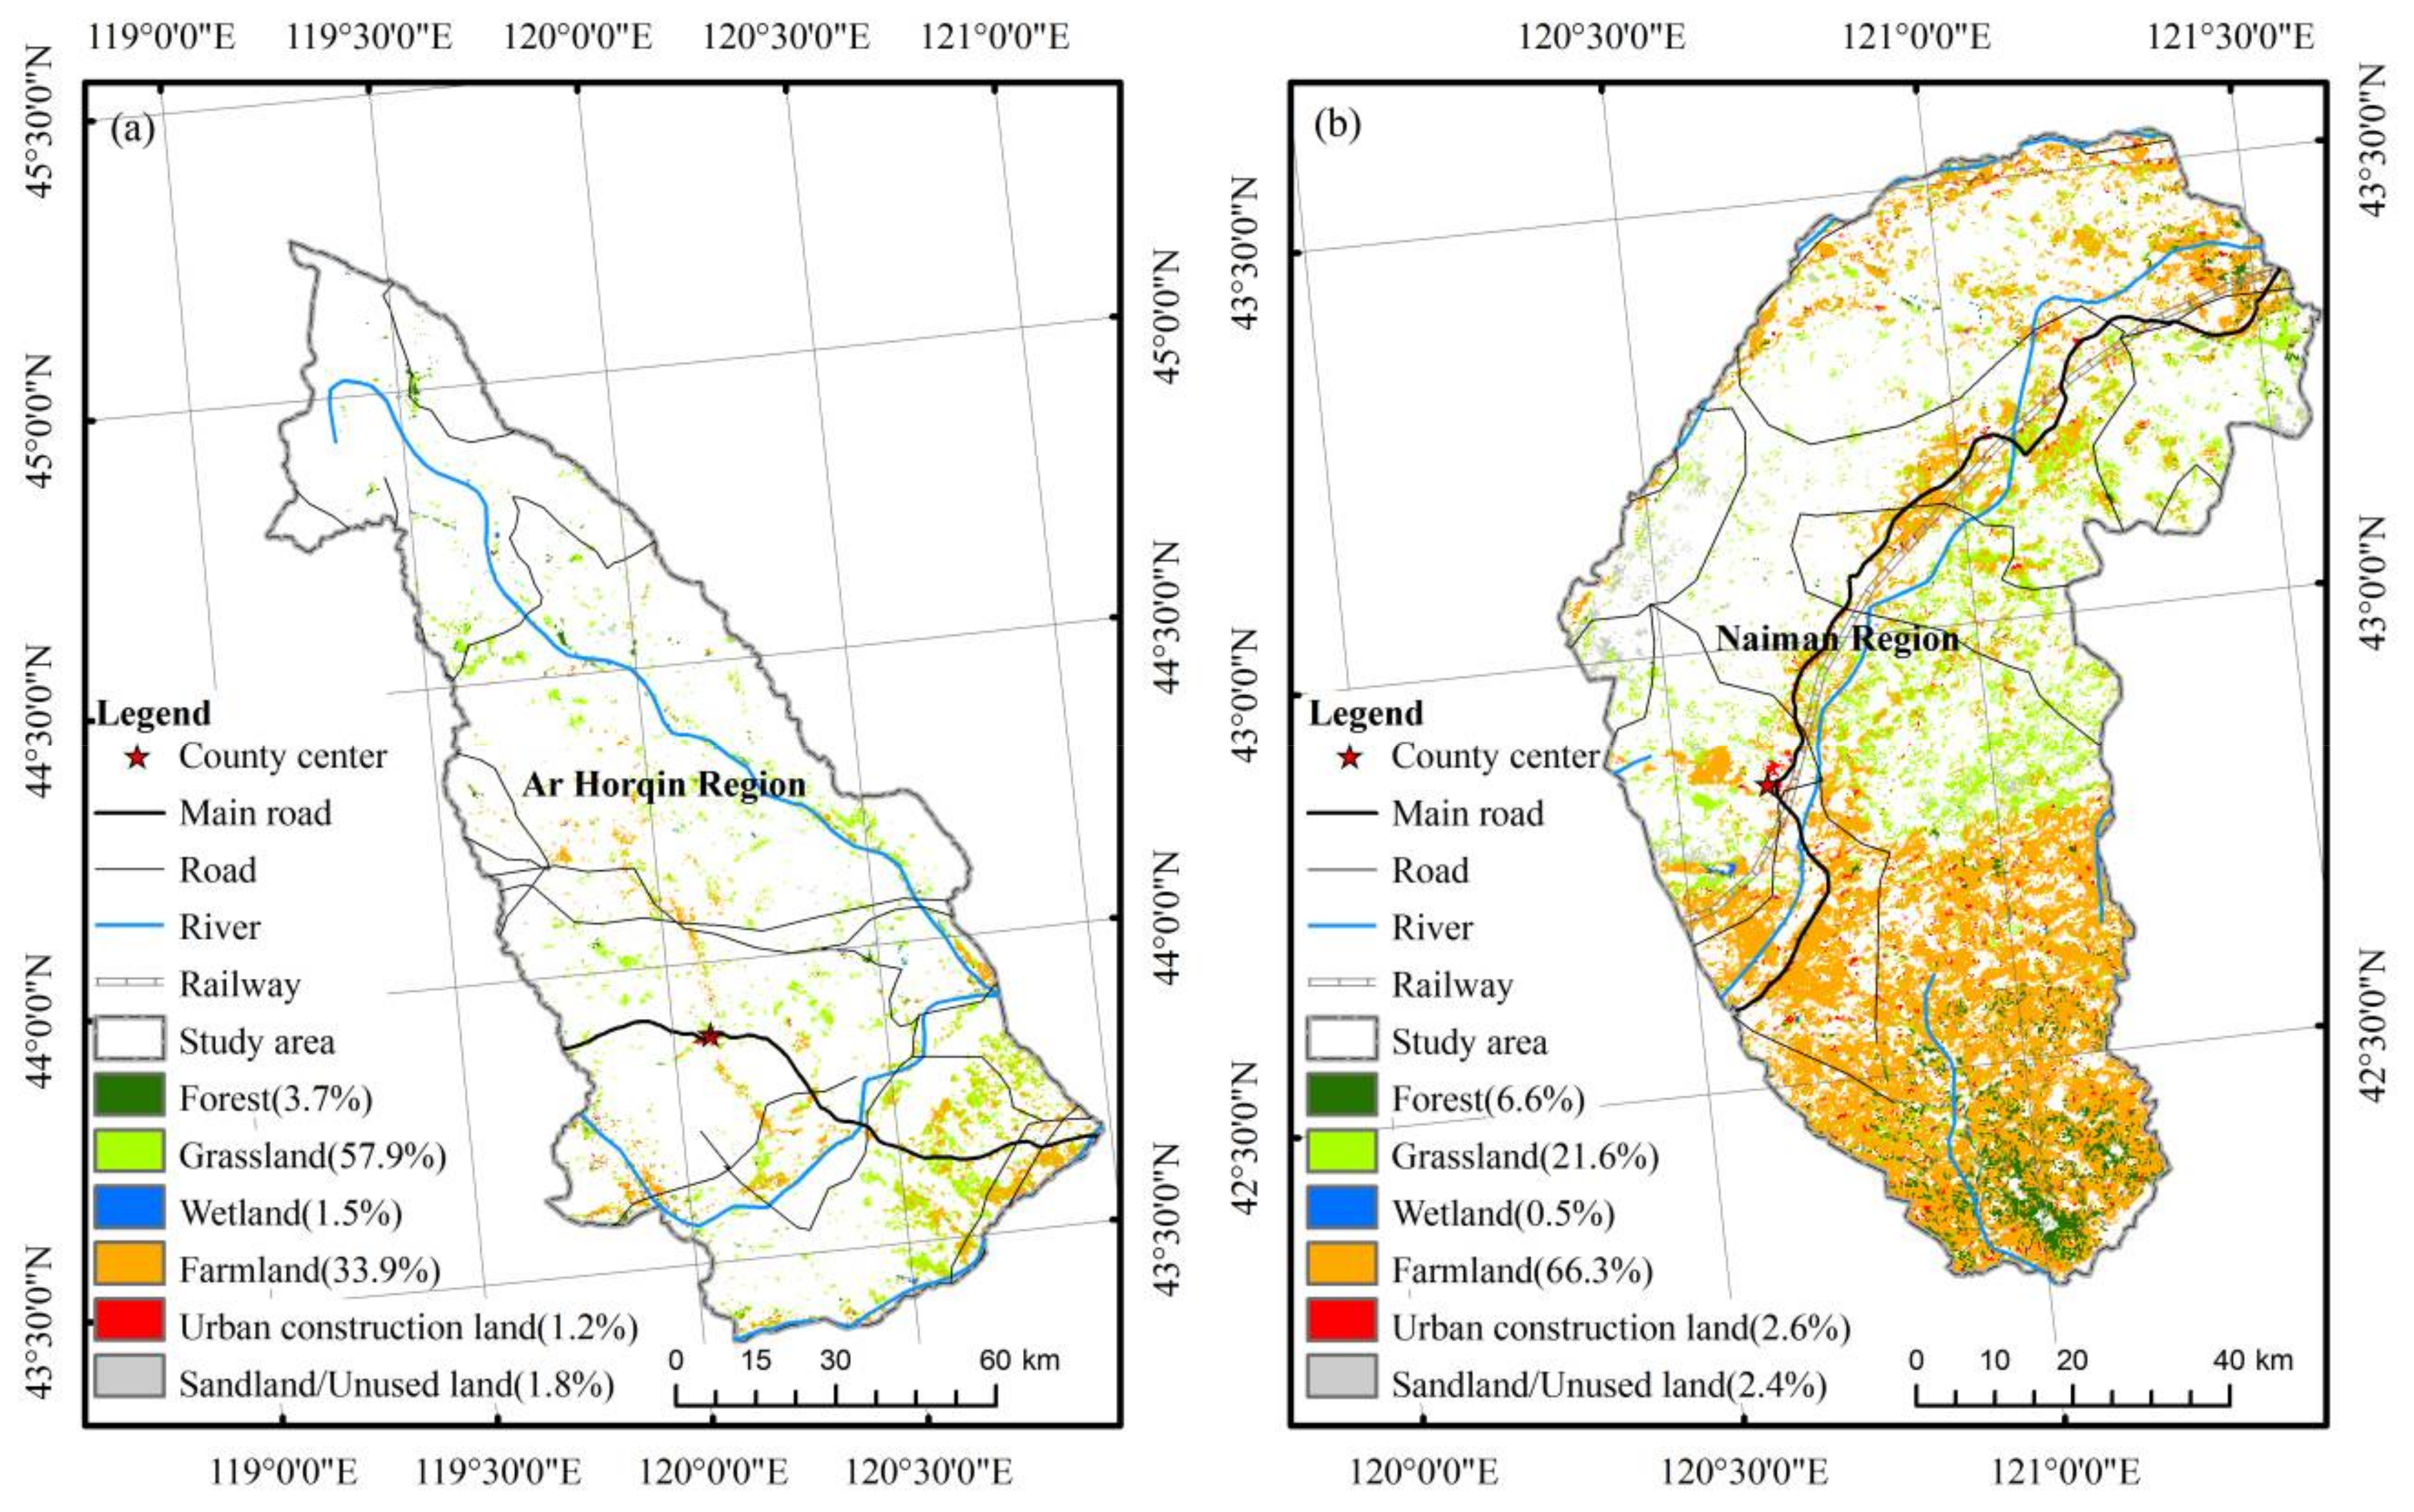
2.1. Study Area

The Horqin Sandy Land spans from 41°41′ N to 46°12′ N latitude and 117°49′ E to 123°42′ E longitude, and is located in the southeast of the Inner Mongolian Autonomous Region of China (Figure 1). It is a typical transitional zone between the Inner Mongolian Plateau and the Northeast China Plain, with a temperate sub-humid and semi-arid monsoon climate [11]. The annual precipitation varies between 340–450 mm. The annual average temperature is about 5.8–6.4 °C, and the annual average wind velocity is up to 3.5–4.5 m/s. The landscape of this area is mainly consisted of sand dunes alternating with gently undulating meadows. The soil of this area is sandy, light, loose, and especially susceptible to wind erosion. The Horqin Sandy Land is a typical transitional zone between semi-pastoral areas located in the south of the study area, and pastoral areas located in the north of the study area.
We used two regions, i.e., Ar Horqin and Naiman, with different levels of human influence in the Horqin Sandy Land as our study areas to discover different human–climate–vegetation change mechanisms. The Ar Horqin region is a typical pastoral area that is in the northwest of the Horqin Sandy Land, with 71.0% of the land covered by grassland. The Naiman region is in the southeast of the Horqin Sandy Land. It is a typical agricultural area with the majority (46.5%) covered by farmland (Figure 1). Traditionally, people in the pastoral area prefer to feed sheep and cows for a living, while people in the semi-pastoral area live on farming. According to the Inner Mongolia Statistics Bureau in 2013, the population density in Naiman is 53 people/km2, which is much more than in Ar Horqin (21 people/km2). It is believed that human activities in Naiman are much more intense than in Ar Horqin. Over the past two decades, the ecosystems in these two regions have changed markedly because of frequent human activities [34,35,36,37]. The Chinese government has implemented several region-wide programs in the two locations; e.g., the West Development Strategies (introduced in 1999) and the Grain for Green Program (introduced in 1999). The former strategy promotes economic development in western China, and the latter encourages farmers to tree plant in order to restore local ecological environment. Additionally, three grassland conservation programs have also been implemented in the study areas. The Beijing–Tianjin Sandstorm Source Controlling Program (introduced in 2001) and the Ecological Subsidy and Award System (introduced in 2011) were also implemented in the Ar Horqin region. The Grazing Withdrawal Program (introduced in 2003) and the Ecological Subsidy and Award System (introduced in 2011) were implemented in Naiman [38]. Discriminating the significant human-induced vegetation changes over the last 15 years could help local governments review the effects of the eco-programs and develop sustainable land use policies in the future.

2.2. Data and Data Preprocessing
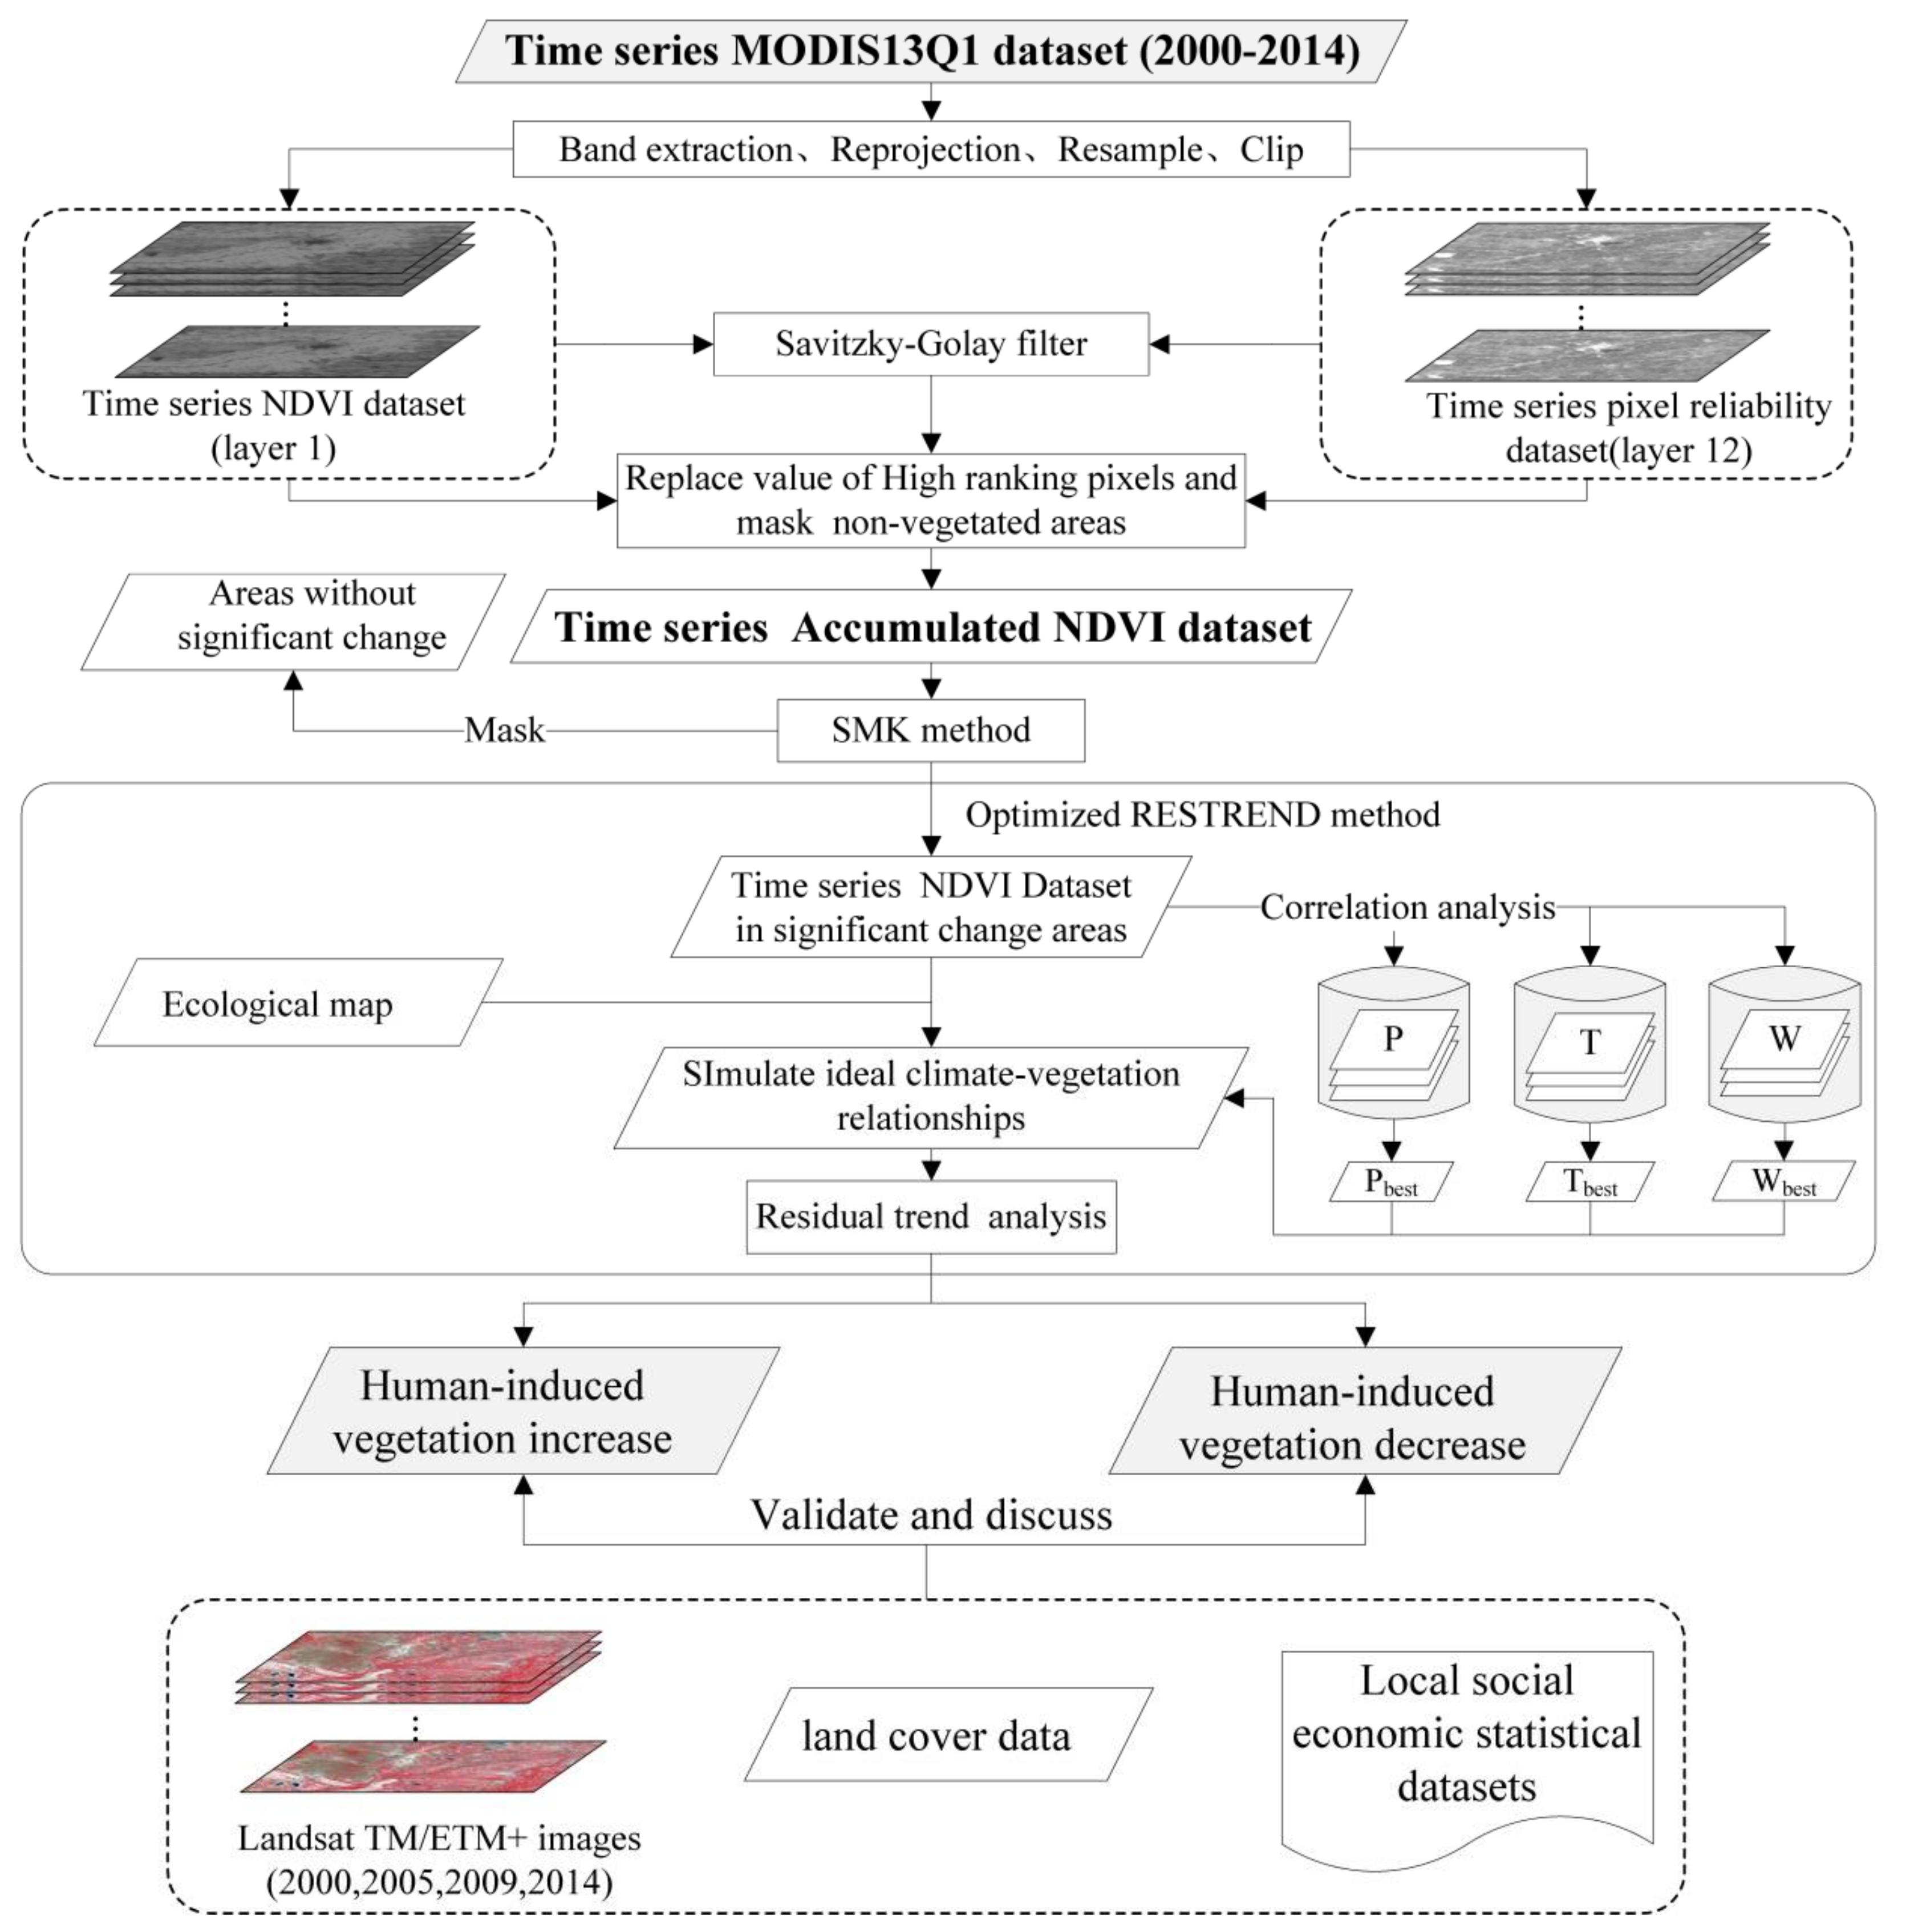
This study selected NDVI as the original data, because the index is very sensitive to different vegetation covers in arid/semi-arid areas. It has a strong capability for monitoring vegetation changes, land cover classifications, and the change analysis of land cover in arid and semi-arid areas [21,22,39]. The NDVI, which is a proxy for NPP, is the most commonly used indicator in RESTREND [1,40,41,42]. Time series Moderate Resolution Imaging Spectroradiometer (MODIS) 13Q1 NDVI datasets were downloaded from the MODIS website (http://modis.gsfc.nasa.gov/). The datasets covers 342 images from 2000 to 2014 with the same temporal resolution (16 days) and spatial resolution (250 m). The original dataset had a hierarchical data format, within which the layer 1 and the layer 12 reflected the NDVI value and the reliability and quality of the data for each pixel, respectively.
We first removed noise from clipped and re-projected NDVI datasets using a Savitzky–Golay filter [43]. Then, we replaced high ranking pixels (i.e., ranking 0 or 1) with the original pixel value [44] and masked non-vegetated areas (e.g., deserts, water bodies, and other areas with mean annual NDVI <0.1) [45]. Here, we changed the NDVI values of high-ranking pixels, because these two types of pixels were confirmed as high reliability pixels. In layer 12 of dataset, a high ranking of ‘0′ for pixels indicates high quality. The ranking of ‘1′ indicates that their value was useful and could be used with reference to other QA information. Finally, the time series NDVI trajectory, i.e., the annual accumulated NDVIs (AA-NDVIs), was aggregated from Julian day 145 to Julian day 273 in the growing season of each year. The time series N D V I dataset was then produced so that the impact of frequent and strong interannual variations could be reduced.
Although the standard RESTREND only used rainfall as the climate factor, many studies suggest that other climate factors such as temperature might be key controls on vegetation growth in some regions [19]. Therefore, it was necessary to determine the principal climate factors and the suitable climate variables to build the climate–vegetation model [33,46,47]. In this paper, precipitation, temperature, and wind speed were selected as three representative climate factors to pre-analyze the best climate factors to use in the study area. Datasets for monthly average precipitation (P), monthly average temperature (T), and monthly maximum wind speed (W) were produced based on time series data (2000–2014) from 46 stations acquired from the website of the China Meteorological Data Service Center (http://data.cma.cn/). Due to the lag effect of vegetation growth, 45 indices (Table 1) with different temporal combinations were calculated for each meteorological dataset (P/T/W); then, the indices in each station were interpolated by the inverse distance weighting method to obtain 135 climate raster grids with the same resolution as the NDVI dataset.
The 1:1,000,000 ecological map for Inner Mongolia, produced by the Chinese Academy of Sciences (2001), was used to identify ecological zones. An ecological zone is determined by the climate, soil, landform, and vegetation. The combination of land cover types in an ecological zone is unique, and the same land cover type in an ecological zone indicates a similar combination of plants and their growing processes.
A Level 1 Terrain-corrected (L1T) Landsat Thematic Mapper and Enhanced Thematic Mapper Plus (TM/ETM+) time series image dataset covering the study areas in summer of 2000, 2005, 2009, and 2014 was downloaded from the United States Geological Survey website (http://earthexplorer.usgs.gov/). The datasets had been processed for systematic radiometric calibration and geometric correction by incorporating ground control points while employing a digital elevation model for topographic correction. Therefore, it could be used to visually validate the results of human-induced vegetation change. The 2010 land cover data for the study area was obtained from the China Environmental Protection Agency and the Chinese Academy of Sciences. It was produced by object-based classification using charge coupled device camera data from the Chinese Huanjing-1/A/B/C satellite. The classification of land cover in the data was based on first-level categories, and the overall accuracy was up to 85% [48]. It could indicate farmland, forest, grassland, wetland, sand land/unused land, and urban construction areas, so that can be used to further target specific driven factors. In addition, the amount of chemical fertilizer and number of livestock at the end of each year in the study areas were obtained from local economic statistical datasets, i.e., the Inner Mongolia Statistics Bureau, over the study period (2001–2015). The price of corn was obtained from China Animal Industry Yearbooks (2001–2015).

2.3. Methodology

To discover different human–climate–vegetation change mechanisms in the study areas, two general steps were taken to profile human-induced vegetation change (Figure 2). (1) We detected vegetation dynamics from 2000 to 2014 to find out areas of significant change during the past 15 years, and (2) we used optimized RESTREND to discriminate human-induced changes in areas with significant change. Areas with no significant vegetation changes determined in the first step were not analyzed in the second step.

2.3.1. Detecting Vegetation Dynamics Using the SMK Method

Statistical methods are used frequently to detect trend dynamics of vegetation [49,50], including parametric methods such as the least squares linear regression method [1,51] and non-parametric methods such as Sen’s slope estimation coordinated with the Mann–Kendall test detection (SMK) method [52,53]. In this study, the SMK method was used to determine whether a time series trajectory of N D V I indicated a statistically significant trend (p < 0.05). It is a non-parametric method that is robust against non-normality in a dataset and has good performance in error resistance [54,55], which is suitable for use in arid and semi-arid ecosystems with strong and frequent interannual vegetation variability. The trend slope can be defined by Sen’s slope estimation, and the significance of the slope can be determined using the Mann–Kendall test [52,53].
Besides, the N D V I change rate over the study period was determined using Equations (1) and (2), and can directly express the magnitude of trend change:
S Δ N D V I = | ( β × t n + a ) ( β × t 1 + a ) β × t 1 + a | × 100
a = X ¯ β × t ¯
where S Δ N D V I is the N D V I change rate (percentage of N D V I increase over the study period), X ¯ is the mean of the time series of N D V I s, t ¯ is the mean value of the dates, and t 1 and t n are the start and end years of the time series, respectively. The significant change areas can be acquired using Equation (3):
| S Δ N D V I | > p
where p is the change rate threshold, which was set as 10% in this study.

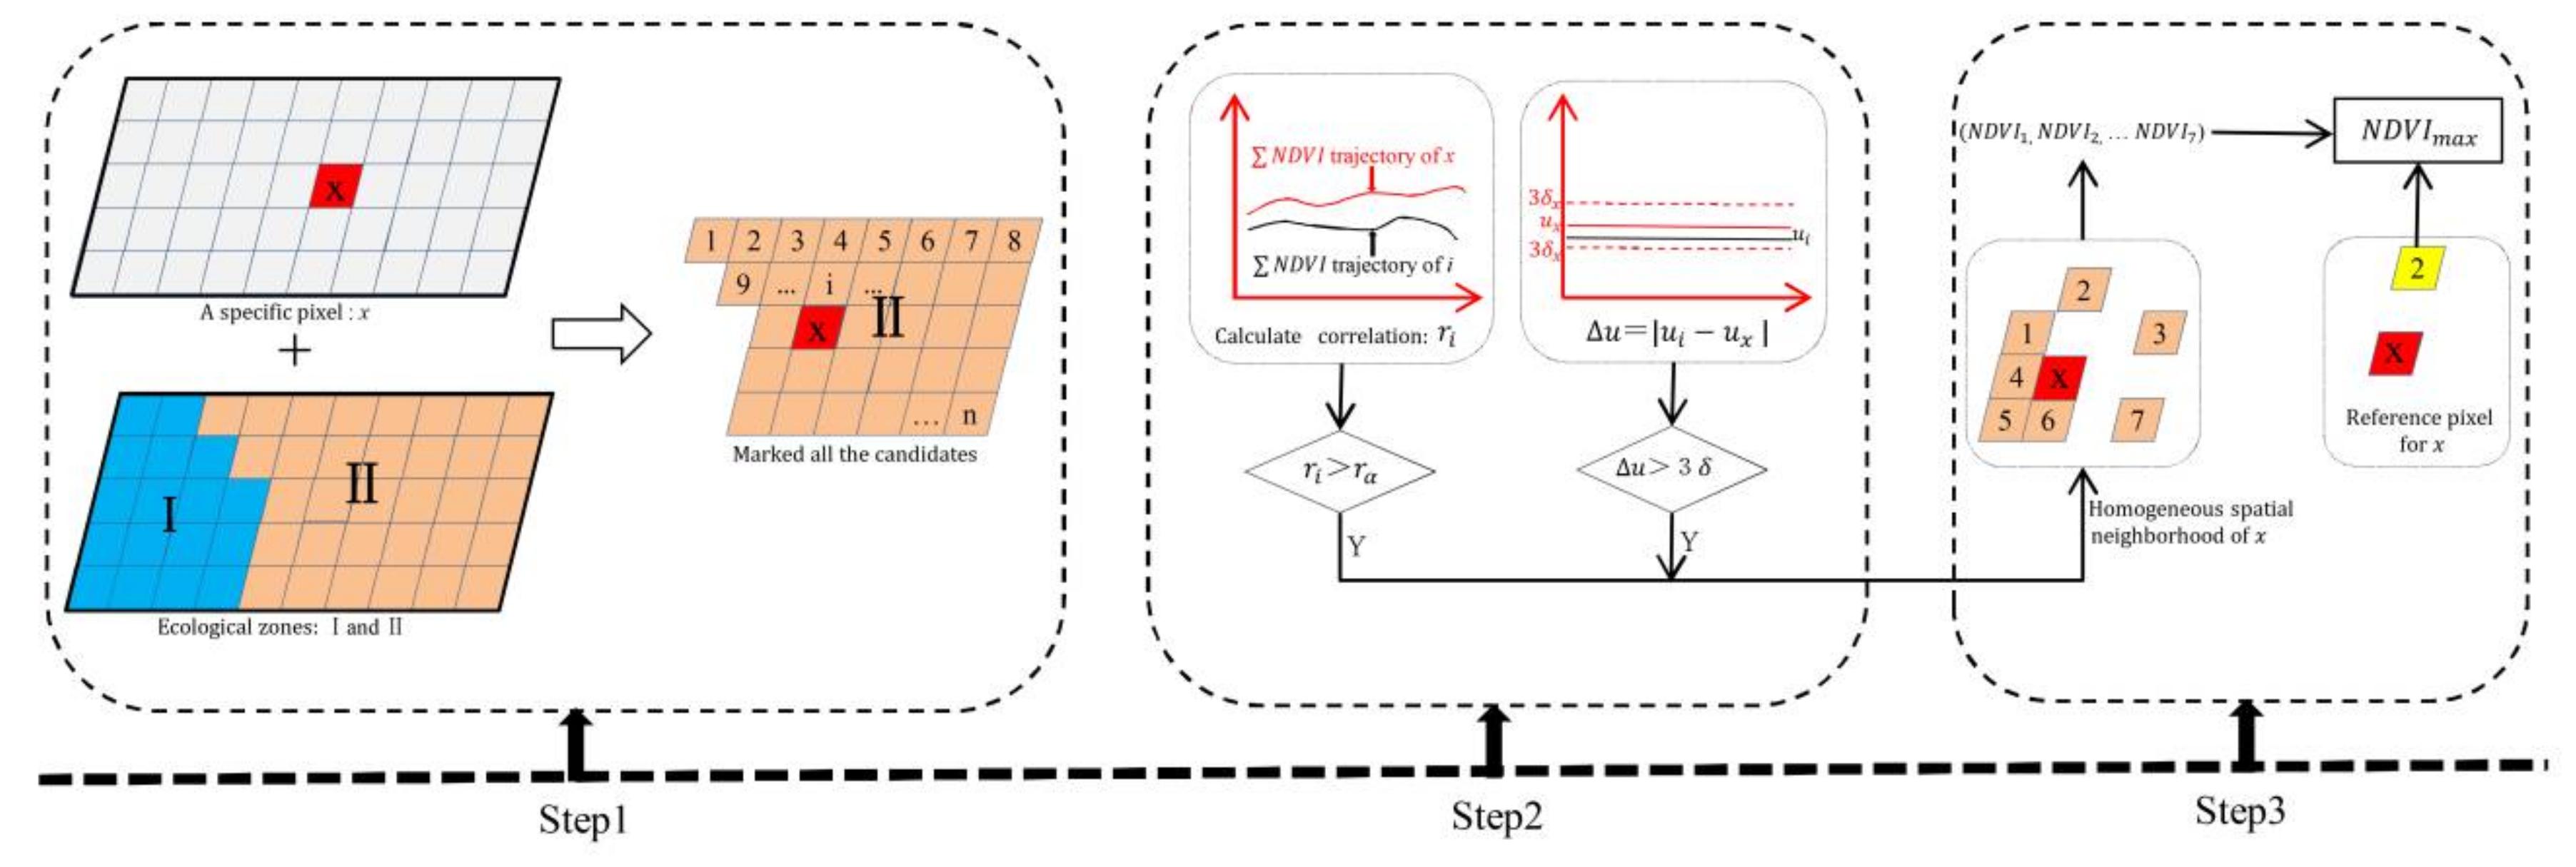
2.3.2. Discriminating Human-Induced Changes Using Optimized RESTREND

In the significant change areas, we used optimized RESTREND to profile human-induced changes. The first step for optimized RESTREND was pre-analyzing the relationship between climate factors and AA-NDVIs to determine suitable climate factors and their best related period in the study areas. Second, a multiple regression model was built at the pixel level to simulate ideal climate–vegetation relationships during the study period. Finally, the residual analysis was conducted. If the changes in NDVI response were only due to climatic effects, the residuals of the predicted NDVIs and actual NDVIs in the regression model should be close to zero, and only fluctuate randomly without significant trend signals. Any significant trend in the residuals will indicate changes that are not due to climatic effects [1]. A decreasing trend in residuals represented human-induced vegetation degradation, while an increasing trend in residuals indicated that vegetation improvements were happening in the study area because of human activity. If there was no trend in the residual series, all of the vegetation changes that happened during study period were driven by climate change [28].
(1) Find the most suitable climate variables and their best-related period.
r = ( x i x ¯ ) ( y i y ¯ ) ( x i x ¯ ) 2 · ( y i y ¯ ) 2 ,
where r is the correlation coefficient; x i is the value of AA-NDVIs in the ith year; x ¯ is the average value of x i from 2000 to 2014; y i is the value of the specific climate index (Table 1) in the ith year; and y ¯ is the average value of y i from 2000 to 2014. In each pixel, there were a total of 135 ( 3 × 45 ) r results for climate factors (P/T/W). The best-related period of T, P, and W (hereafter T b e s t , P b e s t , and W b e s t , respectively) were the most suitable climate variables to build the climate–vegetation model.
(2) Simulate the ideal climate–vegetation relationship.
Treating T b e s t , P b e s t , and W b e s t as the representatives of the climate factors, we first normalized each variable using the min–max normalization method as in Equation (5), and then used multiple regression analysis to build the pixel-level climate–vegetation model as in Equation (6).
N o r v i = v i m i n ( v ) m a x ( v ) m i n ( v )
where v is a specific time series variable (i.e., T b e s t , P b e s t , and W b e s t ); v i is the value of variable v at the ith time; N o r v i is the normalized value of variable v at the ith time; and the m a x ( v ) and m i n ( v ) is the maximum and minimum values of time series variable v , respectively.
y = β 0 + β 1 P + β 2 T + β 3 W ,
where y is the time series N D V I s of the ‘reference pixel’, which refers to the maximum value of N D V I s in the homogeneous spatial neighborhood of the target pixel; P , T , and W are the normalized values of the time series T b e s t , P b e s t , and W b e s t respectively; and β 0 , β 1 , β 2 , and β 3 , are the parameters of the model.
In this paper, the location of a corresponding reference pixel for a specific pixel x was determined by three steps (Figure 3). Step 1 found all of the neighborhood pixels that were located within the same ecological zone of x, and marked them as candidates. In step 2, candidates that could not simultaneously satisfy the following two conditions lost their qualifications: (1) there must be a significant correlation of N D V I trajectories between x and the candidates; (2) the differential of mean value of the N D V I trajectory between x and candidates must be below 3δ. The 3δ method has been used to detect land cover change in some studies [14,56], and helped determine homogeneous spatial neighborhoods in this study. All of the candidates selected by this step constituted the homogeneous spatial neighborhood of x. In step 3, the candidate with the maximum value of N D V I s was defined as the reference pixel.
(3) Residual analysis to discriminate human-induced changes
Residual analysis was conducted using the SMK method though Equations (1)–(6). Residuals refer to the differential value between the potential N D V I s and the actual N D V I s. A significant decreasing or increasing trend in residuals indicated that vegetation change is driven by human activities.

3. Results

3.1. Vegetation Dynamics during the Past 15 Years

Over the past 15 years, obvious vegetation increases happened in both regions, and Naiman increased more dramatically than Ar Horqin. In the Ar Horqin region, about 18.6% of the total area (2371.1 km2) had a significant trend of change (p < 0.05), with 16.8% of the area increasing by more than 10%, and only 1.3% of the area decreasing more than −10%. About 66.3% of the Naiman region (5301.9 km2) showed a significant trend change during this period, with much of the change area (64.1%) increasing by more than 10%, and only 1.1% of the area decreasing by more than −10%. About half of the change area increased between 20–40% during the study period (Table 2).
In both regions, most positive changes happened in the southern study area showing a zonal or block distribution. The negative change areas showed a sporadic distribution in the northern study area (Figure 4a and Figure 5a). Specifically, positive changes always happened along rivers and roads and negative changes mainly happened in the south of the Greater Khingan Range Mountain in the Ar Horqin region. In the Naiman region, negative changes were mainly located around the county center.

3.2. Human-Induced Vegetation Changes

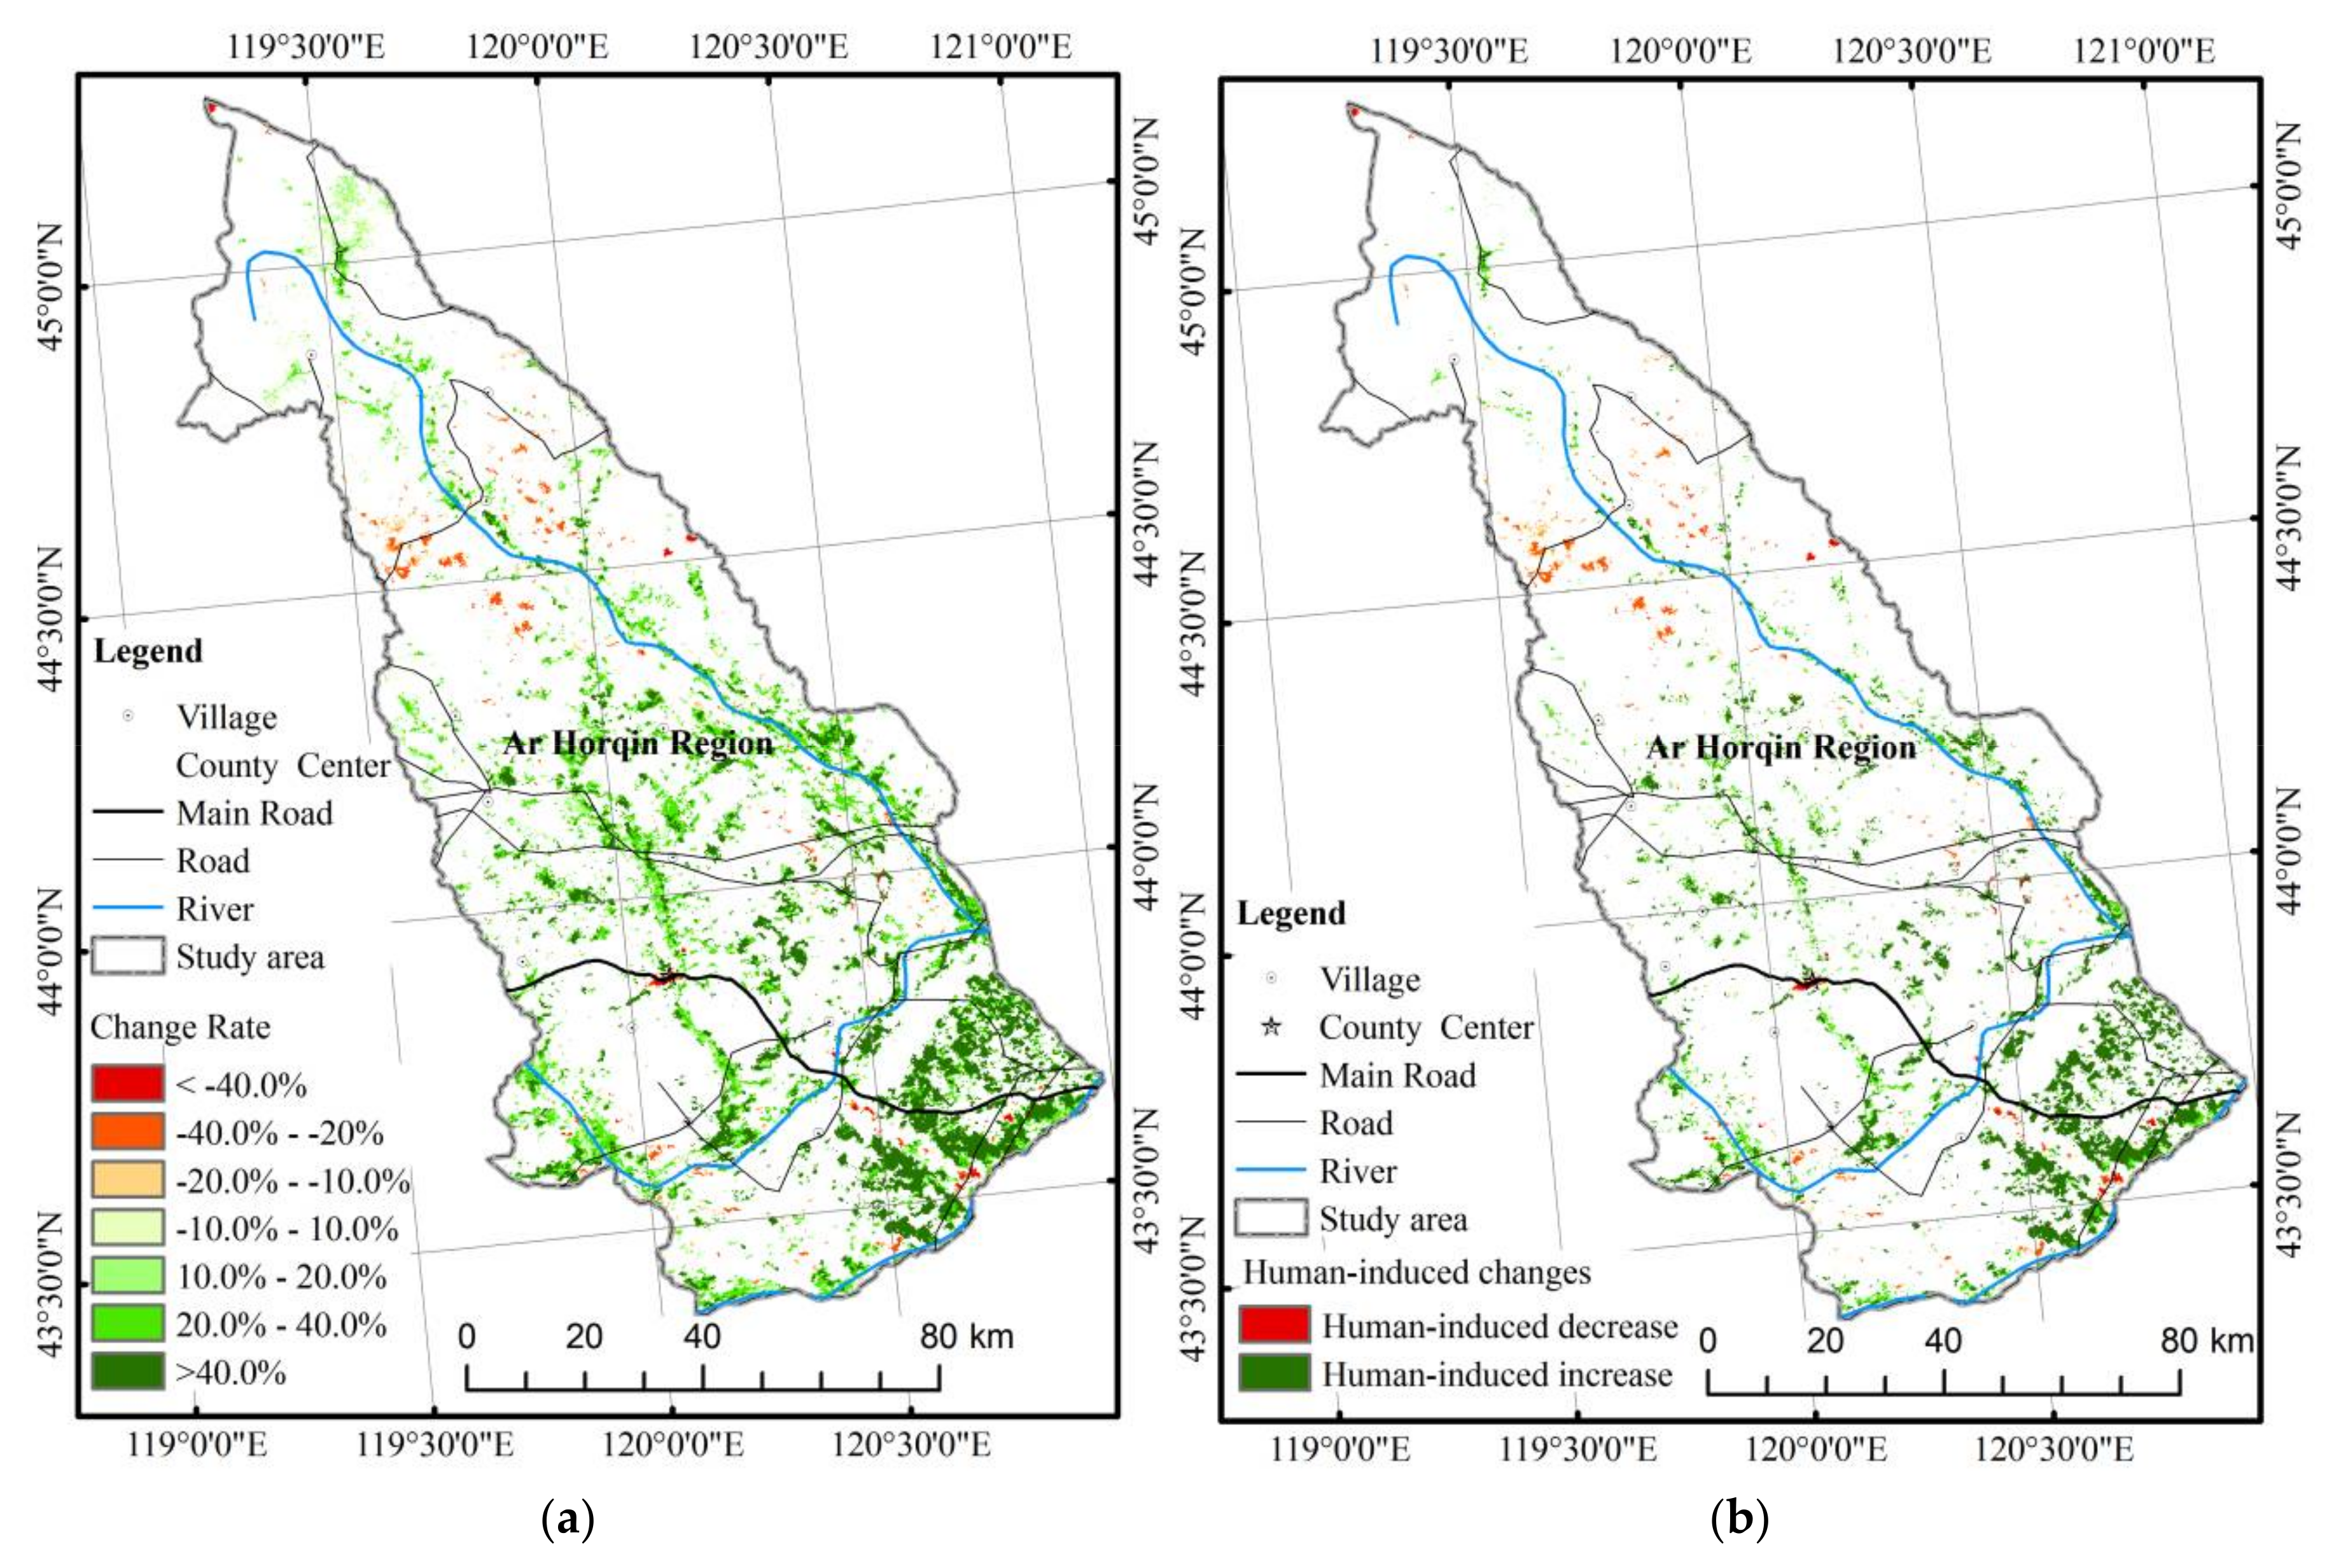
3.2.1. Significant Human-Induced Change in the Ar Horqin Region

In the Ar Horqin region, both climate change and human activities contributed equally to the vegetation changes over the past 15 years, according to the trend of residuals shown in Figure 4b. About 50.1% of the significant changes resulted from human activities, while 49.9% of the significant changes were caused by climate change.
However, human activities caused more dramatic changes than climate in Ar Horqin. The results showed that vegetation in most of the human-induced change area (about 57.2%) increased by more than 40%, while climate change resulted in less rapid changes, with most of the climate-induced change area (about 56.7%) increasing between 20–40%.
The results also showed that human activities were more responsible for a vegetation decrease than climate change in the Ar Horqin region. About 85.3% of the decreases were caused by human activities. Vegetation increases over the past 15 years may be equally induced by human activities (47.3%) and climate changes (52.7%).

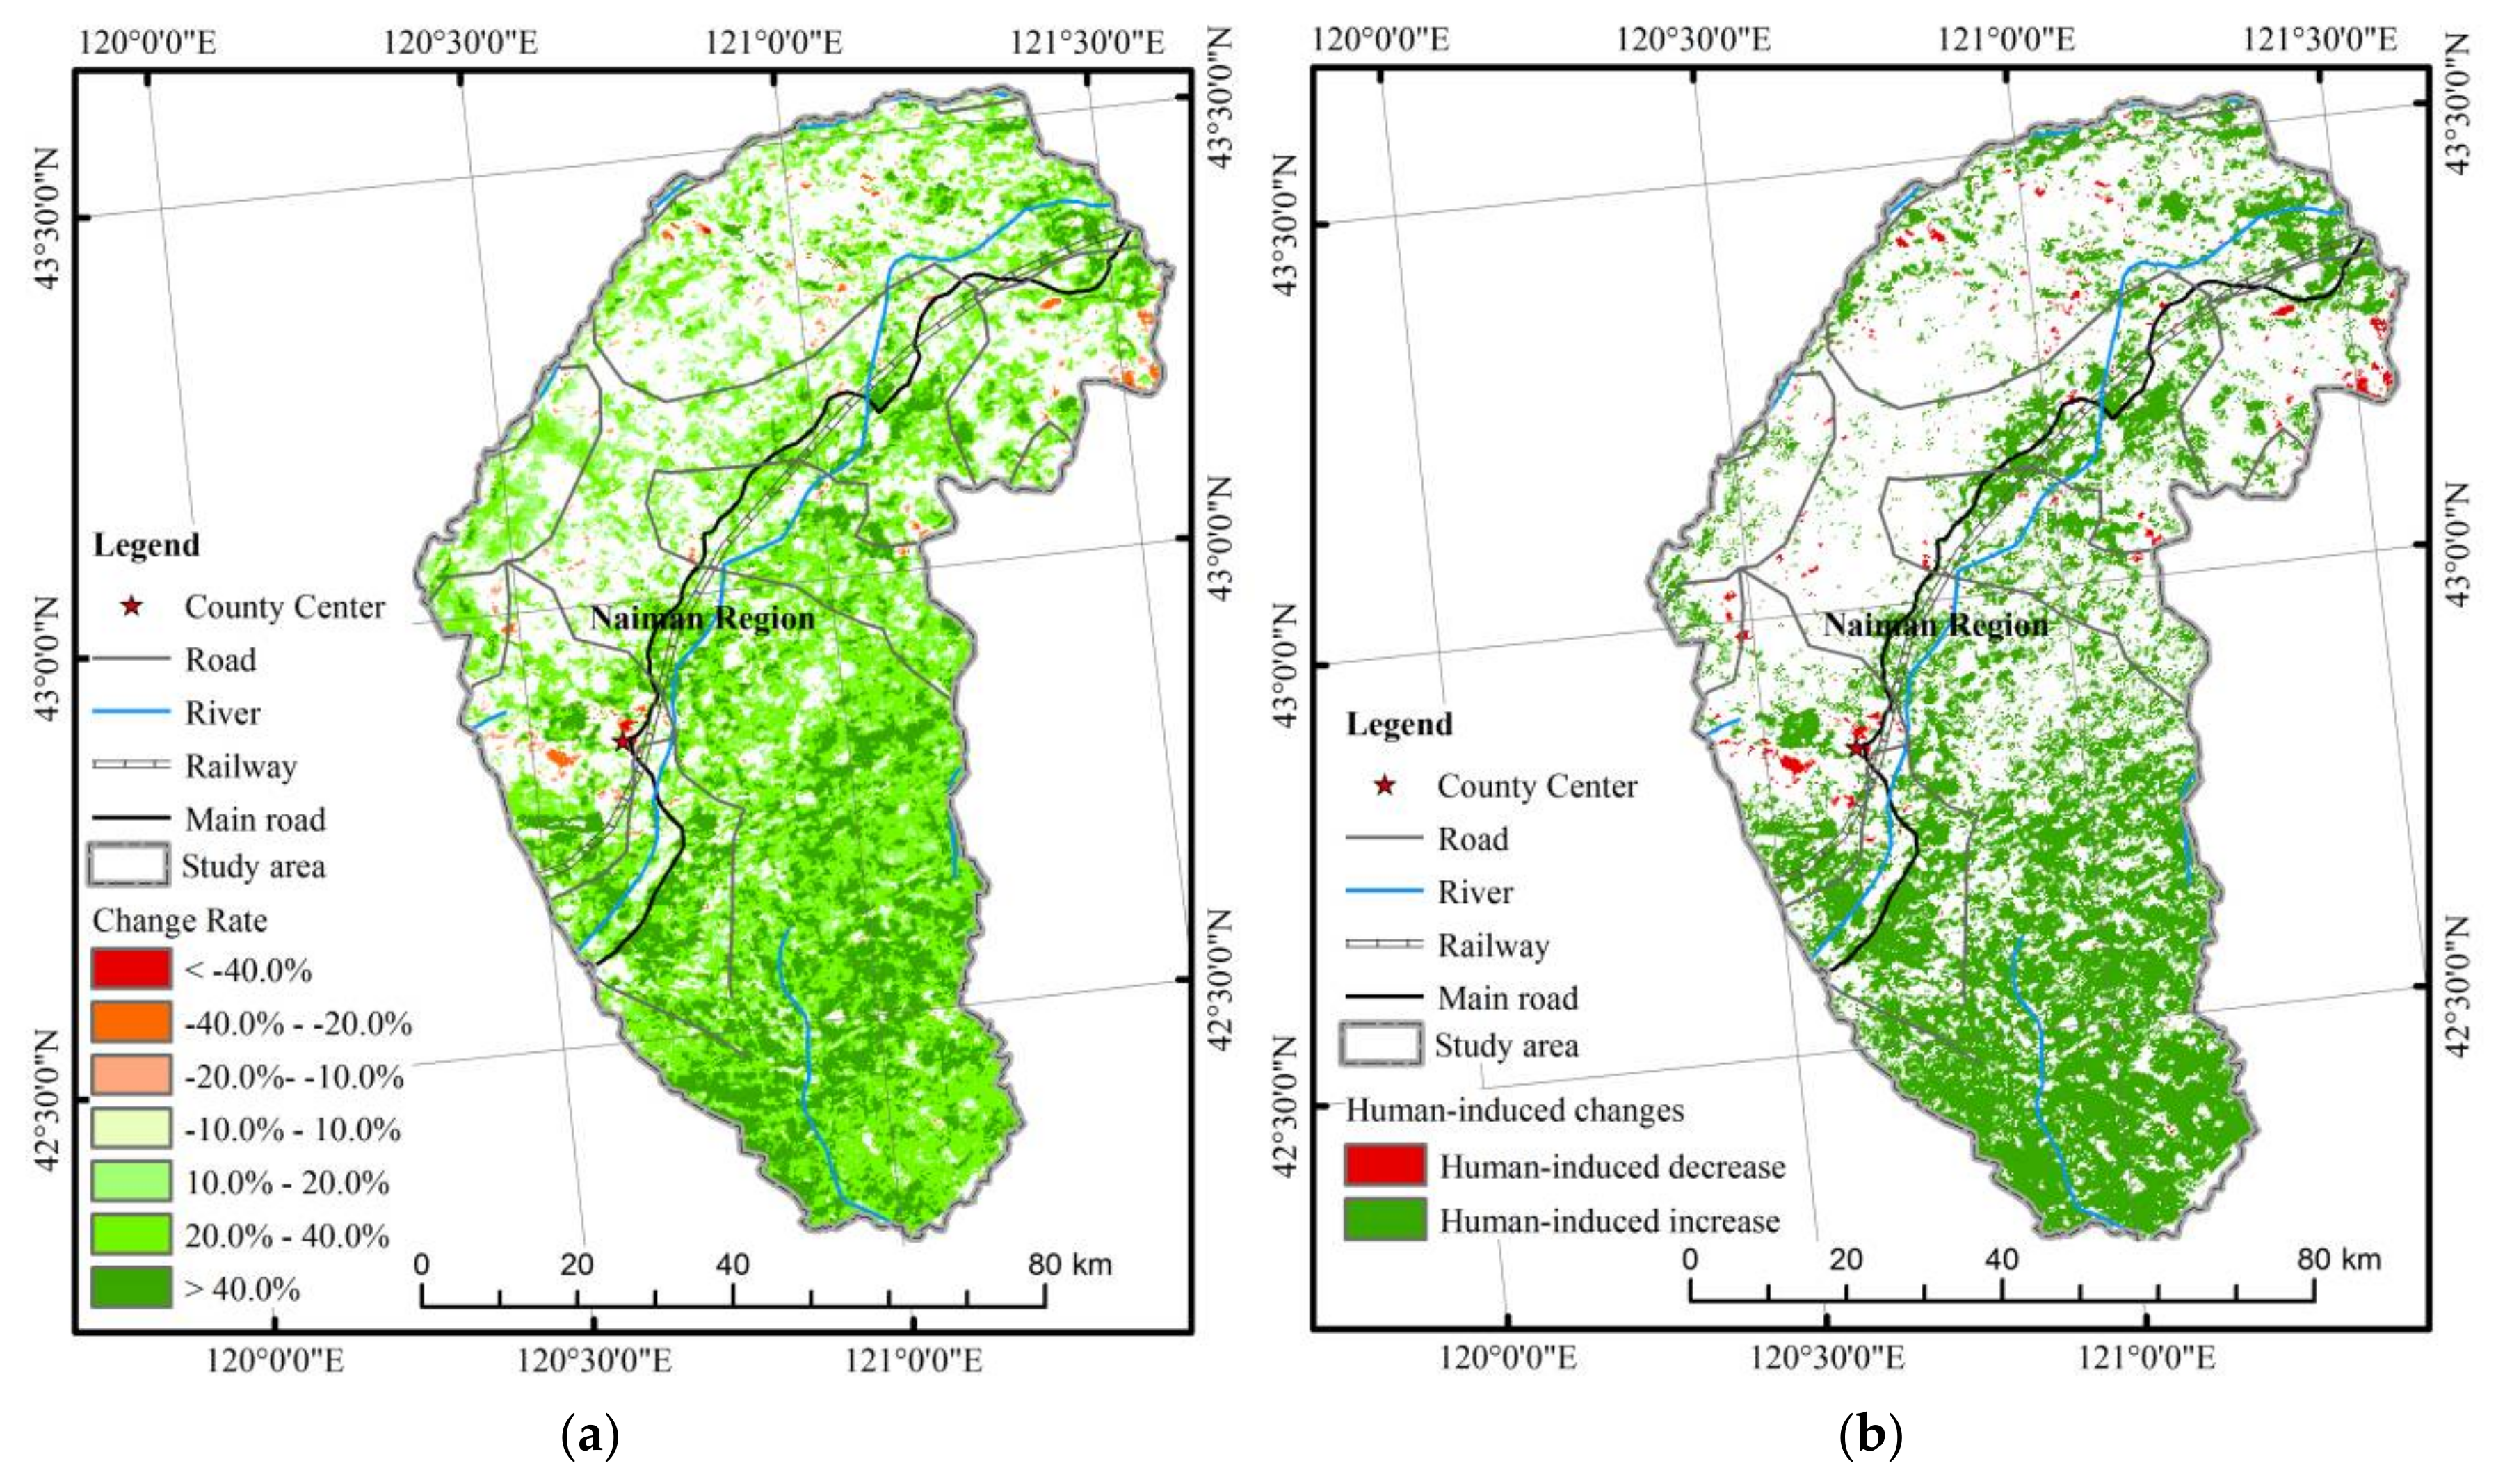
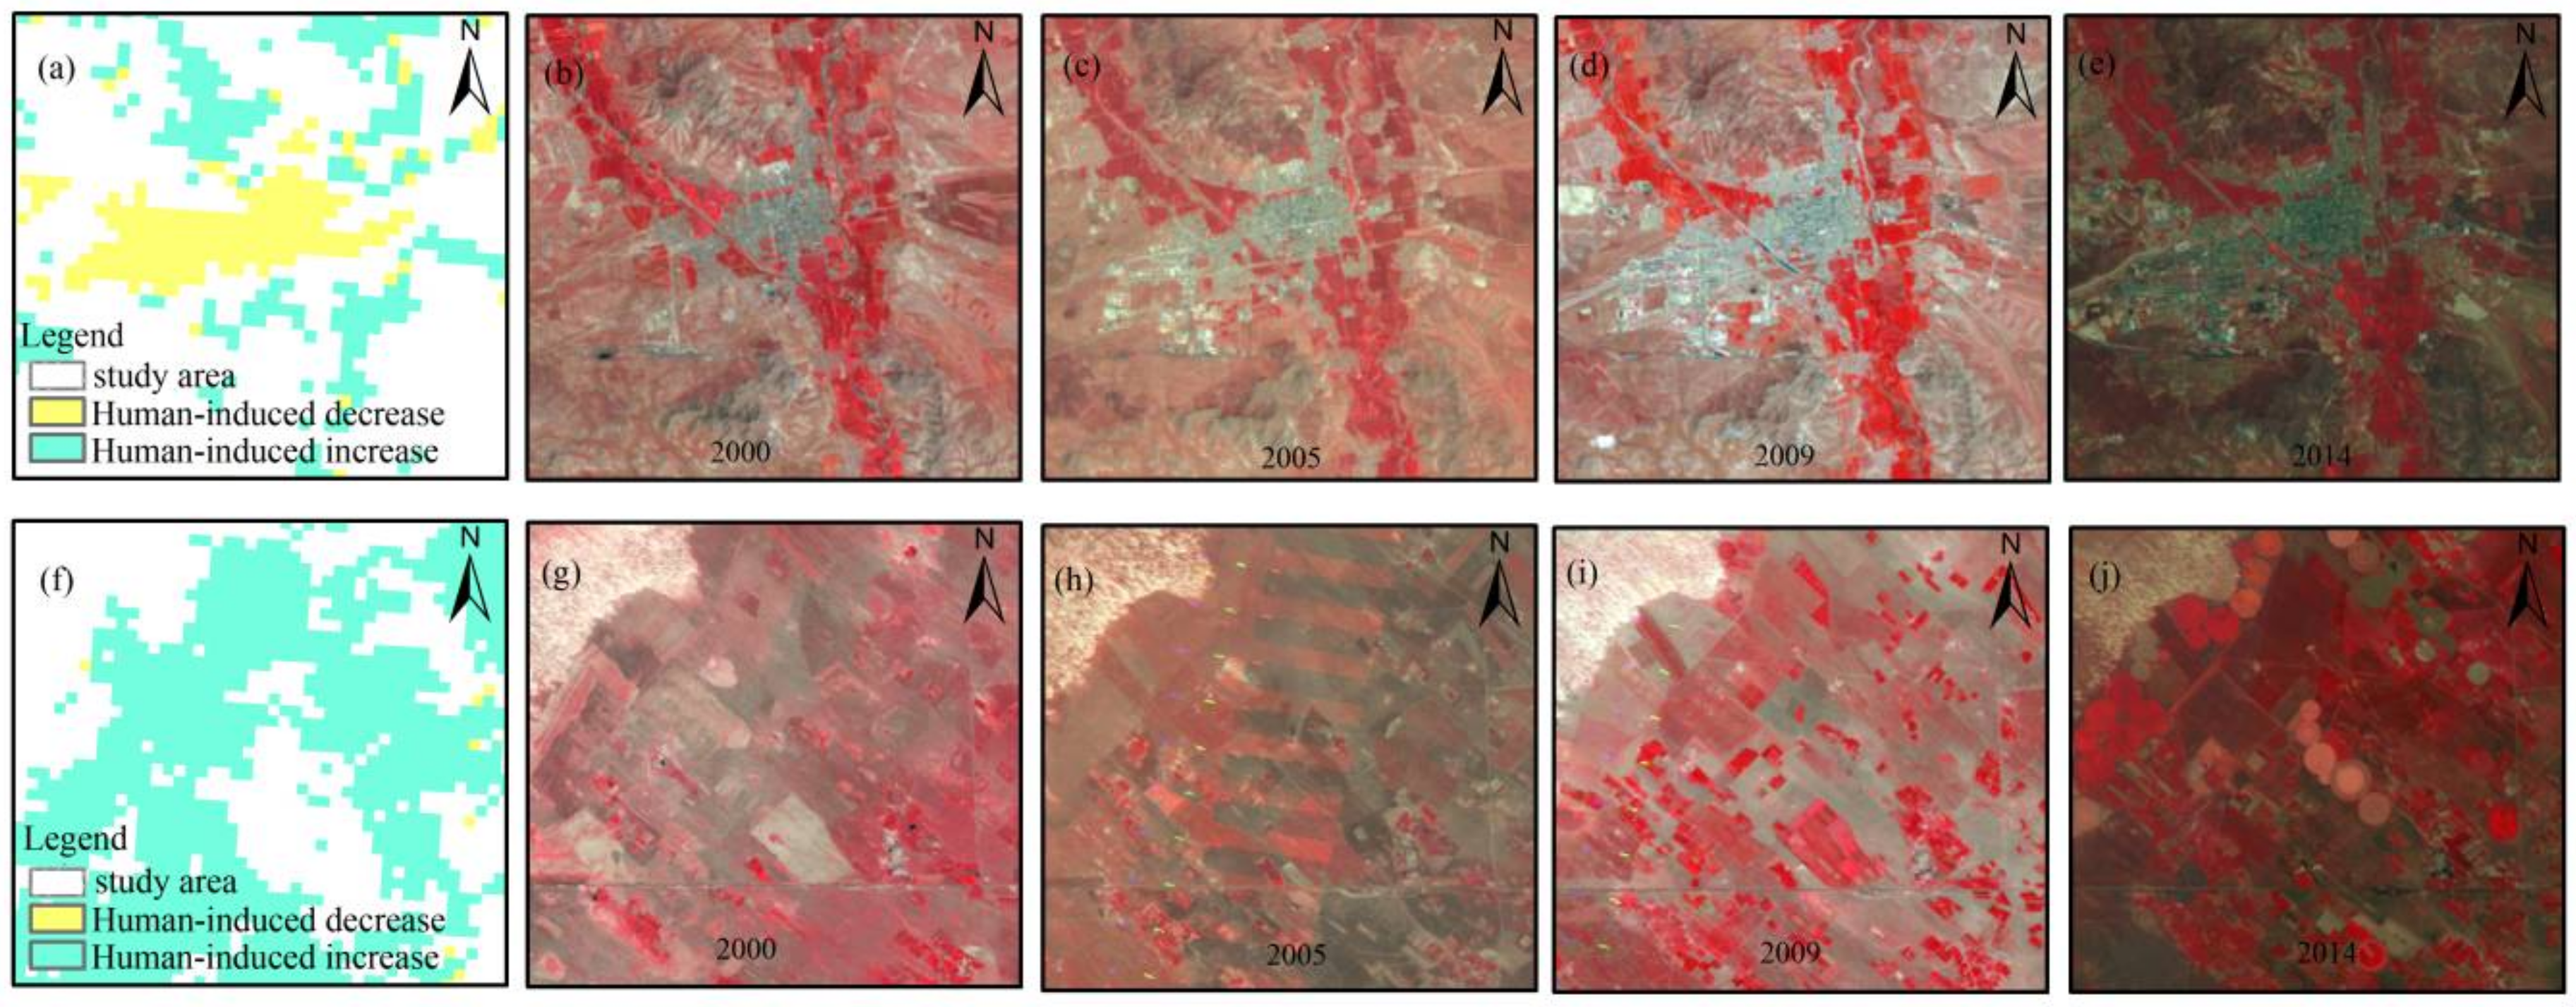
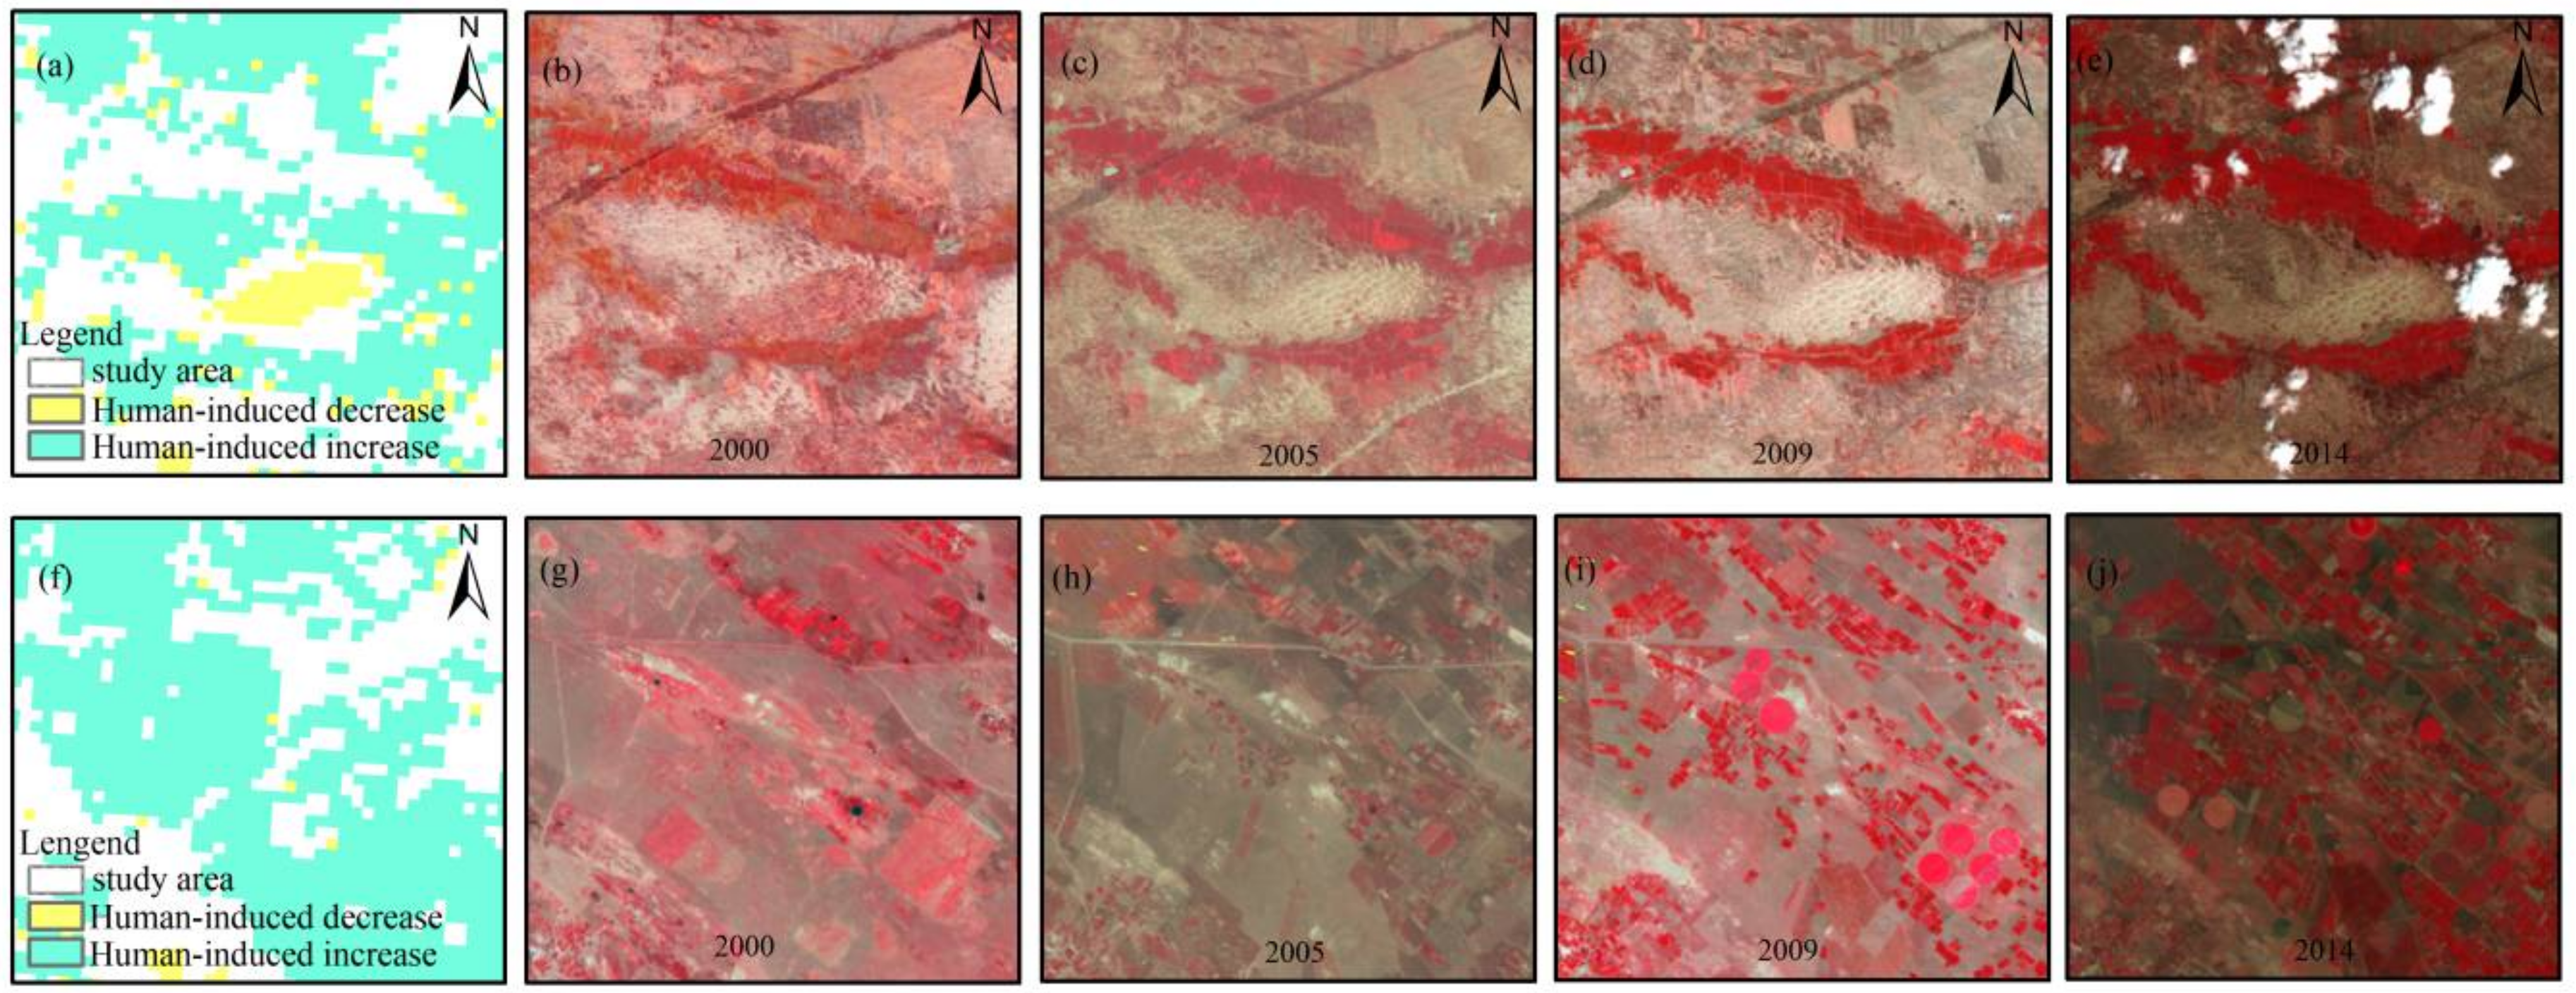
3.2.2. Significant Human-Induced Change in the Naiman Region

In the Naiman region, results demonstrated that human activities were the main drivers of vegetation change between 2000–2014, contributing up to 60.3% of the total significant changes (Figure 5b). Furthermore, human activities were more responsible for both negative and positive vegetation change than climate. About 84.7% of the decreases were caused by human activities, and about 59.8% of the vegetation increases were caused by human activities. Climate change resulted in more vegetation increases (40.2%) than decreases (14.3%). The results indicated that human activities had deeper and broader influences in the Naiman region compared with the Ar Horqin region.

3.2.3. Validation of Human-Induced Vegetation Change

This study aimed to discriminate significant human-induced changes in two different regions. However, the validation of vegetation change at regional scales is notoriously hard because there is seldom ground-truthed data of historical land cover changes, as these data are difficult to collect over long periods [57]. Here, we used time series Landsat images with a high spatial resolution (30 m) to validate vegetation changes and try to find further evidence of human-induced changes through visual interpretation of the images [58]. Visual interpretation of false color composite images showed that our methods effectively discriminated significant human-induced vegetation change in both regions. Figure 6 and Figure 7 show evidence that indicates land cover changes and driving forces during the study period in a typical change area.
Figure 6a–e show a decrease in vegetation that is obviously related to urban expansion. Land cover change, i.e., farmland conversion to urban area, which is solely caused by human activity, can result in decreases in vegetation. Figure 7a–e show local grassland degradation, which is also caused by human activity. The degradation area shown in (a) was surrounded by farmland. It had land cover conversion from grassland (pink in Landsat false color image) to sandy land (bright white in Landsat false color image) during 2000–2005.
An in situ investigation of vegetation increases in grassland showed that in Figure 6f–j and Figure 7f–j, all of the increases were caused by human activity, e.g., grassland management. The conversion of natural grassland into artificial pastures was verified by the appearance of several circular grasslands, as found in Figure 6j and Figure 7i,j. Two photographs of the circular patches are shown in Figure 8, demonstrating clear signs of the human management that resulted in a vegetation increase in these areas.

4. Discussion

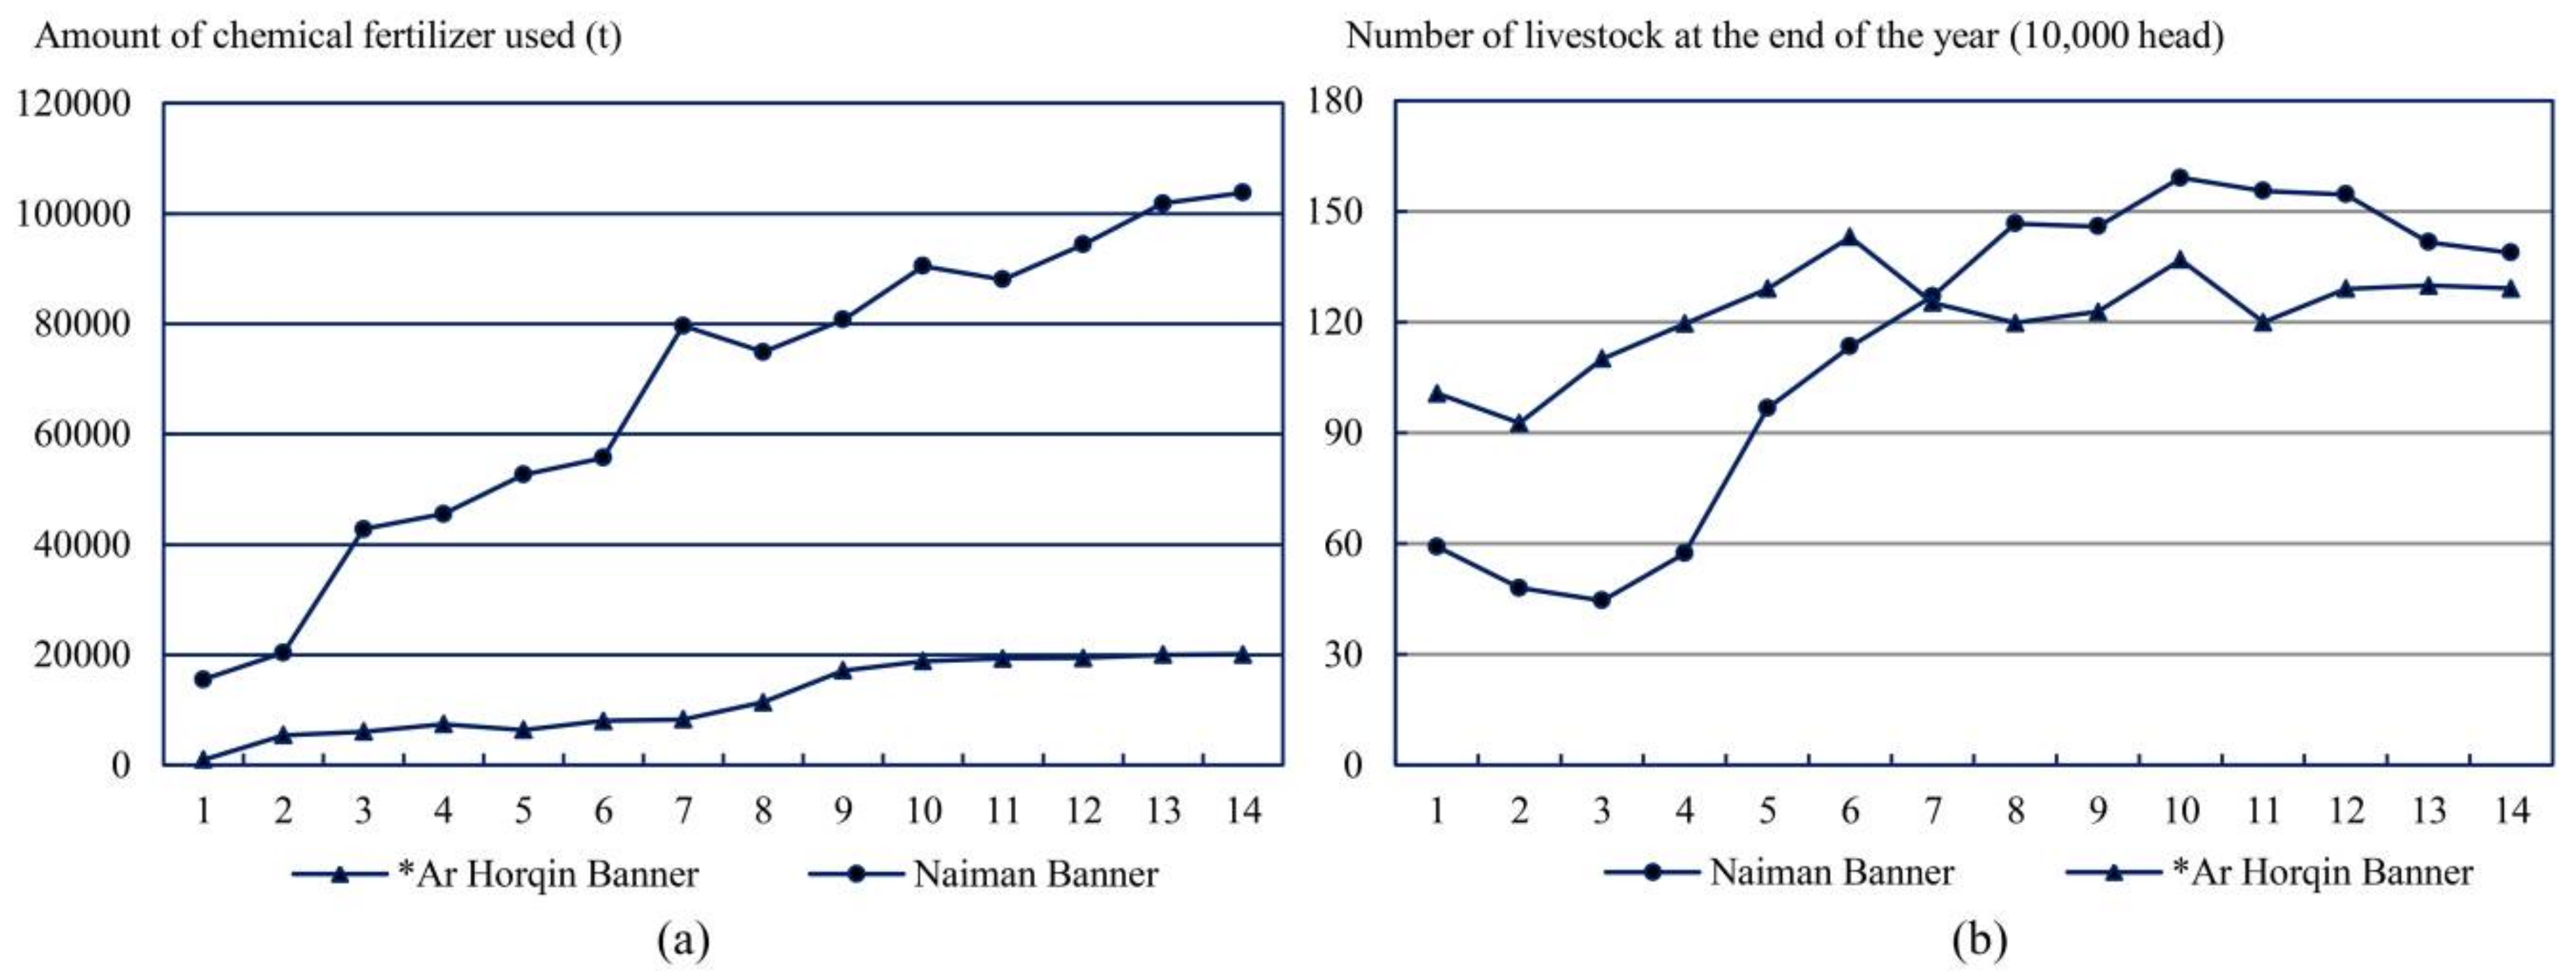
4.1. Different Driving Factors in the Study Areas

Although human factors contributed more to these changes than climate change in both regions, the specific human activities that caused the changes in the two regions were different.
In the Ar Horqin region, about 71.0% of the total area was grassland. Human activities caused 47.3% of the vegetation increase and 85.3% of the vegetation decrease. Human eco-managements (i.e., grass land restoration in Figure 8) and overgrazing were the two main human activities with positive and negative effects, respectively.
Figure 9a further supported this point of view. As we mosaicked the land cover map in 2010 by human-induced vegetation change area, it was clear that 57.9% of the human-induced changes were happening on grassland. Figure 4a also showed that most of the human-induced grassland changes were positive changes, which can be attributed to human management such as the Beijing–Tianjin Sandstorm Source Controlling Program (introduced in 2001) and the Ecological Subsidy and Award System (introduced in 2011) that were carried out in this region. Figure 5f–j and Figure 4b indicated the effects of human management on the grassland located in the southeast corner of the Ar Horqin region. However, most of the human-induced grassland decrease that happened in the northern area shown in Figure 4b was also caused by human activities according to Figure 9a, and these decreases can be attributed to overgrazing. We believe the effect of positive human management of grassland is greater than the negative outcomes of overgrazing, although the grazing activities increased in the Ar Horqin region during the study period (Figure 10b).
Farming is not a key human factor of change in this area, because only 33.9% of human-induced changes happened on farmland, as shown in Figure 9a. The majority of the significantly changed areas of farmland are located around the county center and spread in a north–south direction along the valley (Figure 4a). However, Figure 4b and Figure 9a showed that only part of the significant farmland changes in this area was attributed to human activities. The amount of chemical fertilizer used only had a small increase (Figure 10a), although 13.6% of the total area is farmland.
In the Naiman region, farming was the key human driver of significant vegetation change. About 46.5% of total area is farmland, and 66.3% of the human-induced significant changes happened in farmland, as shown in Figure 9b. The majority of farmland was in the southern area, and some was located along the main road in a northeast–southwest direction. Human-induced farmland changes were almost all positive, as shown in Figure 5b and Figure 9b. The Naiman region is a typical producing area of corn, and 90% of the farmland in this region is corn. The vegetation increase that occurred in farmlands in Naiman was mainly because of market incentives and the sharp increase in using fertilizer. According to the China Animal Industry Yearbook (2001–2015), the corn price in Inner Mongolia kept rising from 0.81 yuan/kg to 2.32 yuan/kg, with an increasing rate of up to 186.4% from 2000 to 2014. We believe that it greatly increased local people’s willingness to plant corn and improve corn output. In addition, statistical data also showed that the amount of chemical fertilizer used in 2013 was up to 6.7 times greater than in 2000 (Figure 10a), while the area of farmland in 2011 was up to 1.5 times more than in 2000. This could be further evidence of the human activities that positively influenced farmland changes.
About 21.6% of the significant human-induced changes happened in grassland, as shown in Figure 9b. Comparing Figure 9b and Figure 5b, most of the human-induced grassland change was positive, which corresponded to sharp increases over time in the index of the number of livestock at the end of each year (Figure 10b). Meanwhile, the area of decreased grassland caused by overgrazing was still small. Therefore, we believe that the human management of grassland was the other important factor of vegetation change in the Naiman region, which means the Grazing Withdrawal Program (introduced in 2003) and the Ecological Subsidy and Award System (introduced in 2011) implemented in this region had positive eco-effects.
The increased number of livestock in the study area is also noteworthy (Figure 10b). Previous study had proved that the increased number of livestock at the end of each year was mainly because of market incentives [59]. It is reported that the market prices of cattle, sheep, and pork had grown rapidly in Inner Mongolia. The price of sheep raised from 14.77 yuan/kg to 65.41 yuan/kg. The price of pigs raised from 10.1 yuan/kg to 22.48 yuan/kg. Especially, the price of cattle raised from 12.88 yuan/kg to 63.29 yuan/kg, with an increasing rate up to 26.09% per year. These price increases were a great incentive for people in the Naiman region, because the Naiman region is a typical producing area of cattle. According to our field investigation, the increasing supply of forage, which was caused by the increasing number of livestock, was no longer from overgrazing. People used the subsidy given by Grazing Withdrawal Program from the government to buy forage or planted silage corn and alfalfa to give fodder to livestock.

4.2. Limitations and Further Research

This study profiled significant human-induced vegetation change in the study area. We first used the SMK method to find areas of significant change, and then used RESTREND to discriminate human-induced from climate-induced change. We used SMK to mask slightly changed and no change areas, i.e., change rates between −10% and 10%, because the variability of vegetation growth in arid/semi-arid areas is commonly high, and this extent of change was regarded as a relatively stable growth rate in the study area. However, this kind of area can also be influenced by human activities, and even further by the complicated interaction and offset mechanisms between climate change and human activities, such as increased irrigation in less rainy years, which need to be analyzed in further studies.
The strategy in optimized RESTREND had two advantages compared with previous studies [31,32,33]. First, the algorithm flow was automatic, and did not require human intervention, which could strengthen its applicability and ease-of-use in large areas. Second, we used a time series vegetation index to finish defining the flexible homogeneous areas, which avoided uncertainties caused by adding external time-varying data such as land use maps. Although we have detailed analysis of the human-induced vegetation change in the two regions, it is hard to validate the result directly and compare it with other methods. Here, we took a time series Landsat image dataset as the main source of validation data, and the attribution analysis mainly relied on visual interpretation. Thus, the results may contain some uncertainty. Accumulating a site investigation dataset over a long period and using a questionnaire survey about the effects of specific eco-programs are both very important in future studies.
The uncertainty of the results could be also caused by the coarse temporal resolution of meteorology datasets (i.e., one month), which was different form the time series NDVI datasets (i.e., 16 days). Using the highest correlation coefficient to choose the best-related period between NDVI and each climate factor might not be the best strategy. The partial correlation coefficient could be used in the future study to improve the process. The suddenly appearances of wildfire, diseases, and insects invasion [4,60,61] in ecosystems are neither direct human-related nor climate-related factors. Meanwhile, the drought and flood that happened during the study period may influence the linear regression relationship between climate and vegetation, which is the basic of RESTREND [5]. Results would be unreliable when these interferences happened. Breakpoints detection methods [56,57,58] can be used in combination with RESTREND to accurately define specific human-induced changes in the future study.
In addition, this study did not consider the possibility of changes in dominant driving factors over time as we used linear analysis methods. However, vegetation increases during past 15 years might reflect climate-induced negative changes in the first five years, and then human-induced positive changes in the following 10 years, and vice versa. A finer-scale temporal analysis would help define human-induced changes. Piecewise analysis methods [11] or other time series detection methods [62,63] can be used in further research to resolve this problem.

5. Conclusions

This paper first detected vegetation dynamics using SMK in the Ar Horqin and Naiman regions of China from 2000 to 2014, and then applied optimized RESTREND to profile significant human-induced changes in vegetation. We optimized strategies to define homogeneous spatial neighborhoods in RESTREND. An automatic algorithm was proposed to define flexible homogeneous areas based on the statistical analysis and trajectory analysis of a time series NDVI dataset.
Results showed that during past 15 years, significant vegetation increases happened in both regions, and climate change and human activities both contributed to the changes. However, more significant vegetation increases happened in the Naiman region (64.1%) than in the Ar Horqin region (16.8%). In the Ar Horqin region, climate and human activities equally contributed to vegetation change. Meanwhile, in the Naimen region, it was proved that human activities contributed more than climate factors to vegetation change. Human factors had a stronger influence on ecosystems and were responsible for the vegetation decrease in both regions. In different study areas, dominant human driving forces varied. In the Ar Horqin region, human management of grassland was the key factor, and the secondary human factor was overgrazing. Farming was not a key human factor for change in this area. In the Naiman region, farming was the key human factor for vegetation change. Positive human management in grassland was the other key driver of change.
In future studies, the improvement of RESTREND and finer-scale temporal analysis would help to accurately define specific human-induced changes. The study of a very long series of palaeoenvironmental records can also improve knowledge on the drivers of changes over long time periods in these regions [64]. The complex interactions and offset mechanisms between climate change and human activities need to be clarified so that the underestimates or overestimates of human effects can be avoided. In addition, we did not consider the trend-reversal phenomenon, which is very likely to happen over time, when analyzing the dominant driving factors. Some abrupt change detection methods can be used in further research.

Acknowledgments

This study was supported by State Key Laboratory of Resources and Environmental Information System, the National Natural Science Foundation of China (grant no. 41701474 and 41701467), the National Key Research and Development Plan of China (grant no. 2016YFC0500205), the National Basic Research Program of China (grant no. 2015CB954103) and the Key Laboratory for National Geograophy State Monitoring (National Administration of Surveying, Mapping and Geoinformation, grant no. 2017NGCM09). The authors are grateful to the anonymous reviewers for their constructive criticism and comments. We thank Leonie Seabrook, PhD, from Liwen Bianji, Edanz Group China (www.liwenbianji.cn/ac), for editing the English text of a draft of this manuscript.

Author Contributions

L.X. designed the experiments and wrote the draft version of manuscript; G.Y., Z.T. and Y.Z. contributed to the editing and reversion of the manuscript.

Conflicts of Interest

The authors declare no conflict of interest. The funding sponsors had no role in the design of the study; in the collection, analyses, or interpretation of data; in the writing of the manuscript, and in the decision to publish the results.

References

  1. Evans, J.; Geerken, R. Discrimination between climate and human-induced dryland degradation. J. Arid Environ. 2004, 57, 535–554. [Google Scholar] [CrossRef]
  2. Omuto, C.T.; Vargas, R.R.; Alim, M.S.; Paron, P. Mixed-effects modelling of time series NDVI-rainfall relationship for detecting human-induced loss of vegetation cover in drylands. J. Arid Environ. 2010, 74, 1552–1563. [Google Scholar] [CrossRef]
  3. Marchant, R.; Richer, S.; Capitani, C.; Courtney-Mustaphi, C.; Prendergast, M.; Stump, D.; Boles, O.; Lane, L.; Wynne-Jones, S.; Vázquez, C.F.; et al. Drivers and trajectories of land cover change in East Africa: Human and environmental interactions from 6000 years ago to present. Earth Sci. Rev. 2018, 178, 322–378. [Google Scholar] [CrossRef]
  4. Zhou, X.; Yamaguchi, Y.; Arjasakusuma, S. Distinguishing the vegetation dynamics induced by anthropogenic factors using vegetation optical depth and AVHRR NDVI: A cross-border study on the Mongolian Plateau. Sci. Total Environ. 2018, 616–617, 730–743. [Google Scholar] [CrossRef] [PubMed]
  5. Wang, H.; Liu, G.H.; Li, Z.S.; Ye, X.; Fu, B.J.; Lv, Y.H. Impacts of Drought and Human Activity on Vegetation Growth in the Grain for Green Program Region, China. Chin. Geogr. Sci. 2018. [Google Scholar] [CrossRef]
  6. Pearson, R.G.; Phillips, S.J.; Loranty, M.M.; Beck, P.S.A.; Damoulas, T.; Knight, S.J.; Goetz, S.J. Shifts in Arctic vegetation and associated feedbacks under-climate change. Nat. Clim. Chang. 2013, 3, 673–677. [Google Scholar] [CrossRef]
  7. Dewan, A.M.; Yamaguchi, Y. Land use and land cover change in Greater Dhaka, Bangladesh: Using remote sensing to promote sustainable urbanization. Appl. Geogr. 2009, 29, 390–401. [Google Scholar] [CrossRef]
  8. Byomkesh, T.; Nakagoshi, N.; Dewan, A.M. Urbanization and green space dynamics in Greater Dhaka, Bangladesh. Landsc. Ecol. Eng. 2012, 8, 45–58. [Google Scholar] [CrossRef]
  9. Rêgo, J.C.L.; Soares-Gomes, A.; Silva, F.S. Loss of vegetation cover in a tropical island of the Amazon coastal zone (Maranhão Island, Brazil). Land Use Policy 2017. [Google Scholar] [CrossRef]
  10. Tong, X.W.; Brandt, M.; Yue, Y.M.; Horion, S.; Wang, K.L.; Keersmaecker, W.D.; Tian, F.; Schurgers, G.; Xiao, X.M.; Luo, Y.Q.; et al. Increased vegetation growth and carbon stock in China karst via ecological engineering. Nat. Sustain. 2018, 1, 44–50. [Google Scholar] [CrossRef]
  11. Xu, L.L.; Li, B.L.; Yuan, Y.C.; Gao, X.Z.; Zhang, T.; Sun, Q.L. Detecting Different Types of Directional Land Cover Changes Using MODIS NDVI Time Series Dataset. Remote Sens. 2016, 8, 495. [Google Scholar] [CrossRef]
  12. Fisher, R.A.; Koven, C.D.; Anderegg, W.; Christoffersen, B.O.; Dietze, M.C.; Farrior, C.; Holm, J.A.; Hurtt, G.; Knox, R.G.; Lawrence, P.J.; et al. Vegetation Demographics in Earth System Models: A review of progress and priorities. Glob. Chang. Biol. 2017, 24, 35–54. [Google Scholar] [CrossRef] [PubMed]
  13. Wessels, K.J.; Pretorius, D.J.; Prince, S.D. Reality of rangeland degradation mapping with remote sensing: The South African experience. In Proceedings of the 14th Australasian Remote Sensing and Photogrammetry Conference, Darwin, Australia, 29 September–3 October 2008. [Google Scholar]
  14. Wang, Y.W.; Wang, Z.Y.; Li, R.R.; Meng, X.L.; Ju, X.J.; Zhao, Y.G.; Sha, Z.Y. Comparison of Modeling Grassland Degradation with and without Considering Localized Spatial Associations in Vegetation Changing Patterns. Sustainability 2018, 10, 316. [Google Scholar] [CrossRef]
  15. Marignani, M.; Chiarucci, A.; Sadori, L.; Mercuri, A.M. Natural and human impact in Mediterranean landscapes: An intriguing puzzle or only a question of time? Plant Biosyst. 2017, 151, 900–905. [Google Scholar] [CrossRef]
  16. Mercuri, A.M. Genesis and evolution of the cultural landscape in central Mediterranean: The ‘where, when and how’ through the palynological approach. Landsc. Ecol. 2014, 29, 1799–1810. [Google Scholar] [CrossRef]
  17. Turner, B.; Benjamin, P. Fragile Lands: Identification and Use for Agriculture: Agriculture, Environment, and Health: Sustainable Development in the 21st Century; University of Minnesota Press: Minneapolis, MN, USA; London, UK, 1994. [Google Scholar]
  18. Wessels, K.J.; Prince, S.D.; Frost, P.E.; Zyl, D.V. Assessing the effects of human-induced land degradation in the former homelands of northern South Africa with a 1 km AVHRR NDVI time-series. Remote Sens. Environ. 2004, 91, 47–67. [Google Scholar] [CrossRef]
  19. Guo, Z.L.; Huang, N.; Dong, Z.B.; Pelt, R.S.V.; Zobeck, T.M. Wind Erosion Induced Soil Degradation in Northern China: Status, Measures and Perspective. Sustainability 2014, 6, 8951–8966. [Google Scholar] [CrossRef]
  20. Petit, C.; Scudder, T.; Lambin, E. Quantifying processes of land-cover change by remote sensing: Resettlement and rapid land-cover changes in south-eastern Zambia. Int. J. Remote Sens. 2001, 22, 3435–3456. [Google Scholar] [CrossRef]
  21. Tian, F.; Fensholt, R.; Verbesselt, J.; Grogan, K.; Horion, S.; Wang, Y.J. Evaluating temporal consistency of long-term global NDVI datasets for trend analysis. Remote Sens. Environ. 2015, 163, 326–340. [Google Scholar] [CrossRef]
  22. Lyon, J.G.; Yuan, D.; Lunetta, R.S.; Elvidge, C.D. A change detection experiment using vegetation indices. Photogramm. Eng. Remote Sens. 1998, 64, 143–150. [Google Scholar]
  23. Shi, X.; Wang, W.; Shi, W. Progress on quantitative assessment of the impacts of climate change and human activities on cropland change. J. Geogr Sci. 2016, 26, 339–354. [Google Scholar] [CrossRef]
  24. Houerou, H.N.L. Rain-Use Efficiency: A Unifying Concept in Arid-Land Ecology. J. Arid Environ. 1984, 7, 213–247. [Google Scholar]
  25. Prince, S.D.; Colstoun, D.; Brown, E.; Kravitz, L.L. Evidence from rain-use efficiencies does not indicate extensive sahelian desertification. Glob. Chang. Biol. 1998, 4, 359–374. [Google Scholar] [CrossRef]
  26. Dardel, C.; Kergoat, L.; Hiernaux, P.; Grippa, M.; Mougin, E.; Ciais, P.; Nguyen, C.C. Rain-Use-Efficiency: What It Tells Us about the Conflicting Sahel Greening and Sahelian Paradox. Remote Sens. 2014, 6, 3446–3474. [Google Scholar] [CrossRef] [Green Version]
  27. Li, A.; Wu, J.; Huang, J. Distinguishing between human-induced and climate-driven vegetation changes: A critical application of RESTREND in inner Mongolia. Landsc. Ecol. 2012, 27, 969–982. [Google Scholar] [CrossRef]
  28. Wessels, K.J.; Van Den Bergh, F.; Scholes, R.J. Limits to detectability of land degradation by trend analysis of vegetation index data. Remote Sens. Environ. 2012, 125, 10–22. [Google Scholar] [CrossRef]
  29. Wessels, K.J.; Prince, S.D.; Malherbe, J.; Small, J.; Frost, P.E.; Vanzyl, D. Can human-induced land degradation be distinguished from the effects of rainfall variability? A case study in South Africa. J. Arid Environ. 2007, 68, 271–297. [Google Scholar] [CrossRef]
  30. Wessels, K.J.; Prince, S.D.; Zambatis, N.; MacFadyen, S.; Frost, P.E.; Vanzyl, D. Relationship between herbaceous biomass and 1-km2 Advanced Very High Resolution Radiometer (AVHRR) NDVI in Kruger National Park, South Africa. Int. J. Remote Sens. 2006, 27, 951–973. [Google Scholar] [CrossRef]
  31. Zhuo, L.; Cao, X.; Chen, J.; Chen, Z.X.; Shi, P.J. Assessment of grassland ecological restoration project in Xilin Gol grassland. Acta Geogr. Sin. 2007, 62, 471–480. (In Chinese) [Google Scholar]
  32. Prince, S.D.; Becker-Reshef, I.; Rishmawi, K. Detection and mapping of long-term land degradation using local net production scaling: Application to Zimbabwe. Remote Sens. Environ. 2009, 113, 1046–1057. [Google Scholar] [CrossRef]
  33. He, C.Y.; Tian, J.; Gao, B.; Zhao, Y.Y. Differentiating climate- and human-induced drivers of grassland degradation in the Liao River Basin, China. Environ. Monit. Assess. 2015, 187, 1–14. [Google Scholar] [CrossRef] [PubMed]
  34. Han, Z.; Wang, T.; Yan, C.; Yan, C.Z.; Liu, Y.B.; Liu, L.C.; Li, A.M.; Du, H.Q. Change trends for desertified lands in the Horqin Sandy Land at the beginning of the twenty-first century. Environ. Earth Sci. 2010, 59, 1749–1757. [Google Scholar] [CrossRef]
  35. Yan, Q.L.; Zhu, J.J.; Hu, Z.B.; Sun, O.J. Environmental impacts of the shelter forests in Horqin Sandy land, northeast China. J. Environ. Qual. 2011, 40, 815. [Google Scholar] [CrossRef] [PubMed]
  36. Zhang, G.; Dong, J.W.; Xiao, X.M.; Hu, Z.M.; Sheldon, S. Effectiveness of ecological restoration projects in Horqin Sandy Land, China Based on SPOT-VGT NDVI data. Ecol. Eng. 2012, 38, 20–29. [Google Scholar] [CrossRef]
  37. Yan, Q.L.; Zhu, J.J.; Zheng, X.; Jin, C.J. Causal effects of shelter forests and water factors on desertification control during 2000–2010 at the Horqin Sandy Land region, China. J. For. Res. 2015, 26, 33–45. [Google Scholar] [CrossRef]
  38. Chen, H.B.; Shao, L.Q.; Zhao, M.J.; Zhang, X.; Zhang, D.J. Grassland conservation programs, vegetation rehabilitation and spatial dependency in Inner Mongolia, China. Land Use Policy 2017, 64, 429–439. [Google Scholar] [CrossRef]
  39. Xu, L.L.; Li, B.L.; Yuan, Y.C.; Gao, X.Z.; Zhang, T. A. Temporal-Spatial Iteration Method to Reconstruct NDVI Time Series Datasets. Remote Sens. 2015, 7, 8906–8924. [Google Scholar] [CrossRef]
  40. Higginbottom, T.P.; Symeonakis, E. Assessing Land Degradation and Desertification Using Vegetation Index Data: Current Frameworks and Future Directions. Remote Sens. 2014, 6, 481–493. [Google Scholar] [CrossRef]
  41. Landmann, T.; Dubovyk, O. Spatial analysis of human-induced vegetation productivity decline over eastern Africa using a decade (2001–2011) of medium resolution MODIS time-series data. Int. J. Appl. Earth Obs. 2014, 33, 76–82. [Google Scholar] [CrossRef]
  42. Ibrahim, Y.Z.; Balzter, H.; Kaduk, J.; Tucker, C.J. Land Degradation Assessment Using Residual Trend Analysis of GIMMS NDVI3g, Soil Moisture and Rainfall in Sub-Saharan West Africa from 1982 to 2012. Remote Sens. 2015, 7, 5471–5494. [Google Scholar] [CrossRef]
  43. Savitzky, A.; Golay, M.J.E. Smoothing and Differentiation of Data by Simplified Least Squares Procedures. Anal. Chem. 1964, 36, 1627–1639. [Google Scholar] [CrossRef]
  44. Chen, J.; Jönsson, P.; Tamura, M.; Gu, Z.H.; Matsushita, B.; Eklundh, L. A simple method for reconstructing a high-quality NDVI time-series data set based on the Savitzky-Golay filter. Remote Sens. Environ. 2004, 91, 332–344. [Google Scholar] [CrossRef]
  45. Fang, J.; Piao, S.; He, J.; Ma, W.H. Increasing terrestrial vegetation activity in China, 1982–1999. Sci. China Life Sci. 2004, 47, 229–240. [Google Scholar] [CrossRef]
  46. Song, Y.; Ma, M.G. A statistical analysis of the relationship between climatic factors and the Normalized Difference Vegetation Index in China. Int. J. Remote Sens. 2011, 45, 374–382. [Google Scholar] [CrossRef]
  47. Du, J.Q.; Shu, J.M.; Yin, J.Q.; Yuan, X.J.; Jiaerheng, A.; Xiong, S.S.; He, P.; Liu, W.L. Analysis on spatio-temporal trends and drivers in vegetation growth during recent decades in Xinjiang, China. Int. J. Appl. Earth Obs. 2015, 38, 216–228. [Google Scholar] [CrossRef]
  48. Xu, L.L.; Li, B.L.; Yuan, Y.C.; Gao, X.Z.; Liu, H.J.; Dong, G.H. Changes in China’s cultivated land and the evaluation of land requisition-compensation balance policy from 2000 to 2010. Resour. Sci. 2015, 37, 1543–1551. (In Chinese) [Google Scholar]
  49. Fensholt, R.; Rasmussen, K.; Nielsen, T.T.; Mbow, C. Evaluation of earth observation based long term vegetation trends-Intercomparing NDVI time series trend analysis consistency of Sahel from AVHRR GIMMS, Terra MODIS and SPOT VGT data. Remote Sens. Environ. 2009, 113, 1886–1898. [Google Scholar] [CrossRef]
  50. Wang, H.Y.; Li, Z.Y.; Gao, Z.H.; Wu, J.J.; Sun, B.; Li, C.L. Assessment of land degradation using time series trend analysis of vegetation indictors in Otindag Sandy land. In Proceedings of the 35th IOP Conference Series: Earth and Environmental Science, Beijing, China, 22–26 April 2013; p. 17. [Google Scholar]
  51. Olsson, L.; Eklundh, L.; Ardo, J. A recent greening of the Sahel-trends, patterns and potential causes. J. Arid Environ. 2005, 63, 556–566. [Google Scholar] [CrossRef]
  52. Ahmedou, O.C.A.; Nagasawa, R.; Osman, A.E.; Hattori, K. Rainfall variability and vegetation dynamics in the Mauritanian Sahel. Clim. Res. 2009, 38, 75–81. [Google Scholar] [CrossRef]
  53. Li, Z.; Huffman, T.; Mcconkey, B.; Townley-Smith, L. Monitoring and modeling spatial and temporal patterns of grassland dynamics using time-series MODIS NDVI with climate and stocking data. Remote Sens. Environ. 2013, 138, 232–244. [Google Scholar] [CrossRef]
  54. Beurs, K.M.; de Henebry, G.M. A statistical framework for the analysis of long image time series. Int. J. Remote Sens. 2005, 26, 1551–1573. [Google Scholar] [CrossRef]
  55. Cai, B.F.; Yu, R. Advance and evaluation in the long time series vegetation trends research based on remote sensing. J. Remote Sens. 2009, 13, 1170–1186. (In Chinese) [Google Scholar]
  56. Zhu, Z.; Woodcock, C.E. Continuous change detection and classification of land cover using all available Landsat data. Remote Sens. Environ. 2014, 144, 152–171. [Google Scholar] [CrossRef]
  57. Jamali, S.; Jönsson, P.; Eklundh, L.; Ardo, J.; Seaquist, J. Detecting changes in vegetation trends using time series segmentation. Remote Sens. Environ. 2015, 156, 182–195. [Google Scholar] [CrossRef]
  58. De Jong, R.; Verbesselt, J.; Zeileis, A.; Schaepman, M.E. Shifts in global vegetation activity trends. Remote Sens. 2013, 5, 1117–1133. [Google Scholar] [CrossRef] [Green Version]
  59. Wei, Y.; Lin, H.L.; Wang, X.Y. Analysis of the impact of price factors on livestock output in China. J. Gansu Radio TV Univ. 2016, 26, 83–86. (In Chinese) [Google Scholar]
  60. Li, F.; Lawrence, D.M.; Bond-Lamberty, B. Human impacts on 20th century fire dynamics and implications for global carbon and water trajectories. Glob. Planet. Chang. 2018, 162, 18–27. [Google Scholar] [CrossRef]
  61. Veenendaal, E.M.; Torelloraventos, M.; Miranda, H.S.; Margaretesato, N.; Oliveras, I.; Langevelde, F.V.; Asner, G.P.; Lloyd, J. On the relationship between fire regime and vegetation structure in the tropics. New Phytol. 2018, 218, 153–166. [Google Scholar] [CrossRef] [PubMed]
  62. Li, T.; Wang, J.D.; Zhou, H.M.; Wang, J. Automatic detection of forest fire disturbance based on dynamic modeling from MODIS time-series observations. Int. J. Remote Sens. 2018, 39, 3801–3815. [Google Scholar] [CrossRef]
  63. Song, Y.; Jin, L.; Wang, H. Vegetation Changes along the Qinghai-Tibet Plateau Engineering Corridor since 2000 Induced by Climate Change and Human Activities. Remote Sens. 2018, 10, 95. [Google Scholar] [CrossRef]
  64. Yang, L.H.; Zhou, J.; Zhong, P.L.; Long, H.; Zhang, J.R. Lateglacial and Holocene dune evolution in the Horqin dunefield of northeastern China based on luminescence dating. Palaeogeogr. Palaeoclimatol. Palaeoecol. 2010, 296, 44–51. [Google Scholar] [CrossRef]
Figure 1. Location of the Horqin Sandy Land, China and the two study areas.
Sustainability 10 01068 g001
Figure 2. Framework of the study.
Sustainability 10 01068 g002
Figure 3. Three steps used to find the reference pixel to simulate ideal climate–vegetation relationships.
Sustainability 10 01068 g003
Figure 4. Vegetation change (a) and driving forces (b) in the Ar Horqin region.
Sustainability 10 01068 g004
Figure 5. Vegetation change (a) and driving forces (b) in the Naiman region.
Sustainability 10 01068 g005
Figure 6. Typical change areas in the Ar Horqin region: (a) a typical human-induced vegetation decrease area from the optimized residual trends method (RESTREND) method; (be) Landsat false color image maps for (a) on 09/24/2000, 09/06/2005, 09/17/2009, and 09/04/2014, respectively; (f) a typical human-induced vegetation increase area detected by the optimized RESTREND method; (gj) Landsat false color image maps for (f) on 09/24/2000, 09/06/2005, 09/17/2009, and 09/04/2014, respectively.
Sustainability 10 01068 g006
Figure 7. Typical change areas in the Naiman region (a) a typical human-induced vegetation decrease area from the optimized RESTREND method; (be) Landsat false color image maps for (a) on 09/24/2000, 09/06/2005, 09/17/2009, and 09/04/2014, respectively; (f) a typical human-induced vegetation increase area detected by the optimized RESTREND method; (gj) Landsat false color image maps for (f) on 09/24/2000, 09/06/2005, 09/17/2009, and 09/04/2014, respectively.
Sustainability 10 01068 g007
Figure 8. Photographs of in situ investigation of the circular grassland in Figure 6j, collected in August 2015.
Sustainability 10 01068 g008
Figure 9. Human-induced changes on different land covers in Ar Horqin region (a) and Naiman region (b).
Sustainability 10 01068 g009
Figure 10. (a) Amount of chemical fertilizer and (b) number of livestock at the end of each year in the two regions.
Sustainability 10 01068 g010
Table 1. Forty-five indices with different temporal combinations in each meteorological dataset (precipitation, temperature, and wind speed).
AccumulatedCode of Indices 1Total
One month1, 2, 3, 4, 5, 6, 7, 8, 99
Two months12, 23, 34, 45, 56, 67, 78, 898
Three months123, 234, 345, 456, 567, 678, 7897
Four months1234, 2345, 3456, 4567, 5678, 67896
Five months12345, 23456, 34567, 45678, 567895
Six months123456, 234567, 345678, 4567894
Seven months1234567, 2345678, 34567893
Eight months12345678, 234567892
Nine months1234567891
Total---45
1 The codes 1, 2, 3, 4, 5, 6, 7, 8, 9 represent January, February, March, April, May, June, July, August, September, respectively.
Table 2. Significant trends in the normalized difference vegetation index (NDVI) change rate ( S Δ N D V I ) in the two study areas during 2000–2014.
Significant Trend Change ( S Δ N D V I )Ar Horqin RegionNaiman Region
Rate (%)Area (km2)Rate (%)Area (km2)
<−40%0.117.60.03.2
−40–−20%0.788.10.540.0
−20–−10%0.561.50.646.8
−10–10%0.561.01.189.0
10–20%2.2281.214.21133.0
20–40%7.7983.834.02717.4
>40%6.9877.915.91272.6
Total18.62371.166.35301.9

