Abstract
The green concept has become one of the key demands of the current era of development in China. As an attempt to cope with climate change and constraints of resources and environment, the industrial green transformation is bound to have a dramatic impact on the whole society. This paper enriches the understanding of industrial green transformation by highlighting its social attributes. Combining a hybrid model with a window analysis, this paper measures the dynamic efficiency of regional industrial green transformation in China from 2006 to 2015. In general, Beijing, Tianjin, Shanghai, Jiangsu, Zhejiang, Fujian, Shandong and Guangdong obtain the best performance; industrial water use has the lowest and most unstable efficiency among various resources. Tobit regression model, thereafter, is used to analyze the impact of hypothetical factors on the efficiency of industrial green transformation. The findings demonstrate that reduction and lean management of state-owned property, promoting the development of the productive service industry, minimizing the proportion of fossil energy use and establishing an excellent economic basis can have nationally positive impacts on the regional industrial green transformation; the progress of the productive service industry is the key to industrial green transformation in Eastern China, while the internal optimization of the industrial sector should be paid more attention in other regions, especially in Western China. Finally, detailed discussions and policy suggestions at a regional level as well as research prospects are given.
1. Introduction
Since the introduction of the ‘open’ policy, China has made remarkable economic progress and transformed gradually from an agricultural country to an industrial one, ranked as the second largest economy globally. However, in part, these achievements are obviously due to long-term extensive economic growth characterized by labor-intensive and resource-intensive production modes [1,2]. As the most critical component of the national economy, on the one hand, the industrial sector has accumulated a large amount of wealth, which significantly promotes comprehensive national strength; on the other hand, some industrial by-products, such as sewage, noise, dust, and so on, have resulted in a series of negative impacts both on the ecological environment and on human society. The Chinese government has been aware of the significance of keeping the balance between environment and economy. The Twelfth Five-Year Plan [3] approved by the National People’s Congress in 2010 put an emphasis on green development for the first time, aiming at building a resource-conserving and environment-friendly society to realize the transformation and upgrading of manufacturing industry [4,5]. Furthermore, the Made in China 2025 Plan [6] and Industrial Green Development Plan (2016–2020) [7] not only positively confirm the decisive status of industrial transformation, but also emphasize its “green” style. However, the 2018 Environmental Performance Index (EPI), issued by Yale University and Columbia University [8], finds that air quality is the leading environmental threat to public health, and it also shows that China’s EPI score is 50.74, ranked at the 120th among 180 countries. China’s environmental performance is still unsatisfactory, and displays a clear gap compared with developed countries. Therefore, how to realize industrial sustainability will be a long-term and arduous task in China.
The topic of industrial green transformation derives from an array of profound reflections on unsustainable models of industrial development in current China. To date, however, few studies are directly related to this topic, which show that not only is there an ambiguous definition of industrial green transformation, but also a lack of unified measurement standard. The international rules, conventions and theoretical frameworks about sustainable development [9,10,11] have been extracted and employed in mainstream studies to evaluate the performance of industrial green transformation. Owing to the characteristics of industrial production activities, however, scholars think more about the potential of gaining economic benefits, as well as their malign environmental impacts particularly [12,13,14,15]. Consequently, the statement of industrial green transformation can be interpreted, by some scholars and institutions, as an industrial process towards “intensive energy resource utilization, reduced pollutant emissions, reduced environmental impact, improved labor productivity, and enhanced sustainable development ability” [16] (p. 6). In this context, some scholars have attempted to develop an evaluation index system for industrial sustainability. Luken and Hesp [17] analyzed the industrial policy effectiveness in developing countries on sustainable development, depending on which economic, social and environmental parameters were used to assess their contribution. Salvado et al. [18] also offered some proposals of a sustainability index for the automotive industry with 14 secondary indices based on the principle of sustainability. In view of China’s special national conditions, Li et al. [19] put forward the overall sustainable development orientation of the manufacturing industry, including structure, technology, energy and environment branch targets. Chen et al. [20] developed an evaluation index system of China’s industrial green development in the perspectives of industrial green output, efficiency, innovation and policy, and applied the analytic hierarchy process to calculate their indices’ weights and properties respectively. Although these groups of homogeneous or analogical studies commence within the integrated framework of sustainability, many index systems are difficult to be quantified objectively, or lack information. The economic and environmental terms are considered adequately on the whole, and explicit information on social impacts (e.g., structural unemployment) caused by industrial green transformation is actually insufficient [21,22], particularly in developing countries.
The industrial green transformation needs to balance relevant aspects and maximize their integrated benefits. Therefore, studies about the influencing factors of this field involve a variety of perspectives. Changes in external environment and unreasonable allocation of internal resources bring multiple constraints on industrial development, so that how to adjust the industrial structure has become the focus of industrial transformation. A reasonable industrial structure is crucial to the sustainability of industrial society [15]. Economic development level is an important guarantee for regional reform, which is conducive to increasing the substantive capital, adjusting the structure of human capital, and improving the ability of scientific and technological innovation in industrial sectors [23]. However, the fact of the Environmental Kuznets Curve (EKC) [24] indicates an uncertain relationship between economic development level and efficiency of industrial green transformation. Technological innovation is also considered by some scholars, which has been proved to be a key factor for industrial green development. Yang et al. [25], taking the energy-saving technology as an example, thought further that technological sources affected the degree of technology spillover, and the foreign direct investment (FDI) was the most important source. Midilli et al. [26] proposed seven green energy strategies, which could decrease negative effects on the industrial, technological and social progress, and thus was the particularly necessary adjustment of energy consumption structure in industrial sectors. Finally, environmental regulation, under the constraints of resources and environment, is designed to encourage green technology innovation and then mitigate environmental pollution. However, the function of environmental regulation rests with its various types, and presents pronounced regional heterogeneity [27].
It can be seen that the research object of industrial green transformation includes measurement standards and influencing factors domestically and abroad. Moreover, industrial transformation is always accompanied by technology replacement or even industrial extinction, which leads to social unrest, such as the short-term increase in unemployment. Hence, social affairs caused by industrial green transformation should be fully considered, in order to elaborate on the connotation of “green” based on the theory of the triple bottom line [28]. Given the above considerations, our research regards 30 regions in China, with the exception of Tibet, Taiwan, Hong Kong and Macau, as the research targets. A hybrid measure of desirable and undesirable outputs in data envelopment analysis (DEA), combined with a window analysis, is employed to measure the dynamic efficiency of regional industrial green transformation in consecutive years. Then we analyze and discuss its influencing factors. Unlike the previous studies, in the stage of DEA calculation, we add an indicator of unemployment on the output side, emphasizing that social harmony and stability is not only the premise of industrial green transformation, but also its core purpose. Furthermore, we provide an overall horizontal comparison of resource and pollution elements in efficiency improvement, and then point out their contribution to the efficiency of industrial green transformation. For the purpose of getting a more systematic conclusion, we draw lessons from studies available and integrate all kinds of focused influencing factors to provide sufficient evidence for industrial green transformation, nationally and regionally.
In the remainder of this paper, the DEA method with a window analysis used herein will be introduced systematically, and the analytical framework, indicator selection and data collection will also be presented. Then we present the empirical results in details and put forward some concrete improvement plans for regional industrial green transformation, followed by a conclusion of this paper.
2. Methodology and Framework
2.1. DEA Method for a Hybrid Measure of Efficiency
First developed by Charnes et al. [29], DEA is an effective nonparametric analysis method which is applied to the relative performance assessment for a homogeneous set of decision making units (DMUs). This method constructs a production frontier which satisfies Pareto Optimality—gauging the relative efficiency of each DMU by means of their inputs and outputs [30]. Since the efficiency score of DMU ranges from zero (the worst) to one (the best) by standardization, the technical efficiency gap between the objective unit and the optimal one can be expressed clearly and better understood. In addition, DEA does not involve subjective weights assigned to all indicators [31], but gain the relevant information from data themselves; it thus has great advantages in analyzing aggregation problems and forms various models in a special context. One of the most significant applications is to measure the environmental efficiency [32].
DEA efficiency implies that all DMUs on the production frontier should satisfy the fundamental prerequisite of achieving maximum outputs and minimum inputs simultaneously. However, when it comes to environmental issues, such as industrial production discussed herein, this prerequisite should be adjusted appropriately. The output side of industrial metabolism needs to be divided into two categories, including desirable (good) outputs, like all kinds of final industrial products, as well as undesirable (bad) outputs, such as industrial waste and pollution. It is obvious that the efficiency score without considering undesirable outputs, owning to their contribution to total outputs, is higher than the real one. Accordingly, undesirable outputs should be treated as a deduction for total outputs in order to make the efficiency score corresponds to its real level. In general, there are three categories for the data processing of undesirable outputs with the DEA method [33]. The first one treats undesirable outputs as inputs and adds them to a DEA model; the second one focuses on data transfer function, such as the negative output method and the (non-)linear data transfer method; and the last one is based on the distance function method by which one can increase desirable outputs and reduce undesirable outputs when the inefficient DMU is improved. This method can make up shortfalls of the former two.
In this paper, we follow the hybrid measure of efficiency with undesirable outputs, combined with the slacks-based measure (SBM) model [34], which belongs to the distance function method. A hybrid measure integrates two types of radial and non-radial approach simultaneously [31]. The radial parts are subject to change proportionally, while the non-radial parts have no proportional change. On the other hand, partial outputs have a non-separable relationship with one another, and they are also not separate from some inputs. Therefore, all variables can be categorized into separable input (xS), non-separable input (xNS), separable good output (ySG), non-separable good output (yNSG), separable bad output (ySB) and non-separable bad output (yNSB). Separable inputs are the non-radial variables which satisfy the efficiency status if no reduced input exists that can produce the observed outputs, while non-separable inputs are radial variables which satisfy the efficiency status if there is no proportionally reduced input that can produce the observed outputs [34]. Furthermore, non-separable and separable outputs have the same characteristics and can be defined analogously.
The DEA method can adopt the constant returns to scale (CRS) model and variable returns to scale (VRS) model. Compared to the VRS model, CRS model has higher discriminatory power and can prevent the emergence of systematic bias [35]. Furthermore, the CRS model also avoids potential problems of unfeasible solutions in the process of calculating mixed period efficiency. Hence, the production possibility set PNS is defined under the CRS model by:
where λ is a constant vector for the weight of each DMU. The fractional programming of a hybrid model with undesirable outputs for DMUo is as follows:
subject to:
where m = m1 + m2 and n = n1 + n2 + n3 + n4 denote the amount of input and output variables, among which m1 and m2 are numbers of separable and non-separable inputs, n1, n2, n3 and n4 are the amount of elements in separable good and bad inputs, as well as non-separable good and bad inputs, respectively. XS, XNS, YSG, YSB, YNSG and YNSB respectively denote matrices of observed variables. sS−, sNS−, sSG+, sSB+, sNSG+ and sNSB+ correspondingly denote matrices of their slacks. On the output side, a reduction in non-separable bad outputs is accompanied by a proportionate reduction in non-separable good outputs with 1 ≥ θ ≥ 0, which is designated by θyNSB and θyNSG, respectively; on the input side, the non-separable inputs are assumed to be reduced with the same proportion, denoted by θxNS. Constraint (9) means that there is an upper bound to the expansion of separable good outputs and the coefficient δ is a constant expansion ratio given externally.
DMUo is efficient if and only if ρo = 1 (i.e., sS−, sNS−, sSG+, sSB+, sNSG+, sNSB+ = 0; and θ = 1). If DMUo is inefficient (i.e., ρo < 1), it can improve through and following the projection (target value) [34]. Furthermore, we define factor efficiency index (FEI) as:
for measuring its improved direction and quantities (percentage) of each variable, that is, if FEI > 0, it means increasing the inputs and expanding the outputs; while if FEI < 0, it means decreasing the inputs and reducing the outputs; the observed value achieves the optimal level when FEI = 0.
2.2. Window Analysis
As a nonparametric frontier analysis method, DEA has the special requirements for data processing that the amount of DMUs should be at least treble numbers of the observed variables [31], in order to enhance the discriminatory power of each DMU. This paper introduces DEA window analysis [36], which can deal with the cross-sectional and time-varying data. This method abides by the principle of moving average, and treats each DMU in a different year as an entirely new one in the observed data set with a specified window width [35]. It is feasible to observe and compare how DMU performs in different periods. Moreover, this method multiplies the number of DMUs so that it can avoid inadequate DMUs.
Following the rationale of DEA window analysis, we assume that there are K DMUs (k = 1, 2, …, K) that are observed in T periods (t = 1, 2, …, T), then the total amount of DMU is TK. If the window width is d (≤T), there will be w (=T − d + 1) windows totally. Thus, the first window spans the period 1, 2, …, d; the second one spans the period 2, 3, …, d + 1; the ith one spans the period i, i + 1, …, d + i + 1. In the aspect of selecting window width, Asmild et al. [35] also point out that the window width should be as narrow as possible to eliminate the unfairness, such as the technical change over time [37]. This paper contains 30 regions (DMUs) in China over the time period spanning from 2006 to 2015. Meanwhile, the window width is fixed as 2 years so that the number of DMUs in each window increases from 30 to 60 as independent entities. The process of measuring the overall efficiency with DEA window analysis can be illustrated in Table 1. DMUs in the adjacent two years compose a new observed window, and DMU in each year has two efficiency scores due to the overlap of windows, with the exception of 2006 and 2015, which have only one value. Thus, the total mean (TMk) for the measured values in all years can evaluate the efficiency of regional industrial green transformation in horizontal comparison; while the row mean (RMi) in each year can depict continuous changes for the performance of DMUs (regions) in vertical comparison.

Table 1.
Illustration of window analysis for measuring the overall efficiency. DMU: decision making unit.
2.3. Framework and Data
The industrial green transformation refers to a radical change in industrial sectors. This paper follows the definition of industrial green transformation in [16], especially formulating the indicator of its social attribute (unemployment), to measure the 30 regions’ dynamic efficiency of industrial green transformation in China. We focus on both ends (i.e., inputs and outputs side) of industrial production, and regard the interactive relationship of internal production as a black-box which is not the key of DEA measurement. The industrial green transformation meets the theory of triple bottom line, including social, economic and environmental dimensions. Variables should be selected appropriately, in consideration of the characteristics of the DEA method, so that variables do not carry repetitive information [31].
Figure 1 depicts the framework of extended industrial production, and illustrates the relations between variables and triple bottom line. On the input side, land (x1) is introduced to judge the intensity of industrial layout [38], and it also has been capitalized as an element of industrial production [39]; labor force (x2) and investment (x3) are the most fundamental elements in the process of industrial production; water (x4) and energy (x5) are the major resources consumed by industrial sectors. On the output side, gross regional product (GRP) (y1) is a commonly used indicator for wealth accumulation and economic development, and it is the core output of industrial production; we regard unemployment (y2) as the alternative variable of social stability, because transformation may cause the turbulence of a particular industry, so that stable employment is a crucial focused principle of industrial green transformation; waste water (y3) and waste gas (y4) are the main forms of pollution of the production process, which has negative impacts on efficiency studies. Among all observed variables, x4 and x5 directly involve with y3 and y4, and they are non-separable variables; x1, x2, x3 while y1, y2 are separable variables. Meanwhile, outputs are divided into good outputs (y1) and bad outputs (y2, y3 and y4). The data resources are drawn from China Statistical Yearbook [40], China Statistical Yearbook on Environment [41], China Energy Statistical Yearbook [42], China Industry Statistical Yearbook [43] and China Urban Construction Statistical Yearbook issued by China Statistics Press [44] from 2006 to 2015. The statistical description of the data is presented in Table 2.
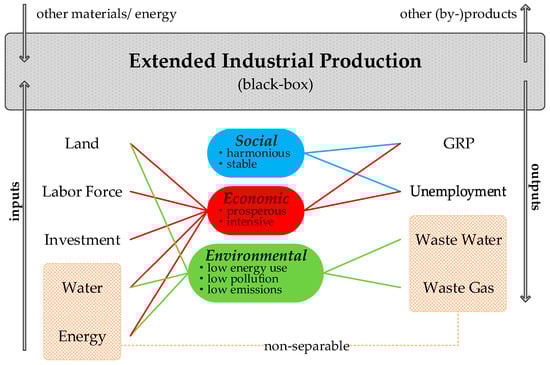
Figure 1.
Framework of extended industrial production for industrial green transformation with data envelopment analysis (DEA) method.
Table 2.
Descriptive statistics of the variables for 30 regions in China (2006–2015) 1.
3. Results
Following the explanation of the hybrid measure and collected data, this paper utilizes MaxDEA Ultra software (Realworld Software Co., Ltd., Beijing, China) to measure the efficiency of the industrial green transformation in 30 regions of China from 2006 to 2015, and reports further the potential of resource saving and pollutant emission reduction in the light of their respective slack variables.
3.1. The Overall Efficiency of Regional Industrial Green Transformation and the Trends Over Time
Table 3 shows the averages of the overall efficiency score in China over time, which presents a rising trend in fluctuation (there was a slight decline in 2010, 2013 and 2015, respectively). It also lists the 30 regions’ respective efficiency score of industrial green transformation from 2006 to 2015 and the ranking according to their efficiency scores on average over the ten years.
Table 3.
Thirty regions’ overall efficiency with window analysis yearly 1.
From the statistical results (Table 3), we can gain the following information: (1) the best performance of industrial green transformation includes two regions, Tianjin and Guangdong, whose annual efficiency score is equal to 1 (DMUs lie on the optimal frontier) in most of the years, and the average efficiency score over ten years is more than 0.95. This also means that these two regions are the most efficient in converting resources into social, economic and environmental products, comparing to other regions; (2) the suboptimal regions (the average efficiency score is greater than 0.85 and less than 0.95) upgrade to a year’s benchmark (e.g., Beijing in 2010, Shanghai in 2011, Jiangsu in 2012, Zhejiang in 2010, Fujian in 2014 and Shandong in 2015; their efficiency score is equal to 1), and they are relatively efficient in a certain year; (3) three regions, Guizhou (0.267), Gansu (0.296) and Ningxia (0.226), located in the west of China, have the lowest average efficiency scores below 0.3, and give the worst performance of industrial green transformation; (4) among 30 regions, Qinghai gains the highest standard (0.280) which reflects the fluctuation of efficiency scores from 2006 to 2015; the industrial green transformation of Qinghai is absolutely efficient in 2014 and 2015, whereas its efficiency score only achieves 0.318 in 2006, which causes a significant gap among years.
Figure 2 schematically shows the intuitive diversity in efficiency among regions. The whole efficiency interval is divided into five segments. In addition to the two benchmark regions whose average overall efficiency score is greater than 0.95, we observe that those regions whose average overall efficiency score is no less than 0.85 also effectively achieve regional industrial green transformation, including Beijing (0.935), Shanghai (0.904), Jiangsu (0.919), Zhejiang (0.872), Fujian (0.896) and Shandong (0.937). Therefore, it can be clearly visualized that regions with remarkable achievements of industrial green transformation are distributed in North China centering on Beijing and spreading along the southeast coast. In these areas, the phenomenon of urban and industrial agglomeration is remarkable, which brings the naissance of the three largest economic circles, namely the Jing-jin-ji, Yangtze River Delta and Pearl River Delta economic cooperative zones. As the core of the Jing-jin-ji cooperative zone, as well as the political, economic and cultural center of China, Beijing hosts vigorous industrial activities and has enjoyed a considerable development by constant accumulation. Not only do industrial sectors attract a large amount of investment, human capital and technology, but also government’s policies can be effectively implemented and monitored, owing to its special status and location. On the other hand, as the window of reform and open policy, southeast coastal areas have gained long-term policy supports, especially in Jiangsu, Zhejiang and Guangdong where the introduction of foreign capital not only brings the advanced technology, but also contribute to a profound reform in the industrial structure. In addition, there are many port cities in southeast coastal areas, which is conducive to their international exchange and co-operation, and promotes capital-intensive or technology-intensive industry to form a strong pillar, and then the production service industry was born and developed. The multiplier effect of port development is released, and the regional competitiveness is significantly enhanced. Figure 2 also depicts that regions in Midwest and Northeast have a bad performance of industrial green transformation, where the efficiency score of most regions is less than 0.7. Thus, the industrial green transformation path of these regions needs to be re-planned thoroughly and draw lessons from the experience of regions with good performance.
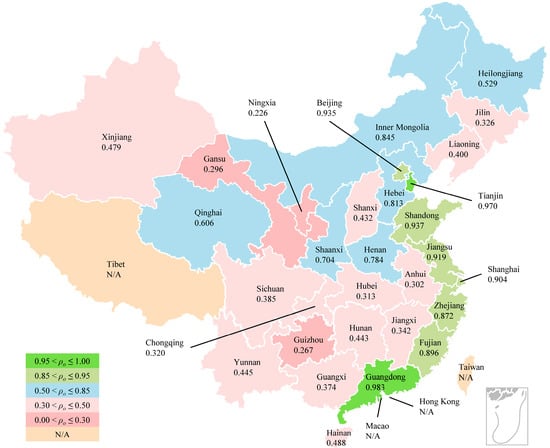
Figure 2.
Map of efficiency level of industrial green transformation in 30 regions of China. The efficiency score is divided into five grades, the interval of (0.95,1.00) is the optimal level, the interval of (0.85,0.95) is the sub optimal level, the interval of (0.50,0.85) is the average level, the interval of (0.30,0.50) is the poor level, and the interval of (0.00,0.30) is the worst level; due to the lack of data and inconsistency in statistical caliber, Tibet, Taiwan, Hong Kong and Macau are not included in this map.
3.2. Resource and Pollution Efficiency
In the process of measuring the overall efficiency score, MaxDEA Ultra software is used to present the direction of slack movement of all variables and calculate their projection values. With these data and Equation (11), we can acquire the average FEI of the 30 regions in China between 2006 and 2015 (Figure 3). Resource and pollution mainly refer to the economic and environmental attribute of industrial green transformation, including land, labor force, investment, water, electricity and land, as well as waste water and waste gas. From the line chart, all variables’ FEI is beneath 0, which indicates that there needs to be a reduction for the observed values of these variables in order to make resource consumption and pollution emissions more efficient. Among all the above indicators, FEI of labor force is the closest to the horizontal zero line, which explains that the efficiency of labor force is relatively the best; while water obtains a minimum value of FEI, it needs a great improvement to reach the goal of projection value. The performance of the remaining indicators is somewhere in between.
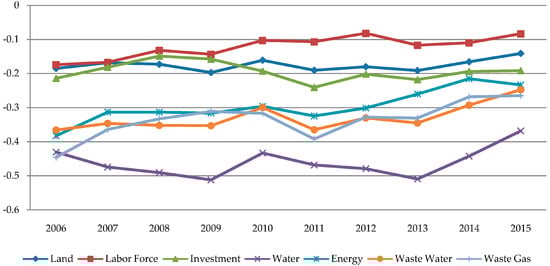
Figure 3.
Average factor efficiency index (FEI) of 30 regions in China from 2006 to 2015.
From the perspective of resource efficiency, the indicator of labor force has a relatively good performance, followed by land and investment, whose FEI curve remains stable between −0.2 and −0.1 over the ten years. Specifically, there is a continuous improvement in efficiency of labor force, in line with the trend of transforming the endowment structure in industrial sectors from a labor-intensive style to a capital-intensive one. The efficiency of land and investment has been steady so that there is room for promotion. Energy efficiency is lower than the former three, but it is better to have a rising trend, which is inextricably linked to the fact that the current energy crisis has forced its reform, and the utilization of energy has been improved with technological progress. China is a country with a shortage of water resources, and the rapid development of industry has exacerbated this situation. In the chart, the efficiency of industrial water is a severe issue, and exhibits a significant wave shape during the research period. How to improve the efficiency of water use is a major challenge for industrial sectors in the future.
From the perspective of pollution efficiency, FEI curves of waste water and waste gas coincide with each other, and present a trend of gradual improvement. In addition to the influence of the inherent economic cycle factors, the biggest restriction of China’s economic development in recent years lies in the environmental issues, which have aroused wide attention, including the academia, government and residents. Most of the pollutants are mainly derived from the production activities of the heavy chemical industry, so that the industrial reform with the idea of green transformation has become a long-term national policy. What is worth affirming is that the continuous adjustment of energy consumption structure and the application of green technology have a great contribution to enhancing the environmental quality. However, the emergence of environmental crisis is not a short duration of time, and it is a process of constant accumulation from quantitative to qualitative change. Therefore, the treatment of environmental pollution should be sustained, and be more targeted.
4. Discussion
In the preceding section, we utilize the nonparametric DEA method to measure the overall efficiency based on five input variables and four output variables. The results not only describe the holistic performance of China's industrial green transformation in the past ten years, but also present the differences and trends of efficiency among 30 regions. As shown in Figure 1, however, the calculation process of the DEA method does not reveal the black-box to analyze the internal logic structure and its interrelation; or in other words, what are the critical factors that can affect the overall efficiency? To solve this problem the econometric methods will be used accordingly.
4.1. Presumption of Influencing Factors and Their Regression Results
According to Equation (2) and its implication, the overall efficiency conveys the information about social, economic and environmental factors. From the literature review mentioned in the Section 1 (introduction), the mainstream of related studies decomposes the influencing factors into industrial structure, environmental regulation, technological innovation, energy structure, economic development level [45,46,47,48], to name a few. This paper will also use these similar indicators as influencing factors for the industrial green transformation. The sales output value share of pollution-intensive industry is selected to indicate the second industrial structure (X1). In China, the industrial water and air pollution are the most serious challenges for environmental governance. Accordingly, related and influential industrial sectors, including power, textile and paper [49], are regarded as the representatives of pollution-intensive industry. State-owned property has so large a proportion of the national wealth that we use the proportion of sales output value of state-owned industry in gross industrial sales output value to represent the ownership structure (X2). Endowment structure (X3) is measured by the capital-labor ratio of industrial sector. Data of capital is obtained with the method of perpetual inventory, and the ratio is via logarithmic processing. The productive service industry is usually defined as an industry which maintains the continuity of industrial production process, promotes the technological progress, and then improves the production efficiency. Thus, the concentration of productive service industry (X4) is selected as an influencing factor, measured by the proportion of employment in productive service industry. Investment in treatment of industrial pollution belongs to one of the forms of environmental regulation (X5). Here we use the proportion of environmental investment budget over regional GDP as an influencing factor to measure its contribution to the overall efficiency. The percentage of thermal power generation over total power generation (or total electricity consumption, taking the larger one) is one of the expression forms for energy structure (X6). The thermal power represents the energy consumption and conversion of coal-based fossil fuels, and the higher the percentage, the worse the clean energy use. The GDP per capita can be referred to as measuring the regional economic development level (X7). Meanwhile, we introduce the square of the GDP per capita in the model in view of the impact of EKC, and the logarithm is also taken for this variable. In addition, what needs to be stressed is that this paper does not adopt the technical progress due to the difficulty of its characterization. The number of scientific researchers and patents or R&D investment are mainly regarded as the variables of measuring the technical progress in relevant literature reviews [13,50], but it is not suitable for our research because of the missing data and inconsistent statistical caliber.
In this paper, the dependent variable, namely the overall efficiency score, can only range from 0 to 1. Since the dependent variable is truncated or censored, the regression model of ordinary least squares (OLS) may generate asymptotically biased estimators [51]. To overcome the impact of truncated or censored data, we resort to the limited dependent variable model [52], namely the Tobit model proposed by Tobin [53]. Here, we employ Tobit regression with log maximum likelihood estimation to investigate the relationship between overall efficiency and variables mentioned above. The Tobit model for our research is provided as follows:
In the equation, the dependent variable Y denotes the overall efficiency score collected from the results of DEA measurement; βj (j = 0, 1, …, 8) denotes the estimated parameters that respectively correspond to the intercept (constant term) and the regression coefficients of independent variables; ε is the random error which obeys the normal distribution; the subscript i and t refer to region and year. Utilizing EViews 9.0 software (IHS Global Inc., Irvine, CA, USA), we get Tobit regression results in Table 4.
Table 4.
Results of Tobit regression model 1.
4.2. Transition Pathways from National and Regional Perspective
Table 4 explains the impact of second industrial structure, ownership structure, endowment structure, concentration of productive service industry, environmental regulation, energy structure, and economic development level on the overall efficiency of China’s industrial green transition. Moreover, the selected 30 regions are divided into three parts based on their geographical locations, including Eastern China, Central China and Western China. Then we discuss different transition pathways among regions in order to explore a relatively feasible scheme for the regional industrial green transformation in China. The model consists of two categories, one of which contains a quadratic term for the investigation of environmental Kuznets effect. Details are summarized as follows.
First, the second industrial structure represents the share of each sector in sales output value, and growth in one sector means shrink in other sectors. The regression results show that the variable of second industrial structure does not pass the significance test in the whole nation, Central and Western China, which means that changes in second industrial structure have a quite weak impact on the performance of industrial green transformation. However, regions in Eastern China have been in a significantly negative relationship between second industrial structure and overall efficiency score, or in other words, decreasing the proportion of pollution-intensive industry is beneficial to its green transformation. The results reveal that Western China, compared to other regions with higher industrialization level, has a relatively weak industrial base which is barely strong enough to support the industrial green transformation, and its industrial development still needs to rely on pollution-intensive industry in the short term. It is also worth mentioning that there is still a negative correlation, although the coefficient is not significant, in Central China. Consequently, the gradual replacement of pollution-intensive industry is a prerequisite for its industrial green transformation.
Second, from a national perspective, the ownership structure has had a significantly negative impact on the overall efficiency score, with one percent decline in the proportion of state-owned property and 0.16% growth in the overall efficiency score. Intuitively, the oversize of state-owned property is not conducive to industrial green transformation. However, it is not to say that it is a necessary way to cut down the proportion of state-owned property, and the key is to realize its optimization and upgrading [16]. Meanwhile, the reform of state-owned enterprises needs to take into account of a series of social problems such as unemployment. In Western China, for example, the ownership structure has been a significantly positive impact on the overall efficiency score, that is, with a one percent increase in the proportion of state-owned property, the score will increase by 0.5% accordingly. The state-owned enterprise is often considered to be a representative of low efficiency [54]. However, Western China’s level of industrialization and infrastructure is relatively backward. With the strong economic strength, state-owned enterprises can play a greater role in promoting early industrial development in the region. By comparison, it is very difficult for private or foreign enterprise to undertake social responsibility due to the profit-driven nature of capital. Thus, a positive correlation between ownership structure and overall efficiency score is evident.
Third, capital deepening is the inevitable trend of industrial transformation and upgrading, but there is an obvious difference in the influential direction from the regional perspective. The positive effect appears but not significantly in the whole nation, Eastern and Central China, while the negative effect is obvious in Western China. According to the stage characteristics of industrial development, capital deepening is currently dominated by heavy chemical industry, which will aggravate the environmental pollution and ecological crisis. By contrast, Eastern and Central China have a comparative advantage in technology and capital structure, which can offset the negative impact on the environment [20], so that the positive effect is reasonable to a certain extent. Moreover, Eastern China is better than Central China, in terms of the influence degree, which is consistent with their respective technical level.
Fourth, the productive service industry fills the gap among various industries, and becomes a booster for improving the efficiency of industrial production [55]. On the whole, the concentration of productive service industry is beneficial to the industrial green transformation, and has a deeper impact in Eastern China. By comparison, this effect is negative in Western China, although the significance test is not passed. The reason for this disparity could be that the productive service industry has the characteristics of strong specialty and active innovation, and the release of impetus needs industrial integration and coordination as a prerequisite. It is obvious that Eastern China has an excellent industrial base and industrial diversification, providing a platform for the development of a productive service industry which reacts to the industrial sectors and leads them to the high-end of industrial value chain.
Fifth, the impact of environmental regulation on the overall efficiency score is quite different, and there is a negative coefficient in the whole nation, Central and Western China, while a positive one occurs in Eastern China. The literature shows that the effect of environmental regulation varies in types [27]. In this paper, the data selected belong to command-control environmental regulation in view of their availability. In Central China, the most polluted region, the significant negative coefficient implies that command-control environmental regulation plays an opposite role in industrial green transformation. The possible reason is that the command-control environmental regulation cannot effectively promote green technological innovation to control the environmental pollution, but increase the economic burden of enterprises, as well as the possibility of increasing production by polluting enterprises.
Sixth, the proportion of thermal power generation is regarded as the main indicator of energy structure. This variable has a significant negative impact on the overall efficiency score nationally, that is, a one percent decline in the proportion of thermal power generation and 0.16% growth in the overall efficiency score accordingly. Coal-based fossil fuels are not only the major industrial energy, but also the main contributor to air pollution. Although the reduction of fossil fuels is likely to cause the replacement of related industries, it is imperative, in the long run, to reduce the proportion of fossil energy use gradually and explore alternative energy sources.
Finally, the economic development level affects the performance of regional industrial green transformation through two paths. On the one hand, the strong economy usually means sufficient funds and resources to be allocated and transferred, which can provide excellent infrastructure and fiscal policy, as well as introduce advanced technology and talents, and all these will contribute to the implementation of industrial green transformation; on the other hand, the environmental pollution degree changes along the inverted “U-shaped” curve with the improvement of the economic development level, and then affects the performance of industrial green transformation with indeterminate results. We represent the economic development level by the GDP per capita. Table 4 indicates that the economic development level, as a whole, plays a positive role in the performance of industrial green transformation. In addition, the square term of the GDP per capita has a significant coefficient, with an inverted “U-shaped” relationship between economic development level and overall efficiency score in Central China, and a “U-shaped” in Western China. This diversity among regions has also been confirmed by some scholars [56]. From the results of the regression, it is worth noting that the inverted “U-shaped” curve in central China indicates the existence of a vertex. Once across this vertex, the economic development level will have an adverse effect on industrial green transformation.
5. Conclusions
The industrial sector is the lifeblood of the national economy, and it has laid a solid foundation for the development of other sectors. As the biggest developing country in the world, China's development has attracted worldwide attention, along with some serious problems. Based on a sound relevant literature review, we conceptualized the industrial green transformation with reference to the theory of triple bottom line, setting input and output variables which can reflect the economic, social and environmental dimensions comprehensively, especially the social attributes of industrial green transformation. According to the research objectives and the characteristics of variables, we utilized the DEA method in a hybrid model with undesirable outputs to measure the performance of industrial green transformation, and gave overall efficiency scores of 30 regions in China with a time span from 2006 to 2015, respectively. The results show that regions with the best performance of industrial green transformation includes Beijing, Tianjin, Shanghai, Jiangsu, Zhejiang, Fujian, Shandong and Guangdong, whose average overall efficiency score is more than 0.85. From the perspective of geographical location, regions in the southeast coast have a better performance than other regions. Meanwhile, DEA software was used to provide the projection value of each variable, followed by the introduction of the FEI to measure their improved direction and quantities. The results of FEI show that the variables of resource and pollution need to reduce their corresponding input or output value in order to improve the overall efficiency score.
In the first stage, we gained the relative overall efficiency score by the DEA method, but did not clarify exactly what affects the overall efficiency score. Since the dependent variable (overall efficiency score), which ranges from 0 to 1, is truncated or censored, we employed Tobit model in the second stage to regress the following hypothetical affecting variables, including industrial structure, ownership structure, endowment structure, concentration of productive service industry, environmental regulation, energy structure and economic development level. The regression results reveal significant differences at national and regional levels. Nationally, variables of industrial structure, endowment structure and environmental regulation have a weak impact on the performance of industrial green transformation, and the other three variables pass the significance test, in which the concentration of the productive service industry, energy structure and economic development level can increase the overall efficiency score, while the ownership structure has the opposite effect. Analogously, we discussed the affecting factors at the regional level.
On the one hand, the essence of industrial green transformation is to persistently boost productivity under the unified framework of economy, society and environment. On the other hand, policy making should not only meet the national interests, but also focus on the actual situation of regional development. Therefore, targeted comprehensive policy making is the most important prerequisite for the implementation of industrial green transformation. According to the results of the two stages, this paper can provide some policy implications. First, the second industrial structure should be continuously optimized. In particular, the state-owned enterprises must apply the principle of efficient and simple administration, gradually completing the transfer of inefficient state-owned property and cutting the excessive industrial capacity. Relying on technical advantages and developed private enterprises, Eastern China should focus on the development of advanced manufacturing industry at the core of capital-intensive enterprises and productive service industry, so that the combination of the two sectors promotes the diffusion of advanced and green technology, and then drives the industrial green transformation in Central and Western China. Conversely, when the regions with a poor performance of industrial green transformation attract all kinds of capital or accept the transfer of eastern industry, the governments should pay more attention to the environmental impact from the new industry, obtaining the win-win of economic benefit and ecological sustainability. Second, although the increased proportion of clean energy use is the inevitable trend, in the short term, the promotion of fossil energy efficiency is the top priority, in order to reduce various pollution emissions. Therefore, the governments could actively guide enterprises to introduce green technology and equipment, encouraging the innovation of green technologies and improving the efficiency of resource and energy use. Meanwhile, the consumption of fossil energy should be controlled by means of price mechanism as an auxiliary policy, and be gradually replaced by clean and renewable energy. Furthermore, for the coal producing provinces, the structural adjustment of energy industry may lead to a rise in the unemployment rate in related industries, so that the governments should properly arrange the transfer of labor force, ensuring the social stability and the normal operation of the economy. Third, the industrial green transformation needs a better environmental regulation system. The proposed scheme is not only to meet the principle of terminal reduction, but also to focus on source reduction. Therefore, taking the command-control and market-incentive environmental regulation as a core, the local governments should carry out differentiated and dynamic standards of environmental regulation, strengthening the law enforcement, improving the fiscal and taxation policies (e.g., environmental protection tax started from 2018 in China), and then maximizing the effectiveness of environmental regulation. What needs to be considered is that the environmental regulation in Central China should take full account of the characteristics of its current energy structure, and then encourage enterprises to strengthen the innovation of pollution control technology to achieve the green production. Finally, the industrial green transformation is a dynamic process and simultaneously an interactive outcome between governments and enterprises. Increasing investment is expected to be put in environmental education along with the function of a reward mechanism exerted to mobilize enterprises’ enthusiasm on energy conservation and emissions reduction, thus enabling industrial enterprises to consciously carry out green actions.
With the following limitations, future research is to be carried out to better satisfy the queries. First, the DEA method requires that the number of DMUs and variables should satisfy certain conditions. The selection of variables is limited and more information of the research object cannot be fully revealed. Second, the lack of relevant data (e.g., environmental regulation) and inconsistent scale (e.g., energy structure) have brought some difficulties for formulating a holistic policy for the industry in question. Third, limited by the length of this paper, we did not consider the lag effect of environmental investment. Only when these problems are solved can we provide adequate information for policy makers to formulate strategies for industrial green transformation.
Acknowledgments
This paper is supported by National Social Science Foundation (Grant No. 14AZD090), Natural Science Foundation of Liaoning Province (Grant No. 201602177), Postdoctoral Science Foundation of China (Grant No. 2017M611232) and National Natural Science Foundation of China (Grant No. 71320107006). In addition, many thanks to anonymous reviewers for their valuable suggestions.
Author Contributions
Jinpeng Fu and Chunyou Wu conceived and designed the experiments; Jinpeng Fu and Lingling Guo performed the experiments; Jinpeng Fu, Guirong Xiao and Lingling Guo analyzed the data; Jinpeng Fu and Guirong Xiao wrote the paper.
Conflicts of Interest
The authors declare no conflict of interest.
References
- Li, Y.; Sun, L.; Feng, T.; Zhu, C. How to reduce energy intensity in China: A regional comparison perspective. Energy Policy 2013, 61, 513–522. [Google Scholar] [CrossRef]
- Su, Y.; Liu, Z. The impact of foreign direct investment and human capital on economic growth: Evidence from Chinese cities. China Econ. Rev. 2015, 37, 97–109. [Google Scholar] [CrossRef]
- The National People’s Congress of the People’s Republic of China. The Twelfth Five-Year Plan for National Economic and Social Development of the People’s Republic of China. Available online: http://www.npc.gov.cn/wxzl/gongbao/2011-08/16/content_1665636.htm (accessed on 7 January 2018).
- Cheong, T.S.; Wu, Y. The impacts of structural transformation and industrial upgrading on regional inequality in China. China Econ. Rev. 2014, 31, 339–350. [Google Scholar] [CrossRef]
- Kuai, P.; Li, W.; Cheng, R.; Cheng, G. An application of system dynamics for evaluating planning alternatives to guide a green industrial transformation in a resource-based city. J. Clean. Prod. 2015, 104, 403–412. [Google Scholar] [CrossRef]
- The State Council of the People’s Republic of China. Made in China 2025 Plan. Available online: http://www.gov.cn/zhengce/content/2015-05/19/content_9784.htm (accessed on 7 January 2018).
- Ministry of Industry and Information Technology. Industrial Green Development Plan (2016–2020). Available online: http://www.miit.gov.cn/n1146295/n1652858/n1652930/n3757016/c5143553/content.html (accessed on 7 January 2018).
- Environmental Performance Index (EPI). Available online: http://www.epi.yale.edu/ (accessed on 23 January 2018).
- Global Reporting Initiative (GIR). Sustainability Reporting Guidelines; Global Reporting Initiative: Amsterdam, The Netherlands, 2006. [Google Scholar]
- United Nations Environment Programme (UNEP). Green Economy: Metrics and Indicators; United Nations Environment Programme: Geneva, Switzerland, 2012. [Google Scholar]
- Organization for Economic Co-operation and Development (OECD). Towards Green Growth; OECD Publishing: Paris, France, 2011. [Google Scholar]
- Vellinga, P.; Herb, N. Industrial Transformation Science Plan, IHDP Report No. 12; International Human Dimensions Programme on Global Environmental Change: Bonn, Germany, 1999; pp. 1–5. [Google Scholar]
- Zhou, X.; Zhang, J.; Li, J. Industrial structural transformation and carbon dioxide emissions in China. Energy Policy 2013, 57, 43–51. [Google Scholar] [CrossRef]
- Yu, C.; Dijkema, G.P.J.; De Jong, M. What makes eco-transformation of industrial parks take off in China? J. Ind. Ecol. 2015, 19, 441–456. [Google Scholar] [CrossRef]
- Chen, S.; Jefferson, G.H.; Zhang, J. Structural change, productivity growth and industrial transformation in China. China Econ. Rev. 2011, 22, 133–150. [Google Scholar] [CrossRef]
- Chinese Academy of Social Sciences (CASS). A study on the green transformation of Chinese industry. China Ind. Econ. 2011, 4, 5–14. (In Chinese) [Google Scholar]
- Luken, R.A.; Hesp, P. The contribution of six developing countries’ industry to sustainable development. Sustain. Dev. 2007, 15, 242–253. [Google Scholar] [CrossRef]
- Salvado, M.F.; Azevedo, S.G.; Matias, J.C.O.; Ferreira, L. M. Proposal of a sustainability index for the automotive industry. Sustainability 2015, 7, 2113–2144. [Google Scholar] [CrossRef]
- Li, P.; Wang, Q.; He, J.; Wu, B. The construction of the index system of sustainable development of China’s manufacturing sector and forecast. China Ind. Econ. 2010, 5, 5–15. (In Chinese) [Google Scholar]
- Chen, C.; Han, J.; Fan, P. Measuring the level of industrial green development and exploring its influencing factors: Empirical evidence from China’s 30 provinces. Sustainability 2016, 8, 153. [Google Scholar] [CrossRef]
- Luken, R.; Castellanos-Silveria, F. Industrial transformation and sustainable development in developing countries. Sustain. Dev. 2011, 19, 167–175. [Google Scholar] [CrossRef]
- Ramaswami, A.; Weible, C.; Main, D.; Heikkila, T.; Siddiki, S.; Duvall, A.; Pattison, A.; Bernhard, M. A social-ecological-infrastructural systems framework for interdisciplinary study of sustainable city systems: An integrative curriculum across seven major disciplines. J. Ind. Ecol. 2012, 16, 801–813. [Google Scholar] [CrossRef]
- Yao, Y.; Fan, X.; Zhang, S. Resources enrichment area: Resources endowment and the regional economic growth. Manag. World 2014, 7, 172–173. (In Chinese) [Google Scholar]
- Stern, D.I. The rise and fall of the environmental Kuznets curve. World Dev. 2004, 32, 1419–1439. [Google Scholar] [CrossRef]
- Yang, Z; Shao, S.; Yang, L.; Liu, J. Differentiated effects of diversified technological sources on energy-saving technological progress: Empirical evidence from China’s industrial sectors. Renew. Sustain. Energy Rev. 2017, 72, 1379–1388. [Google Scholar] [CrossRef]
- Midilli, A.; Dincer, I.; Ay, M. Green energy strategies for sustainable development. Energy Policy 2006, 34, 3623–3633. [Google Scholar] [CrossRef]
- Peng, X.; Li, B. Study on industrial transformation in China under different types of environment regulation. J. Financ. Econ. 2016, 7, 134–144. (In Chinese) [Google Scholar]
- Elkington, J. Partnerships from cannibals with forks: The triple bottom line of 21st-century business. Environ. Qual. Manag. 1998, 8, 37–51. [Google Scholar] [CrossRef]
- Charnes, A.; Cooper, W.W.; Rhodes, E. Measuring the efficiency of decision making units. Eur. J. Oper. Res. 1978, 2, 429–444. [Google Scholar] [CrossRef]
- Ramanathan, R. An analysis of energy consumption and carbon dioxide emissions in countries of the Middle East and North Africa. Energy 2005, 30, 2831–2842. [Google Scholar] [CrossRef]
- Cooper, W.W.; Seiford, L.M.; Tone, K. Data Envelopment Analysis: A Comprehensive Text with Models, Applications, Reference and DEA-Solver Software, 2nd ed.; Springer: New York, NY, USA, 2007. [Google Scholar]
- Fujii, H.; Cao, J.; Managi, S. Firm-level environmentally sensitive productivity and innovation in China. Appl. Energy 2016, 184, 915–925. [Google Scholar] [CrossRef]
- Song, M.; An, Q.; Zhang, W.; Wang, Z.; Wu, J. Environmental efficiency evaluation based on data envelopment analysis: A review. Renew. Sustain. Energy Rev. 2012, 16, 4465–4469. [Google Scholar] [CrossRef]
- Tone, K.; Tsutsui, M. Applying an efficiency measure of desirable and undesirable outputs in DEA to U.S. electric utilities. J. Cent. Cathedra 2011, 4, 236–249. [Google Scholar] [CrossRef]
- Asmild, M.; Parad, J.C.; Aggarwall, V.; Schaffnit, C. Combining DEA window analysis with the Malmquist index approach in a study of the Canadian banking industry. J. Prod. Anal. 2004, 21, 67–89. [Google Scholar] [CrossRef]
- Charnes, A.; Clark, C.T.; Cooper, W.W.; Golany, B. A developmental study of data envelopment analysis in measuring the efficiency of maintenance units in the US Air Forces. Ann. Oper. Res. 1984, 2, 95–112. [Google Scholar] [CrossRef]
- Zhang, X.; Cheng, X.; Yuan, J.; Gao, X. Total-factor energy efficiency in developing countries. Energy Policy 2011, 39, 644–650. [Google Scholar] [CrossRef]
- Erb, K.-H. How a socio-ecological metabolism approach can help to advance our understanding of changes in land-use intensity. Ecol. Econ. 2012, 76, 8–14. [Google Scholar] [CrossRef] [PubMed]
- Biddle, J. Retrospectives: The introduction of the Cobb-Douglas regression. J. Econ. Perspect. 2012, 26, 223–236. [Google Scholar] [CrossRef]
- National Bureau of Statistics of China. China Statistical Yearbook 2006–2015; China Statistics Press: Beijing, China, 2017.
- Ministry of Environmental Protection. China Statistical Yearbook on Environment 2006–2015; China Statistics Press: Beijing, China, 2016.
- Bureau of Statistics of China. China Energy Statistical Yearbook 2006–2015; China Statistics Press: Beijing, China, 2017.
- Bureau of Statistics of China. China Industry Statistical Yearbook 2006–2015; China Statistics Press: Beijing, China, 2017.
- Ministry of Housing and Urban-Rural Development. China Urban Construction Statistical Yearbook 2006–2015; China Statistics Press: Beijing, China, 2017.
- Dai, H.; Xie, X.; Xie, Y.; Liu, J.; Masui, T. Green growth: The economic impacts of large-scale renewable energy development in China. Appl. Energy 2016, 162, 435–449. [Google Scholar] [CrossRef]
- Shao, S.; Luan, R.; Yang, Z.; Li, C. Does directed technological change get greener: Empirical evidence from Shanghai’s industrial green development transformation? Ecol. Indic. 2016, 69, 758–770. [Google Scholar] [CrossRef]
- Xie, H.; Wang, W.; Yang, Z.; Choi, Y. Measuring the sustainable performance of industrial land utilization in major industrial zones of China. Technol. Forecast. Soc. Chang. 2016, 112, 207–219. [Google Scholar] [CrossRef]
- Feng, C.; Wang, M.; Liu, G.; Huang, J. Green development performance and its influencing factors: A global perspective. J. Clean. Prod. 2017, 144, 323–333. [Google Scholar] [CrossRef]
- Fujii, H.; Managi, S. Wastewater management efficiency and determinant factors in the Chinese industrial sector from 2004 to 2014. Water 2017, 9, 586. [Google Scholar] [CrossRef]
- Yin, J.; Zheng, M.; Chen, J. The effects of environmental regulation and technical progress on CO2 Kuznets curve: An evidence from China. Energy Policy 2015, 77, 97–108. [Google Scholar] [CrossRef]
- Kennedy, P. A Guide to Econometrics, 6th ed.; John Wiley & Sons, Ltd.: Hoboken, NJ, USA, 2008. [Google Scholar]
- McDonald, J.F.; Moffitt, R.A. The use of Tobit analysis. Rev. Econ. Stat. 1980, 62, 318–321. [Google Scholar] [CrossRef]
- Tobin, J. Estimation of relationships for limited dependent variables. Econometrica 1958, 26, 24–36. [Google Scholar] [CrossRef]
- Qu, Q. Corporate governance and state-owned shares in China listed companies. J. Asian Econ. 2003, 14, 771–783. [Google Scholar]
- Yang, R.; Liu, C. The industrial upgrading against the background of integration between productive service industry and manufacturing industry. Reform 2011, 203, 40–46. (In Chinese) [Google Scholar]
- Fujii, H.; Managi, S. Economic development and multiple air pollutant emissions from the industrial sector. Environ. Sci. Pollut. Res. 2016, 23, 2802–2812. [Google Scholar] [CrossRef] [PubMed]
© 2018 by the authors. Licensee MDPI, Basel, Switzerland. This article is an open access article distributed under the terms and conditions of the Creative Commons Attribution (CC BY) license (http://creativecommons.org/licenses/by/4.0/).