Effect of Crack on Durability of RC Material under the Chloride Aggressive Environment


Abstract
:1. Introduction
2. Materials and Methods
2.1. Materials and Mixture
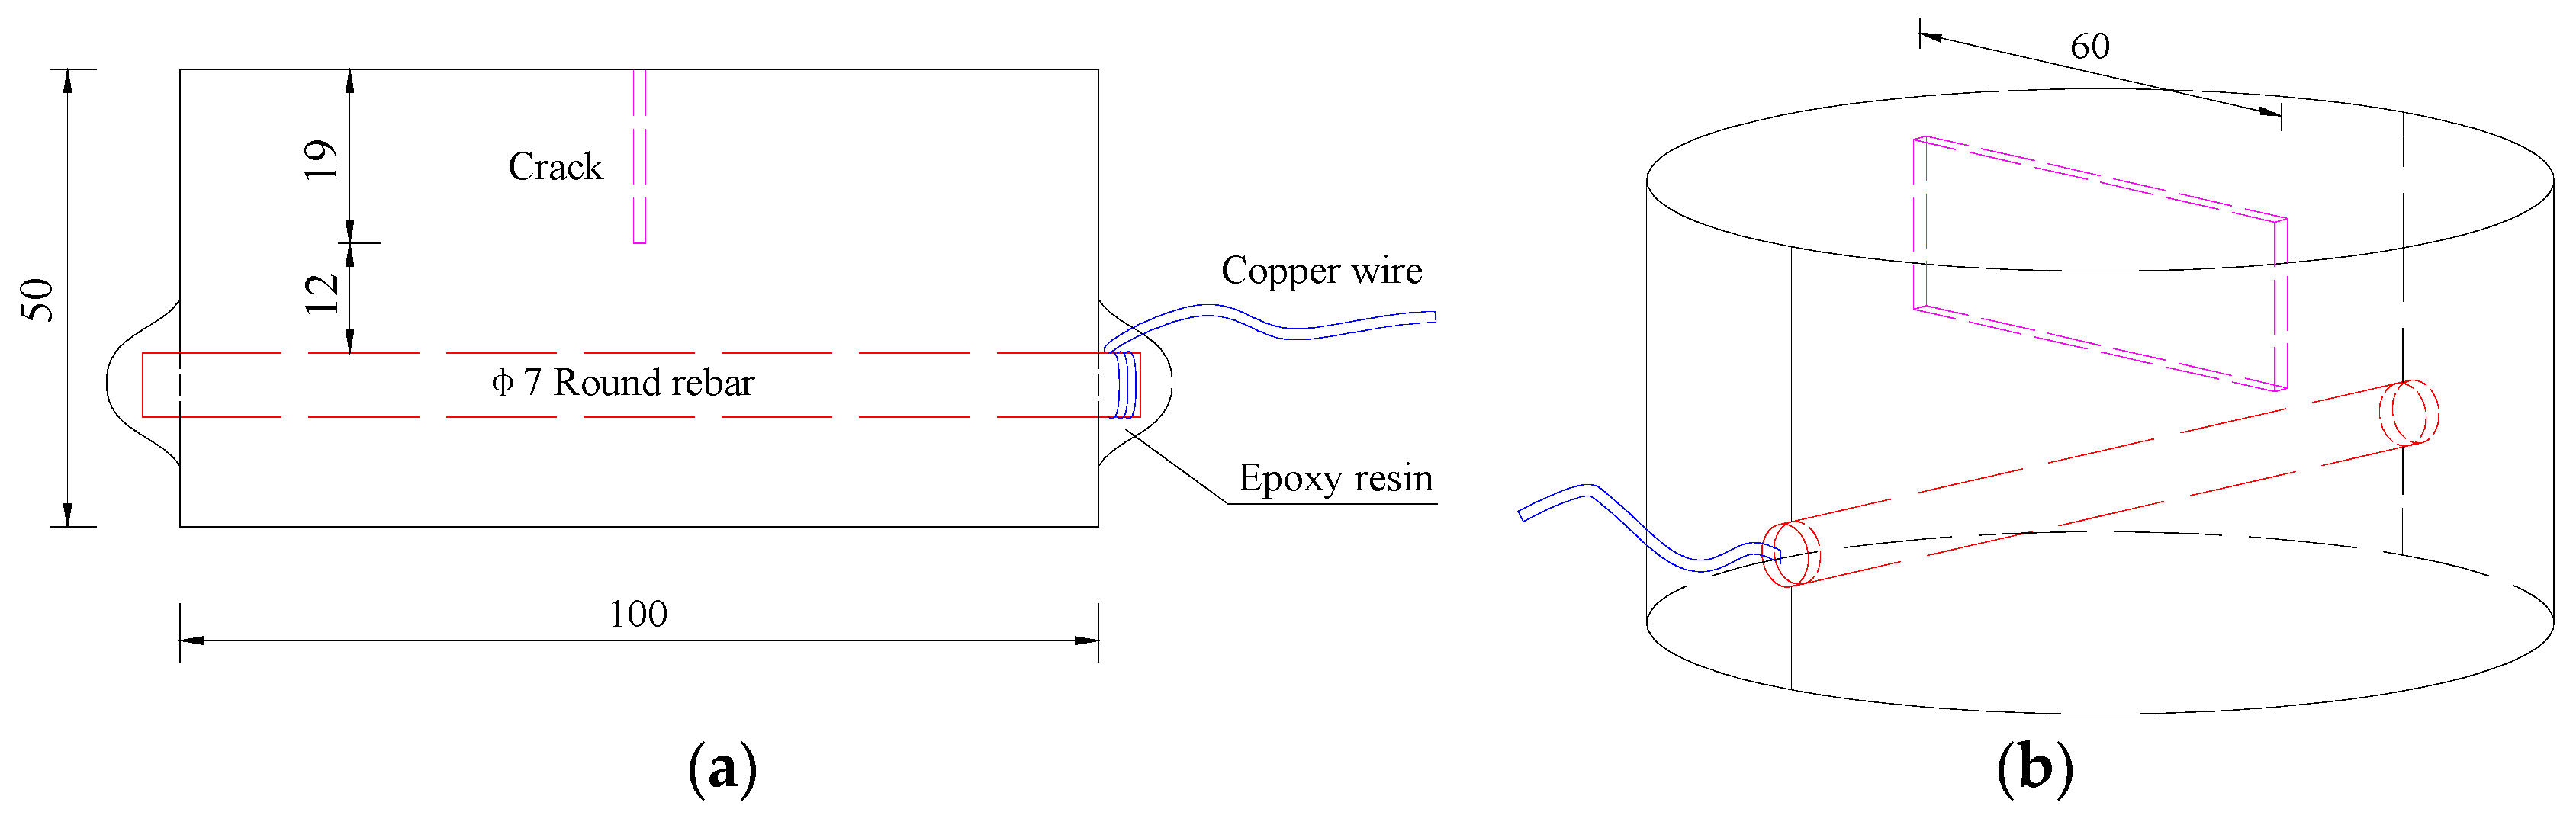
2.2. Specimen Preparation
2.3. Experimental Methods
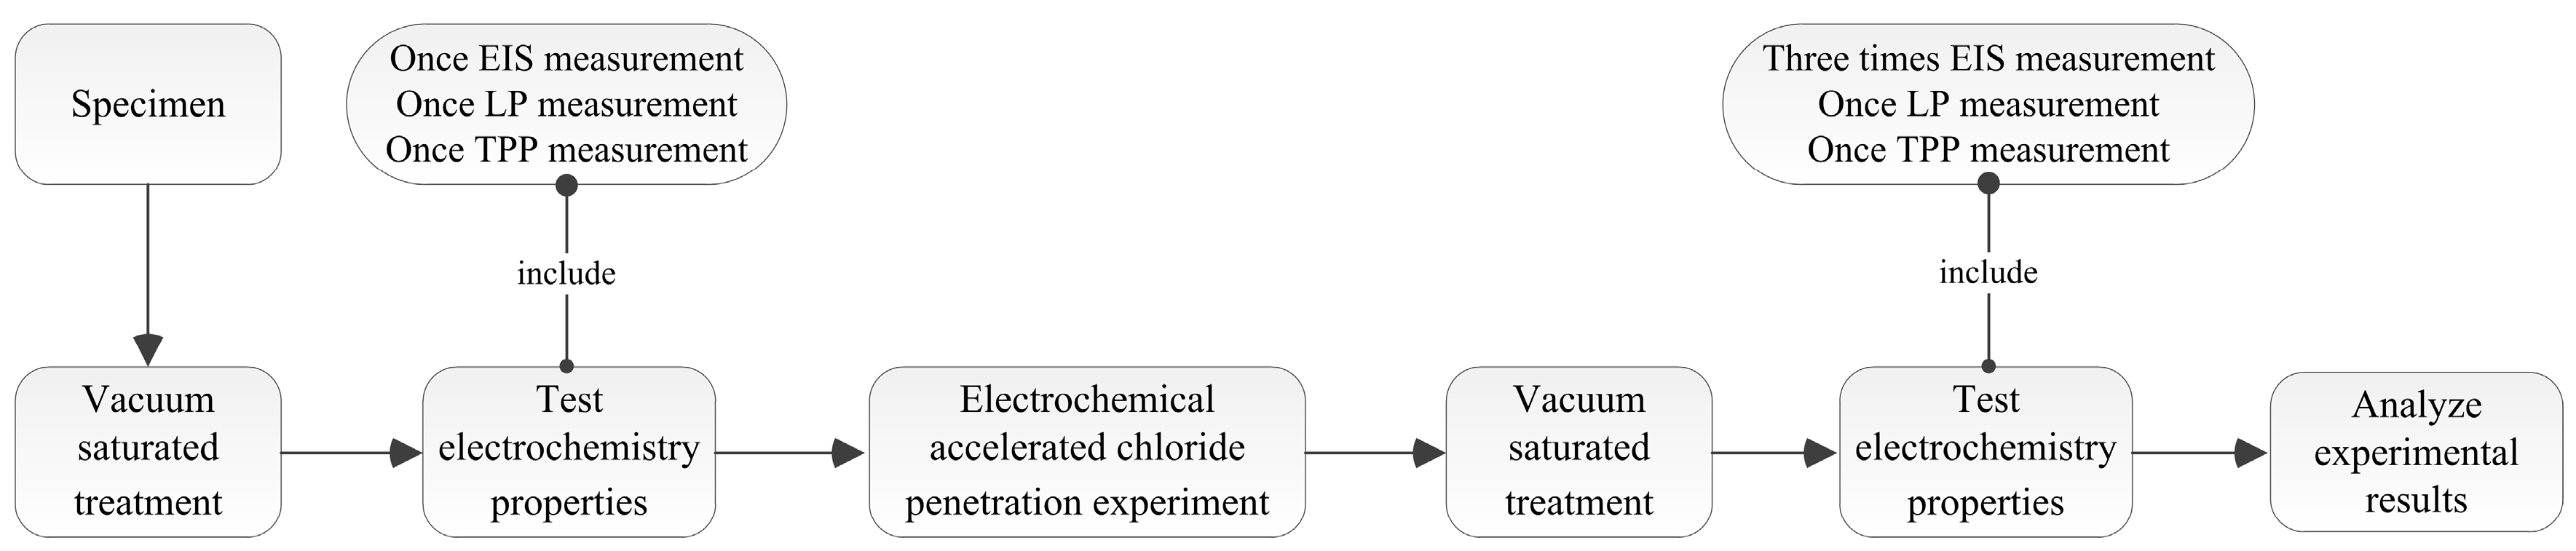
2.3.1. Scheme Design
2.3.2. Vacuum-Saturated Treatment
2.3.3. Accelerated Chloride Penetration Experiment
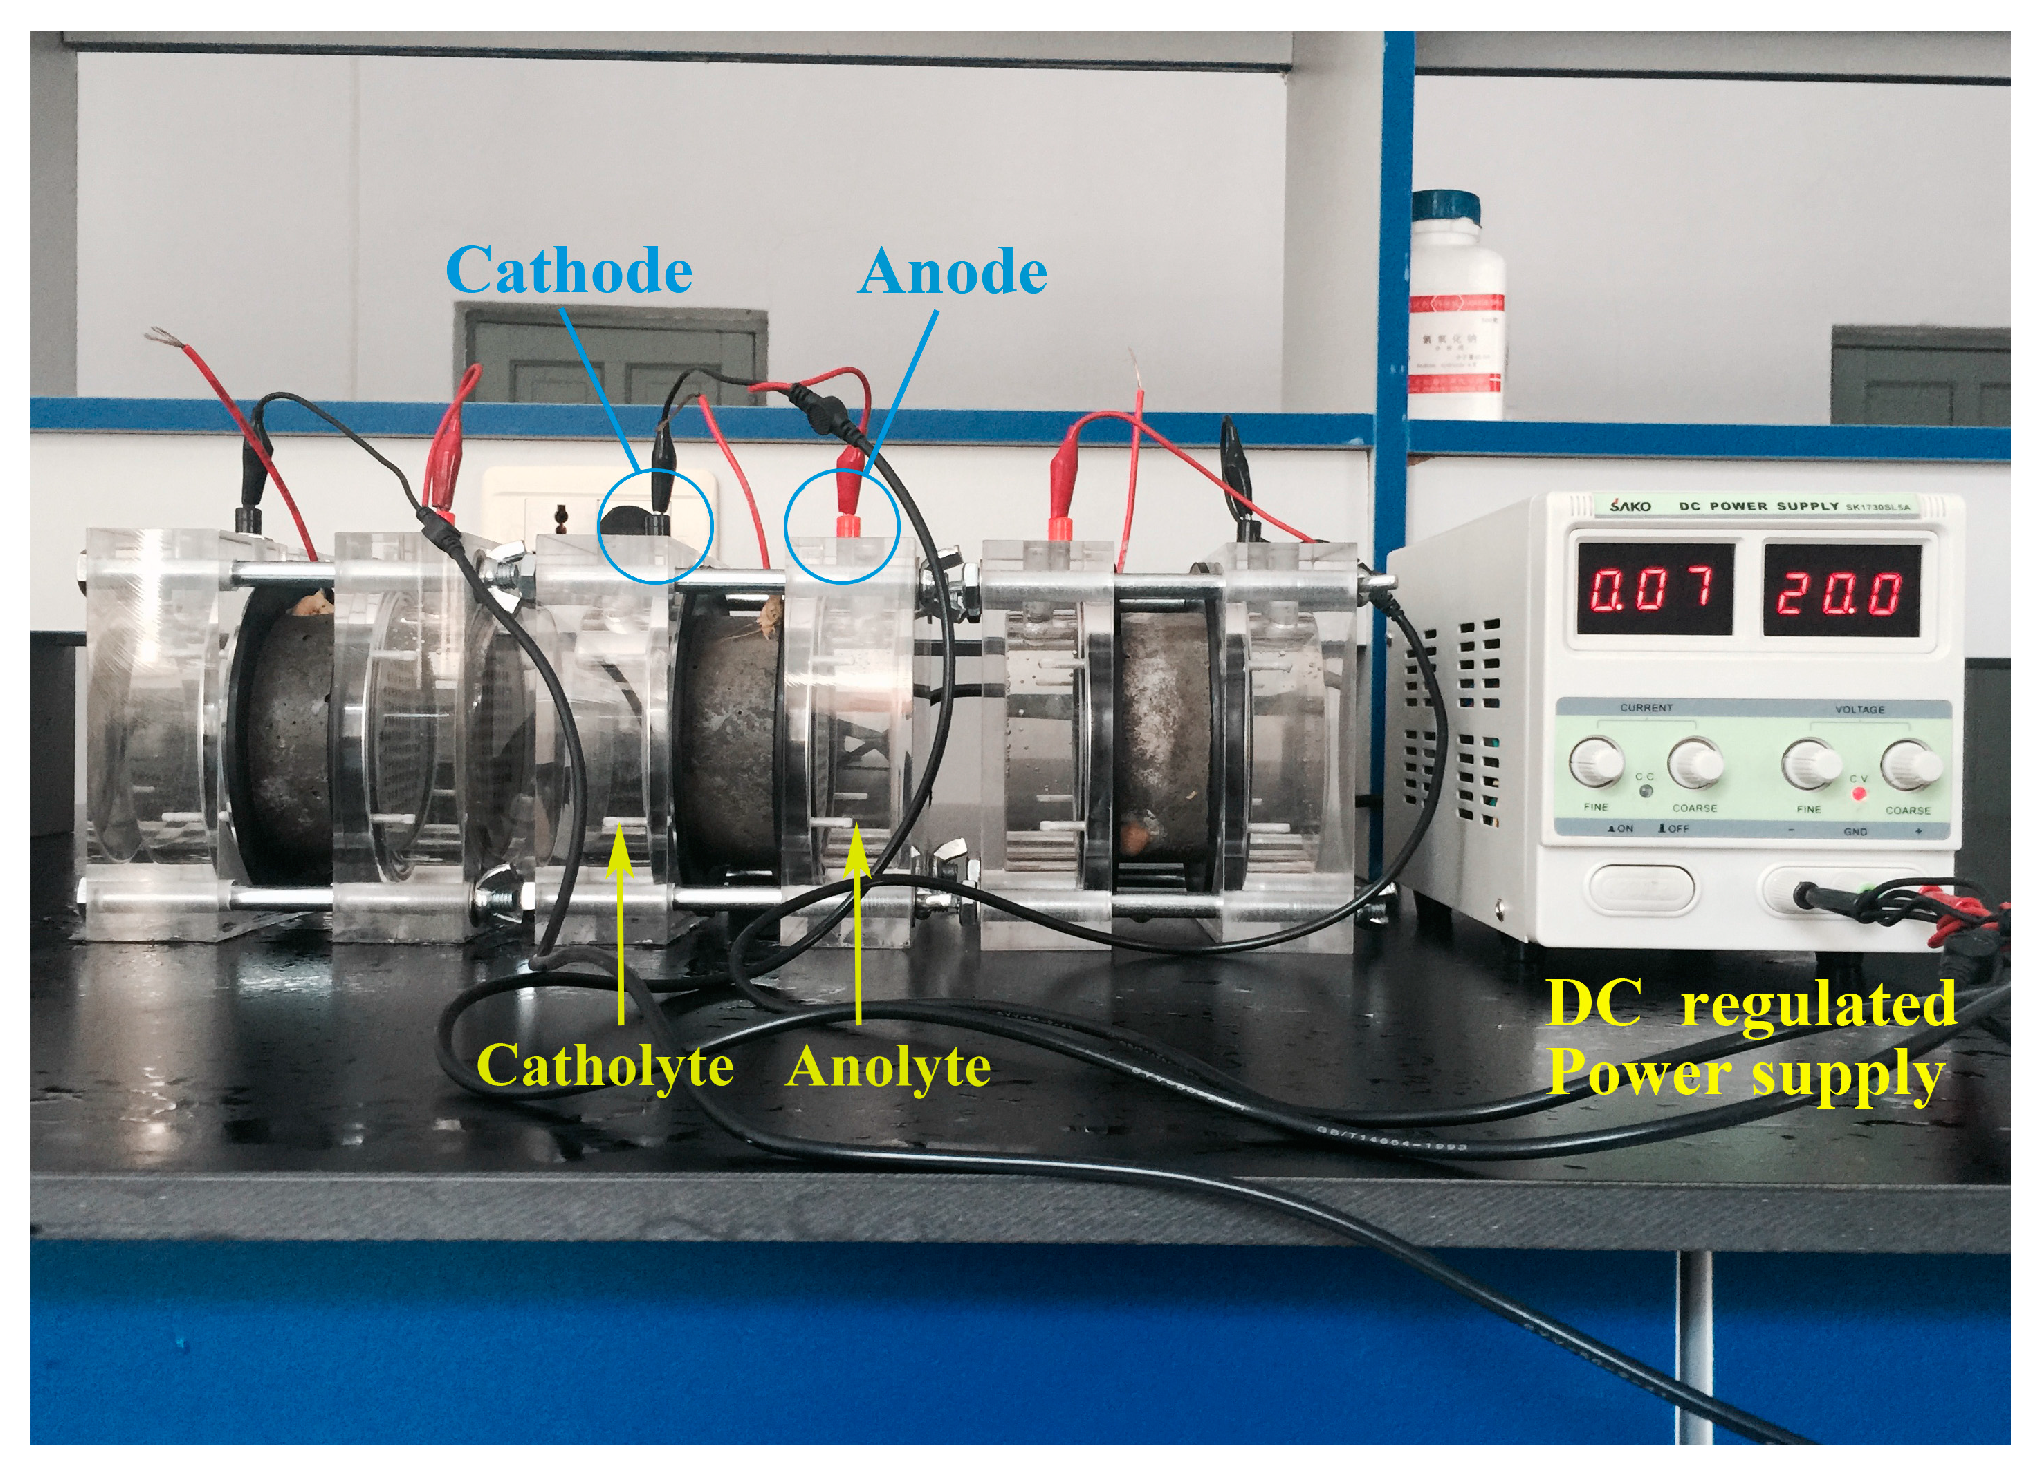
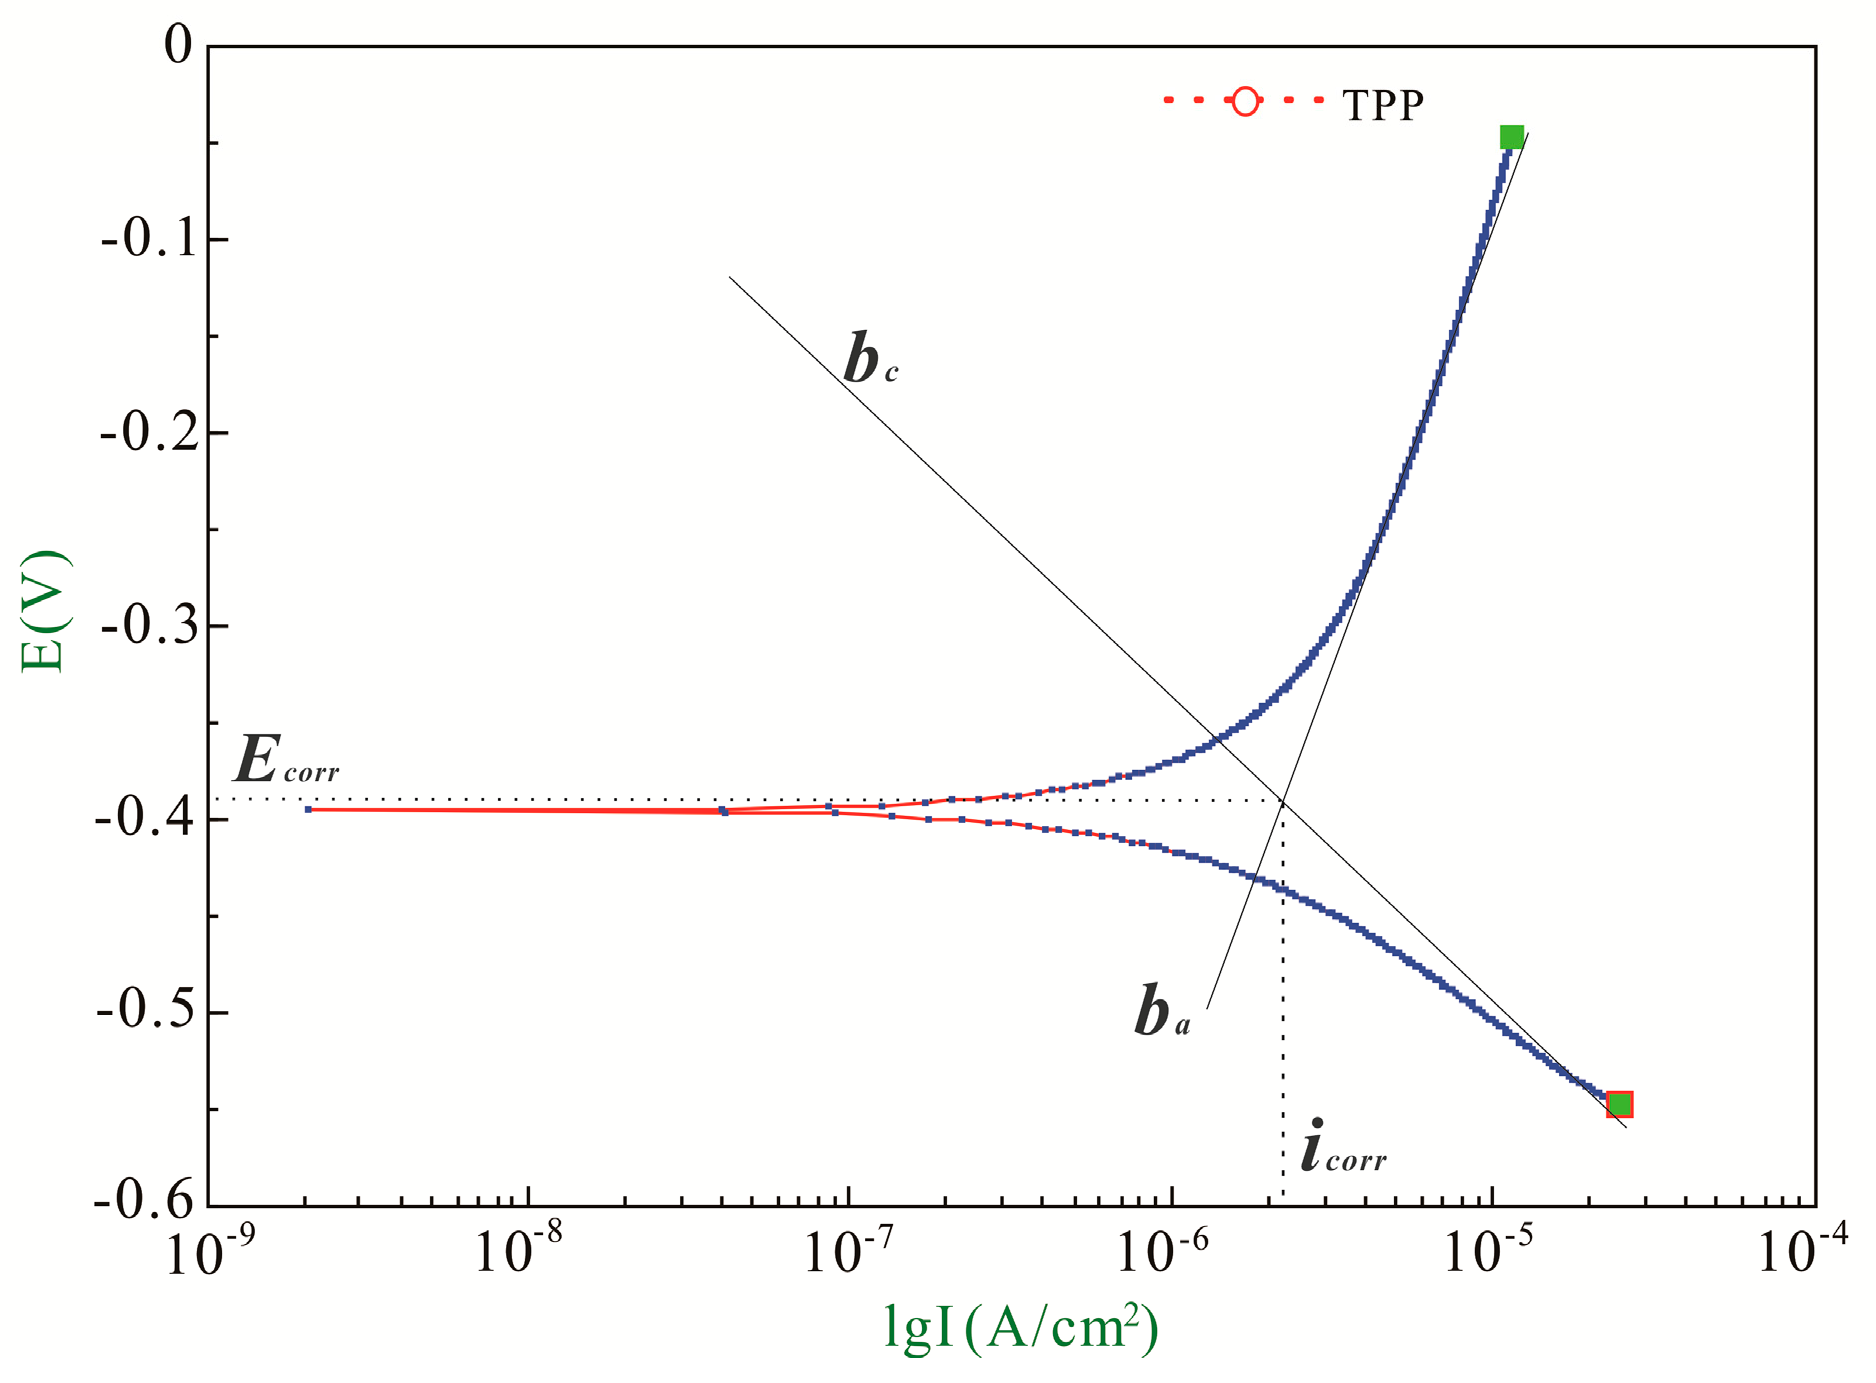
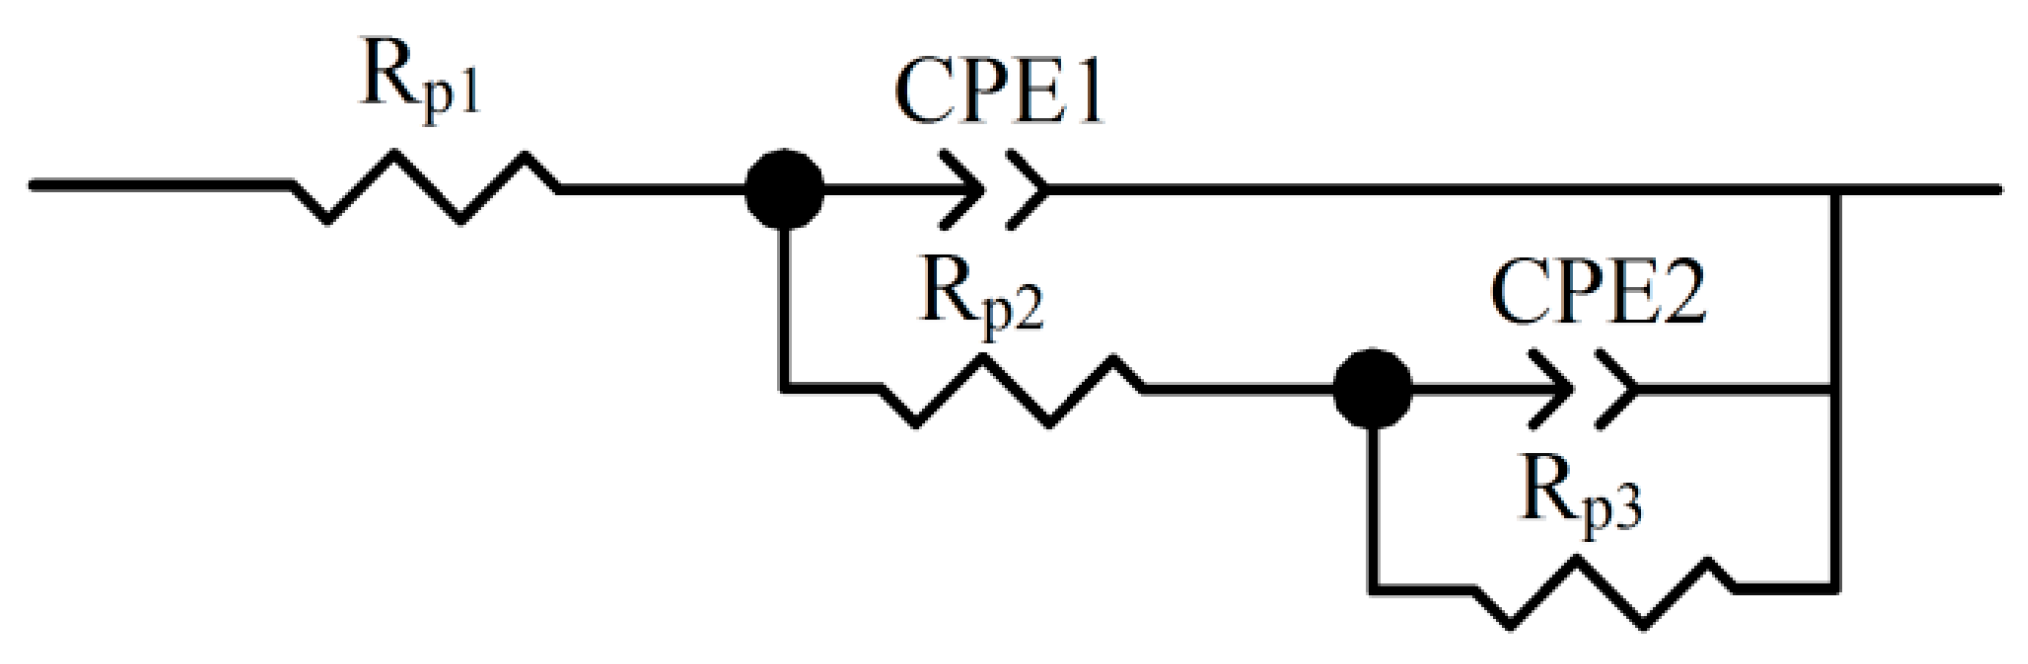
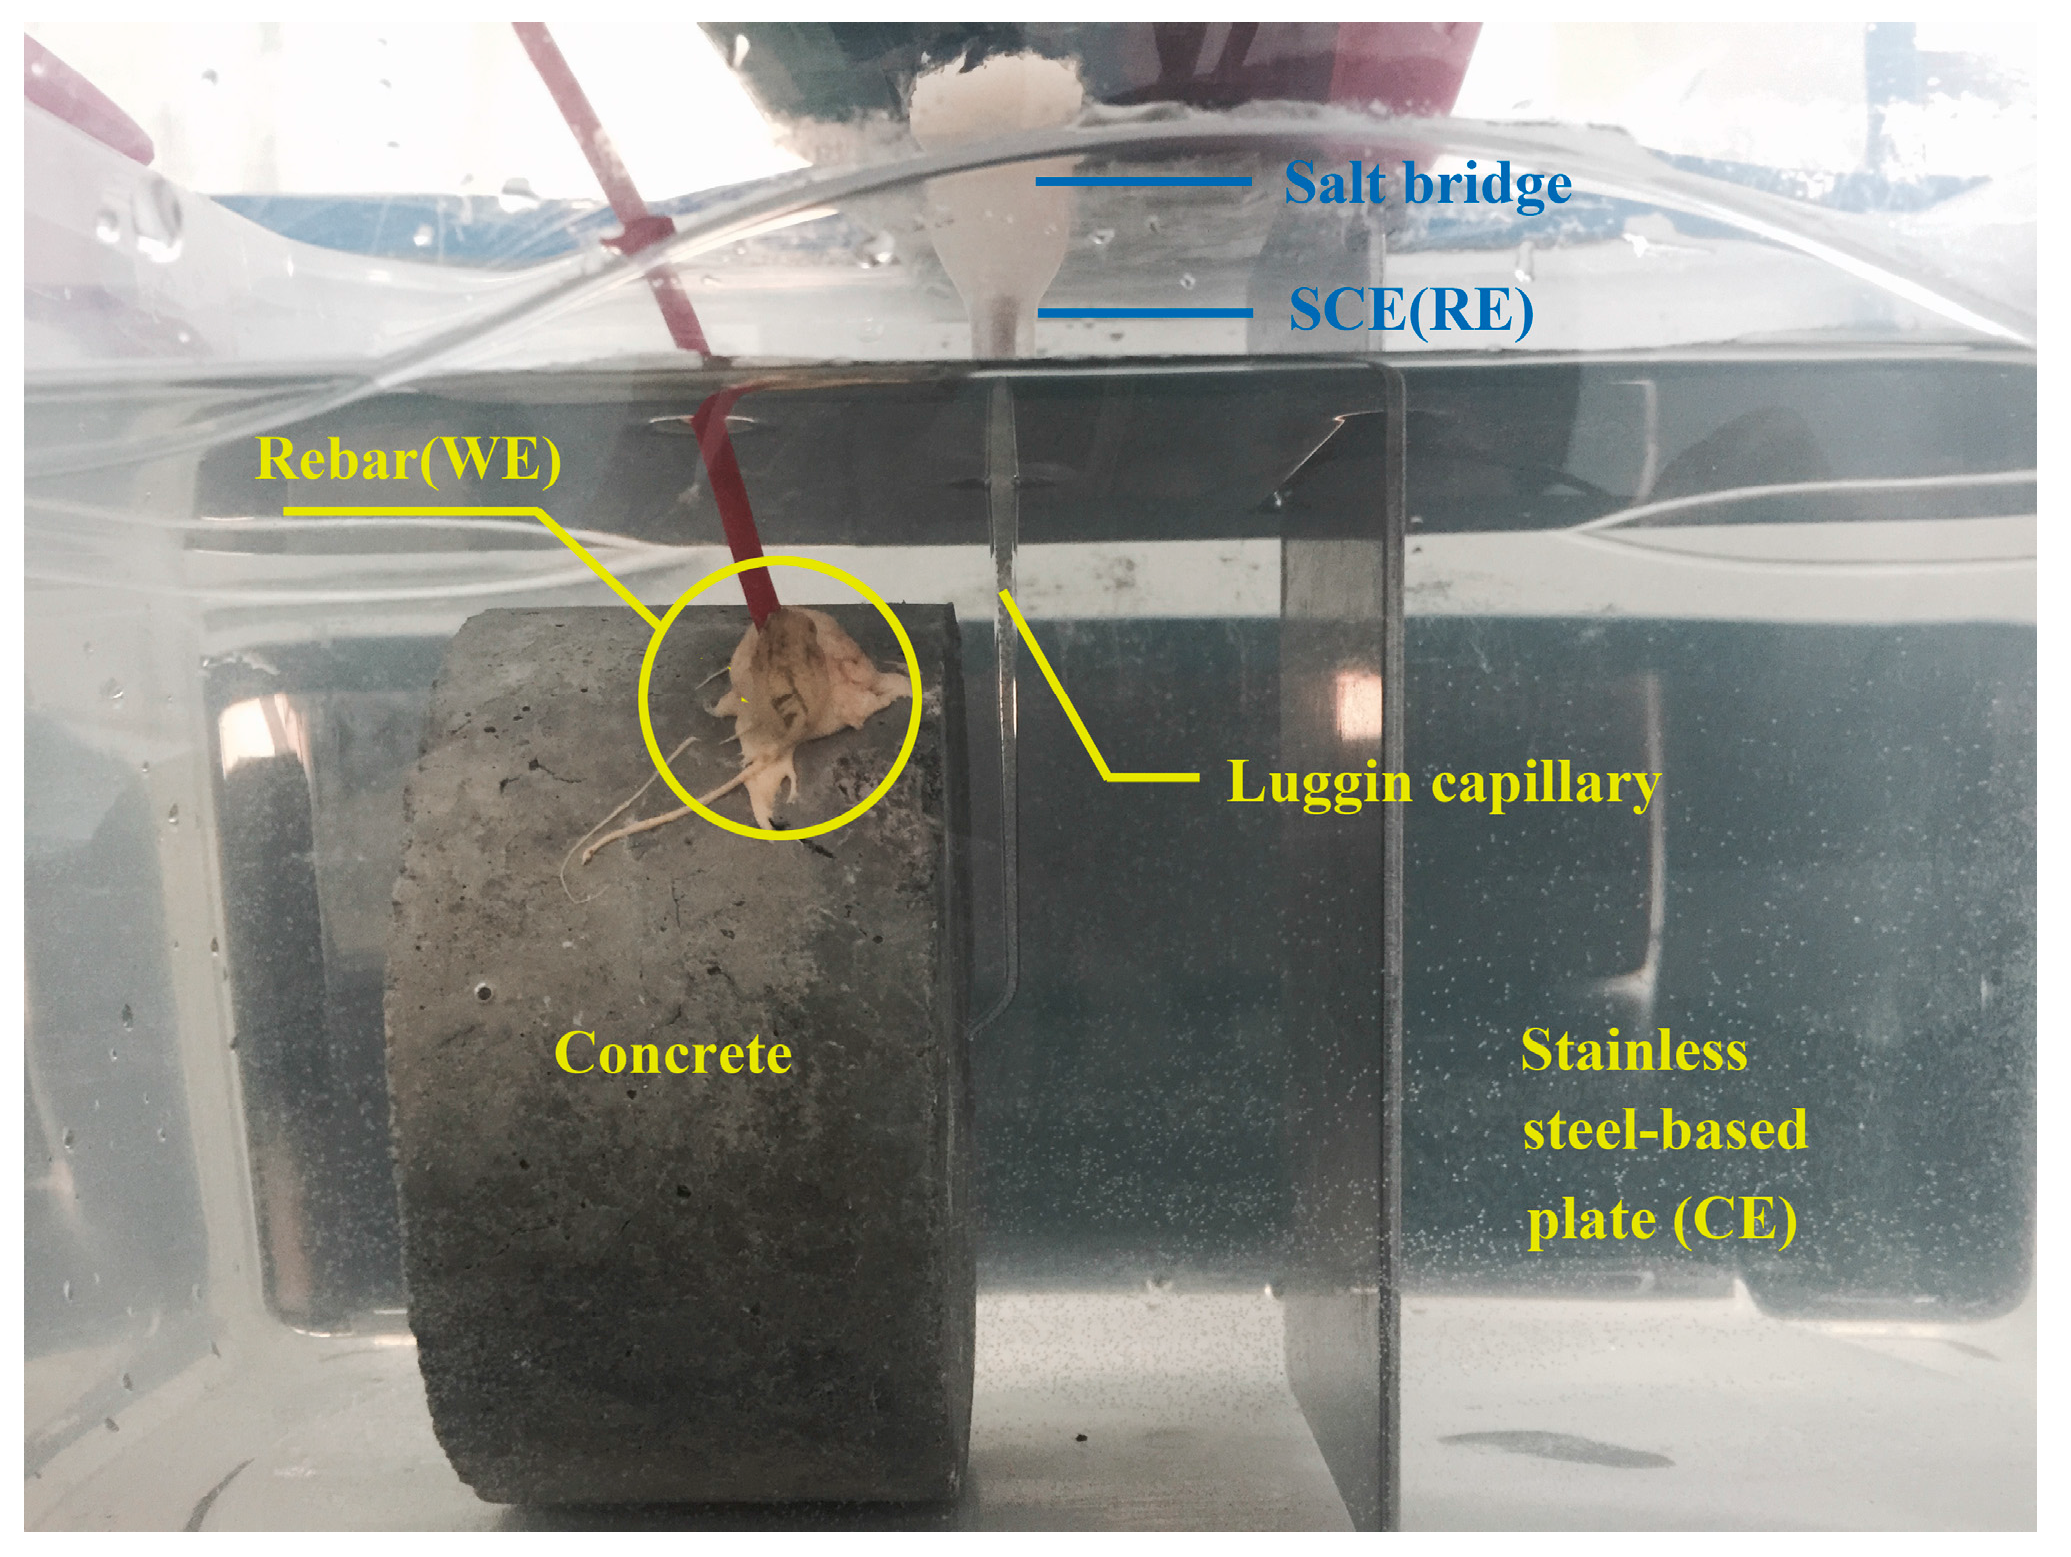
2.3.4. Corrosion Density Test for Bar Based on Electrochemical Measurements
2.4. Statistical Analysis Methods
2.4.1. One-Way ANOVA
2.4.2. Turkey’s HSD Test
3. Results and Discussion
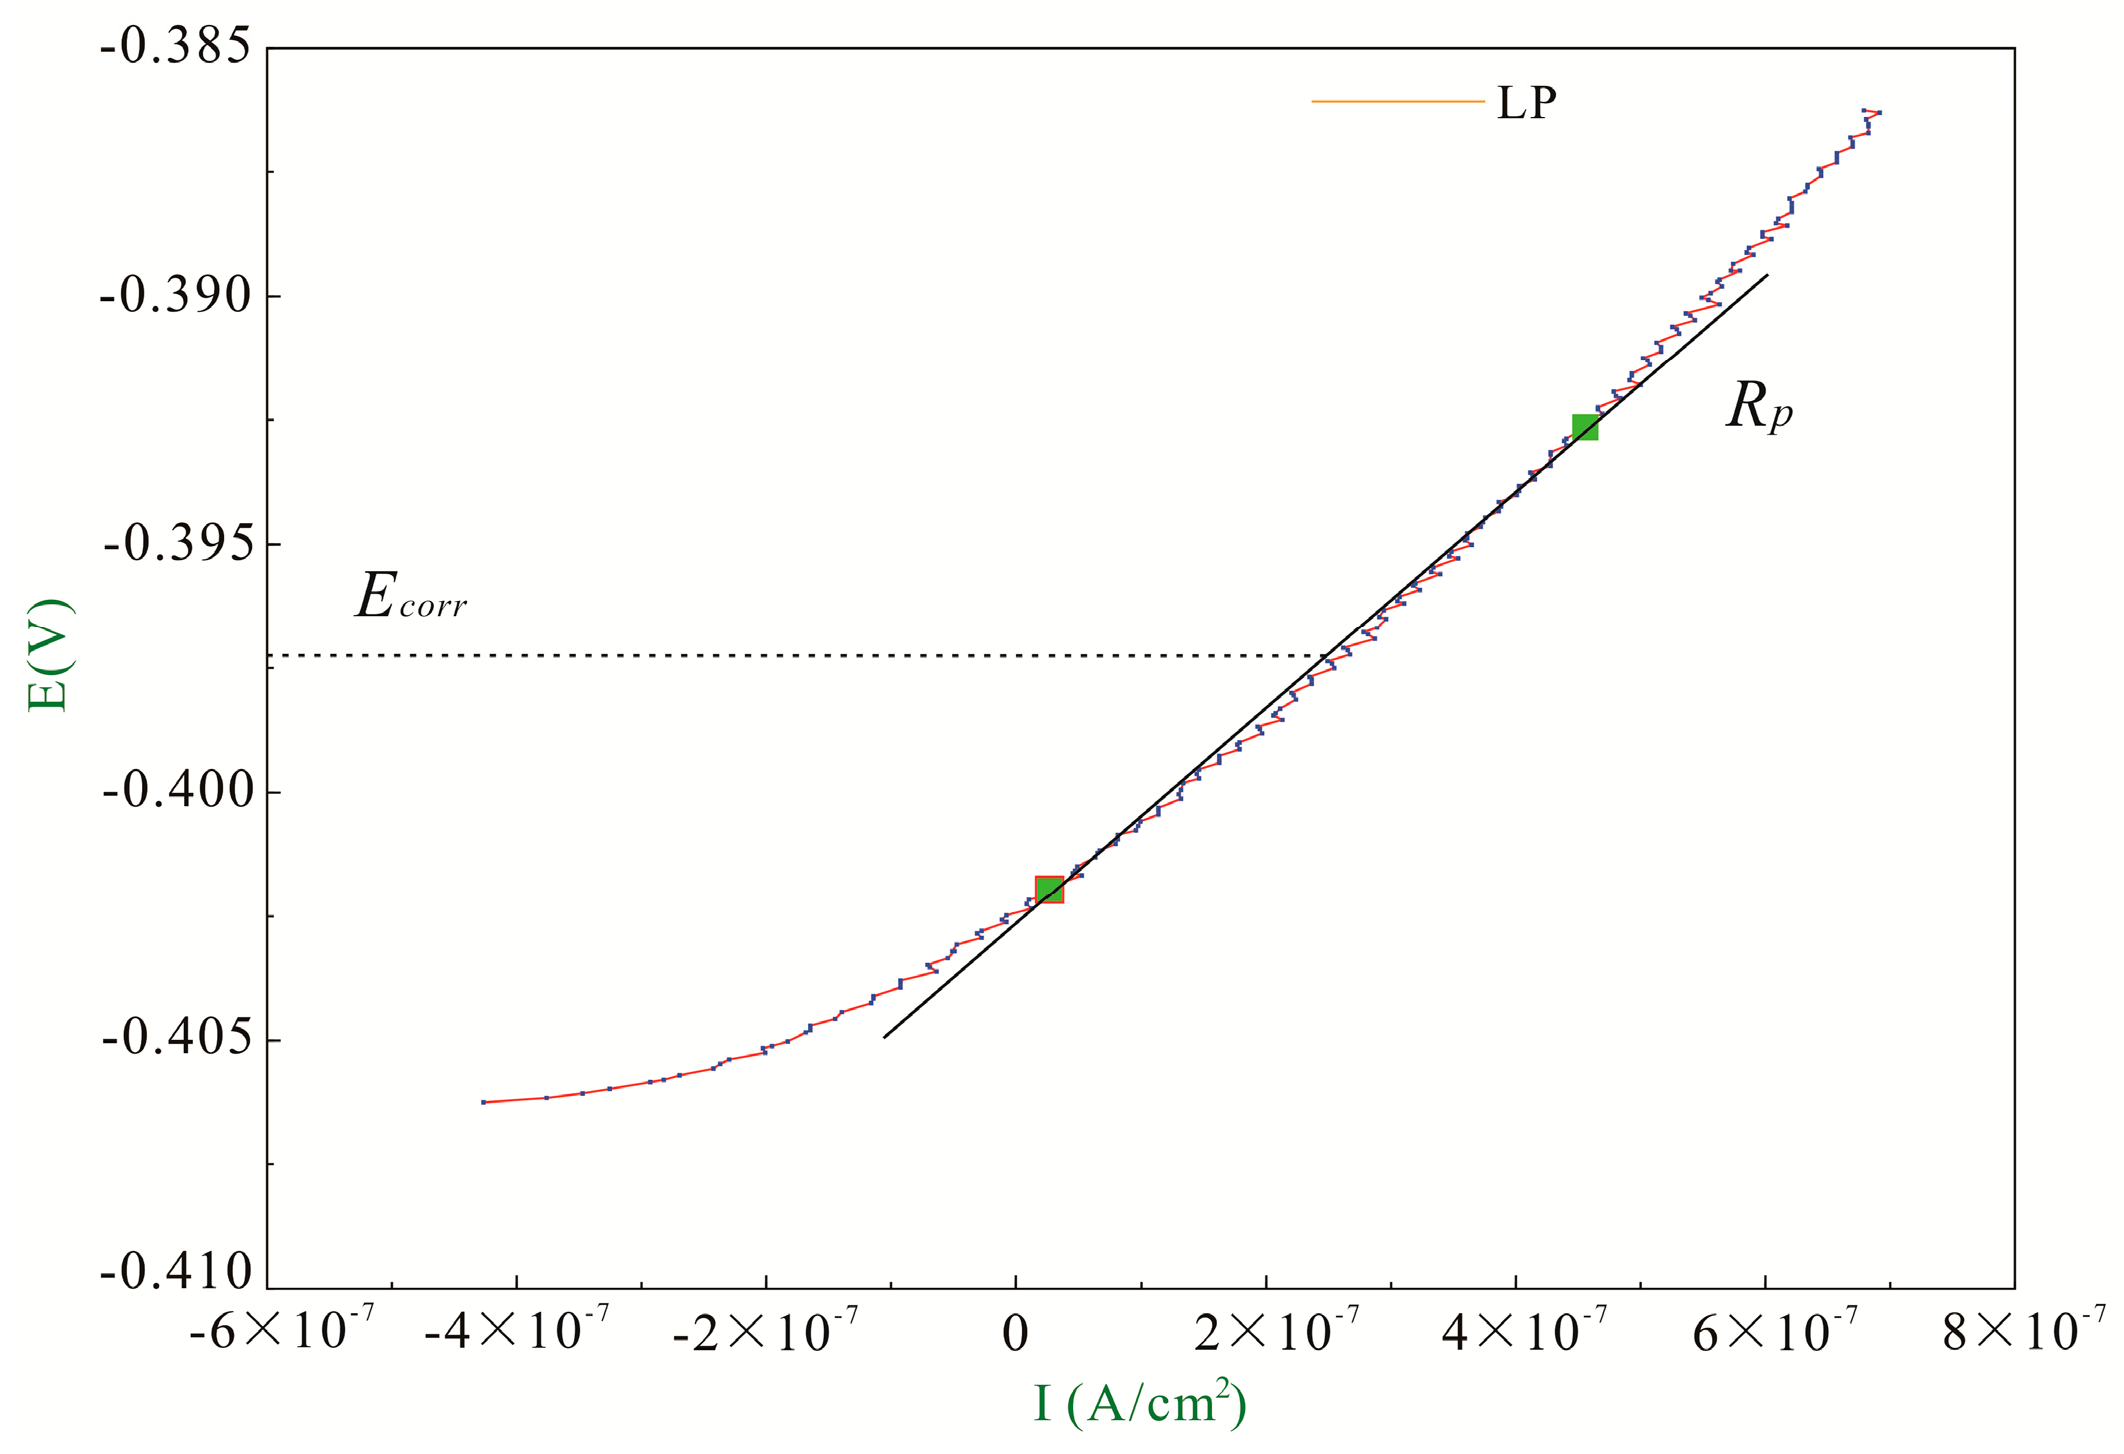
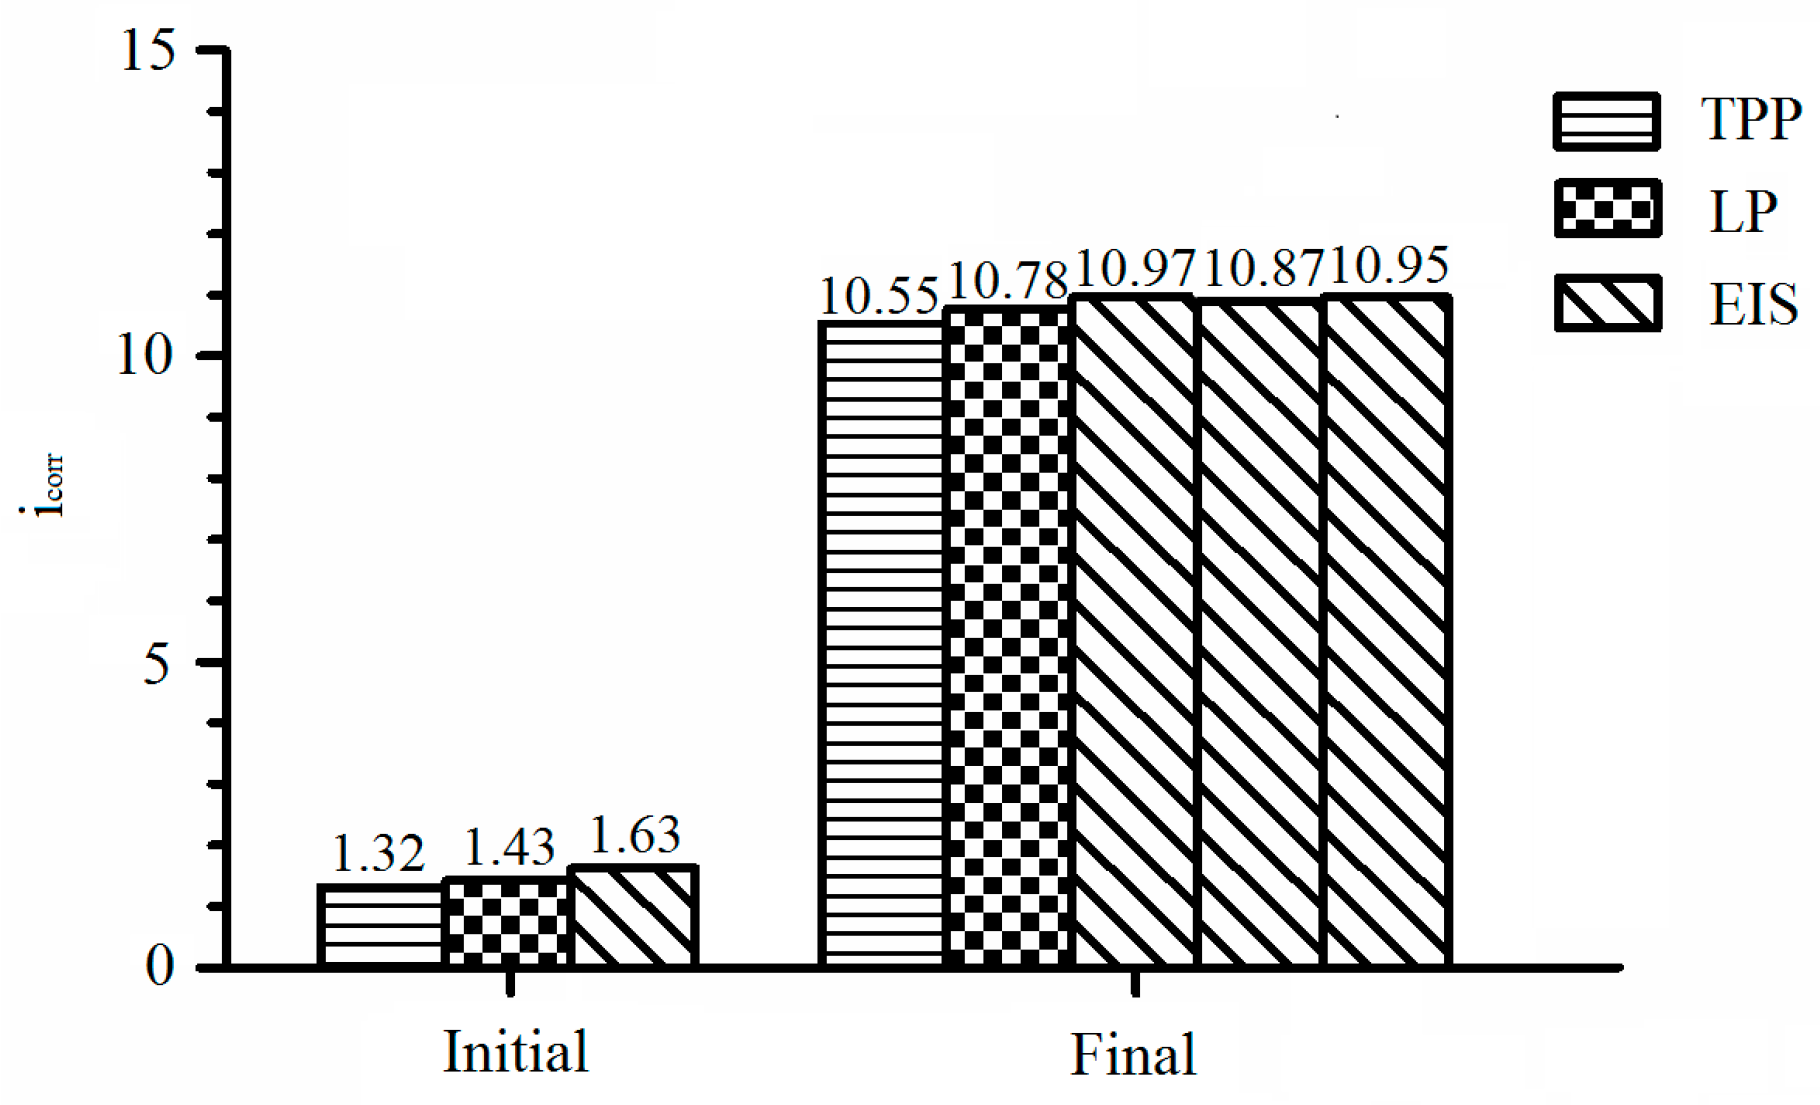
3.1. Recommendation of Reasonable Electrochemical Test Method
3.2. The Effect of Crack on Corrosion Behavior of Rebar
4. Conclusions
- (1)
- Due to the EIS excluding the polarization resistance (Rp) error caused by concrete and Stern-Geary coefficient (B) from TPP reflecting the non-uniform corrosion of rebar in RC material, a more accurate electrochemical test method combining EIS with TPP measurements was recommended for rebar corrosion behavior in RC material.
- (2)
- The influences of crack parameters (i.e., crack width, number and spacing) on durability of RC material were analyzed based on One-way ANOVA and Turkey’s HSD test. Results revealed that crack number presents the most significant effect, while crack spacing possesses the least one. As for wondering that if the influence on rebar corrosion caused by total crack width of multiple cracks is equal to that caused by an individual crack width, this also has become the topic which the authors further deliberated from now on.
Acknowledgments
Author Contributions
Conflicts of Interest
References
- Kwon, S.J. Current Trends of Durability Design and Government Support in South Korea: Chloride Attack. Sustainability 2017, 9, 417. [Google Scholar] [CrossRef]
- Yang, K.H.; Singh, J.; Lee, B.Y.; Kwon, S.J. Simple technique for tracking chloride penetration in concrete based on the crack shape and width under steady-state conditions. Sustainability 2017, 9, 282. [Google Scholar] [CrossRef]
- Wang, H.L.; Dai, J.G.; Sun, X.Y.; Zhang, X.L. Characteristics of concrete cracks and their influence on chloride penetration. Constr. Build. Mater. 2016, 107, 216–225. [Google Scholar] [CrossRef]
- Ji, Y.; Hu, Y.; Zhang, L. Laboratory studies on influence of transverse cracking on chloride-induced corrosion rate in concrete. Cem. Concr. Compos. 2016, 69, 28–37. [Google Scholar] [CrossRef]
- Zhu, X.; Zi, G.; Cao, Z.; Cheng, X. Combined effect of carbonation and chloride ingress in concrete. Constr. Build. Mater. 2016, 110, 369–380. [Google Scholar] [CrossRef]
- Lambert, P.; Page, C.L.; Vassie, P.R.W. Investigations of reinforcement corrosion. 2. Electrochemical monitoring of steel in chloride-contaminated concrete. Mater. Struct. 1991, 24, 351–358. [Google Scholar] [CrossRef]
- Shaheen, F.; Pradhan, B. Effect of chloride and conjoint chloride–sulfate ions on corrosion of reinforcing steel in electrolytic concrete powder solution (ECPS). Constr. Build. Mater. 2015, 101, 99–112. [Google Scholar] [CrossRef]
- Tennakoon, C.; Shayan, A.; Sanjayan, J.G.; Xu, A. Chloride ingress and steel corrosion in geopolymer concrete based on long term tests. Mater. Des. 2017, 116, 287–299. [Google Scholar] [CrossRef]
- Wang, K.; Jansen, D.C.; Shah, S.P.; Karr, A.F. Permeability study of cracked concrete. Cem. Concr. Res. 1997, 27, 381–393. [Google Scholar] [CrossRef]
- Ye, H.; Jin, N.; Jin, X.; Fu, C. Model of chloride penetration into cracked concrete subject to drying–wetting cycles. Constr. Build. Mater. 2012, 36, 259–269. [Google Scholar] [CrossRef]
- Marsavina, L.; Audenaert, K.; Schutter, G.D.; Faur, N.; Marsavina, D. Experimental and numerical determination of the chloride penetration in cracked concrete. Constr. Build. Mater. 2009, 23, 264–274. [Google Scholar] [CrossRef]
- Du, X.; Jin, L.; Ma, G. A meso-scale numerical method for the simulation of chloride diffusivity in concrete. Finite Elem. Anal. Des. 2014, 85, 87–100. [Google Scholar] [CrossRef]
- Liu, Q.F.; Yang, J.; Xia, J.; Easterbrook, D.; Li, L.Y. A numerical study on chloride migration in cracked concrete using multi-component ionic transport models. Comput. Mater. Sci. 2015, 99, 396–416. [Google Scholar] [CrossRef]
- Papakonstantinou, K.G.; Shinozuka, M. Probabilistic model for steel corrosion in reinforced concrete structures of large dimensions considering crack effects. Eng. Struct. 2013, 57, 306–326. [Google Scholar] [CrossRef]
- Cao, C.; Cheung, M.M.S.; Chan, B.Y.B. Modelling of interaction between corrosion-induced concrete cover crack and steel corrosion rate. Corros. Sci. 2013, 69, 97–109. [Google Scholar] [CrossRef]
- Zhu, W.; François, R.; Fang, Q.; Zhang, D. Influence of long-term chloride diffusion in concrete and the resulting corrosion of reinforcement on the serviceability of RC beams. Cem. Concr. Compos. 2016, 71, 144–152. [Google Scholar] [CrossRef]
- Pacheco, J.; Šavija, B.; Schlangen, E.; Polder, R.B. Assessment of cracks in reinforced concrete by means of electrical resistance and image analysis. Constr. Build. Mater. 2014, 65, 417–426. [Google Scholar] [CrossRef]
- Šavija, B.; Schlangen, E. Chloride ingress in cracked concrete—A literature review. In Proceedings of the International PhD Conference on Concrete Durability, Madrid, Spain, 19 November 2010; Andrade, C., Gulikers, J., Eds.; RILEM Publications: Madrid, Spain, 2012; pp. 133–142. [Google Scholar]
- Pedrosa, F.; Andrade, C. Corrosion induced cracking: Effect of different corrosion rates on crack width evolution. Constr. Build. Mater. 2016, 133, 525–533. [Google Scholar] [CrossRef]
- Zhou, Y.; Gencturk, B.; Willam, K.; Attar, A. Carbonation-Induced and Chloride-Induced Corrosion in Reinforced Concrete Structures. J. Mater. Civ. Eng. 2014, 27, 46–70. [Google Scholar] [CrossRef]
- Wang, Z.; Zeng, Q.; Wang, L.; Yao, Y.; Li, K. Corrosion of rebar in concrete under cyclic freeze–thaw and Chloride salt action. Constr. Build. Mater. 2014, 53, 40–47. [Google Scholar] [CrossRef]
- Andrade, C.; Garcés, P.; Martínez, I. Galvanic currents and corrosion rates of reinforcements measured in cells simulating different pitting areas caused by chloride attack in sodium hydroxide. Corros. Sci. 2008, 50, 2959–2964. [Google Scholar] [CrossRef]
- Qi, X.; Mao, H.; Yang, Y. Corrosion behavior of nitrogen alloyed martensitic stainless steel in chloride containing solutions. Corros. Sci. 2017, 120, 90–98. [Google Scholar] [CrossRef]
- Liu, G.; Zhang, Y.; Ni, Z.; Huang, R. Corrosion behavior of steel submitted to chloride and sulphate ions in simulated concrete pore solution. Constr. Build. Mater. 2016, 115, 1–5. [Google Scholar] [CrossRef]
- Liu, M.; Cheng, X.; Li, X.; Zhou, C.; Tan, H. Effect of carbonation on the electrochemical behavior of corrosion resistance low alloy steel rebars in cement extract solution. Constr. Build. Mater. 2016, 130, 193–201. [Google Scholar] [CrossRef]
- Andrade, C.; Keddam, M.; Nóvoa, X.R.; Pérez, M.C.; Rangel, C.M.; Takenouti, H. Electrochemical behaviour of steel rebars in concrete: Influence of environmental factors and cement chemistry. Electrochim. Acta 2001, 46, 3905–3912. [Google Scholar] [CrossRef]
- Andrade, C.; Soler, L.; Alonso, C.; Nóvoa, X.R.; Keddam, M. The importance of geometrical considerations in the measurement of steel corrosion in concrete by means of AC impedance. Corros. Sci. 1995, 37, 2013–2023. [Google Scholar] [CrossRef]
- Gerengi, H.; Kocak, Y.; Jazdzewska, A.; Kurtay, M.; Durgun, H. Electrochemical investigations on the corrosion behaviour of reinforcing steel in diatomite- and zeolite-containing concrete exposed to sulphuric acid. Constr. Build. Mater. 2013, 49, 471–477. [Google Scholar] [CrossRef]
- Andrade, C.; Alonso, C. Test methods for on-site corrosion rate measurement of steel reinforcement in concrete by means of the polarization resistance method. Mater. Struct. 2004, 37, 623–643. [Google Scholar] [CrossRef]
- Ministry of Housing and Urban-Rural Development of the People’s Republic of China. Standard for Methods of Long-Temper Formance and Durability of Ordinary Concrete; Ministry of Housing and Urban-Rural Development of the People’s Republic of China: Beijing, China, 2009; (In Chinese).
- General Administration of Quality Supervision, Inspection and Quarantine of the People’s Republic of China. Common Portland Cement; General Administration of Quality Supervision, Inspection and Quarantine of the People’s Republic of China: Beijing, China, 2007; (In Chinese).
- Ministry of Housing and Urban-Rural Development of the People’s Republic of China. Standard for Quality Control of Concrete; Ministry of Housing and Urban-Rural Development of the People’s Republic of China: Beijing, China, 2011; (In Chinese).
- Song, G. Theoretical analysis of the measurement of polarisation resistance in reinforced concrete. Cem. Concr. Compos. 2000, 22, 407–415. [Google Scholar] [CrossRef]
- Song, H.W.; Saraswathy, V. Corrosion Monitoring of Reinforced Concrete Structures-A Review. Int. J. Electrochem. Sci. 2007, 2, 1–28. [Google Scholar]
- Martínez, I.; Andrade, C. Polarization resistance measurements of bars embedded in concrete with different chloride concentrations: EIS and DC comparison. Mater. Corros. 2015, 62, 932–942. [Google Scholar] [CrossRef]
- Keleştemur, O.; Yildiz, S.; Gökçer, B.; Arici, E. Statistical analysis for freeze–thaw resistance of cement mortars containing marble dust and glass fiber. Mater. Des. 2014, 60, 548–555. [Google Scholar] [CrossRef]
- Brown, A. A new software for carrying out one-way ANOVA post hoc tests. Comput. Methods Program Biomed. 2005, 79, 89–95. [Google Scholar] [CrossRef] [PubMed]
- Stoline, M.R. The Status of Multiple Comparisons: Simultaneous Estimation of all Pairwise Comparisons in One-Way ANOVA Designs. Am. Stat. 1981, 35, 134–141. [Google Scholar]
- Montgomery, D.C. Design and Analysis of Experiments, 8th ed.; Wiley and Sons: Hoboken, NJ, USA, 2012. [Google Scholar]


| Materials | Nominal Proportions (kg/m3) |
|---|---|
| Cement | 433 |
| Water | 195 |
| Fine aggregate | 567 |
| Coarse aggregate | 1205 |
| Symbol | Crack Width (mm) | Crack Number | Crack Spacing (mm) | Sketch of Specimen |
|---|---|---|---|---|
| N | 0 | 0 | - |  |
| A1 | 0.05 | 1 | - |  |
| A2 | 0.1 | 1 | - |  |
| A3 | 0.2 | 1 | - |  |
| B1 | 0.1 | 2 | 15 |  |
| B2 | 0.1 | 2 | 25 |  |
| C1 | 0.1 | 3 | 15 |  |
| C2 | 0.1 | 3 | 25 |  |
| ba (mV/Decade) | bc (mV/Decade) | B (mV/Decade) | icorr (μA/cm2) | Ecorr (V) | |
|---|---|---|---|---|---|
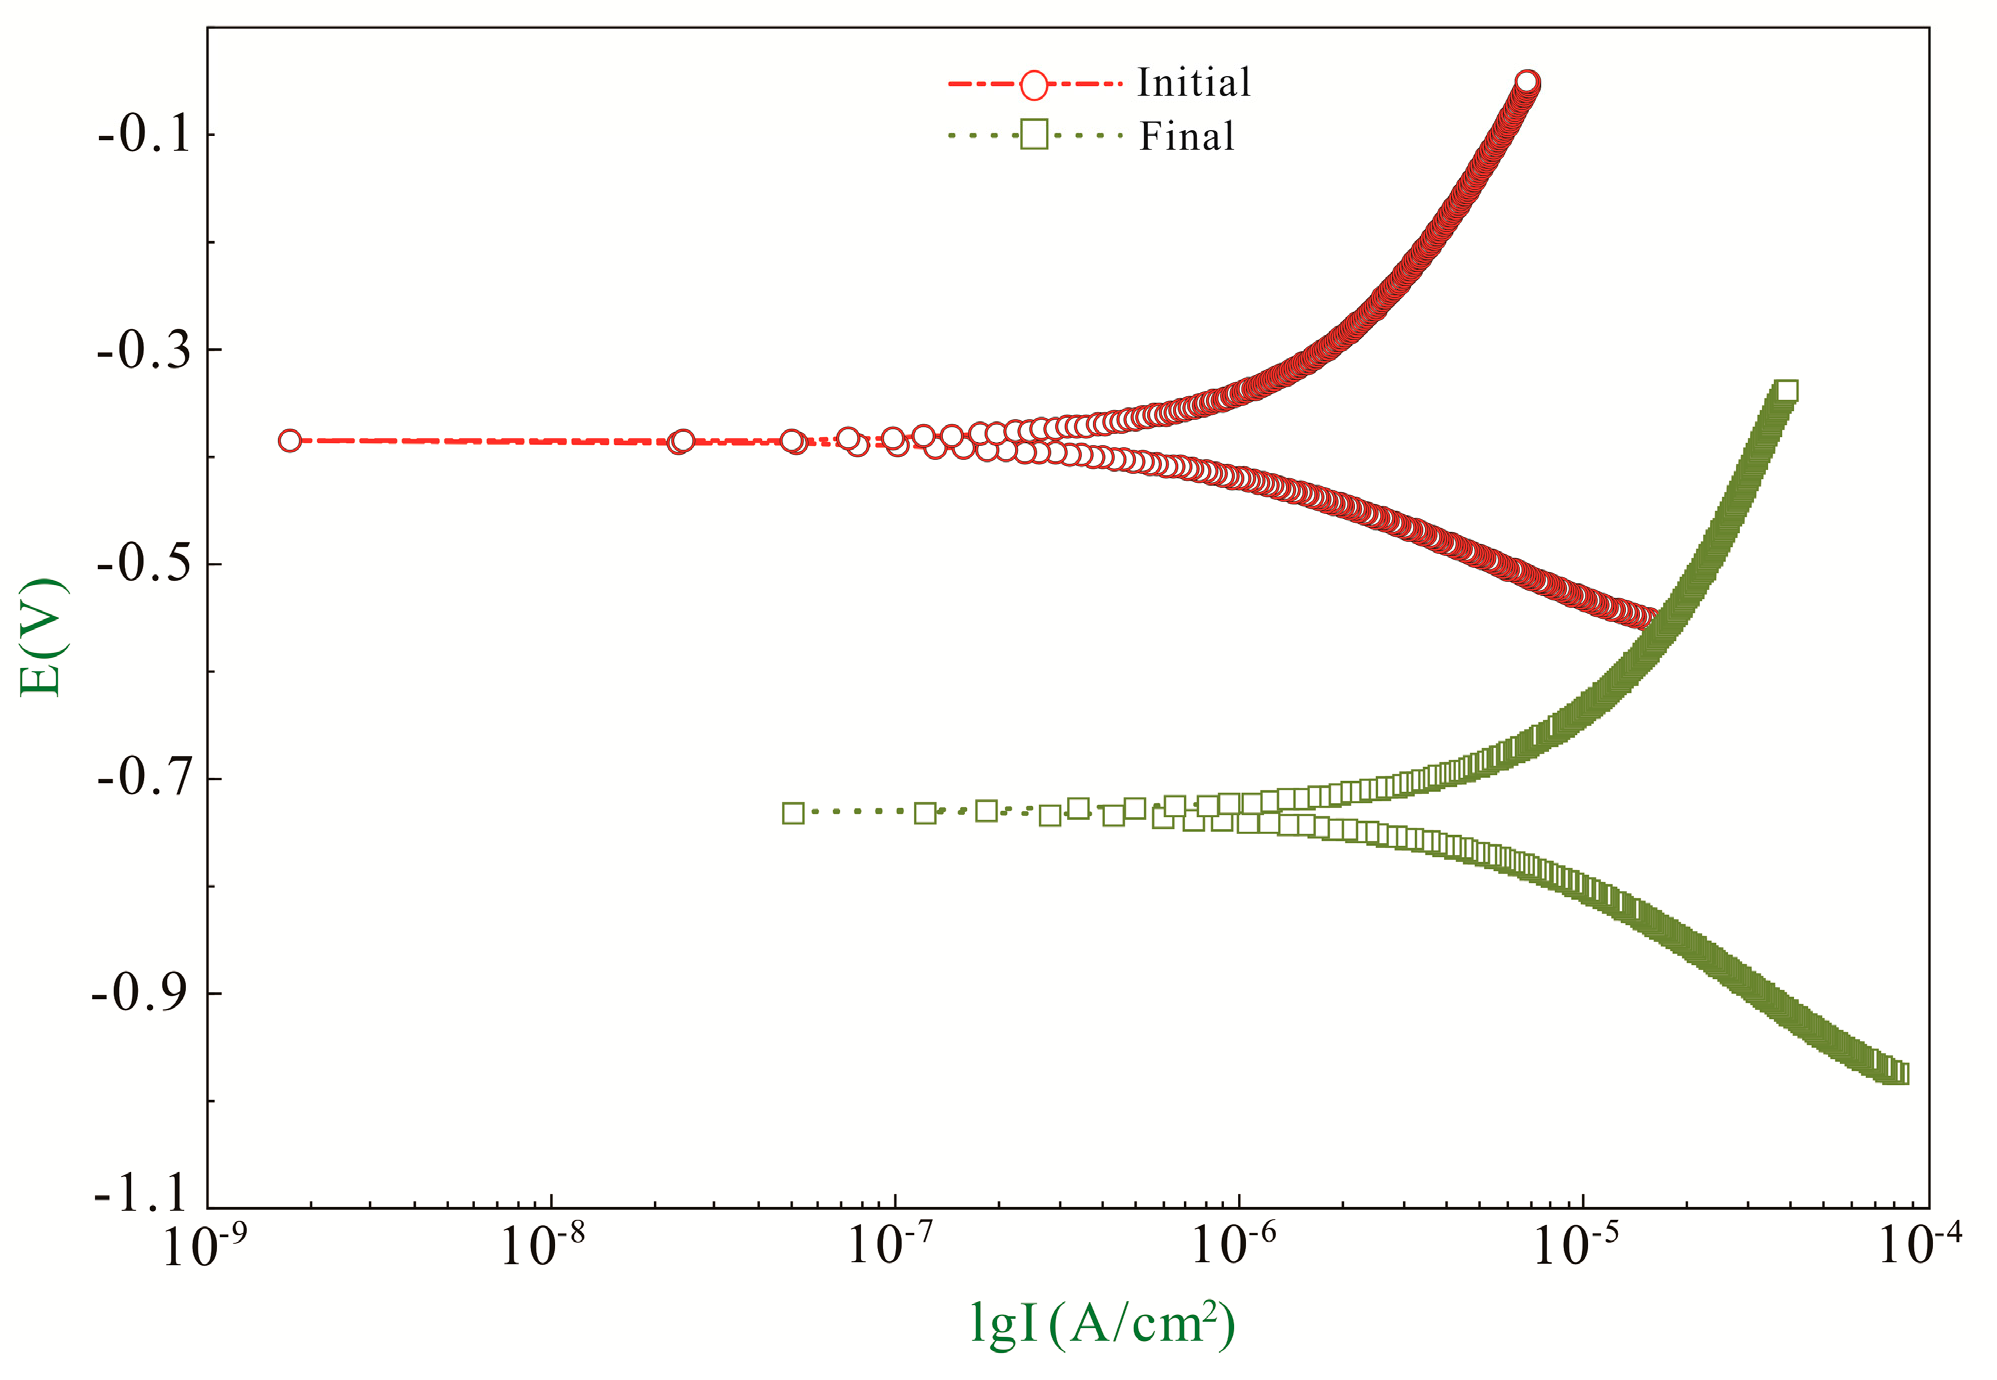
| Initial | 382.11 | 160.64 | 49.17 | 1.32 | −0.38 |
| Final | 583.29 | 282.93 | 82.72 | 10.55 | −0.73 |
| B (mV/Decade) | Rp (Ω·cm2) | icorr (μA/cm2) | |
|---|---|---|---|
| Initial | 49.17 | 34,384 | 1.43 |
| Final | 82.72 | 7673 | 10.78 |
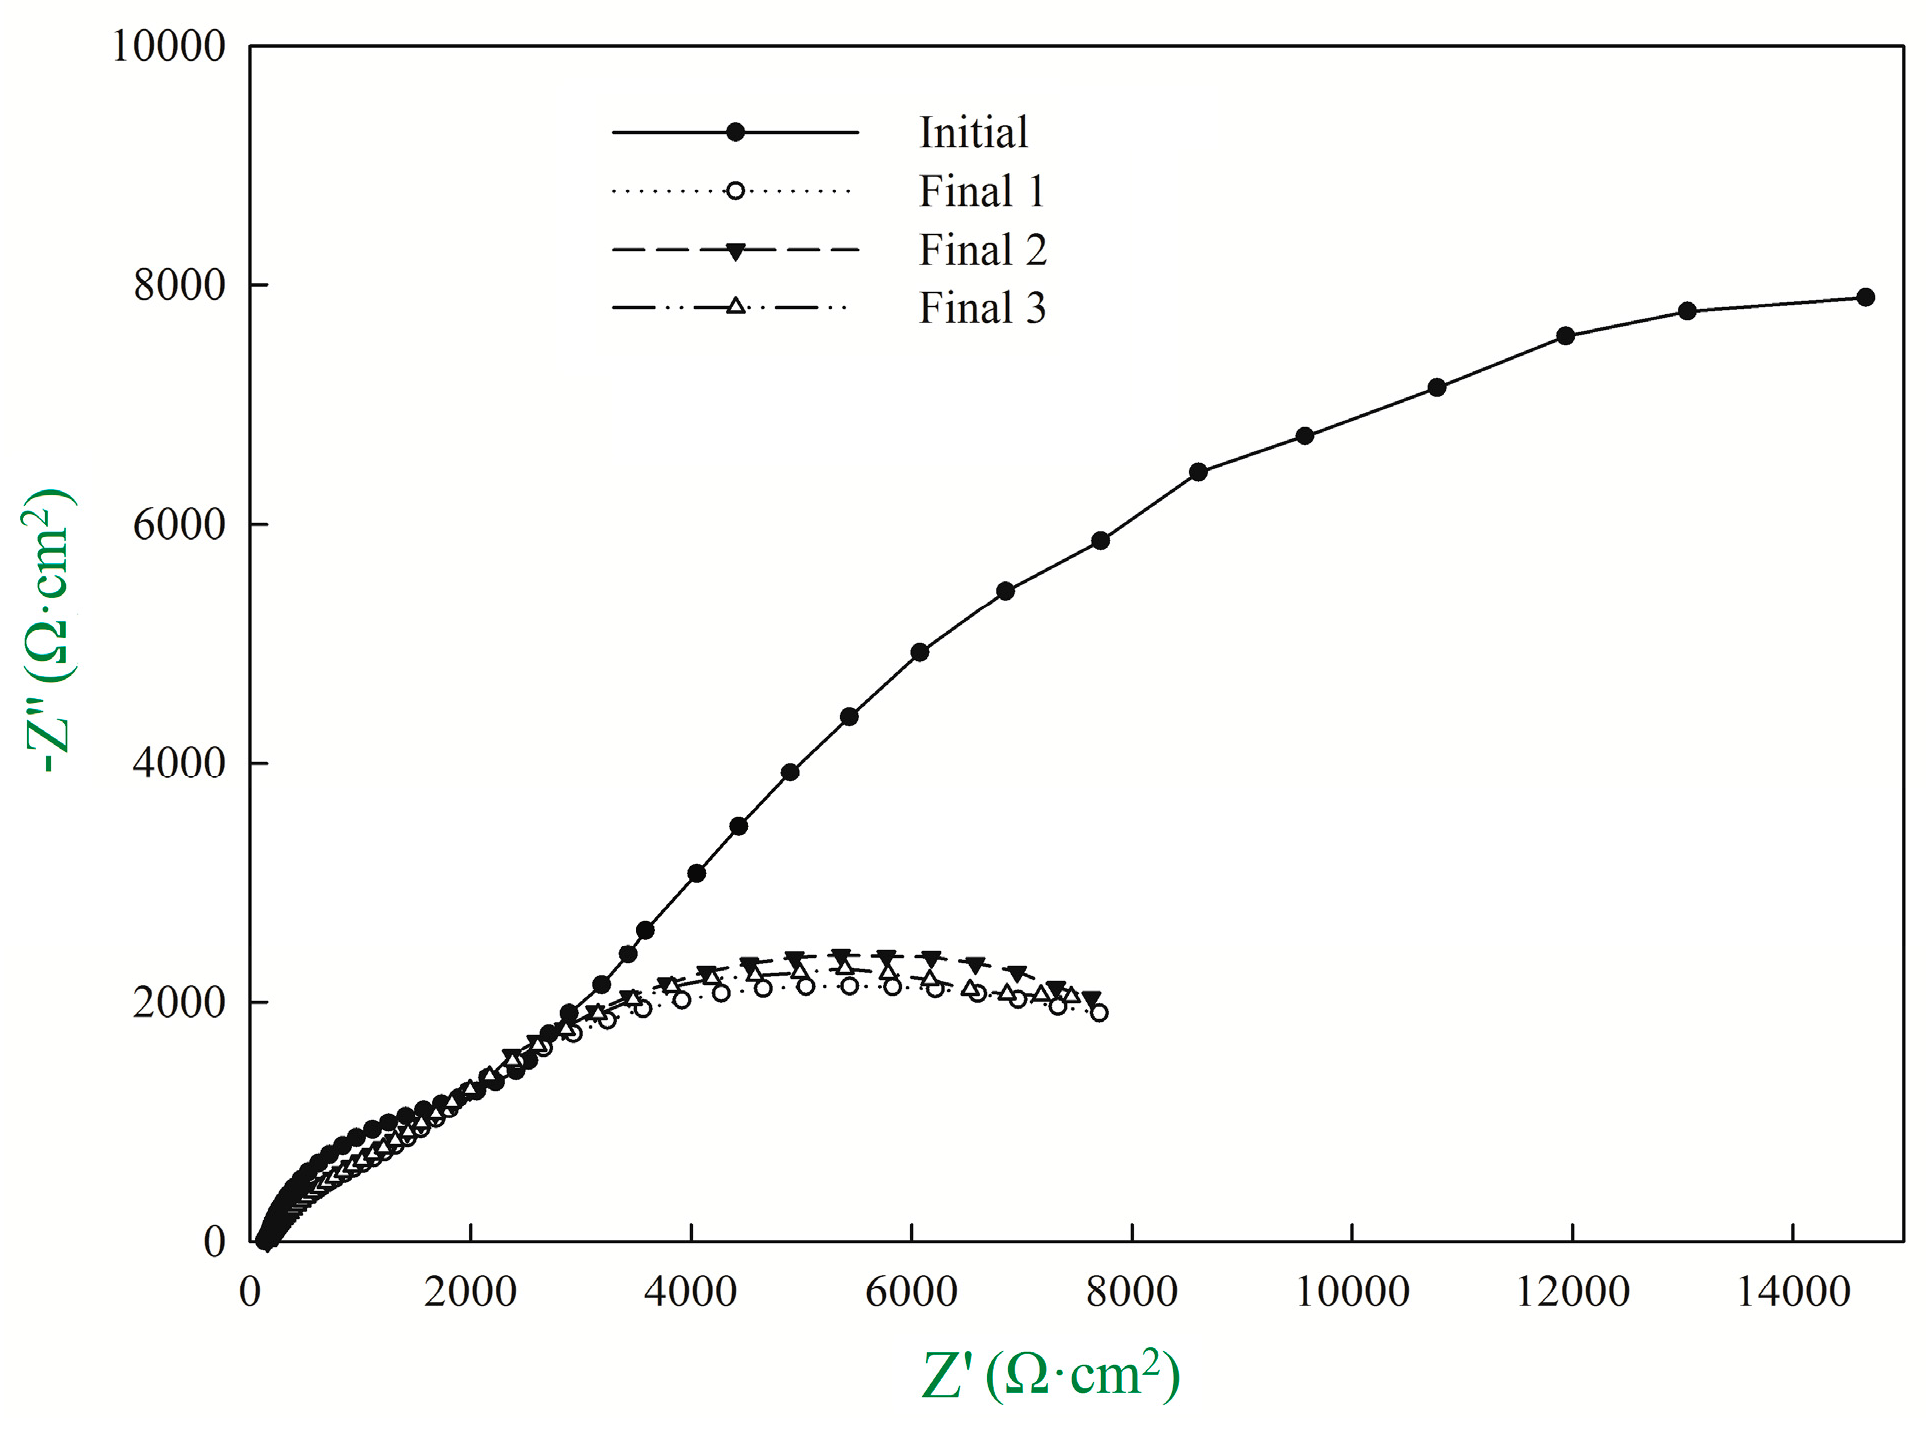
| Rp1 (Ω·cm2) | CPE1-T (μF·cm2) | CPE1-P (μF·cm2) | Rp2 (Ω·cm2) | CPE2-T (μF·cm2) | CPE2-P (μF·cm2) | Rp3 (Ω·cm2) | icorr (μA/cm2) | |
|---|---|---|---|---|---|---|---|---|
| Initial | 132.5 | 3.52 × 10⁻⁵ | 0.76 | 2720 | 2.40 × 10⁻⁴ | 0.69 | 30,077 | 1.63 |
| Final 1 | 154.2 | 9.07 × 10⁻⁵ | 0.62 | 2256 | 2.25 × 10⁻⁴ | 0.68 | 7540 | 10.97 |
| Final 2 | 156.1 | 8.99 × 10⁻⁵ | 0.62 | 2197 | 2.35 × 10⁻⁴ | 0.64 | 7609 | 10.87 |
| Final 3 | 154.6 | 8.54 × 10⁻⁵ | 0.62 | 2094 | 2.21 × 10⁻⁴ | 0.62 | 7554 | 10.95 |
| Symbol | Crack Width (mm) | Crack Number | Crack Spacing (mm) | (μA/cm2) | (μA/cm2) | (μA/cm2) | Average Value (μA/cm2) | Standard Deviation (μA/cm2) |
|---|---|---|---|---|---|---|---|---|
| N | 0 | 0 | - | 4.00 | 3.88 | 3.63 | 3.84 | 0.19 |
| A1 | 0.05 | 1 | - | 7.81 | 7.76 | 7.68 | 7.75 | 0.07 |
| A2 | 0.1 | 1 | - | 8.06 | 8.12 | 8.04 | 8.07 | 0.04 |
| A3 | 0.2 | 1 | - | 8.92 | 8.86 | 8.88 | 8.89 | 0.03 |
| B1 | 0.1 | 2 | 15 | 9.48 | 9.36 | 9.44 | 9.43 | 0.06 |
| B2 | 0.1 | 2 | 25 | 9.24 | 9.32 | 9.34 | 9.30 | 0.05 |
| C1 | 0.1 | 3 | 15 | 12.86 | 12.75 | 12.78 | 12.80 | 0.06 |
| C2 | 0.1 | 3 | 25 | 12.44 | 12.54 | 12.45 | 12.48 | 0.06 |
| Source of Variance | Square of Deviance | Degree of Freedom | Estimate of Variance | F-Value | F0.01 (3,8) | Significance |
|---|---|---|---|---|---|---|
| Crack width | 45.618 | 3 | 15.206 | 1427.80 | 7.59 | ** |
| Error | 0.085 | 8 | 0.011 | |||
| Total | 45.703 |
| Source of Variance | Square of Deviance | Degree of Freedom | Estimate of Variance | F-Value | F0.01 (3,8) | Significance |
|---|---|---|---|---|---|---|
| Crack number | 123.733 | 3 | 41.244 | 3721.29 | 7.59 | ** |
| Error | 0.089 | 8 | 0.011 | |||
| Total | 123.822 |
| Source of Variance | Square of Deviance | Degree of Freedom | Estimate of Variance | F-Value | F0.05 (1,4) | F0.1 (1,4) | Significance |
|---|---|---|---|---|---|---|---|
| Crack spacing | 0.024 | 1 | 0.024 | 7.367 | 7.71 | 4.54 | * |
| Error | 0.013 | 4 | 0.003 | ||||
| Total | 0.037 |
| Source of Range Value | Range Value | q0.05 (4,8) | q0.01 (4,8) | MSe | HSD0.05 | HSD0.01 | Significance |
|---|---|---|---|---|---|---|---|
| K0.05–K0 | 3.91 | 7.35 | 11.5 | 0.011 | 0.445 | 0.70 | ** |
| K0.1–K0.05 | 0.32 | - | |||||
| K0.2–K0.1 | 0.82 | ** | |||||
| K0.1–K0 | 4.23 | ** | |||||
| K0.2–K0 | 5.05 | ** | |||||
| K0.2–K0.05 | 1.14 | ** |
| Source of Range Value | Range Value | q0.05 (4,8) | q0.01 (4,8) | MSe | HSD0.05 | HSD0.01 | Significance |
|---|---|---|---|---|---|---|---|
| K1–K0 | 4.23 | 7.35 | 11.5 | 0.011 | 0.445 | 0.70 | ** |
| K2–K1 | 1.36 | ** | |||||
| K3–K2 | 3.37 | ** | |||||
| K2–K0 | 5.59 | ** | |||||
| K3–K0 | 8.96 | ** | |||||
| K3–K1 | 4.73 | ** |
| Source of Range Value | Range Value | q0.05 (2,4) | q0.01 (2,4) | MSe | HSD0.05 | HSD0.01 | Significance |
|---|---|---|---|---|---|---|---|
| K15–K25 | 0.13 | 9.8 | 22.3 | 0.003 | 0.31 | 0.70 | - |
© 2018 by the authors. Licensee MDPI, Basel, Switzerland. This article is an open access article distributed under the terms and conditions of the Creative Commons Attribution (CC BY) license (http://creativecommons.org/licenses/by/4.0/).
Share and Cite
Cheng, Y.; Zhang, Y.; Tan, G.; Jiao, Y. Effect of Crack on Durability of RC Material under the Chloride Aggressive Environment. Sustainability 2018, 10, 430. https://doi.org/10.3390/su10020430
Cheng Y, Zhang Y, Tan G, Jiao Y. Effect of Crack on Durability of RC Material under the Chloride Aggressive Environment. Sustainability. 2018; 10(2):430. https://doi.org/10.3390/su10020430
Chicago/Turabian StyleCheng, Yongchun, Yuwei Zhang, Guojin Tan, and Yubo Jiao. 2018. "Effect of Crack on Durability of RC Material under the Chloride Aggressive Environment" Sustainability 10, no. 2: 430. https://doi.org/10.3390/su10020430
APA StyleCheng, Y., Zhang, Y., Tan, G., & Jiao, Y. (2018). Effect of Crack on Durability of RC Material under the Chloride Aggressive Environment. Sustainability, 10(2), 430. https://doi.org/10.3390/su10020430