Comprehensive Sustainability Evaluation of High-Speed Railway (HSR) Construction Projects Based on Unascertained Measure and Analytic Hierarchy Process


Abstract
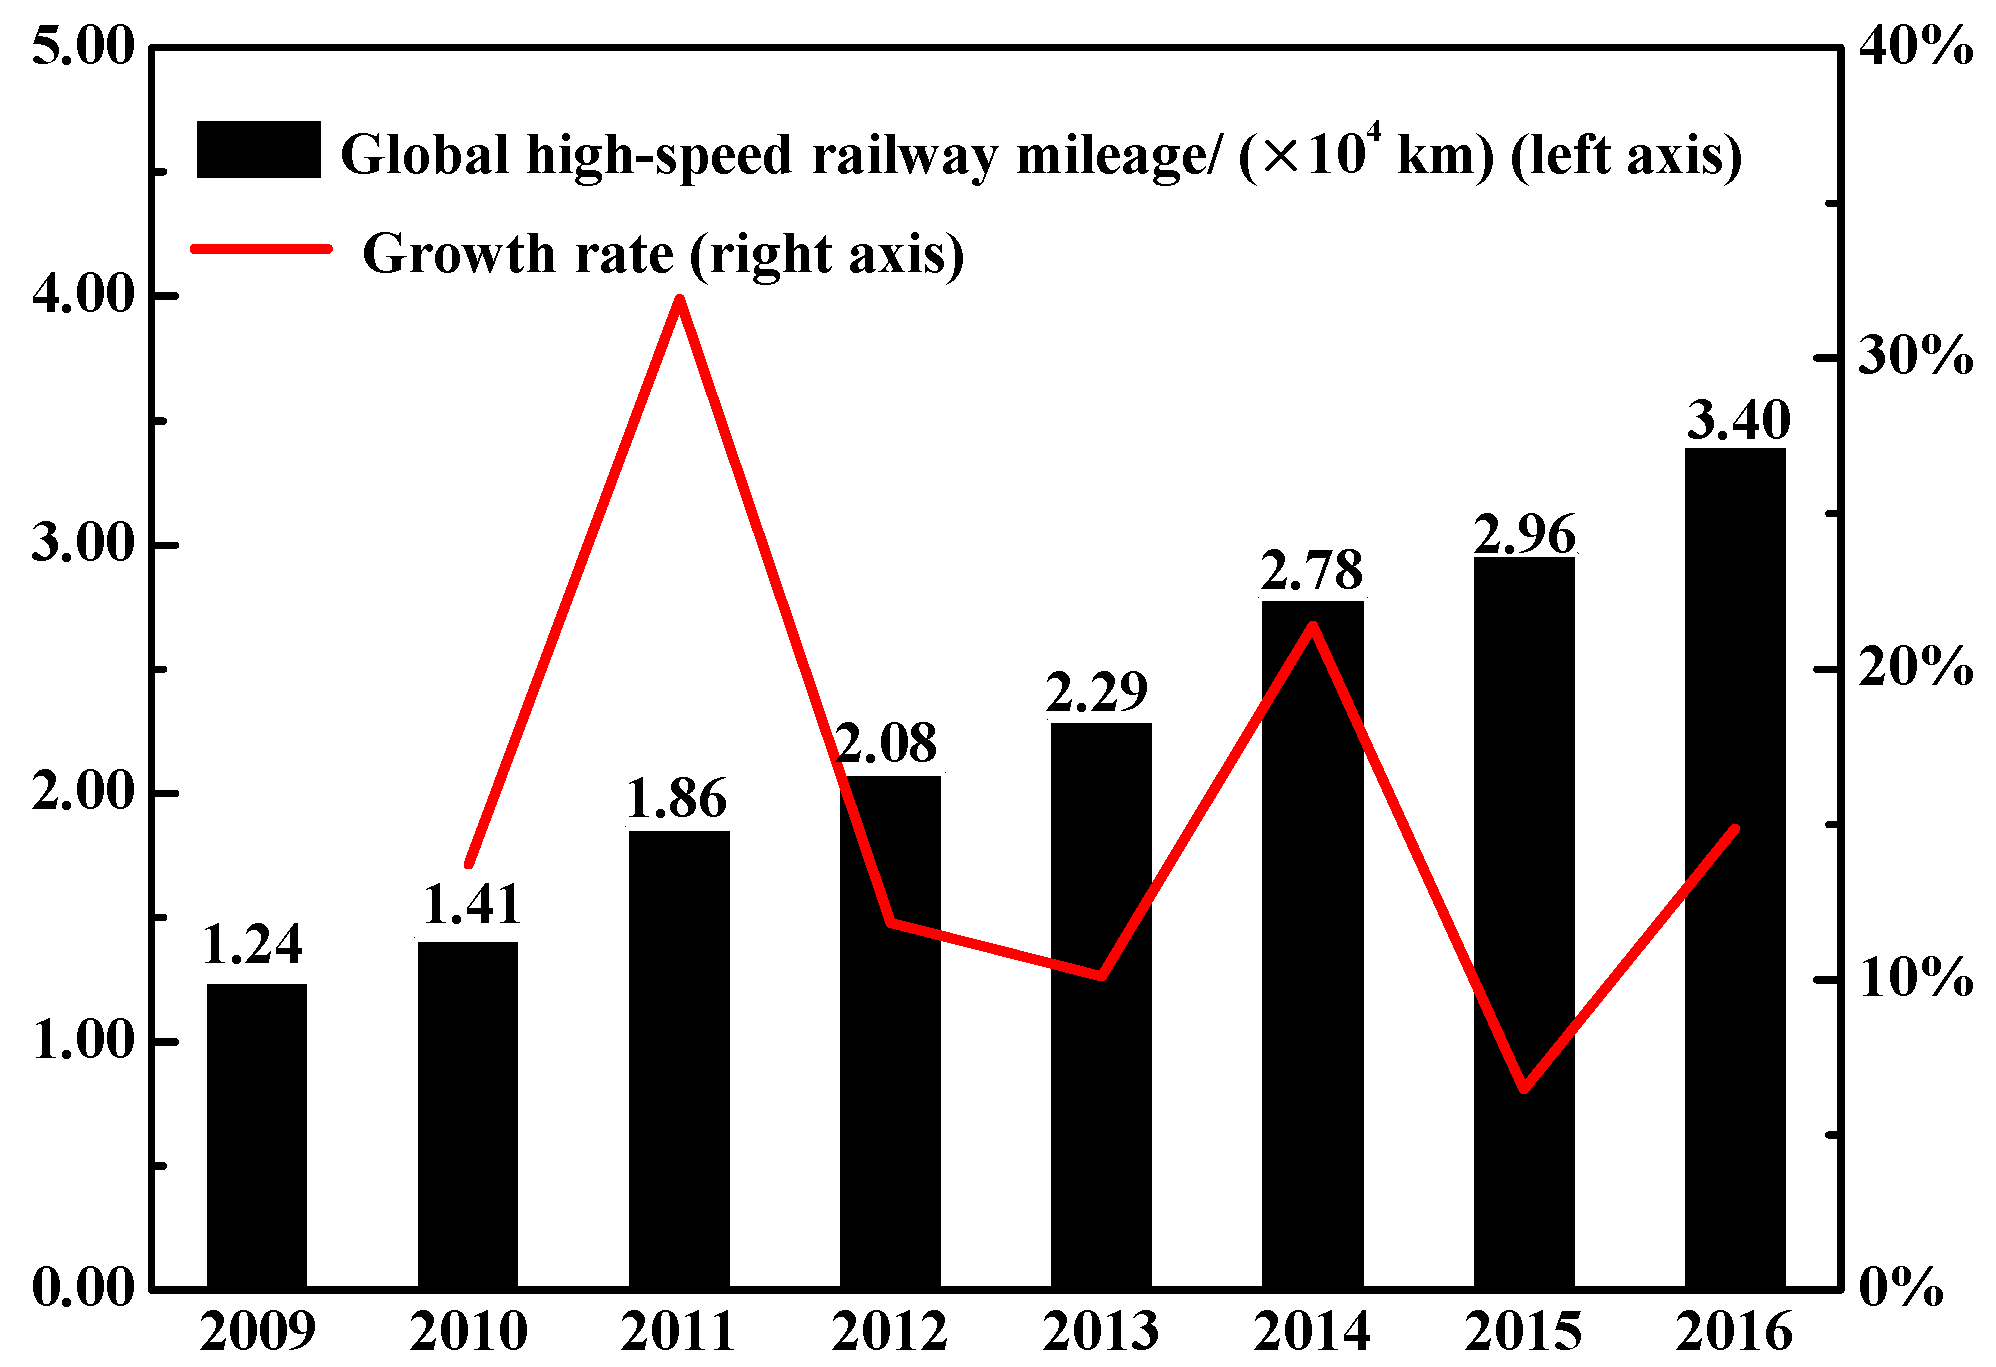
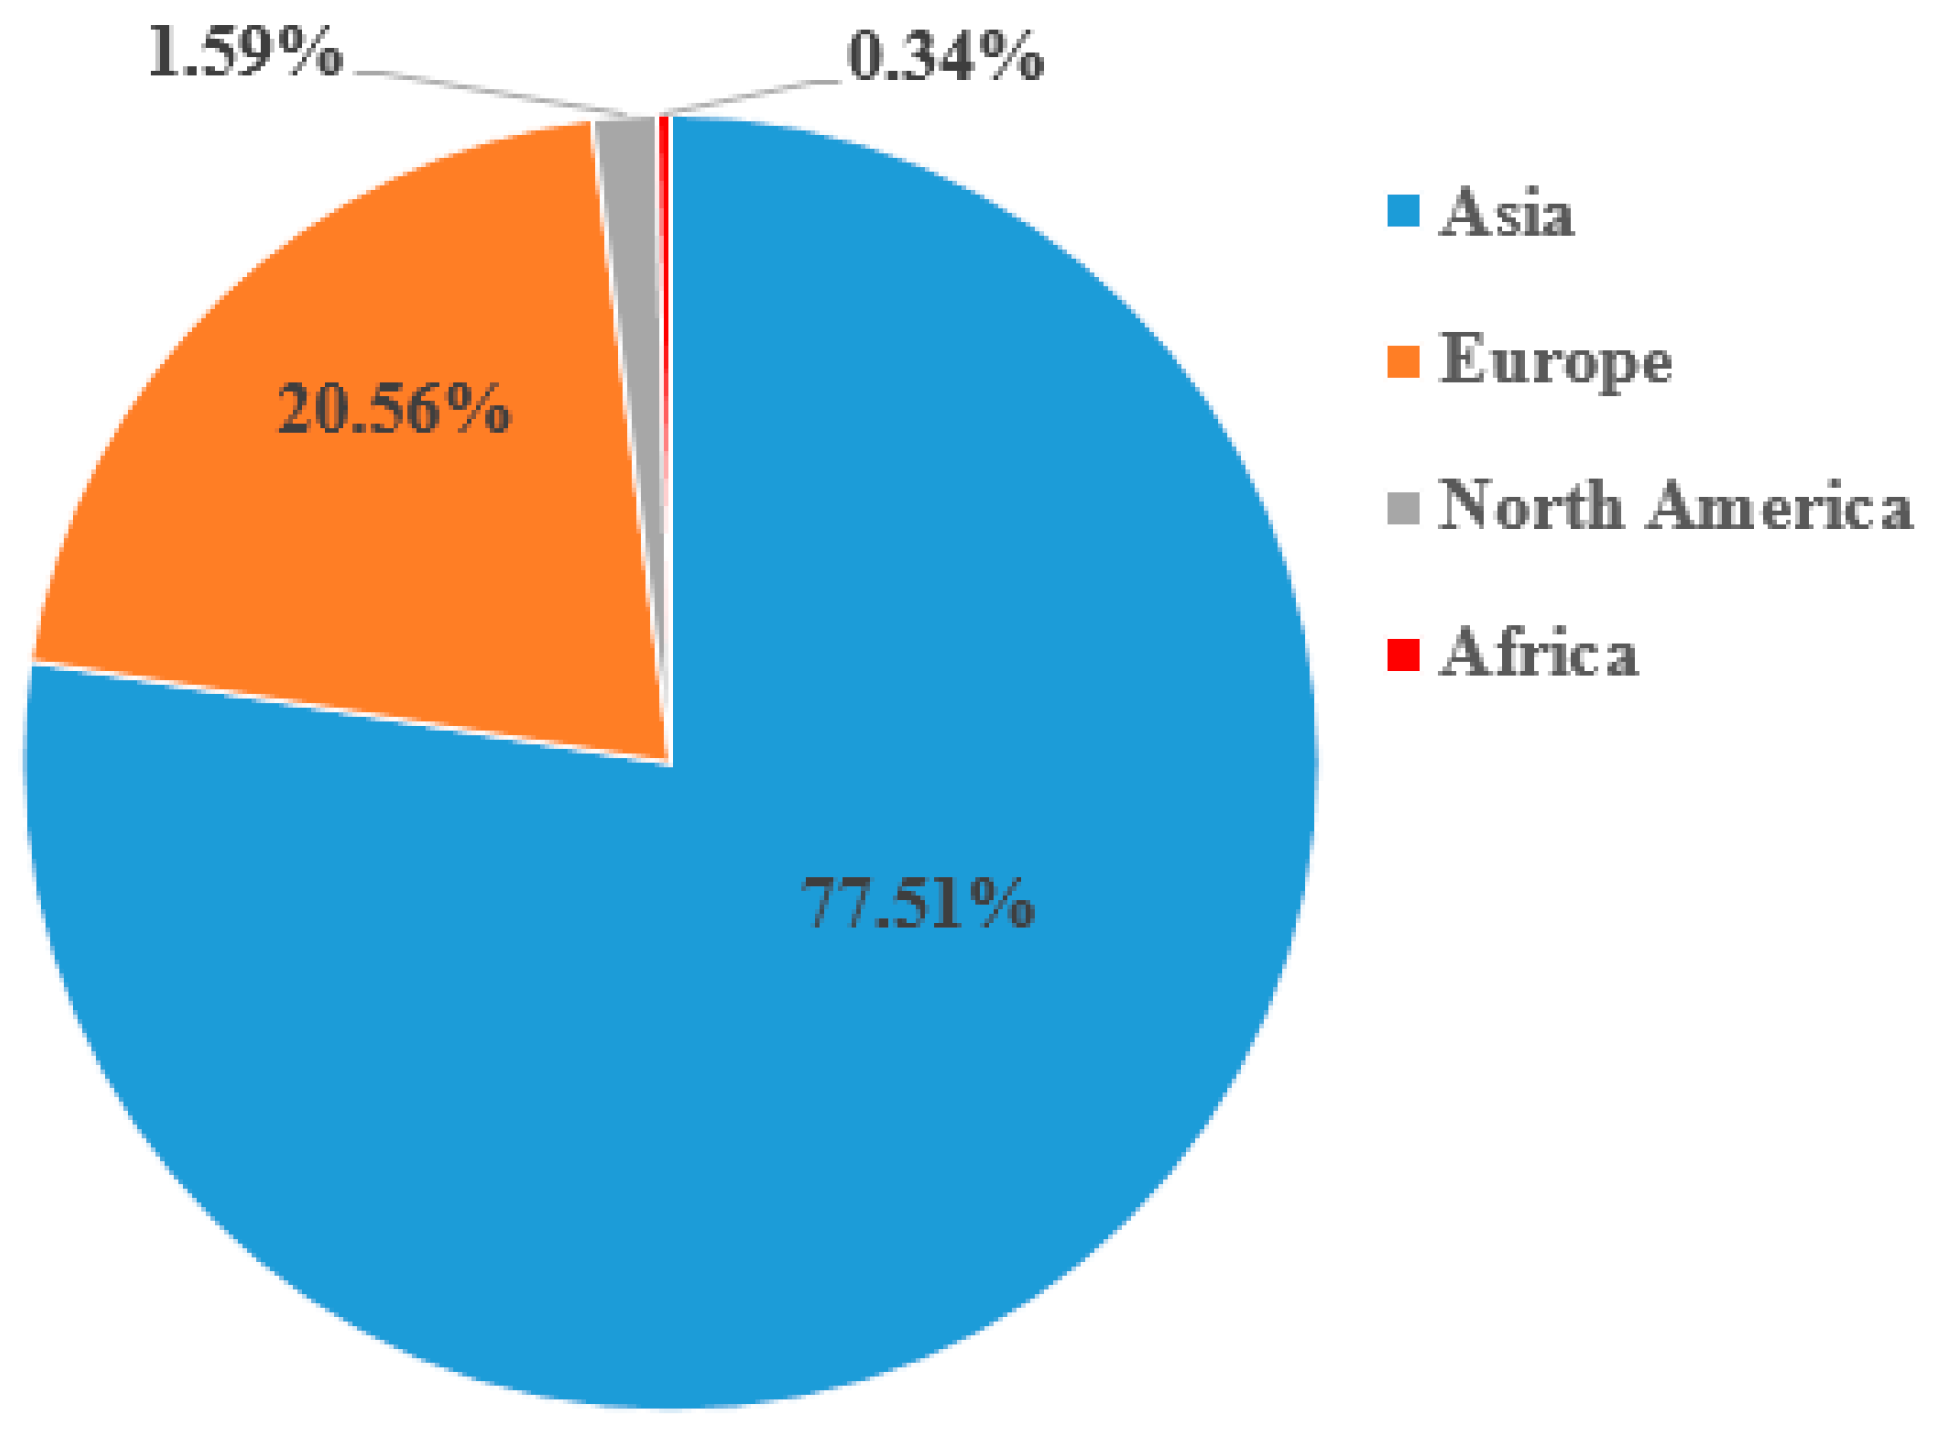
:1. History of HSR
2. Requirements on HSR
3. Literature Review
4. Establishment of Evaluation Index System
5. Unascertained Measure Theory
6. Establishment of Unascertained Measure Model
6.1. Single-Index Measure
6.1.1. Single-Index Measure Matrix
6.1.2. Distinction Weight of Single-Index
6.2. First Grade Index Measure
6.3. Determination of First Grade Index Weight by AHP
6.4. Identification
7. Case Study
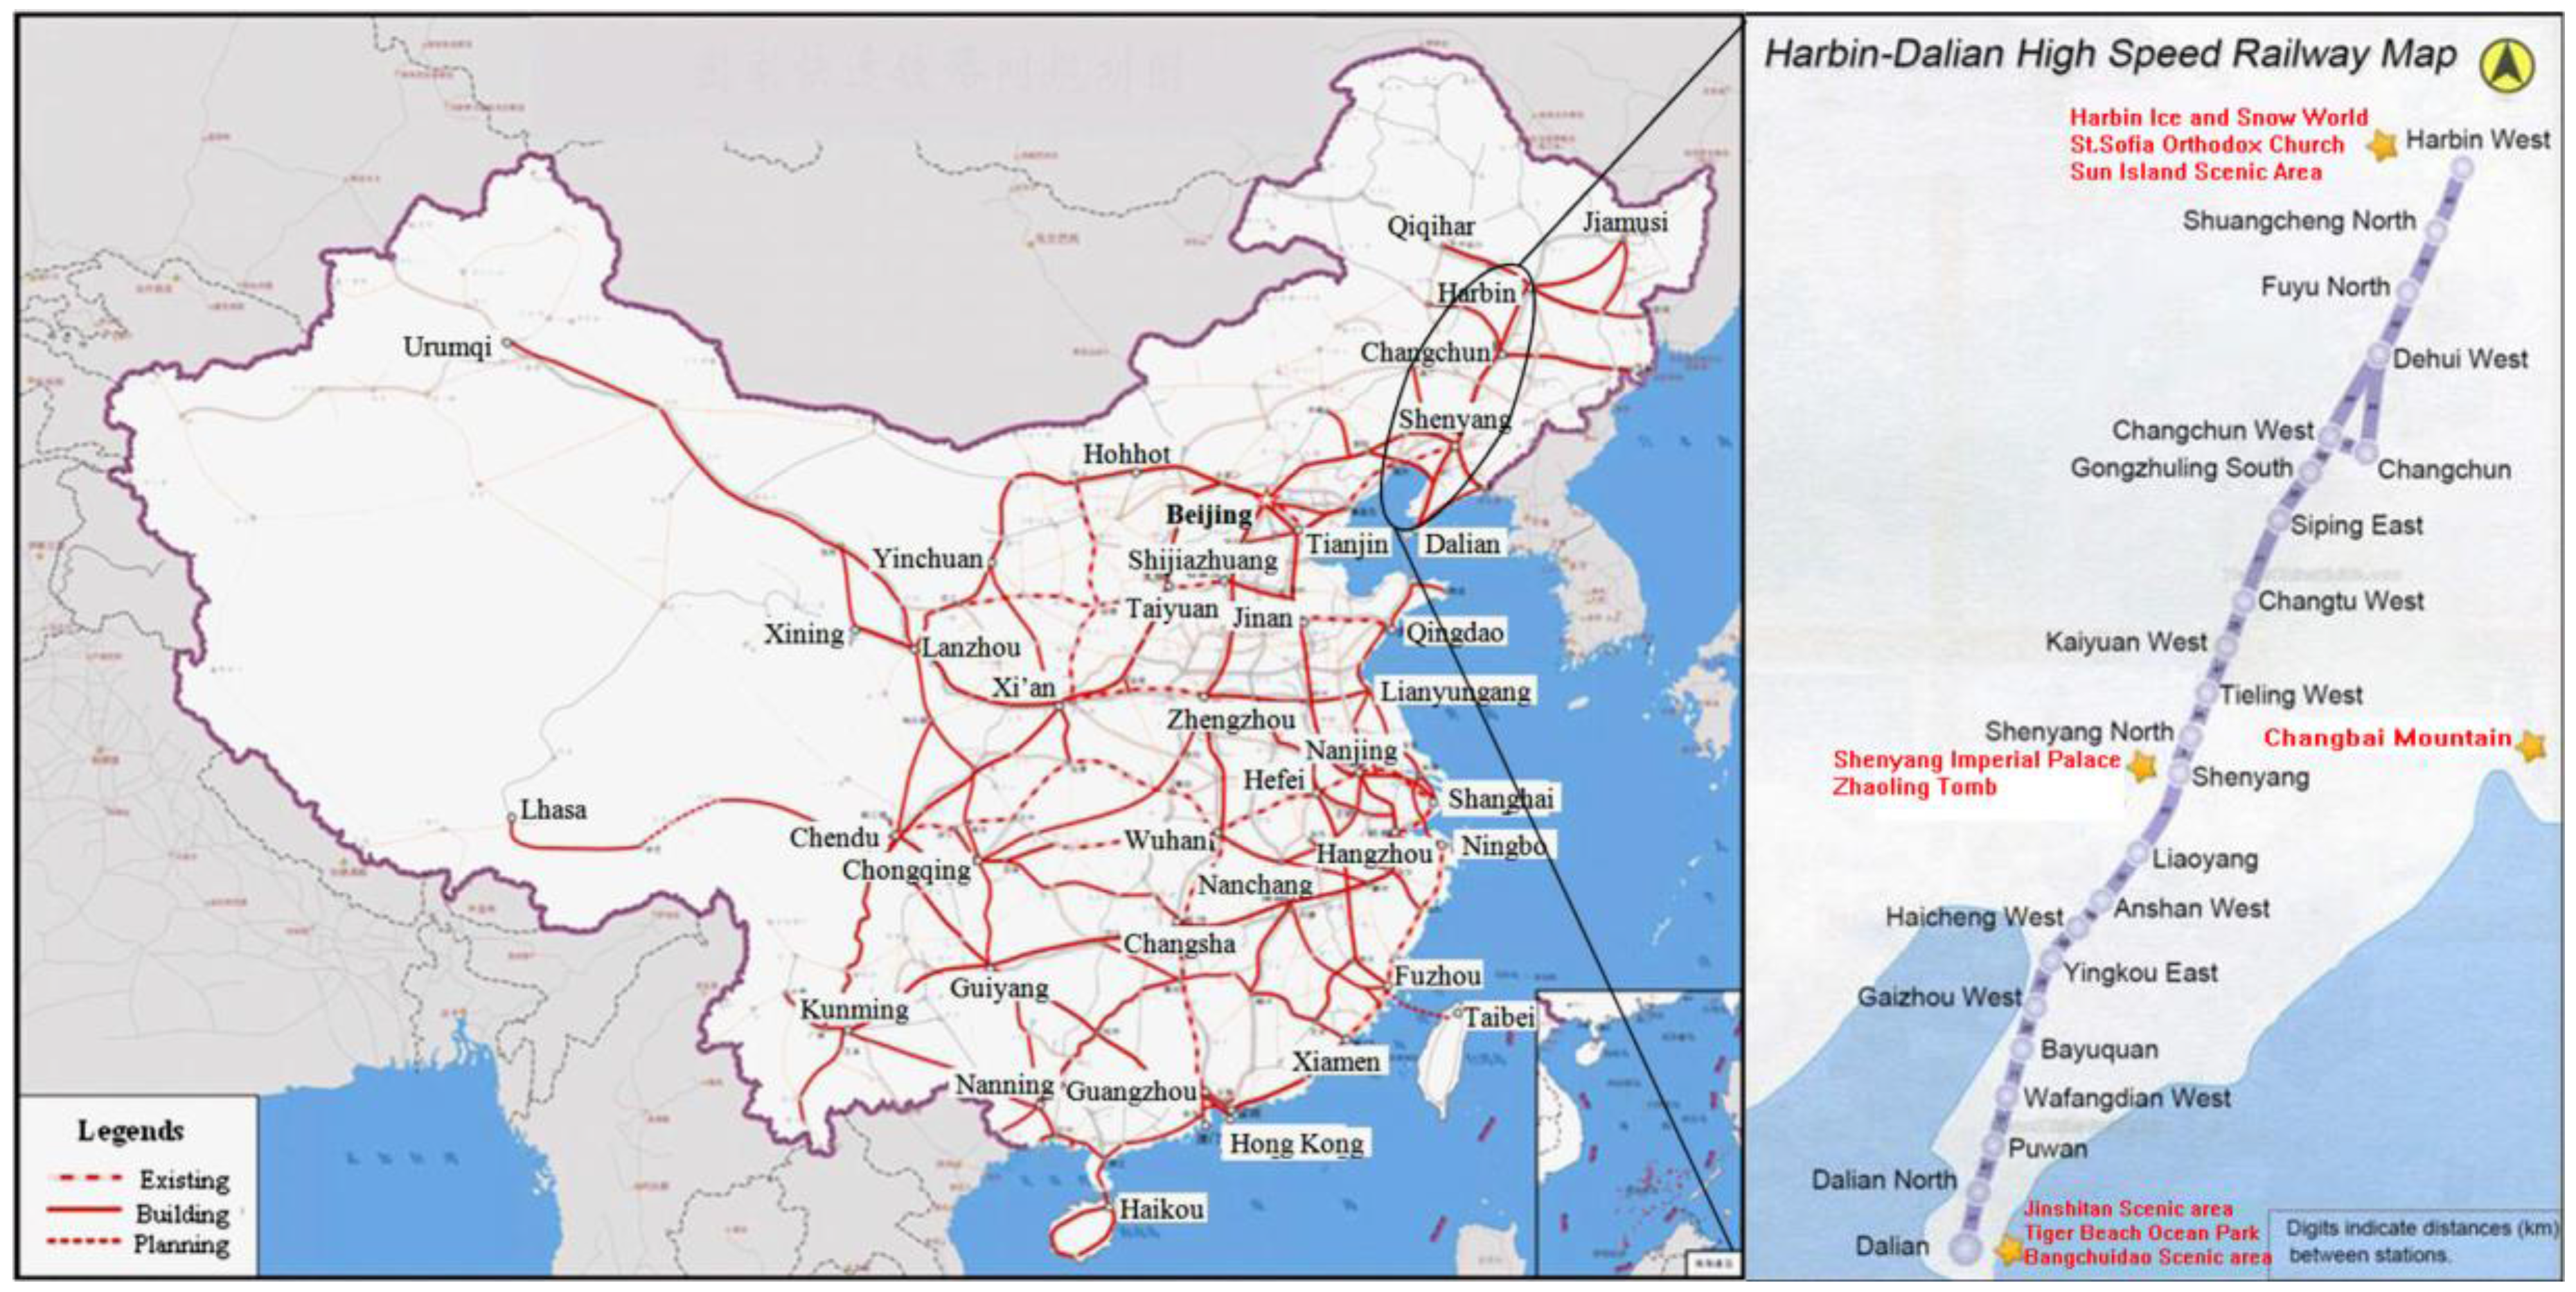
7.1. Overview
7.2. Weight Calculation of Second Grade Index
7.3. Measure Calculation of First Grade Index
7.4. Determining the Classification Weight of First Grade Index
7.5. Calculation of Comprehensive Measure Vector
7.6. Confidence Level Recognition
7.7. Result Discussion
7.7.1. Process Evaluation
7.7.2. Economic Benefits
7.7.3. Effect Evaluation
7.7.4. Sustainability Evaluation
7.7.5. Overall Result
8. Conclusions
- (1)
- The AHP was adopted to realize simultaneous qualitative and quantitative evaluations of influencing factors. Then, the weights were assigned in a rational and consistent manner, such that the importance of each index was measured correctly. This reflects the significance different among evaluation factors in the sustainability evaluation system.
- (2)
- The sustainability evaluation shows that the Harbin-Dalian PDL project achieved good results in process, economic benefits, effects, and sustainability, thanks to the excellent performance of decision-making, construction and operation. The opening and operation of the PDL will bring long-term benefits to tourism, the economy, transport capacity, and many other fields.
- (3)
- In spite of its good overall sustainability, the Harbin-Dalian PDL project needs to further increase its economic benefits and reduce its negative environmental effect. For this purpose, it is necessary to adopt the management mode of “separation between network and transportation” and apply noise prevention measures like noise barriers, tunnels, and overhead viaducts.
- (4)
- Facing the increasingly rapid development and construction of HSR, the sustainability evaluation of HSR construction projects needs to learn from the relatively mature research methods at home and abroad, in order to make up for the shortcomings of the existing research methods in terms of breadth and accuracy. The scientific evaluation system should be constructed to make the citation and index selection more scientific in the empirical research, and to strengthen the prediction of the impact capacity of the future construction of HSR, not just to analyze the impact of the existing HSR.
Acknowledgments
Author Contributions
Conflicts of Interest
References
- Yao, E.J.; Yang, Q.R.; Zhang, Y.S.; Sun, X.A. Study on high-speed rail pricing strategy in the context of modes competition. Discret. Dyn. Nat. Soc. 2013, 2013, 4–9. [Google Scholar] [CrossRef]
- Wang, Y.H.; Deng, X.M.; Marcucci, D.J.; Le, Y.E. Sustainable development planning of protected areas near cities: Case study in China. J. Urban Plan. Dev. 2013, 139, 133–143. [Google Scholar] [CrossRef]
- Ericson, J.A. A participatory approach to conservation in the Calakmul Biosphere Reserve, Campeche, Mexico. Landsc. Urban Plan. 2006, 74, 242–266. [Google Scholar] [CrossRef]
- Jansson, Å. Reaching for a sustainable, resilient urban future using the lens of ecosystem services. Ecol. Econ. 2013, 86, 285–291. [Google Scholar] [CrossRef]
- The State Council of the People’s Republic of China. About Print and Distribute “the Notice of National Resources City Sustainable Development Planning (2013–2020)” [EB/OL]. The Central Government Portal Website. Available online: http://www.gov.cn/zwgk/2013-12/03/content_2540070.htm (accessed on 3 December 2013).
- Moretti, L.; Moretti, M.; Ricci, S. Upgrading of Florence public transport to incorporate new tramlines. Ing. Ferrov. 2017, 72, 569–584. [Google Scholar]
- Arduin, J.P.; Ni, J.C. French TGV network development. Jpn. Railw. Trans. Rev. 2005, 40, 22–28. [Google Scholar]
- Huang, Y.; Ge, Y.J.; Ma, T.; Liu, X.F. Geopolitical space of China’s high-speed railway diplomacy. Prog. Geogr. 2017, 36, 1489–1499. [Google Scholar]
- Wu, H.; Liu, W.; Choul, K.S. The strategic marketing of China high-speed railway: Government behavior or market behavior. J. Mark. Stud. 2017, 25, 185–194. [Google Scholar]
- Lin, Y.T. Travel costs and urban specialization patterns: Evidence from China’s high speed railway system. J. Urban Econ. 2017, 98, 98–123. [Google Scholar] [CrossRef]
- Li, H.; Zhang, P.Y.; Cheng, Y.Q. Economic vulnerability of mining city—A case study of Fuxin City, Liaoning Province, China. Chin. Geogr. Sci. 2009, 19, 211–218. [Google Scholar] [CrossRef]
- Hayter, R.; Barnes, T.J. Labor market segmentation, flexibility and recession: A British Colombian case study. Environ. Plan. 1992, 10, 333–353. [Google Scholar] [CrossRef]
- Randall, J.E.; Ironside, R.G. Communities on the edge: An economic geography of resource-dependent communities in Canada. Can. Geogr. 1996, 40, 17–35. [Google Scholar] [CrossRef]
- Hilson, G. Sustainable development policies in Canada mining sector: An overview of government and industry efforts. Environ. Sci. Policy 2003, 3, 110. [Google Scholar]
- Jin, X.F.; Dong, S.C.; Liu, W.; Li, X. Study on relationship between industrial chain extension and evolution of resource-based city—A case study on Tongling city. Econ. Geogr. 2010, 30, 403–408. [Google Scholar]
- Swaine, M.D. Chinese Views and Commentary on the “One Belt, One Road” Initiative. China Leadersh. Monit. 2015, 1, 1–24. [Google Scholar]
- Greene, D.L.; Wegener, M. Sustainable transport. J. Transp. Geogr. 1997, 5, 177–190. [Google Scholar] [CrossRef]
- Hoogma, R.; Kemp, R.; Schot, J.; Truffer, B. Experimenting for sustainable transport: The Approach of Strategic Niche Management. Technol. Anal. Strateg. 2002, 23, 517–518. [Google Scholar]
- Litman, T. Developing Indicators for comprehensive and sustainable transport planning. Transp. Res. Rec. J. Transp. Res. Board 2007, 43, 10–15. [Google Scholar] [CrossRef]
- Elvik, R. The non-linearity of risk and the promotion of environmentally sustainable transport. Accid. Anal. Prev. 2009, 41, 849–855. [Google Scholar] [CrossRef] [PubMed]
- Hickman, R. Automobility in transition: A socio-technical analysis of sustainable transport. Transp. Rev. 2012, 33, 128–129. [Google Scholar] [CrossRef]
- O’Brien, O.; Cheshire, J.; Batty, M. Mining bicycle sharing data for generating insights into sustainable transport systems. J. Transp. Geogr. 2014, 34, 262–273. [Google Scholar] [CrossRef]
- Chang, Y.Z.; Dong, S.C. Study on green ecological assessment of high-speed railway construction project based on unascertained measure and AHP. Teh. Vjesn. 2017, 24, 1579–1589. [Google Scholar]
- Liu, Y.H. Study on Sustainable Development of China’s High-Speed Railways; Press of University of Chinese Academy of Sciences: Beijing, China, 2014. [Google Scholar]
- Litman, T.; Burwell, D. Issues in sustainable transportation. Int. J. Glob. Environ. 2006, 6, 331–347. [Google Scholar] [CrossRef]
- Chen, X.Y.; Chang, Y.L. The Study of evacuation passenger service level of Shanghai-Nanjing high-speed railway stations. Procedia Soc. Behav. Sci. 2013, 96, 265–269. [Google Scholar] [CrossRef]
- Chang, Y.Z.; Dong, S.C. Study on Post Evaluation of High-Speed Railway Based on FAHP and Matlab Simulation Calculation. Teh. Vjesn. 2017, 24, 1749–1758. [Google Scholar]
- Moretti, L.; Di Mascio, P.; Bellagamba, S. Environmental, human health and socio-economic effects of cement powders. Int. J. Environ. Res. Public Health 2017, 14, 645. [Google Scholar] [CrossRef] [PubMed]
- Chen, J.H.; Yang, L.R.; Su, M.C.; Lin, J.Z. A rule extraction based approach in predicting derivative use for financial risk hedging by construction companies. Expert Syst. Appl. 2010, 37, 6510–6514. [Google Scholar] [CrossRef]
- Wang, Y.M.; Elhag, T.M.S. Fuzzy TOPSIS method based on alpha level sets with an application to bridge risk assessment. Expert Syst. Appl. 2006, 31, 309–319. [Google Scholar] [CrossRef]
- Cucala, A.P.; Fernández, A.; Sicre, C.; Domínguez, M. Fuzzy optimal schedule of high-speed train operation to minimize energy consumption with uncertain delays and driver’s behavioral response. Eng. Appl. Intell. 2012, 25, 1548–1557. [Google Scholar] [CrossRef]
- Chen, S.K.; Leng, Y.; Mao, B.H.; Liu, S. Integrated weight-based multi-criteria evaluation on transfer in large transport terminals: A case study of the Beijing South Railway Station. Transp. Res. Part A Policy Pract. 2014, 66, 13–26. [Google Scholar] [CrossRef]
- Luca, D.M.; Dell’Acqua, G.; Lamberti, R. High-speed rail track design using GIS and multi-criteria analysis. Procedia Soc. Behav. Sci. 2012, 54, 608–617. [Google Scholar] [CrossRef]
- Liu, P.; Yang, L.X.; Gao, Z.Y.; Li, S.K.; Gao, Y. Fault tree analysis combined with quantitative analysis for high-speed railway accidents. Saf. Sci. 2015, 79, 344–357. [Google Scholar] [CrossRef]
- Di Mascio, P.; Loprencipe, G.; Maggioni, F. Visco-elastic modeling for railway track structure layers. Ing. Ferrov. 2014, 69, 207–222. [Google Scholar]
- D’Andrea, A.; Loprencipe, G.; Xhixha, E. Vibration induced by rail traffic: Evaluation of attenuation properties in a bituminous sub-ballast layer. Procedia Soc. Behav. Sci. 2012, 53, 245–255. [Google Scholar] [CrossRef]
- Zoccali, P.; Cantisani, G.; Loprencipe, G. Ground-vibrations induced by trains: Filled trenches mitigation capacity and length influence. Constr. Build. Mater. 2015, 74, 1–8. [Google Scholar] [CrossRef]
- Ministry of Housing and Urban-Rural Development of the PRC; National Development and Reform Commission of the PRC; Ministry of Railways of the PRC. Railway Construction Project Economic Evaluation Methods and Parameters, 3nd ed.; China Planning Press: Beijing, China, 2012.
- Shuai, B.; Huang, W.C.; Li, M.L.; Wang, S.; Li, K.N. Railway benefit assessment summary of the World Bank and the Asian Development Bank. J. Transp. Syst. Eng. Inf. Technol. 2017, 3, 222–228. [Google Scholar]
- Chang, Y.Z.; Dong, S.C. Evaluation of sustainable development of resources-based cities in Shanxi Province based on unascertained measure. Sustainability 2016, 8, 585. [Google Scholar] [CrossRef]
- Chang, Y.Z.; Dong, S.C. Study on evaluation model of international trade in agricultural products based on unascertained measure. Chem. Eng. Trans. 2016, 51, 673–678. [Google Scholar]
- Mill, J. Whether political economy is useful? Lond. Rev. 1836, 2, 535–572. [Google Scholar]
- Kolmogorov, A.H. Foundations of the Theory Probability, 2nd ed.; Chelsea Publishing Company: New York, NY, USA, 1956. [Google Scholar]
- Zaden, L.A. Fuzzy sets. Inf. Control 1965, 8, 338–353. [Google Scholar]
- Deng, J.L. The Grey System (Society Economic); National Defence Industry Press: Beijing, China, 1985. [Google Scholar]
- Wang, Q.Y. Grey Mathematical Basis; HUST Press: Wuhan, China, 1996. [Google Scholar]
- Wang, G.Y. Unascertained information and its mathematical treatment. J. Harbin. Univ. Civ. Eng. Archit. 1990, 4, 1–3. [Google Scholar]
- Álvaro, F.; Sánchez, J.A.; Benedí, J.M. An integrated grammar-based approach for mathematical expression recognition. Pattern Recognit. 2016, 51, 135–147. [Google Scholar] [CrossRef]
- Wu, H.B.; Xu, J.H.; Ji, Y.; Wu, M. Uncertain flow calculations of a distribution network containing DG based on blind number theory. IET Gener. Transm. Distrib. 2017, 11, 1591–1597. [Google Scholar] [CrossRef]
- Chen, X.; Liu, Y.; Zhao, X.; Liang, Y.X. Coal industry international competitiveness research. Adv. Sci. Technol. Lett. 2016, 121, 222–226. [Google Scholar]
- Guo, C.Y.; Liu, Z.Q.; Zhang, C.Y. Evaluation on the express enterprise’s service quality of customers perception based on SPSS and unascertained measure model. Int. J. U E Ser. Sci. Technol. 2016, 9, 17–26. [Google Scholar]
- Li, S.C.; Wu, J.N.; Xu, Z.H.; Li, L.P. Unascertained measure model of water and mud inrush risk evaluation in karst tunnels and its engineering application. KSCE J. Civ. Eng. 2017, 21, 1170–1182. [Google Scholar] [CrossRef]
- Saaty, T.L. The Analytic Hierarchy Process; McGraw-Hill: New York, NY, USA, 1980. [Google Scholar]
- Javid, P.J.; Nejat, A.; Hayhoe, K. Selection of CO2 mitigation strategies for road transportation in the United States using a multi-criteria approach. Renew. Sustain. Energy Rev. 2014, 38, 960–972. [Google Scholar] [CrossRef]
- National Bureau of Statistics. International City Statistical Yearbook 2016; China Statistics Press: Beijing, China, 2016.
- Di Mascio, P.; Loprencipe, G.; Moretti, L. Competition in rail transport: Methodology to evaluate economic impact of new trains on track. Sustainability, Eco-Efficiency and Conservation in Transportation Infrastructure Asset Management. In Proceedings of the 3rd International Conference on Transportation Infrastructure (ICIT), Pisa, Italy, 27 April 2014; pp. 669–675. [Google Scholar]
- Guo, J.K.; Wang, S.B.; Wang, H.; Liu, T.B. Impact of Harbin-Dalian high-speed railway on the spatial distribution of tourism supply and demand markets in Northeast China cities: Based on the accessibility of the scenic spots. Prog. Geogr. 2016, 35, 504–514. [Google Scholar]


| Total Index | First Index | Secondary Index | Third Index |
|---|---|---|---|
| Index system of sustainable development on HSR construction project | process evaluation | process evaluation of pre-bid decision-making | necessity of project construction |
| scientific of decision-making program | |||
| survey and design | |||
| construction process evaluation | safety management | ||
| main technical indices | |||
| construction quality | |||
| investment control | |||
| time limit | |||
| operation process evaluation | preparation of operational effect | ||
| operation management level | |||
| evaluation of economic benefits | financial benefit evaluation | payback period of investment | |
| debt service coverage ratio (DSCR) | |||
| national economic benefits evaluation | contribution to GDP | ||
| freight cost reduction benefits | |||
| economic internal rate of return (IRR) | |||
| economic net present value (NPV) | |||
| effect evaluation | social effect evaluation | drive labor and employment | |
| appreciation rate of land and house | |||
| outage rate of cars and planes along the line | |||
| increased transport capacity | |||
| average travel time | |||
| per Capita GNP along the line | |||
| compensate degree of benefit damage group | |||
| boost national prestige | |||
| environmental effect evaluation | ecological environmental effect | ||
| project pollution control | |||
| sustainability evaluation | evaluation of internal sustainability factors | project management mechanism | |
| growth rate of traffic volume | |||
| technical factors | |||
| evaluation of external sustainability factors | benign circulation factors | ||
| project satisfaction | |||
| capital factors |
| Index | Contains the Content | Content Description |
|---|---|---|
| Social Effect Evaluation | effect on residents’ lives | Per Capita GNP along the line |
| Average travel time | ||
| effect on the interest group | drive labor and employment | |
| appreciation rate of land and house | ||
| compensate degree of benefit damage group | ||
| effect on traffic structure | outage rate of cars and planes along the line | |
| increased transport capacity | ||
| effect on the national image | boost national prestige |
| Weight | Description |
|---|---|
| 1 | equal importance |
| 3 | moderately more important |
| 5 | strongly more important |
| 7 | very strongly more important |
| 9 | dominant importance |
| 2, 4, 6, 8 | representing the intermediate values of the above adjacent judgments |
| Reciprocals | anti-comparison |
| Order | 1 | 2 | 3 | 4 | 5 | 6 | 7 | 8 | 9 | 10 | 11 | 12 | 13 | 14 |
|---|---|---|---|---|---|---|---|---|---|---|---|---|---|---|
| 0 | 0 | 0.52 | 0.86 | 1.10 | 1.26 | 1.34 | 1.40 | 1.43 | 1.49 | 1.51 | 1.54 | 1.56 | 1.58 |
| Total Index | First Index | Secondary Index | Third Index | Evaluation Results of 10 Experts | ||||
|---|---|---|---|---|---|---|---|---|
| Very Poor | Poor | Qualified | Good | Excellent | ||||
| X | F1 (0.300) | S1 (0.341) | T1 (0.305) | 0 | 0 | 2 | 5 | 3 |
| T2 (0.37) | 0 | 0 | 2 | 5 | 3 | |||
| T3 (0.325) | 0 | 0 | 0 | 5 | 5 | |||
| S2 (0.361) | T4 (0.087) | 0 | 0 | 0 | 5 | 5 | ||
| T5 (0.285) | 0 | 0 | 1 | 5 | 4 | |||
| T6 (0.306) | 0 | 0 | 0 | 7 | 3 | |||
| T7 (0.225) | 0 | 1 | 3 | 5 | 1 | |||
| T8 (0.097) | 0 | 0 | 0 | 6 | 4 | |||
| S3 (0.298) | T9 (0.6) | 0 | 0 | 2 | 5 | 3 | ||
| T10 (0.4) | 0 | 0 | 0 | 7 | 3 | |||
| F2 (0.339) | S4 (0.25) | T11 (0.5) | 0 | 0 | 1 | 5 | 4 | |
| T12 (0.5) | 0 | 1 | 2 | 4 | 3 | |||
| S5 (0.75) | T13 (0.532) | 0 | 0 | 0 | 6 | 4 | ||
| T14 (0.127) | 0 | 4 | 5 | 1 | 0 | |||
| T15 (0.172) | 0 | 0 | 2 | 6 | 2 | |||
| T16 (0.169) | 0 | 0 | 2 | 6 | 2 | |||
| F3 (0.251) | S6 (0.75) | T17 (0.08) | 0 | 0 | 0 | 6 | 4 | |
| T18 (0.095) | 0 | 0 | 0 | 8 | 2 | |||
| T19 (0.091) | 0 | 0 | 1 | 6 | 3 | |||
| T20 (0.139) | 0 | 0 | 2 | 6 | 2 | |||
| T21 (0.157) | 0 | 0 | 1 | 6 | 3 | |||
| T22 (0.125) | 0 | 0 | 0 | 5 | 5 | |||
| T23 (0.215) | 0 | 1 | 2 | 6 | 1 | |||
| T24 (0.098) | 0 | 0 | 1 | 7 | 2 | |||
| S7 (0.25) | T25 (0.75) | 0 | 0 | 1 | 5 | 4 | ||
| T26 (0.25) | 0 | 1 | 1 | 5 | 3 | |||
| F4 (0.110) | S8 (0.5) | T27 (0.199) | 0 | 0 | 1 | 7 | 2 | |
| T28 (0.386) | 0 | 0 | 0 | 6 | 4 | |||
| T29 (0.415) | 0 | 0 | 1 | 6 | 3 | |||
| S9 (0.5) | T30 (0.182) | 0 | 0 | 0 | 7 | 3 | ||
| T31 (0.428) | 0 | 0 | 0 | 6 | 4 | |||
| T32 (0.39) | 0 | 0 | 1 | 6 | 3 | |||
| Index | Before the Operating of HSR | After the Operating of HSR |
|---|---|---|
| Number of tourist scenic spots in one day | 0 | 53 |
| Number of tourist scenic spots in two days | 32 | 84 |
| Number of tourist cities in one day | 0 | 8 |
| Number of tourist cities in two days | 8 | 20 |
| Average accessibility of tourist scenic spots/h | 7.4 | 4.9 |
| Average accessibility of tourist cities/h | 7.7 | 5.4 |
© 2018 by the authors. Licensee MDPI, Basel, Switzerland. This article is an open access article distributed under the terms and conditions of the Creative Commons Attribution (CC BY) license (http://creativecommons.org/licenses/by/4.0/).
Share and Cite
Chang, Y.; Yang, Y.; Dong, S. Comprehensive Sustainability Evaluation of High-Speed Railway (HSR) Construction Projects Based on Unascertained Measure and Analytic Hierarchy Process. Sustainability 2018, 10, 408. https://doi.org/10.3390/su10020408
Chang Y, Yang Y, Dong S. Comprehensive Sustainability Evaluation of High-Speed Railway (HSR) Construction Projects Based on Unascertained Measure and Analytic Hierarchy Process. Sustainability. 2018; 10(2):408. https://doi.org/10.3390/su10020408
Chicago/Turabian StyleChang, Yongzhi, Yang Yang, and Suocheng Dong. 2018. "Comprehensive Sustainability Evaluation of High-Speed Railway (HSR) Construction Projects Based on Unascertained Measure and Analytic Hierarchy Process" Sustainability 10, no. 2: 408. https://doi.org/10.3390/su10020408
APA StyleChang, Y., Yang, Y., & Dong, S. (2018). Comprehensive Sustainability Evaluation of High-Speed Railway (HSR) Construction Projects Based on Unascertained Measure and Analytic Hierarchy Process. Sustainability, 10(2), 408. https://doi.org/10.3390/su10020408