Evaluating On-Farm Biodiversity: A Comparison of Assessment Methods

 ,
,
Abstract
:1. Introduction
2. Materials and Methods
2.1. Biodiversity Assessment Methods
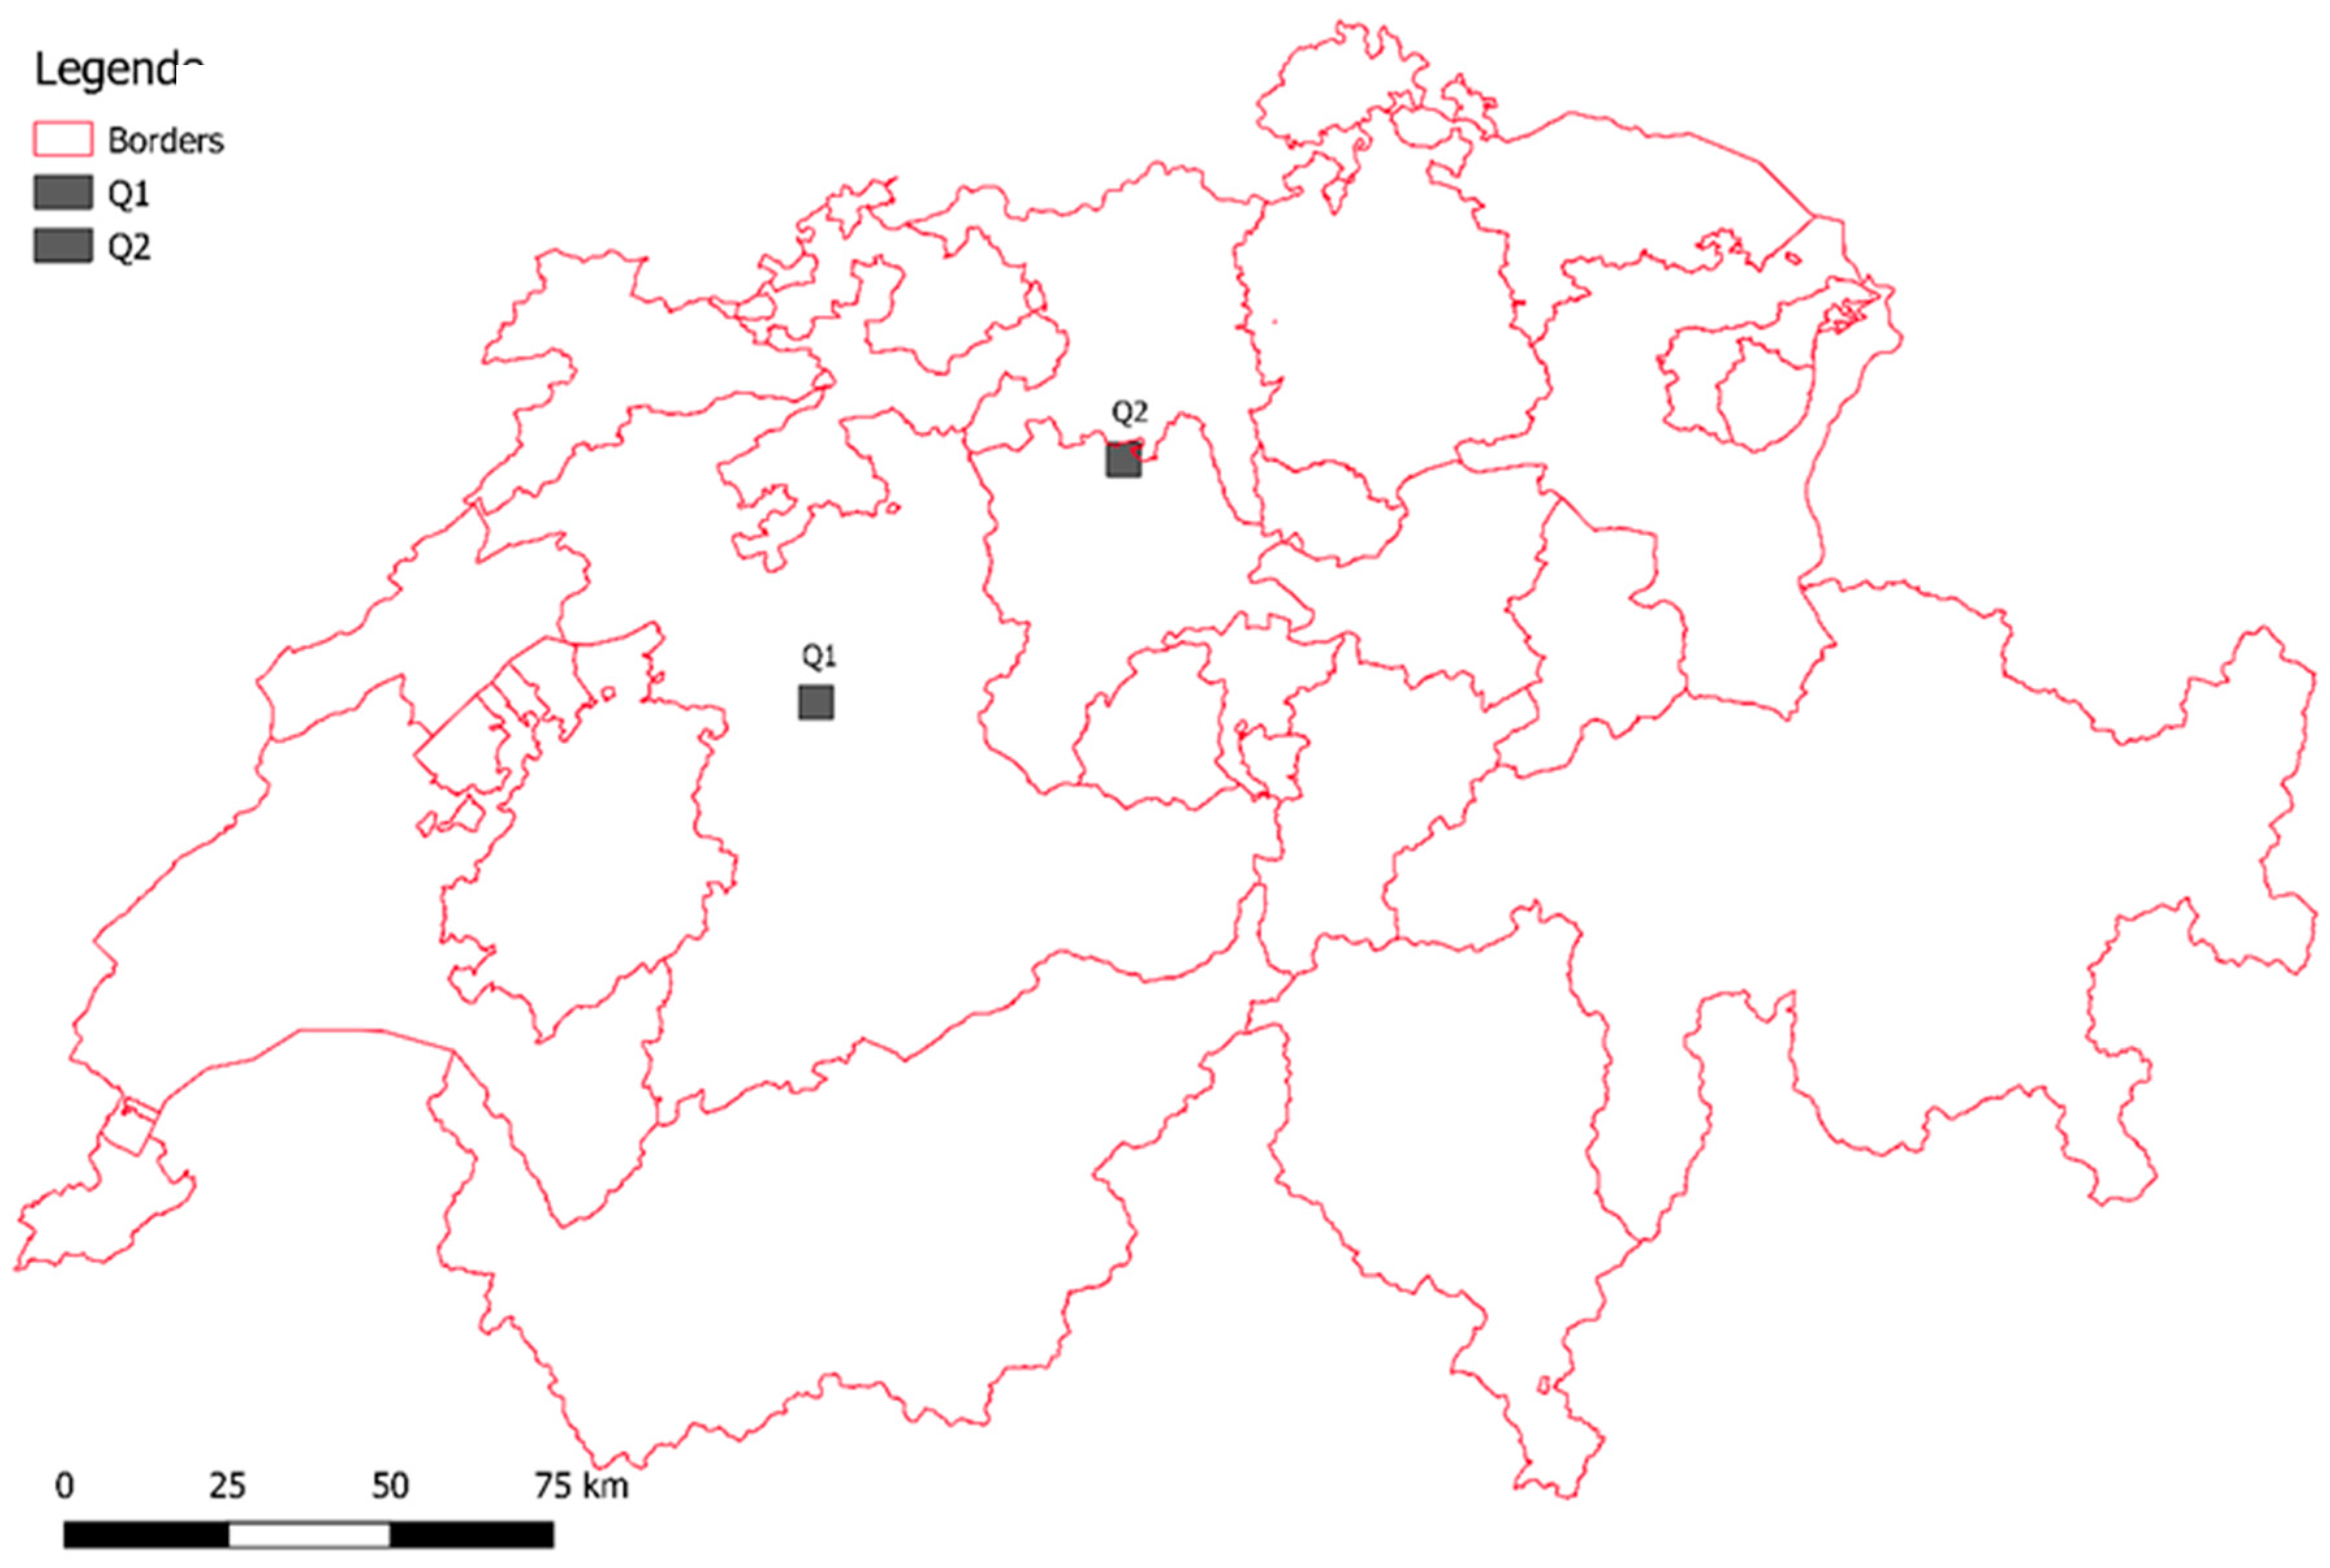
2.2. Case Study Approach
2.3. Management Variety on Swiss Farms
2.4. Sampling
2.5. Analysis Criteria
- The biodiversity aspect describes the part of biodiversity that is covered by the various methods (e.g., species biodiversity, genetic diversity or functional diversity).
- Since it is not possible to measure biodiversity as a whole [49], the methods depend on the use of biodiversity indicators. Biodiversity indicators can be samples (e.g., plant richness) or indirect measures (e.g., semi-natural habitats), which provide information to express the size, extent or degree of biodiversity [50].
- To compare biodiversity, it is necessary to use a benchmark. This is referred to as the reference situation for the investigated methods.
- The spatial unit refers to the reference value on which the biodiversity assessment is based on (e.g., product, plot, field, farm).
- Geographical scope refers to the geographical context in which the methods can be applied. It can be distinguished, for example, whether the methods can be applied regionally, nationally or globally.
- Primary purpose means the originally intended use of the method. Examples of this are research, advice, evaluation, etc.
- The duration of the assessment describes the time required to generate a result with the methods.
- Data availability refers to the sources of the data that are required for the application of the methods.
3. Results
3.1. Overview of the Analysis Criteria
3.2. SMART
3.3. CPS Method
3.4. LCIA Method
3.5. Monitoring Plant and Animal Biodiversity
3.6. Comparison of Rankings According to Evaluation System
4. Discussion
5. Conclusions
Author Contributions
Funding
Acknowledgments
Conflicts of Interest
References
- Kleijn, D.; Kohler, F.; Báldi, A.; Batáry, P.; Conceptón, E.D.; Clough, Y.; Díaz, M.; Gabriel, D.; Holzschuh, A.; Knop, E.; et al. On the Relationship between Farmland Biodiversity and Land-Use Intensity in Europe. R. Soc. 2009, 276, 903–909. [Google Scholar] [CrossRef]
- Clough, Y.; Barkmann, J.; Juhrbandt, J.; Kessler, M.; Wanger, T.C.; Anshary, A.; Buchori, D.; Cicuzza, D.; Darras, K.; Putra, D.D.; et al. Combining High Biodiversity with High Yields in Tropical Agroforests. Proc. Natl. Acad. Sci. USA 2011, 108, 8311–8316. [Google Scholar] [CrossRef] [PubMed]
- Pe’er, G.; Dicks, L.V.; Visconti, P.; Arlettaz, R.; Báldi, A.; Benton, T.G.; Collins, S.; Dieterich, M.; Gregory, R.D.; Hartig, F.; et al. Eu Agricultural Reform Fails on Biodiversity. Science 2014, 344, 1090–1092. [Google Scholar] [CrossRef] [PubMed]
- Benton, T.G.; Vickery, J.A.; Wilson, J.D. Farmland Biodiversity: Is Habitat Heterogeneity the Key? Trends Ecol. Evol. 2003, 18, 182–188. [Google Scholar] [CrossRef]
- Geiger, F.; Bengtsson, J.; Berendse, F.; Weisser, W.W.; Emmerson, M.; Morales, M.B.; Ceryngier, P.; Liira, J.; Tscharntke, T.; Winqvist, C.; et al. Persistent Negative Effects of Pesticides on Biodiversity and Biological Control Potential on European Farmland. Basic Appl. Ecol. 2010, 11, 97–105. [Google Scholar] [CrossRef]
- Hallmann, C.A.; Sorg, M.; Jongejans, E.; Siepel, H.; Hofland, N.; Schwan, H.; Stenmans, W.; Müller, A.; Sumser, H.; Hörren, T.; et al. More Than 75 Percent Decline over 27 Years in Total Flying Insect Biomass in Protected Areas. PLoS ONE 2017, 12, e0185809. [Google Scholar] [CrossRef]
- Swinton, S.M.; Lupi, F.; Robertson, G.P.; Hamilton, S.K. Ecosystem Services and Agriculture: Cultivating Agricultural Ecosystems for Diverse Benefits. Ecol. Econ. 2007, 64, 245–252. [Google Scholar] [CrossRef]
- Ollerton, J.; Winfree, R.; Tarrant, S. How Many Flowering Plants Are Pollinated by Animals? Oikos 2011, 120, 321–326. [Google Scholar] [CrossRef]
- Gallai, N.; Salles, J.; Settele, J.; Vaissière, B.E. Economic Valuation of the Vulnerability of World Agriculture Confronted with Pollinator Decline. Ecol. Econ. 2009, 68, 810–821. [Google Scholar] [CrossRef]
- Clergue, B.; Amiaud, B.; Pervanchon, F.; Lasserre, F.; Plantureux, S. Biodiversity: Function and Assessment in Agricultural Areas. Agron. Sustain. Dev. 2005, 25, 1–15. [Google Scholar] [CrossRef]
- Tscharntke, T.; Klein, A.M.; Kruess, A.; Steffan-Dewenter, I.; Thies, C. Landscape Perspectives on Agricultural Intensification and Biodiversity—Ecosystem Service Management. Ecol. Lett. 2005, 8, 857–874. [Google Scholar] [CrossRef]
- Haines-Young, R. Land Use and Biodiversity Relationships. Land Use Policy 2009, 26 (Suppl. 1), S178–S186. [Google Scholar] [CrossRef]
- Baillie, J.E.M.; Collen, B.; Amin, R.; Akcakaya, H.R.; Butchart, S.H.M.; Brummitt, N.; Meagher, T.R.; Ram, M.; Hilton-Taylor, C.; Mace, G.M. Toward Monitoring Global Biodiversity. Conserv. Lett. 2008, 1, 18–26. [Google Scholar] [CrossRef]
- Lokhorst, A.M.; Staats, H.; van Dijk, J.; van Dijk, E.; de Snoo, G. What’s in It for Me? Motivational Differences between Farmers’ Subsidised and Non-Subsidised Conservation Practices. Appl. Psychol. 2011, 60, 337–353. [Google Scholar] [CrossRef]
- Eurostat. Farm Structure Statistics: Agricultural Land Use. Available online: https://ec.europa.eu/eurostat/statistics_explained/index.php/Farm_structure_statistics#Agricultural_land_use (accessed on 17 October 2018).
- Stoeckli, S.; Birrer, S.; Zellweger-Fischer, J.; Balmer, O.; Jenny, M.; Pfiffner, L. Quantifying the Extent to Which Farmers Can Influence Biodiversity on Their Farms. Agric. Ecosyst. Environ. 2017, 237, 224–233. [Google Scholar] [CrossRef]
- Batary, P.; Dicks, L.V.; Kleijn, D.; Sutherland, W.J. The Role of Agri-Environment Schemes in Conservation and Environmental Management. Conserv. Biol. 2015, 29, 1006–1016. [Google Scholar] [CrossRef]
- Gabel, V.M.; Home, R.; Stolze, M.; Birrer, S.; Steinemann, B.; Köpke, U. The Influence of on-Farm Advice on Beliefs and Motivations for Swiss Lowland Farmers to Implement Ecological Compensation Areas on Their Farms. J. Agric. Educ. Ext. 2018, 24, 233–248. [Google Scholar] [CrossRef]
- Noe, E.; Halberg, N.; Reddersen, J. Indicators of Biodiversity and Conservational Wildlife Quality on Danish Organic Farms for Use in Farm Management: A Multidisciplinary Approach to Indicator Development and Testing. J. Agric. Environ. Ethics 2005, 18, 383–414. [Google Scholar] [CrossRef]
- Chevillat, V.; Balmer, O.; Birrer, S.; Doppler, V.; Graf, R.; Jenny, M.; Pfiffner, L.; Rudmann, C.; Zellweger-Fischer, J. Gesamtbetriebliche Beratung Steigert Qualität Und Quantität Von Ökoausgleichsflächen. Agrarforschung Schweiz 2012, 3, 104–111. [Google Scholar]
- Smallshire, D.; Robertson, P.; Thompson, P. Policy into Practice: The Development and Delivery of Agri-Environment Schemes and Supporting Advice in England. Ibis 2004, 146, 250–258. [Google Scholar] [CrossRef]
- Sutherland, L.-A.; Mills, J.; Ingram, J.; Burton, R.J.F.; Dwyer, J.; Blackstock, K. Considering the Source: Commercialisation and Trust in Agri-Environmental Information and Advisory Services in England. J. Environ. Manag. 2013, 118, 96–105. [Google Scholar] [CrossRef] [PubMed]
- Schroeder, L.A.; Chaplin, S.; Isselstein, J. What influences farmers’ acceptance of agri-environment schemes? An ex-post application of the ‘Theory of Planned Behaviour’. Landbauforschung 2015, 65, 15–28. [Google Scholar]
- Jenny, M.; Fischer, J.; Pfiffner, L.; Birrer, S.; Graf, R. Leitfaden für Die Anwendung Des Punktesystems Biodiversität Ip-Suisse; Zollikofen und Schweizerische Vogelwarte, Ed.; Version 2009; IP-SUISSE: Sempach, Switzerland, 2009. [Google Scholar]
- Biała, K.; Condé, S.; Delbaere, B.; Jones-Walters, L.; Torre-Marín, A. Streamlining European Biodiversity Indicators 2020: Building a Future on Lessons Learnt from the Sebi 2010 Process. In EEA Technical Report; European Environmental Agency: Luxembourg, 2012. [Google Scholar]
- Purvis, A.; Hector, A. Getting the Measure of Biodiversity. Nature 2000, 405, 212–219. [Google Scholar] [CrossRef] [PubMed]
- Duelli, P. Biodiversity Evaluation in Agricultural Landscapes: An Approach at Two Different Scales. Agric. Ecosyst. Environ. 1997, 62, 81–91. [Google Scholar] [CrossRef]
- Magurran, A.E.; McGill, B.J. Biological Diversity: Frontiers in Measurement and Assessment; Oxford University Press: Oxford, UK, 2011. [Google Scholar]
- Duelli, P.; Obrist, M.K. Biodiversity Indicators: The Choice of Values and Measures. Agric. Ecosyst. Environ. 2003, 98, 87–98. [Google Scholar] [CrossRef]
- Jenny, M.; Zellweger-Fischer, J.; Balmer, O.; Birrer, S.; Pfiffner, L. The Credit Point System: An Innovative Approach to Enhance Biodiversity on Farmland. Asp. Appl. Biol. 2013, 118, 23–30. [Google Scholar]
- Birrer, S.; Zellweger-Fischer, J.; Stoeckli, S.; Korner-Nievergelt, F.; Balmer, O.; Jenny, M.; Pfiffner, L. Biodiversity at the Farm Scale: A Novel Credit Point System. Agric. Ecosyst. Environ. 2014, 197, 195–203. [Google Scholar] [CrossRef]
- Meier, M.; Siegrist, F.; Drapela, T.; Pluschke, H.; Pfiffner, L.; Stolze, M. Schlussbericht. Entwicklung Einer Wirkungsabschätzungsmethode Für Biodiversität; FiBL Forschungsinstitut für Biologischen Landbau: Frick, Switzerland, 2015; pp. 7–78. [Google Scholar]
- Quinn, J.E.; Brandle, J.R.; Johnson, R.J. A Farm-Scale Biodiversity and Ecosystem Services Assessment Tool: The Healthy Farm Index. Int. J. Agric. Sustain. 2013, 11, 176–192. [Google Scholar] [CrossRef]
- Schader, C.; Baumgart, L.; Landert, J.; Muller, A.; Ssebunya, B.; Blockeel, J.; Weisshaidinger, R.; Petrasek, R.; Mészáros, D.; Padel, S.; et al. Using the Sustainability Monitoring and Assessment Routine (Smart) for the Systematic Analysis of Trade-Offs and Synergies between Sustainability Dimensions and Themes at Farm Level. Sustainability 2016, 8, 274. [Google Scholar] [CrossRef]
- Schader, C.; Drapela, T.; Markut, T.; Hörtenhuber, S.; Lindenthal, T.; Meier, M.; Pfiffner, L. Biodiversity Impact Assessment of Austrian Organic and Conventional Dairy Products. Presented at the LCA Discussion Forum: Integrating biodiversity in LCA, Lausanne, Switzerland, 19 November 2010. [Google Scholar]
- von Haaren, C.; Kempa, D.; Vogel, K.; Rüter, S. Assessing Biodiversity on the Farm Scale as Basis for Ecosystem Service Payments. J. Environ. Manag. 2012, 113, 40–50. [Google Scholar] [CrossRef]
- Zellweger-Fischer, J.; Althaus, P.; Birrer, S.; Jenny, M.; Pfiffner, L.; Stöckli, S. Biodiversität Auf Landwirtschaftsbetrieben Mit Einem Punktesystem Erheben. Agrarforschung Schweiz 2016, 7, 40–47. [Google Scholar]
- FAO (Food and Agriculture Organization of the United Nations). Sustainability Assessment of Food and Agriculture Systems SAFA Guidelines; FAO: Rome, Italy, 2014. [Google Scholar]
- Billeter, R.; Liira, J.; Bailey, D.; Bugter, R.; Arens, P.; Augenstein, I.; Aviron, S.; Baudry, J.; Bukacek, R.; Burel, F.; et al. Indicators for Biodiversity in Agricultural Landscapes: A Pan-European Study. J. Appl. Ecol. 2008, 45, 141–150. [Google Scholar] [CrossRef]
- Yin, R.K. Applications of Case Study Research; Sage: Newbury Park, CA, USA, 2011. [Google Scholar]
- Hays, P.A. Case Study Research. In Foundations for Research: Methods of Inquiry in Education and the Social Sciences; Routledge: Abingdon, UK, 2004; pp. 217–234. [Google Scholar]
- Junge, X.; Lindemann-Matthies, P.; Hunziker, M.; Schüpbach, B. Aesthetic Preferences of Non-Farmers and Farmers for Different Land-Use Types and Proportions of Ecological Compensation Areas in the Swiss Lowlands. Biol. Conserv. 2011, 144, 1430–1440. [Google Scholar] [CrossRef]
- Gomiero, T.; Pimentel, D.; Paoletti, M.G. Environmental Impact of Diffrerent Agicultural Management Practices: Conventional vs. Organic Agriculture. Crit. Rev. Plant Sci. 2011, 26, 95–124. [Google Scholar] [CrossRef]
- Weibull, A.-C.; Östman, Ö. Species Composition in Agroecosystems: The Effect of Landscape, Habitat, and Farm Management. Basic Appl. Ecol. 2003, 4, 349–361. [Google Scholar] [CrossRef]
- Patton, M. Qualitative Evaluation and Research Methods; Sage: Newbury Park, CA, USA, 1990. [Google Scholar]
- Duelli, P.; Obrist, M.K.; Schmatz, D.R. Biodiversity Evaluation in Agricultural Landscapes: Above-Ground Insects. Agric. Ecosyst. Environ. 1999, 74, 33–64. [Google Scholar] [CrossRef]
- Gabel, V.M.; Meier, M.S.; Köpke, U.; Stolze, M. The Challenges of Including Impacts on Biodiversity in Agricultural Life Cycle Assessments. J. Environ. Manag. 2016, 181, 249–260. [Google Scholar] [CrossRef] [PubMed]
- Schader, C.; Grenz, J.; Meier, M.S.; Stolze, M. Scope and Precision of Sustainability Assessment Approaches to Food Systems. Ecol. Soc. 2014, 19, 1–15. [Google Scholar] [CrossRef]
- Büchs, W. Biotic Indicators for Biodiversity and Sustainable Agriculture—Introduction and Background. Agric. Ecosyst. Environ. 2003, 98, 1–16. [Google Scholar] [CrossRef]
- Biodiversity Indicators Partnership. Guidance for National Biodiversity Indicator Development and Use; Unep World Conservation Monitoring Centre: Cambridge, UK, 2011. [Google Scholar]


| Farm | Farm 1 | Farm 2 | Farm 3 | Farm 4 | Farm 5 |
|---|---|---|---|---|---|
| Landscape Canton (municipality) | Bern (Rubigen) | Lucerne (Rickenbach) | Bern (Rubigen) | Lucerne (Rickenbach) | Lucerne (Rickenbach) |
| Production system | IP Suisse | IP Suisse | Demeter | Bio Suisse | PEP |
| Altitude (m) | 543 | 803 | 586 | 702 | 672 |
| Precipitation (mm) | 1100 | 1100 | 1100 | 1100 | 1100 |
| Agricutural area (ha) | 36.9 | 27.2 | 23.5 | 23.4 | 16.9 |
| Arable land (ha) | 30.20 | 9.8 | 15 | 17.48 | 9.09 |
| Pasture (ha) | 5.85 | 16.38 | 7 | 5.94 | 3.9 |
| Forest (ha) | 0.08 | 4.98 | 2.18 | 3.6 | 3.13 |
| Animals | Cows/sheep | Cows/pigs | Cows, pigs, horses | Cows/pigs | Cows/Horses |
| Livestock units per ha | 0.8 | 2.08 | 1.7 | 3.16 | 1.59 |
| Crops | Wheat, Barley, rye, rapeseed, sugar beet, peas, sunflower, maize for silage | Barley spelt wheat | Broad Beans, Oats, Wheat, spelt, peas, maize for silage | Sunflowers, potatoes, maize for silage, wheat, spelt | Wheat, rapeseed, barley, maize for silage |
| Crops in rotation | 7 | 4 | 7 | 6 | 5 |
| Labour force (Full-time equivalent) | 2.5 | 2.8 | 4 | 3 | 1.45 |
| ECA (ha) | 3.8 ha | 3.78 | 3.20 ha | 2.6 ha | 1.84 ha |
| % | 10.3% | 13.9% | 13.6% | 11.1% | 10.6% |
| Method | CPS | SMART (Version 4.1) | LCIA | Measurement |
|---|---|---|---|---|
| Biodiversity aspect | Species diversity | Species diversity, ecosystem diversity genetic diversity, | Species diversity (indirect Ecosystem quality) | Species richness, species density |
| Biodiversity indicator | 32 measures options to enhance biodiversity on the farm (most of them base on options of the Swiss agri-environment scheme. Management measures) | 72 biodiversity indicators | Land use intensity parameters (Land use intensity index N-input, and crop diversity) and landscape structure parameters (Share of semi natural habitats) | Number of individuals, identified to species level |
| Reference situation | 0 Points (although 0 points is extremely unlikely) | 100% goal achievement | maximum possible number of species | None. It is not comparative |
| Spatial Unit | Area (Farm) | Area (Farm) | Area (Farm), product | Area (Farm) (can be calculated per hectare) |
| Geographical scope | Switzerland | Global | Primarily temperate regions (lowlands) | Global |
| Intended Purpose | Biodiversity Assessment and Advice on farm-level | Sustainability assessment for research and business contexts | Assessment of farmland biodiversity of agricultural products in the framework of a LCIA | Biodiversity assessment at a farm level |
| Assessment duration | 2 h | 3–4 h, but including an evaluation of other sustainability indicators other than biodiversity. | Depends strongly on the availability of processed data (especially the landscape data) | A half day, 3–6 times per season, with approximately one day in the laboratory per animal/plant type |
| Data availability | On the farm available | On the farm available | Partly on the farm available, additional landscape data needed | On the farm |
| Expertise needed | High expertise in biology and knowledge of subsidy system | Moderate expertise. Lay people require some training | High expertise in GIS | High expertise in biology |
| Farm | Farm 1 | Farm 2 | Farm 3 | Farm 4 | Farm 5 |
|---|---|---|---|---|---|
| Production system | IP Suisse | IP Suisse | Organic (demeter) | Organic | PEP |
| Farm size (ha) | 36.9 | 27.2 | 23.5 | 23.4 | 16.9 |
| Theme Biodiversity | 46% | 56% | 66% | 61% | 55% |
| Subtheme Ecosystem diversity | 43% | 50% | 61% | 56% | 57% |
| Subtheme Species Diversity | 48% | 57% | 70% | 70% | 54% |
| Subtheme Genetic Diversity | 47% | 60% | 68% | 57% | 55% |
| Farm 1 | Farm 2 | Farm 3 | Farm 4 | Farm 5 | |
|---|---|---|---|---|---|
| Production system | IP Suisse | IP Suisse | Organic (demeter) | Organic (Biosuisse) | PEP |
| Farm size (ha) | 36.9 | 27.2 | 23.5 | 23.4 | 16.9 |
| LCIA BDP/farm | 7.3 × 10⁻³ | 6.6 × 10⁻³ | 4.4 × 10⁻³ | 4.7 × 10⁻³ | 3.5 × 10⁻³ |
| LCIA BDP/ha | 1.97 × 10⁻⁶ | 2.43 × 10⁻⁶ | 1.86 × 10⁻⁶ | 2.01 × 10⁻⁶ | 2.06 × 10⁻⁶ |
| Farm | Farm 1 | Farm 2 | Farm 3 | Farm 4 | Farm 5 |
|---|---|---|---|---|---|
| Production system | IP Suisse | IP Suisse | Organic (demeter) | Organic (Biosuisse) | PEP |
| Farm size | 36.9 | 27.2 | 23.5 | 23.4 | 16.9 |
| Species richness Butterflies | 22 | 26 | 24 | 26 | 18 |
| Species richness plants | 205 | 185 | 160 | 166 | 129 |
| Species richness birds | 35 | 25 | 24 | 23 | 21 |
| Species richness grasshoppers | 8 | 13 | 7 | 6 | 7 |
| Ranking species richness | 8 | 6 | 13 | 13 | 18 |
| Density plants | 695.579 | 925.723 | 1051.633 | 791.437 | 596.752 |
| Density Grasshoppers | 82.441 | 229.363 | 163.416 | 88.982 | 95.773 |
| Density Butterflies | 60.45 | 178.859 | 364.894 | 382.726 | 203.576 |
| Density Birds UZL | 3.25 | 2.205 | 0.852 | 0.427 | 1.179 |
| Ranking Density | 15 | 9 | 9 | 13 | 14 |
| Farm | Production Systems | Farm Size (ha) | CPS Biodiversity (Points) | Smart Theme Biodiversity (Goal Achievement) | LCIA Methode (BDP/ha) | Species Density (Individuals/ha) |
|---|---|---|---|---|---|---|
| Farm 1 | IP Suisse | 36.9 (1) | 13.41 (5) | 46% (5) | 1.97 × 10⁻⁶ (2) | 15 (5) |
| Farm 2 | IP Suisse | 27.2 (2) | 26.71 (2) | 56% (3) | 2.43 × 10⁻⁶ (5) | 9 (1) |
| Farm 3 | Organic (demeter) | 23.5 (3) | 26.77 (1) | 66% (1) | 1.86 × 10⁻⁶ (1) | 9 (1) |
| Farm 4 | Organic (Biosuisse) | 23.4 (4) | 18.79 (3) | 61% (2) | 2.01 × 10⁻⁶ (3) | 12 (3) |
| Farm 5 | PEP | 16.9 (5) | 15.37 (4) | 55% (4) | 2.06 × 10⁻⁶ (4) | 14 (4) |
© 2018 by the authors. Licensee MDPI, Basel, Switzerland. This article is an open access article distributed under the terms and conditions of the Creative Commons Attribution (CC BY) license (http://creativecommons.org/licenses/by/4.0/).
Share and Cite
Gabel, V.; Home, R.; Stöckli, S.; Meier, M.; Stolze, M.; Köpke, U. Evaluating On-Farm Biodiversity: A Comparison of Assessment Methods. Sustainability 2018, 10, 4812. https://doi.org/10.3390/su10124812
Gabel V, Home R, Stöckli S, Meier M, Stolze M, Köpke U. Evaluating On-Farm Biodiversity: A Comparison of Assessment Methods. Sustainability. 2018; 10(12):4812. https://doi.org/10.3390/su10124812
Chicago/Turabian StyleGabel, Vanessa, Robert Home, Sibylle Stöckli, Matthias Meier, Matthias Stolze, and Ulrich Köpke. 2018. "Evaluating On-Farm Biodiversity: A Comparison of Assessment Methods" Sustainability 10, no. 12: 4812. https://doi.org/10.3390/su10124812
APA StyleGabel, V., Home, R., Stöckli, S., Meier, M., Stolze, M., & Köpke, U. (2018). Evaluating On-Farm Biodiversity: A Comparison of Assessment Methods. Sustainability, 10(12), 4812. https://doi.org/10.3390/su10124812