Obtaining a Sustainable Competitive Advantage from Patent Information: A Patent Analysis of the Graphene Industry


Abstract
1. Introduction
2. Literature Review
2.1. Patent Analysis for Graphene Technology
2.2. Development of Multi-level Perspective (MLP)
3. Methodology and Data
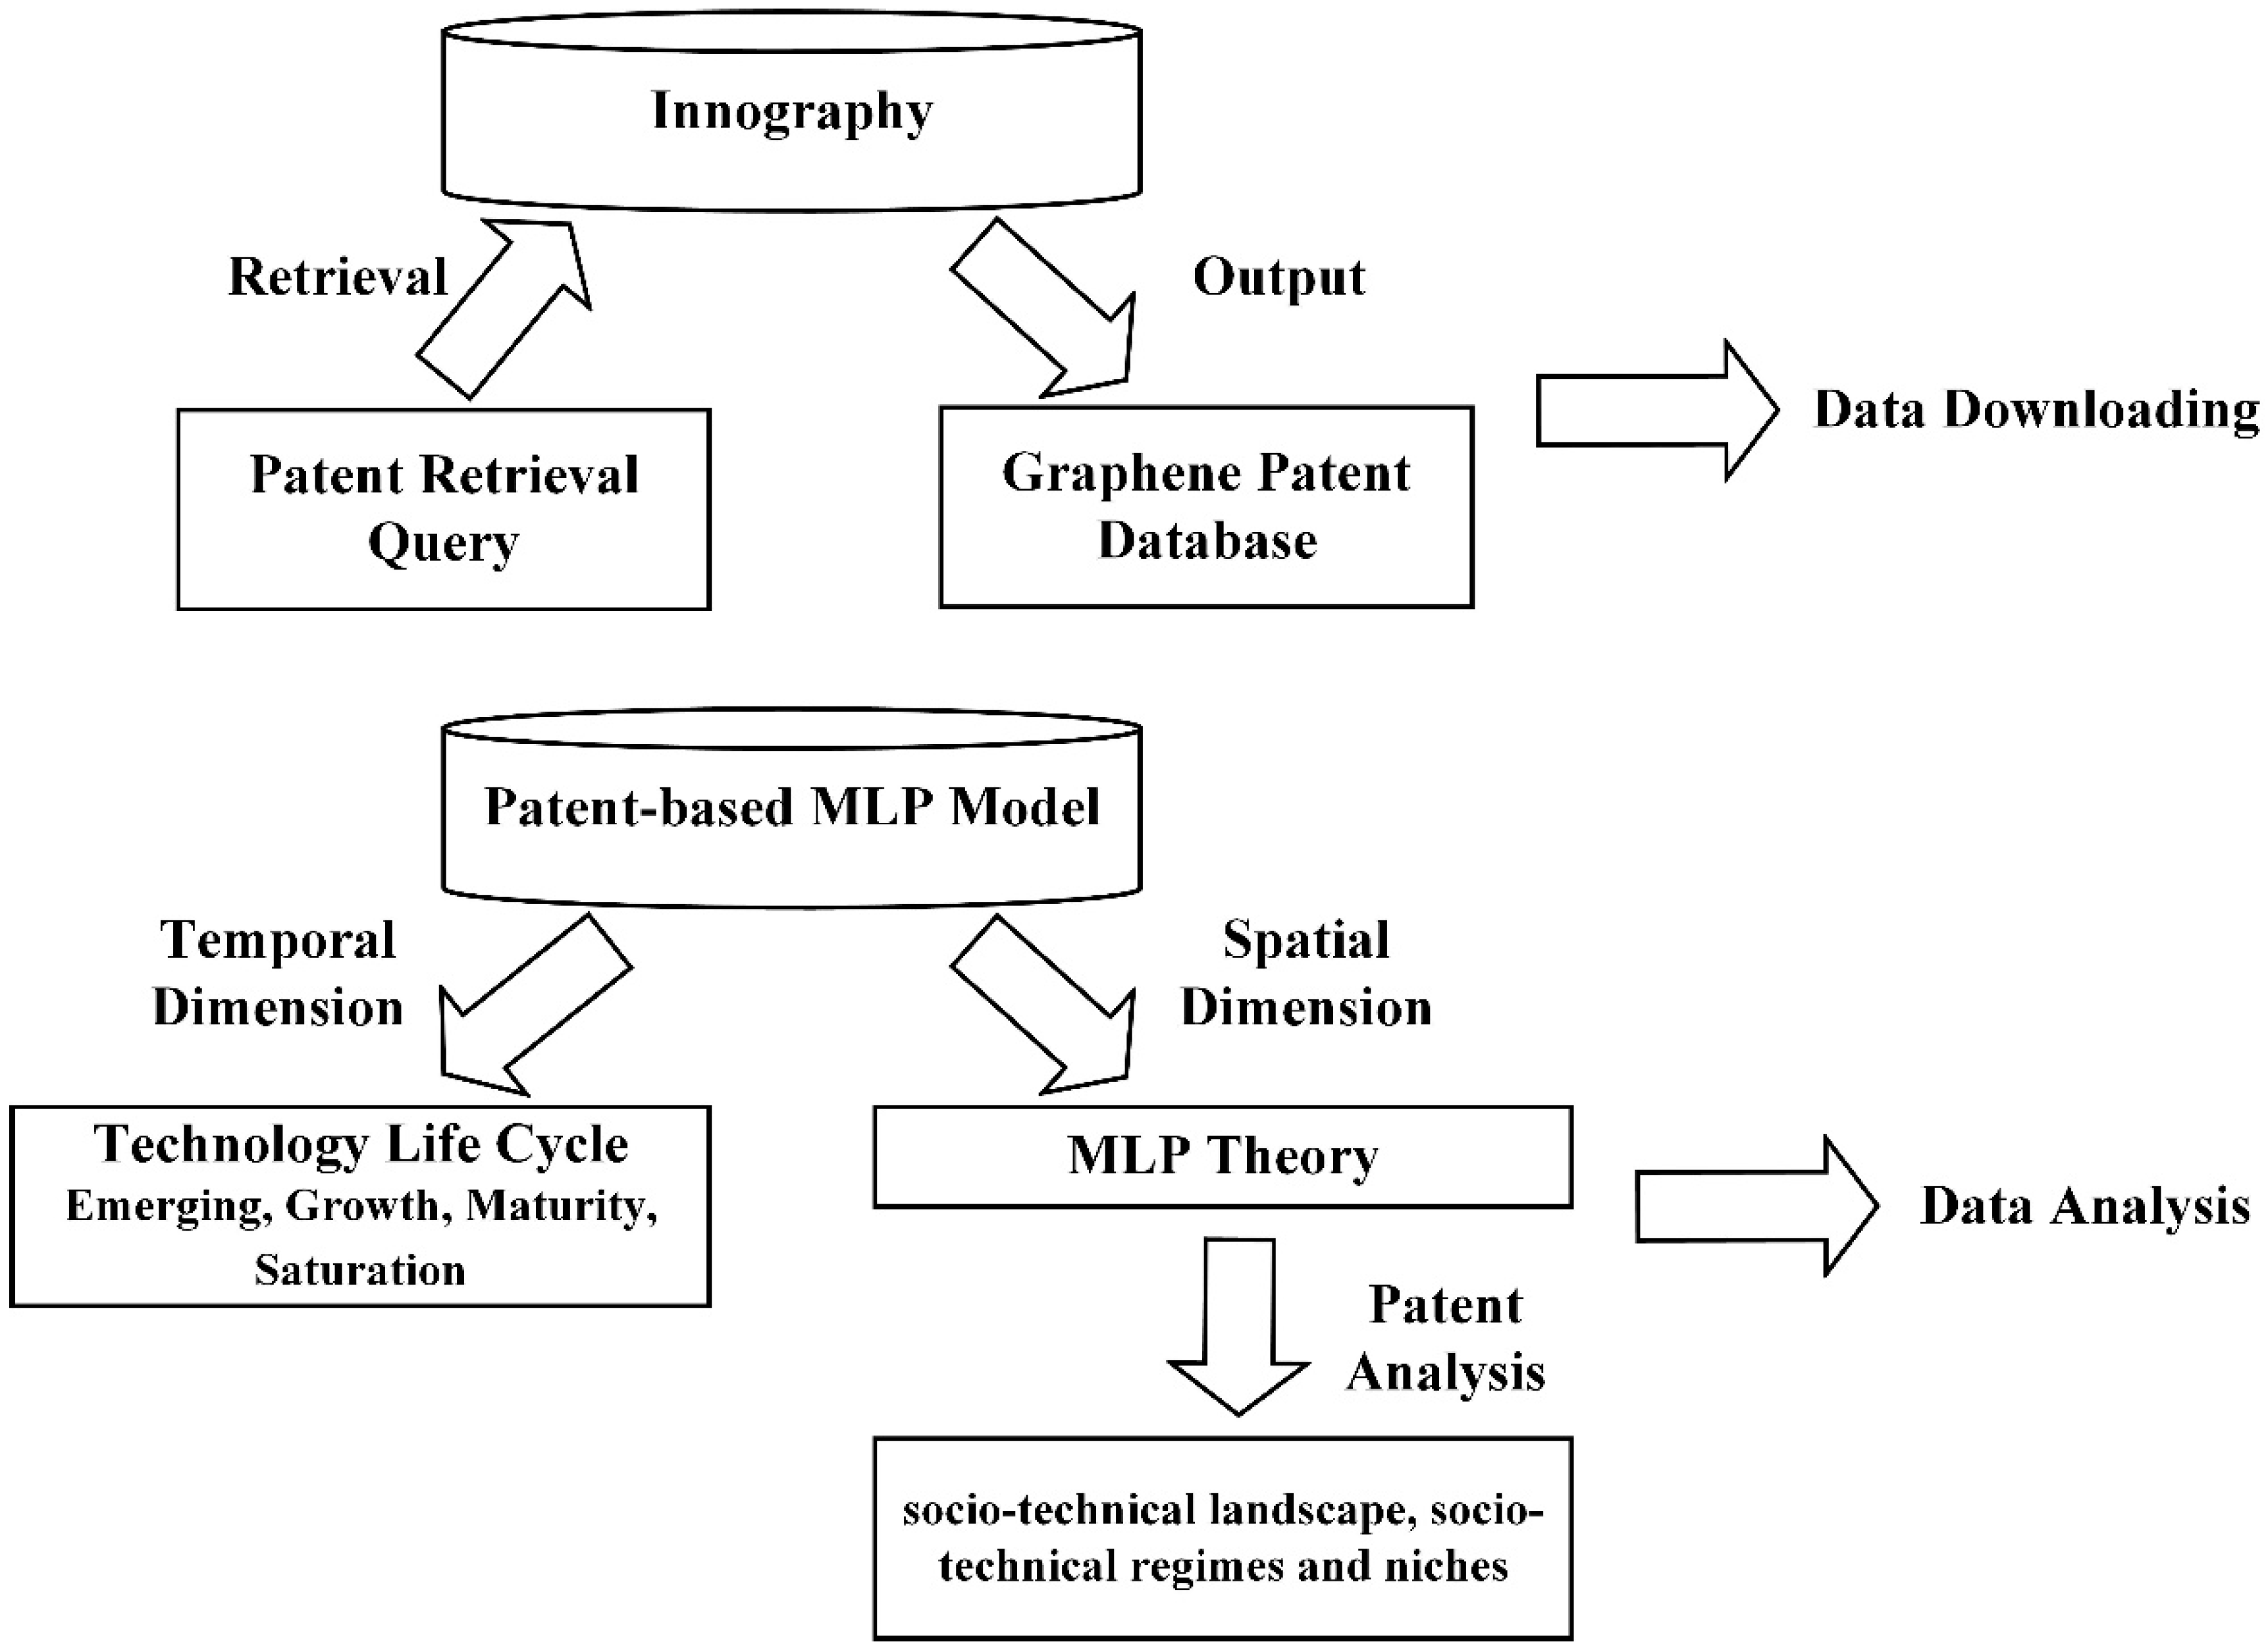
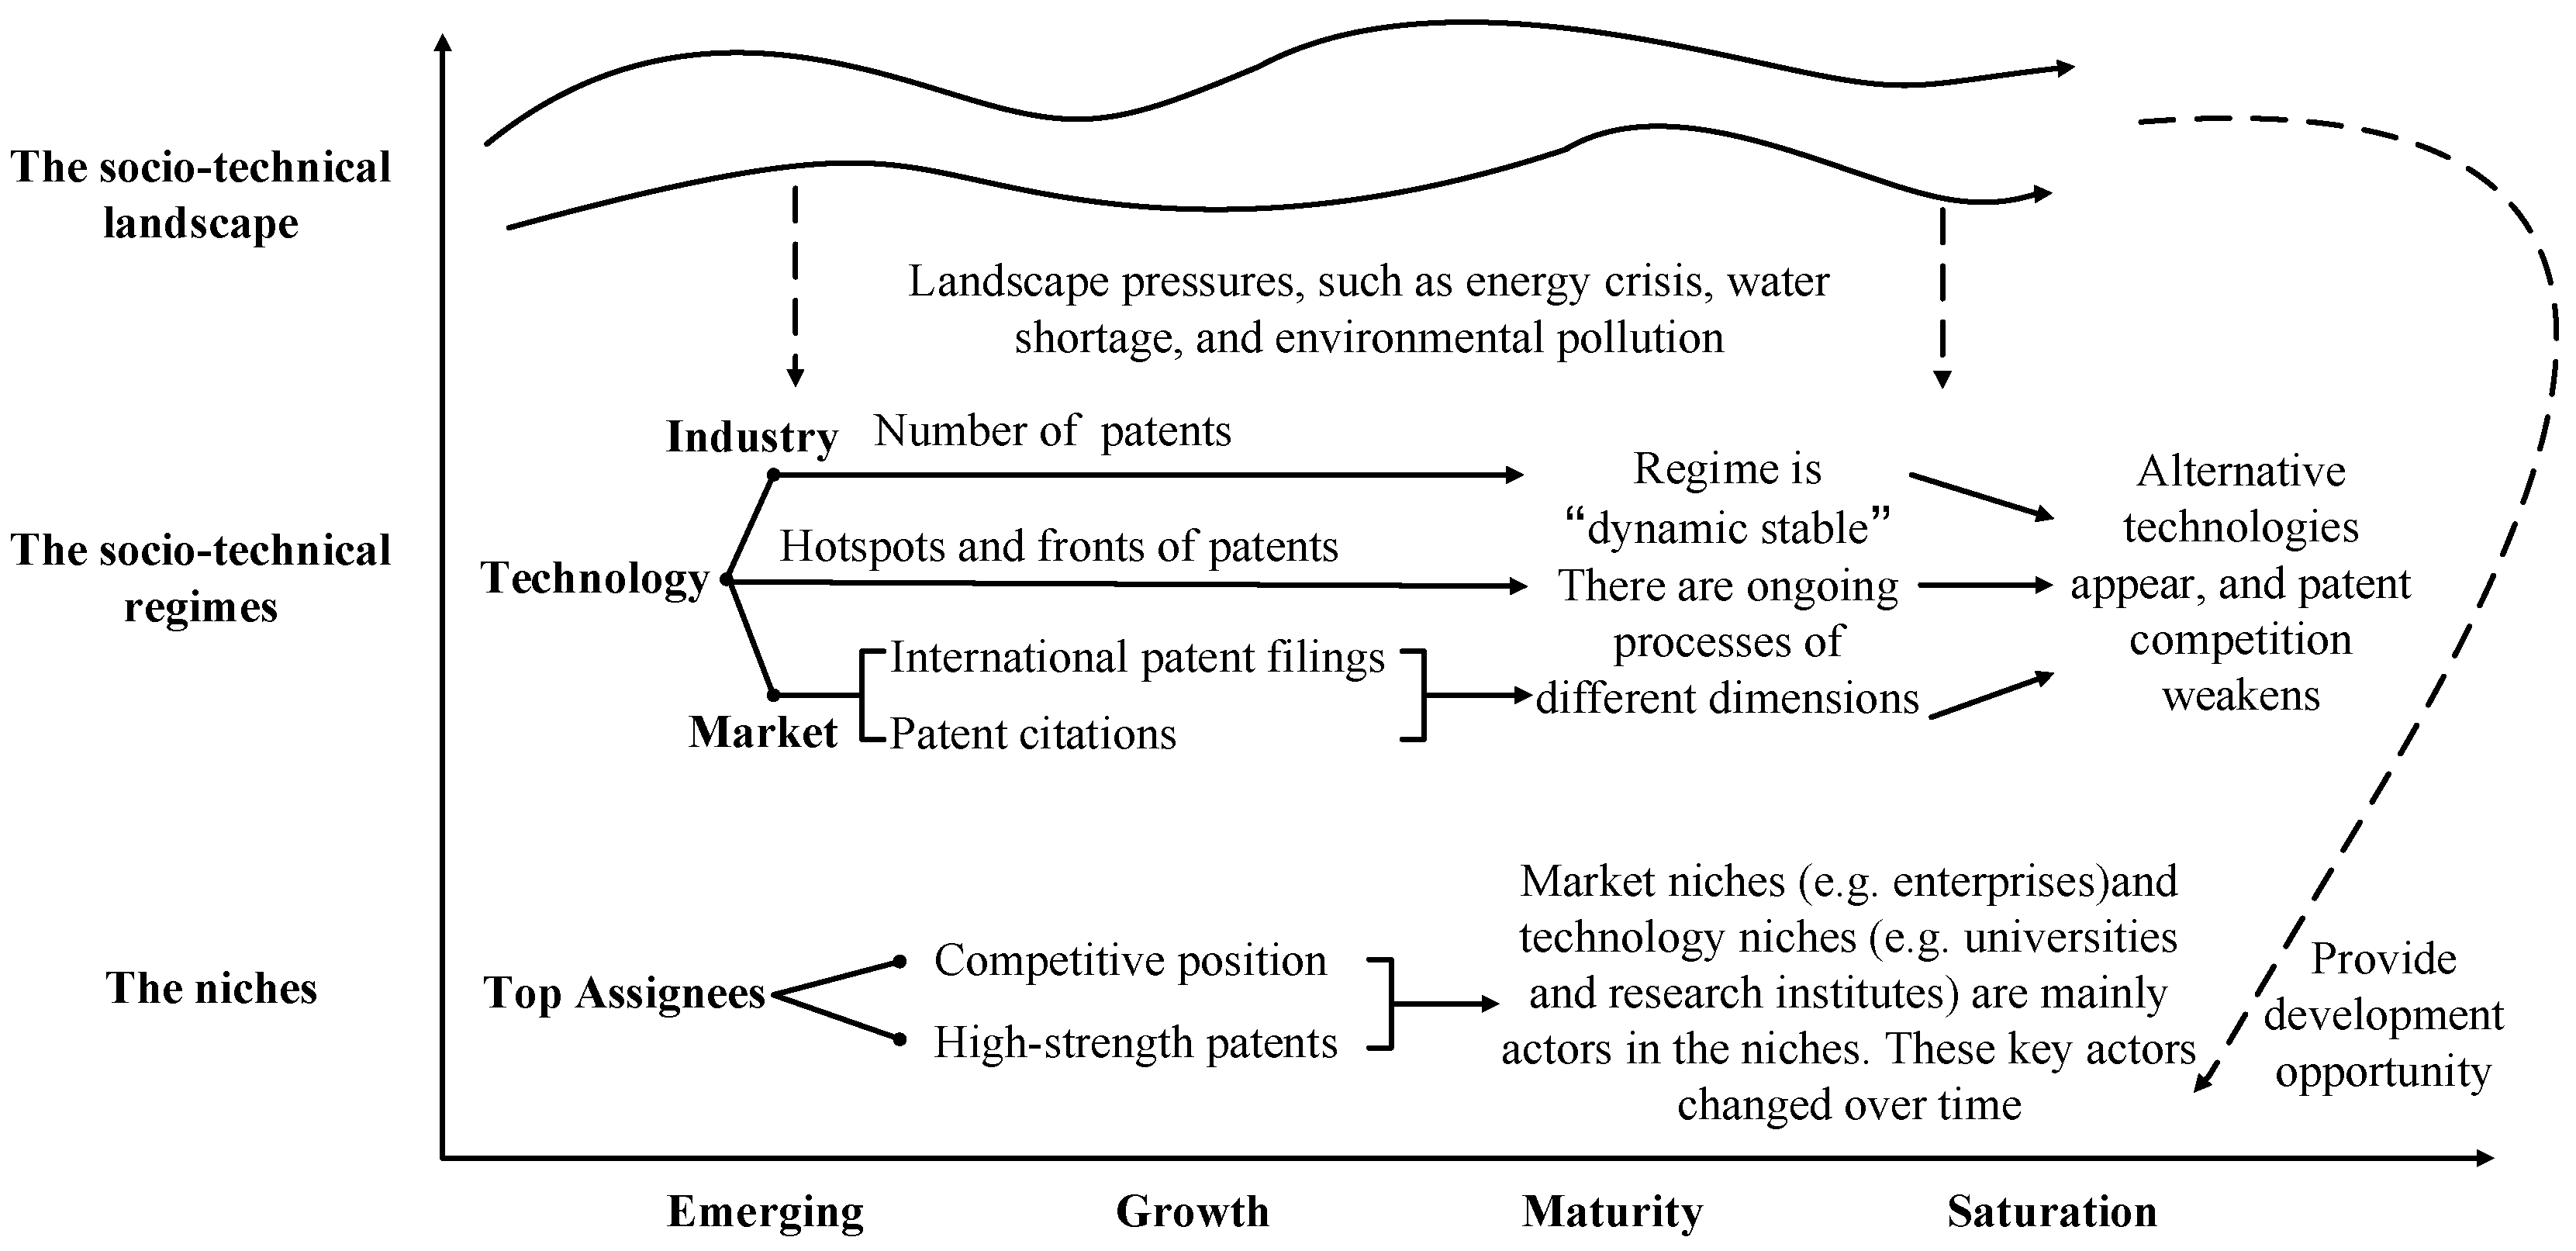
3.1. The Patent-based MLP on Sustainable Competitive Advantage
3.2. Retrieval of Patent Information
4. Analysis
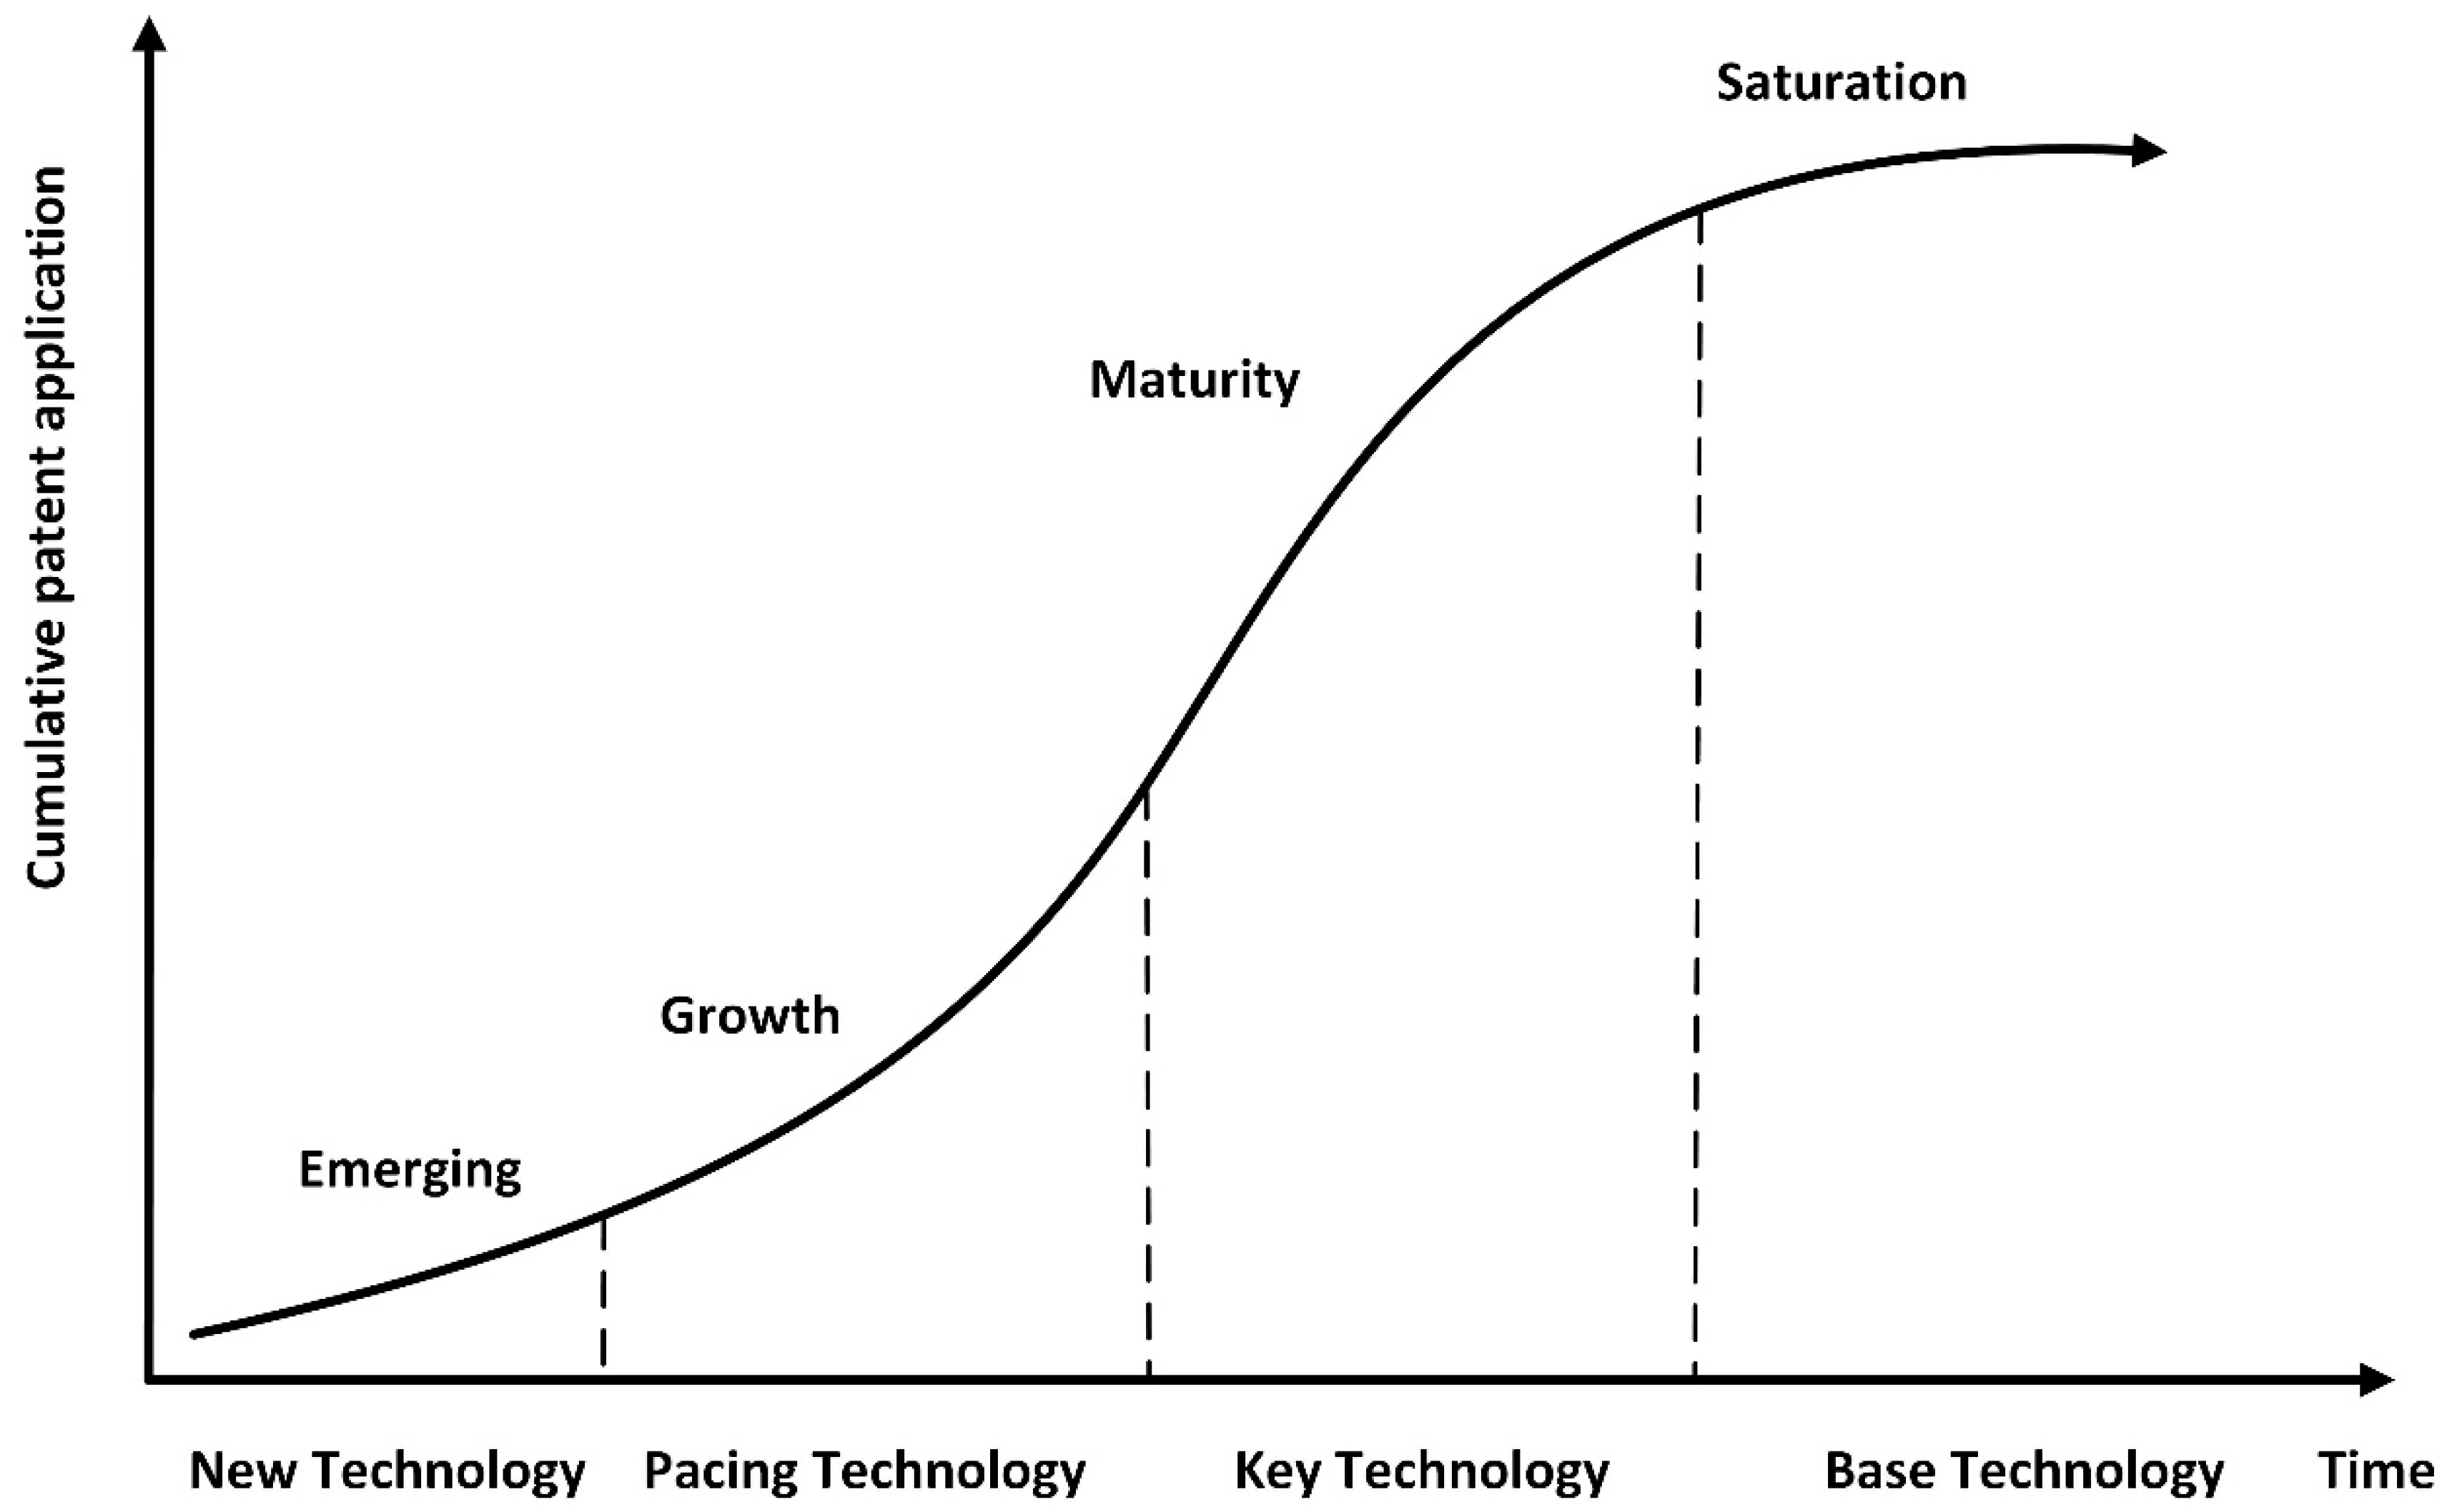
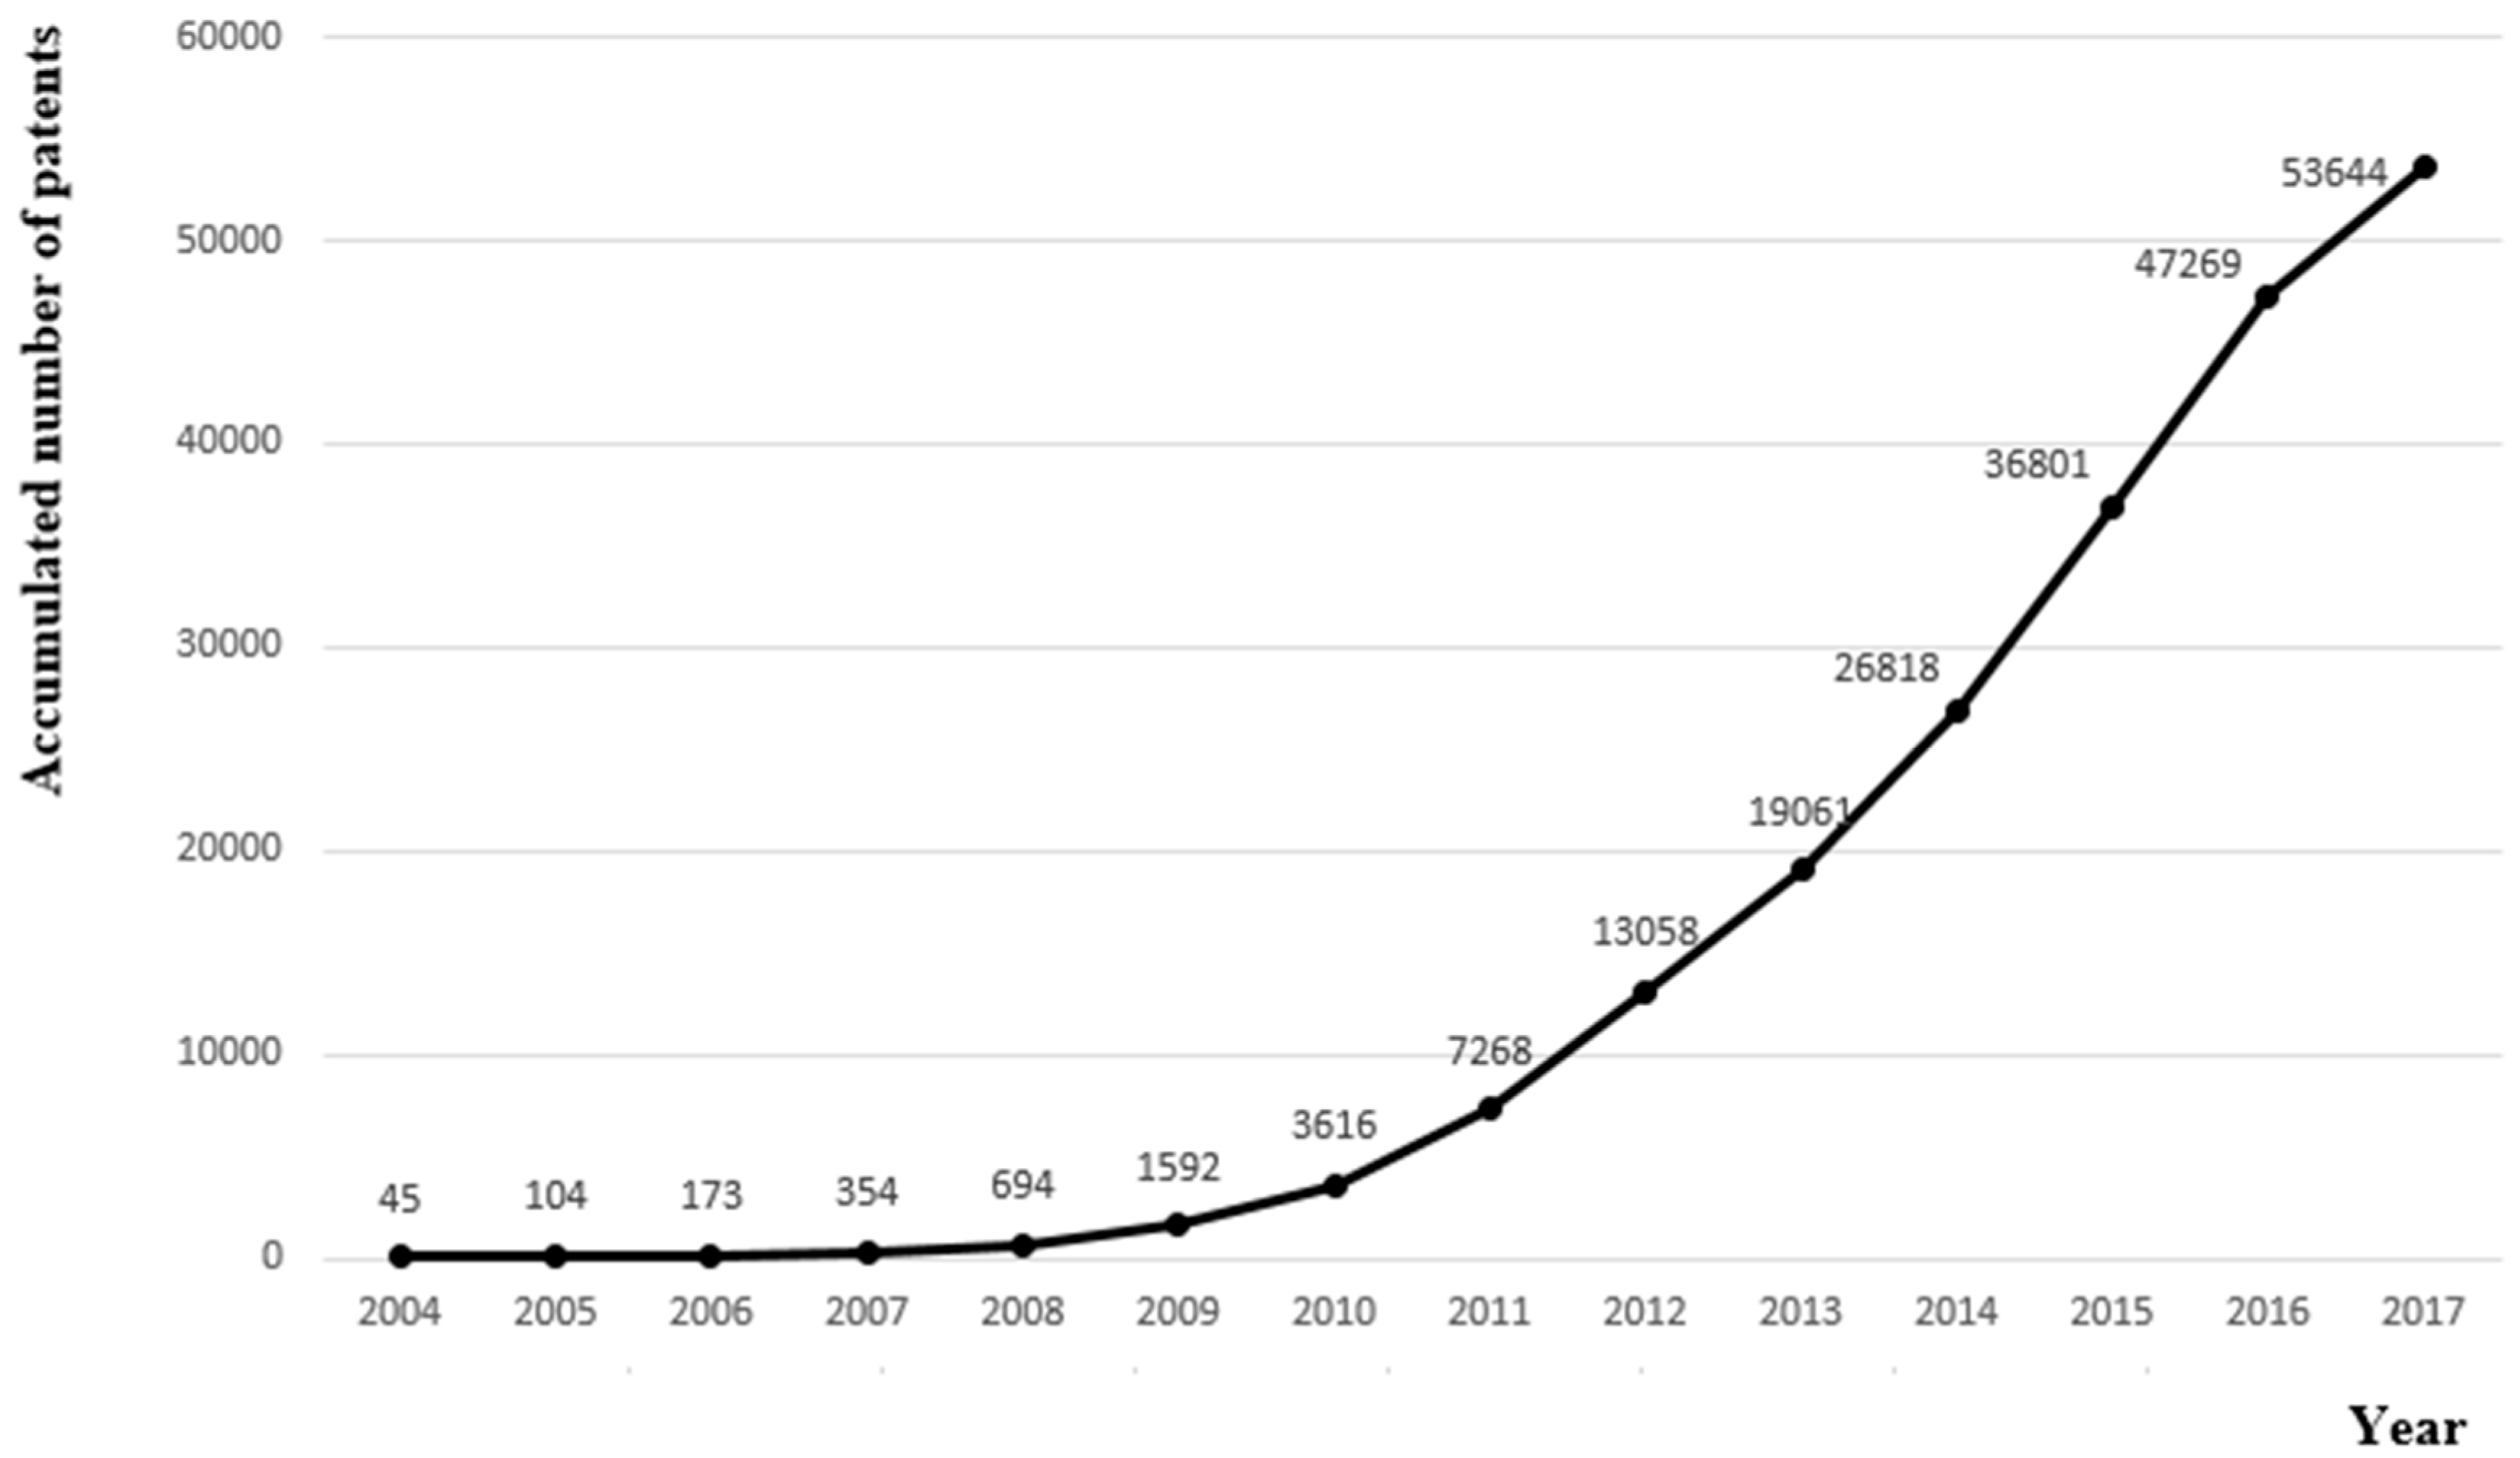
4.1. Technology Life Cycle
4.2. The Socio-Technical Landscape
4.3. The Socio-Technical Regimes
4.3.1. Industry
4.3.2. Technology
4.3.3. Market
4.4. The Niches
4.4.1. Competitive Position of Top Assignees
4.4.2. Top Assignees Holding High-Strength Patent
5. Conclusions and Discussions
5.1. Main Findings and Contributions
5.2. Future Research Directions
5.3. Limitations
Author Contributions
Funding
Conflicts of Interest
References
- Prahalad, C.K.; Hamel, G. The core competency of the corporation. Harv. Bus. Rev. 1990, 68, 79–91. [Google Scholar] [CrossRef]
- Wernerfelt, B. A resource-based view of the firm. Strateg. Manag. J. 1995, 5, 171–180. [Google Scholar] [CrossRef]
- Helfat, C.E.; Peteraf, M.A. The dynamic resource-based view: Capabilities life cycles. Strateg. Manag. J. 2003, 24, 997–1010. [Google Scholar] [CrossRef]
- Leonard-Barton, D. Core capabilities and core rigidities: A paradox in managing new product development. Strateg. Manag. J. 1992, 13, 111–125. [Google Scholar] [CrossRef]
- Akram, M.S.; Goraya, M.A.S.; Malik, A.; Aljarallah, A.M. Organizational Performance and Sustainability: Exploring the Roles of IT Capabilities and Knowledge Management Capabilities. Sustainability 2018, 10, 3816. [Google Scholar] [CrossRef]
- Sandner, P.G.; Block, J. The market value of R&D, patents and trademarks. Res. Policy 2011, 40, 969–985. [Google Scholar] [CrossRef]
- Harrigan, K.R.; DiGuardo, M. Sustainability of Patent-Based Competitive Advantage. Columbia Bus. Sch. Res. Pap. 2014, 15, 1–45. [Google Scholar] [CrossRef]
- Blackman, M. Provision of patent information: A national patent office perspective. World Pat. Inf. 1999, 17, 115–123. [Google Scholar] [CrossRef]
- Bloom, N.; Van Reenen, J. Patents, real options and firm performance. Econ. J. 2002, 112, 97–116. [Google Scholar] [CrossRef]
- Novoselov, K.S.; Geim, A.K.; Morozov, S.V.; Jiang, D.; Zhang, Y.; Dubonos, S.V.; Grigorieva, I.V.; Firsov, A.A. Electric field effect in atomically thin carbon films. Science 2004, 306, 666–669. [Google Scholar] [CrossRef]
- Rehman, S.K.U.; Ibrahim, Z.; Memon, S.A.; Aunkor, M.T.H.; Javed, M.F.; Mehmood, K.; Shah, S.M.A. Influence of Graphene Nanosheets on Rheology, Microstructure, Strength Development and Self-Sensing Properties of Cement Based Composites. Sustainability 2018, 10, 822. [Google Scholar] [CrossRef]
- European Graphene Flagship. Available online: http://graphene-flagship.eu/ (accessed on 25 April 2018).
- Gong, X.Z.; Liu, G.Z.; Li, Y.S.; Yu, D.Y.W.; Teoh, W.Y. Functionalized-graphene composites: Fabrication and applications in sustainable energy and environment. Chem. Mater. 2016, 28, 8082–8118. [Google Scholar] [CrossRef]
- Shapira, P.; Gök, A.; Salehi, F. Graphene enterprise: Mapping innovation and business development in a strategic emerging technology. J. Nanopart. Res. 2016, 18, 269. [Google Scholar] [CrossRef] [PubMed]
- IDTechEX. Graphene, 2D Materials and Carbon Nanotubes: Markets, Technologies and Opportunities 2018–2028. Available online: https://www.idtechex.com/research/reports/graphene-2d-materials-and-carbon-nanotubes-markets-technologies-and-opportunities-2018-2028-000603.asp (accessed on 2 October 2018).
- Cho, H.P.; Lim, H.; Lee, D.; Cho, H.; Kang, K.I. Patent Analysis for Forecasting Promising Technology in High-Rise Building Construction. Technol. Forecast. Soc. Chang. 2018, 128, 144–153. [Google Scholar] [CrossRef]
- Comanor, W.S.; Scherer, F.M. Patent statistics as a measure of technical change. J. Political Econ. 1969, 77, 392–398. [Google Scholar] [CrossRef]
- Gupta, V.K. Technological trends in the area of fullerenes using bibliometric analysis of patents. Scientometrics 1999, 44, 17–31. [Google Scholar] [CrossRef]
- Liu, X.; Yu, X. Patent analysis for guiding technology transfer from EU/EEA to China: The case of CO2 compressor in CCUS cooperation. In Proceedings of the 2016 Portland International Conference on Portland International Conference on Management of Engineering & Technology (PICMET), Honolulu, HI, USA, 4–8 September 2016; pp. 1659–1671. [Google Scholar]
- Mohamad, A.N.; Bakri, N.N.; Ahmad, M.S. Visualising Research Data in Dentistry. In Proceedings of the 4th International Conference of Information Mangement (ICIM), Oxford, UK, 25–27 May 2018; pp. 35–40. [Google Scholar]
- Lv, P.H.; Wang, G.F.; Wan, Y.; Liu, J.; Liu, Q.; Ma, F. Bibliometric trend analysis on global graphene research. Scientometrics 2011, 88, 399–419. [Google Scholar] [CrossRef]
- Etxebarria, G.; Gomez-Uranga, M.; Barrutia, J. Tendencies in scientific output on carbon nanotubes and graphene in global centers of excellence for nanotechnology. Scientometrics 2012, 91, 253–268. [Google Scholar] [CrossRef]
- Small, H.; Boyack, K.W.; Klavan, R. Identifying emerging topics in science and technology. Res. Policy 2014, 43, 1450–1467. [Google Scholar] [CrossRef]
- Kwon, S.; Porter, A.; Youtie, J. Navigating the innovation trajectories of technology by combining specialization score analyses for publications and patents: Graphene and nano-enabled drug delivery. Scientometrics 2016, 106, 1057–1071. [Google Scholar] [CrossRef]
- Shapira, P.; Youtie, J.; Arora, S. Early patterns of commercial activity in graphene. J. Nanopart. Res. 2012, 14, 811. [Google Scholar] [CrossRef]
- Baglieri, D.; Cesaroni, F.; Orsi, L. Does the nano-patent ‘Gold rush’ lead to entrepreneurial driven growth? Some policy lessons from China and Japan. Technovation 2014, 34, 746–761. [Google Scholar] [CrossRef]
- Dhand, V.; Rhee, Y.K.; Kim, J.H.; Jung, D.H. A comprehensive review of graphene nanocomposites: Research status and trends. J. Nanomater. 2013, 2013, 158–171. [Google Scholar] [CrossRef]
- Aïssa, B.; Memon, N.K.; Ali, A.; Khraisheh, M.K. Recent Progress in the Growth and Applications of Graphene as a Smart Material: A Review. Front. Mater. 2015, 2, 58. [Google Scholar] [CrossRef]
- Xiong, G.; Meng, C.; Reifenberger, R.G.; Irazoqui, P.P.; Fisher, T.S. A Review of Graphene-Based Electrochemical Microsupercapacitors. Electroanalysis 2014, 26, 30–51. [Google Scholar] [CrossRef]
- Geels, F.W. Technological transitions as evolutionary reconfiguration processes: A multi-level perspective and a case-study. Res. Policy 2002, 31, 1257–1274. [Google Scholar] [CrossRef]
- Geels, F.W. A socio-technical analysis of low-carbon transitions: Introducing the multi-level perspective into transport studies. J. Transp. Geogr. 2012, 24, 471–482. [Google Scholar] [CrossRef]
- Whitmarsh, L. How useful is the multi-level perspective for transport and sustainability research? J. Transp. Geogr. 2012, 24, 483–487. [Google Scholar] [CrossRef]
- Verbong, G.P.J.; Geels, F.W. Exploring sustainability transitions in the electricity sector with socio-technical pathways. Technol. Forecast. Soc. Chang. 2010, 77, 1214–1221. [Google Scholar] [CrossRef]
- Geels, F.W.; Kern, F.; Fuchs, G.; Hinderer, N.; Kungl, G.; Mylan, J.; Neukirch, M.; Wassermann, S. The enactment of socio-technical transition pathways: A reformulated typology and a comparative multi-level analysis of the German and UK low-carbon electricity transitions (1990–2014). Res. Policy 2016, 45, 896–913. [Google Scholar] [CrossRef]
- Bergman, N.; Haxeltine, A.; Whitmarsh, L.; Köhler, J.; Schilperoord, M.; Rotmans, J. Modelling socio-technical transition patterns and pathways. J. Artif. Soc. Soc. Simul. 2008, 11, 1–32. [Google Scholar]
- Osunmuyiwa, O.; Biermann, F.; Kalfagianni, A. Applying the multi-level perspective on socio-technical transitions to rentier states: The case of renewable energy transitions in Nigeria. J. Environ. Policy Plan. 2018, 20, 143–156. [Google Scholar] [CrossRef]
- Li, X.; Zhou, Y.; Xue, L.; Huang, L. Integrating bibliometrics and roadmapping methods: A case of dye-sensitized solar cell technology-based industry in China. Technol. Forecast. Soc. Chang. 2015, 97, 205–222. [Google Scholar] [CrossRef]
- Yu, C.; Zhang, Z.; Lin, C.; Wu, Y.J. Knowledge Creation Process and Sustainable Competitive Advantage: The Role of Technological Innovation Capabilities. Sustainability 2017, 9, 2280. [Google Scholar] [CrossRef]
- Urbancova, H. Competitive advantage achievement through innovation and knowledge. J. Compet. 2013, 5, 82–96. [Google Scholar] [CrossRef]
- Martín-de Castro, G.; Delgado-Verde, M.; Navas-López, J.E.; Cruz-González, J. The moderating role of innovation culture in the relationship between knowledge assets and product innovation. Technol. Forecast. Soc. Chang. 2013, 80, 351–363. [Google Scholar] [CrossRef]
- Kim, Y.G.; Suh, J.H.; Park, S.C. Visualization of patent analysis for emerging technology. Expert Syst. Appl. 2008, 34, 1804–1812. [Google Scholar] [CrossRef]
- Wei, L.; Jie, H. On the Action Mechanism of Patent Forming Competitive Advantage. In Proceedings of the 2010 International Conference on Internet Technology & Applications, Wuhan, China, 20–22 August 2010; pp. 1–4. [Google Scholar]
- Pargaonkar, Y.R. Leveraging patent landscape analysis and IP competitive intelligence for competitive advantage. World Pat. Inf. 2016, 45, 10–20. [Google Scholar] [CrossRef]
- Mykytyn, K.; Mykytyn, P.P.; Bordoloi, B.; Mckinney, V.; Bandyopadhyay, K. The role of software patents in sustaining it-enabled competitive advantage: A call for research. J. Strateg. Inf. Syst. 2002, 11, 59–82. [Google Scholar] [CrossRef]
- Porter, A.L.; Newman, N.C. Patent Profiling for Competitive Advantage. In Handbook of Quantitative Science and Technology Research; Moed, H.F., Glänzel, W., Schmoch, U., Eds.; Springer: Dordrecht, The Netherlands, 2004. [Google Scholar] [CrossRef]
- Martin, N.L.; Mykytyn, P.P. Business method patents and sustained competitive advantage. Data Process. Better Bus. Educ. 2010, 50, 88–96. [Google Scholar] [CrossRef]
- Harrigan, K.R.; Diguardo, M.C. Sustainability of patent-based competitive advantage in the U.S. communications services industry. J. Technol. Transf. 2017, 42, 1–28. [Google Scholar] [CrossRef]
- Bessen, J. The value of U.S. patents by owner and patent characteristics. Res. Policy 2008, 37, 932–945. [Google Scholar] [CrossRef]
- Berkowitz, L. Getting the most from your patents. Res. Technol. Manag. 1993, 36, 26–31. [Google Scholar] [CrossRef]
- Lai, K.K.; Su, F.P.; Weng, C.S.; Chen, C.L.; Lin, M.L. A Study of Co-Opetition Strategy from the Patent Analysis Perspective: The Case of Manufacturers in the Stent Market. In Proceedings of the 2006 Portland International Conference on Portland International Conference on Management of Engineering & Technology (PICMET), Istanbul, Turkey, 8–13 July 2006; pp. 2141–2149. [Google Scholar]
- Geels, F.W.; Schot, J. Typology of sociotechnical transition pathways. Res. Policy 2007, 36, 399–417. [Google Scholar] [CrossRef]
- Islam, N.; Ozcan, S. Nanotechnology innovation system: An empirical analysis of the emerging actors and collaborative networks. IEEE Trans. Eng. Manag. 2013, 60, 687–703. [Google Scholar] [CrossRef]
- Harhoff, D.; Scherer, F.M.; Vopel, K. Citations, family size, opposition and the value of patent rights. Res. Policy 2003, 32, 1343–1363. [Google Scholar] [CrossRef]
- Qiu, H.H.; Yang, J. An assessment of technological innovation capabilities of carbon capture and storage technology based on patent analysis: A comparative study between china and the United States. Sustainability 2018, 10, 877. [Google Scholar] [CrossRef]
- Little, A.D. The Strategic Management of Technology; MIT Press: Cambridge, MA, USA, 1981. [Google Scholar]
- Haupt, R.; Kloyer, M.; Lange, M. Patent indicators for the technology life cycle development. Res. Policy 2007, 36, 387–398. [Google Scholar] [CrossRef]
- INNOGRAPHY. Available online: https://www.innography.com/ (accessed on 15 December 2018).
- Derwent Innovation Index (DII). Available online: https://clarivate.com/products/derwent-innovation/ (accessed on 15 December 2018).
- Chen, C.M.; Chen, Y. CiteSpace II: Detecting and visualizing emerging trends and transient patterns in scientific literature. J. China Soc. Sci. Tech. Inf. 2006, 57, 359–377. [Google Scholar] [CrossRef]
- Ernst, H. The use of patent data for technological forecasting: The diffusion of CNC-technology in the machine tool industry. Small Bus. Econ. 1997, 9, 361–381. [Google Scholar] [CrossRef]
- Gao, L.; Porter, A.L.; Wang, J.; Fang, S.; Zhang, X.; Ma, T.; Wang, W.; Huang, L. Technology life cycle analysis method based on patent documents. Technol. Forecast. Soc. Chang. 2013, 80, 398–407. [Google Scholar] [CrossRef]
- Dresselhaus, M.S.; Araujo, P.T. Perspectives on the 2010 Nobel Prize in physics for graphene. ACS Nano 2010, 4, 6297–6302. [Google Scholar] [CrossRef] [PubMed]
- Du, Y.; Cai, K.F.; Shen, S.Z.; Casey, P.S. Preparation and characterization of graphene nanosheets/poly(3-hexylthiophene) thermoelectric composite materials. Synth. Met. 2012, 162, 2102–2106. [Google Scholar] [CrossRef]
- Ashok, K.N.; Baek, J.B. Electrochemical supercapacitors from conducting polyaniline-graphene platforms. Chem. Commun. 2014, 50, 6298–6308. [Google Scholar] [CrossRef] [PubMed]
- Aghigh, A.; Alizadeh, V.; Wong, H.Y.; Islam, M.S.; Amin, N.; Zaman, M. Recent advances in utilization of graphene for filtration and desalination of water: A review. Desalination 2015, 365, 389–397. [Google Scholar] [CrossRef]
- Lü, K.; Zhao, G.X.; Wang, X.K. A brief review of graphene-based material synthesis and its application in environmental pollution management. Chin. Sci. Bull. 2012, 57, 1223–1234. [Google Scholar] [CrossRef]
- Zhao, G.; Li, J.; Ren, X.; Wang, X. Few-layered graphene oxide nanosheets as superior sorbents for heavy metal ion pollution management. Environ. Sci. Technol. 2011, 45, 10454–10462. [Google Scholar] [CrossRef]
- Tang, L.; Shapira, P.; Youtie, J. Is there a clubbing effect underlying Chinese research citation increases? J. Assoc. Inf. Sci. Technol. 2015, 66, 1923–1932. [Google Scholar] [CrossRef]
- Yu, X.; Zhang, B. Obtaining advantages from technology revolution: A patent roadmap for competition analysis and strategy planning. Technol. Forecast. Soc. Chang. 2017. [Google Scholar] [CrossRef]
- Liu, G. Visualization of patents and papers in terahertz technology: A comparative study. Scientometrics 2013, 94, 1037–1056. [Google Scholar] [CrossRef]
- Li, X.; Zhou, Y.; Xue, L.; Huang, L.C. Roadmapping for industrial emergence and innovation gaps to catch-up: A patent-based analysis of OLED industry in China. Int. J. Technol. Manag. 2016, 72, 1–39. [Google Scholar] [CrossRef]
- Lee, S.; Lee, K.; Liu, C.H.; Zhong, Z. Homogeneous bilayer graphene film based flexible transparent conductor. Nanoscale 2012, 4, 639–644. [Google Scholar] [CrossRef] [PubMed]
- Yu, A.; Roes, I.; Davies, A.; Chen, Z. Ultrathin, transparent, and flexible graphene films for supercapacitor application. Appl. Phys. Lett. 2010, 96, 253105–253108. [Google Scholar] [CrossRef]
- Ping, J.; Wu, J.; Wang, Y.; Ying, Y. Simultaneous determination of ascorbic acid, dopamine and uric acid using high-performance screen-printed graphene electrode. Biosens. Bioelectron. 2012, 34, 70–76. [Google Scholar] [CrossRef] [PubMed]
- Liu, L.J.; Cao, C.; Song, M. China’s agricultural patents: How has their value changed amid recent patent boom? Technol. Forecast. Soc. Chang. 2014, 88, 106–121. [Google Scholar] [CrossRef]
- Criscuolo, P. The ‘home advantage’ effect and patent families. A comparison of OECD triadic patents, the USPTO and the EPO. Scientometrics 2005, 66, 23–41. [Google Scholar] [CrossRef]
- Scherer, F.M.; Harhoff, D. Technology policy for a world of skew-distributed outcomes. Res. Policy 2000, 29, 559–566. [Google Scholar] [CrossRef]
- Chen, Y.S.; Chang, K.C. Exploring the nonlinear effects of patent citations, patent share and relative patent position on market value in the US pharmaceutical industry. Technol. Anal. Strateg. Manag. 2010, 22, 153–169. [Google Scholar] [CrossRef]
- Zurutuza, A.; Marinelli, C. Challenges and opportunities in graphene commercialization. Nat. Nanotechnol. 2014, 9, 730–734. [Google Scholar] [CrossRef]


| Industrial Chain | Technological Field |
|---|---|
| Upstream industry | Graphite; CVD graphene preparation method; Carbonaceous gas, e.g., methane |
| Mid-stream industry | Graphene film; Graphene powder; Graphene-based compound |
| Downstream industry | New energy industry: Lithium-ion battery; Supercapacitor; Solar cell Electronics industry: Flexible display device; Sensor Composite materials industry: Electrical conductivity composite material; Heat conductivity composite material; Reinforcement material Biomedical industry: Drug carrier; Gene therapy; Biological detection Environmental protection industry: Sea water desalination; Sewage disposal |
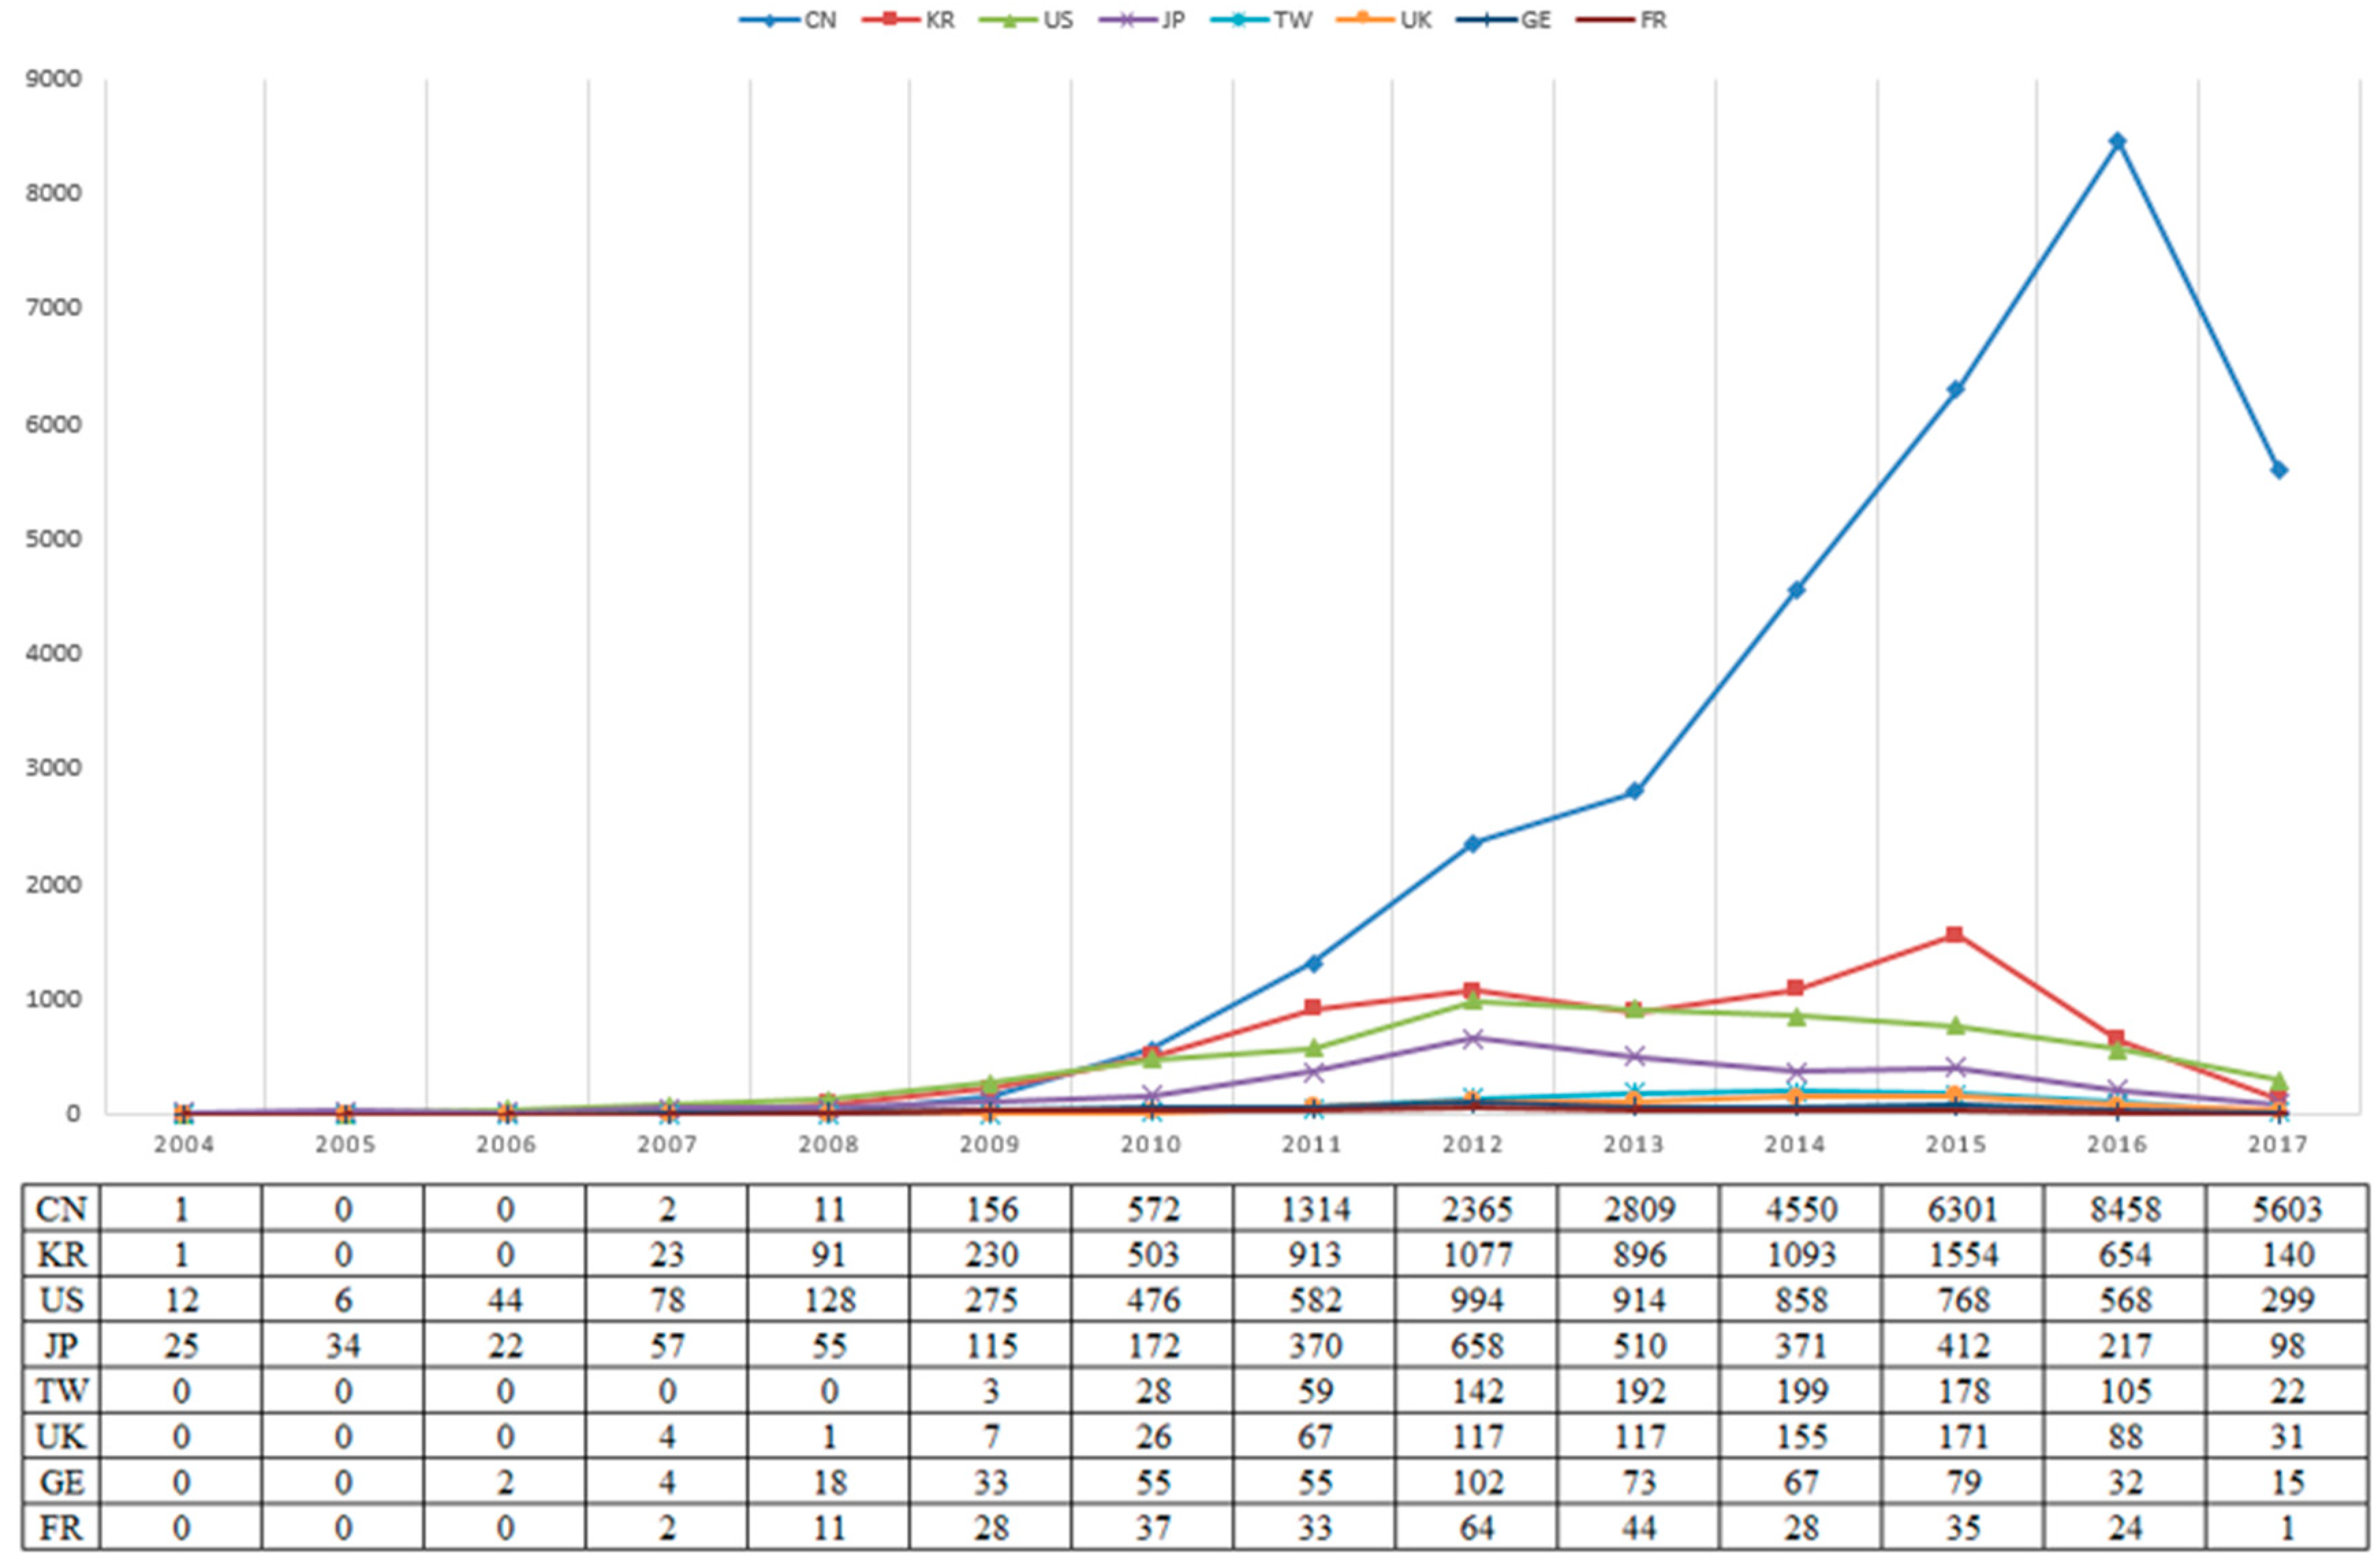
| Country | Emerging Stage | Growth Stage | Total | |||
|---|---|---|---|---|---|---|
| Number of patents | Percentage | Number of patents | Percentage | Number of patents | Percentage | |
| China | 742 | 20.8% | 31,400 | 63.5% | 32,142 | 60.7% |
| Korea | 848 | 23.7% | 6327 | 12.8% | 7175 | 13.6% |
| The U.S. | 1019 | 28.5% | 4982 | 10.1% | 6001 | 11.3% |
| Japan | 480 | 13.4% | 2636 | 5.3% | 3116 | 5.9% |
| Taiwan | 31 | 0.9% | 897 | 1.8% | 928 | 1.8% |
| The U.K | 38 | 1.1% | 746 | 1.5% | 784 | 1.5% |
| Germany | 112 | 3.1% | 423 | 0.9% | 535 | 1.0% |
| France | 78 | 2.2% | 229 | 0.5% | 307 | 0.6% |
| Derwent Manual Code | Technological Field | Centrality | Frequency |
|---|---|---|---|
| A12-E06A | Electrodes for batteries, accumulators, fuel cells | 0.28 | 26 |
| A08-R03 | Carbon fillers and reinforcing agents | 0.22 | 27 |
| L03-A02G | Conductive Nanomaterials | 0.15 | 56 |
| E05-U05C | Nanofilm | 0.15 | 41 |
| E31-N04D | Other form of C, inert | 0.14 | 69 |
| U11-A14 | Nano-structural materials | 0.14 | 47 |
| L04-C11C | Semiconductor processing—electrodes | 0.13 | 86 |
| E05-U03 | Carbon nanotubes | 0.13 | 84 |
| L03-A02B | Non metal conductors—carbon and graphite | 0.10 | 122 |
| A12-W14 | Nanotechnology | 0.10 | 100 |
| Derwent Manual Code | Technological Field | Centrality | Frequency |
|---|---|---|---|
| L03-A02B | Non metal conductors—carbon and graphite | 0.29 | 2105 |
| E05-U05C | Nanofilm | 0.23 | 4298 |
| L04-C11C | Semiconductor processing—electrodes | 0.08 | 537 |
| E11-A01 | Cyclisation—Processes, Apparatus | 0.06 | 2114 |
| A12-E14 | Electrodes | 0.06 | 882 |
| L03-H05 | Vehicles | 0.05 | 2931 |
| A10-E05B | Chemical modification by carbonization | 0.05 | 1219 |
| E11-F03 | Alkylation, arylation, acylation of C atoms, condensation; other carbon chain extension reformation | 0.04 | 1643 |
| X16-B01F1 | Lithium-based | 0.03 | 1784 |
| L03-E01B5B | Lithium electrodes | 0.03 | 1730 |
| Foreign Patent Filing Country/Region | Domestic Patent Filing Country/Region | |||||||
|---|---|---|---|---|---|---|---|---|
| CN | KR | US | JP | TW | UK | GE | FR | |
| CN | 30726 | 245 | 505 | 257 | 82 | 53 | 33 | 10 |
| KR | 43 | 5092 | 263 | 152 | 9 | 26 | 34 | 18 |
| US | 448 | 1109 | 3042 | 571 | 319 | 116 | 143 | 52 |
| JP | 149 | 173 | 322 | 1509 | 13 | 41 | 25 | 23 |
| TW | 152 | 29 | 120 | 147 | 485 | 8 | 14 | 2 |
| UK | 93 | 143 | 359 | 126 | 12 | 331 | 110 | 50 |
| GE | 93 | 143 | 319 | 120 | 0 | 123 | 136 | 52 |
| FR | 86 | 139 | 317 | 0 | 6 | 118 | 110 | 142 |
| WIPO | 496 | 382 | 885 | 273 | 7 | 141 | 91 | 50 |
| EPO | 90 | 141 | 323 | 124 | 5 | 118 | 114 | 54 |
| Foreign patent filing rate in emerging stage (%) | 16.31 | 27.36 | 48.38 | 42.08 | 48.39 | 55.36 | 75.90 | 50.00 |
| Foreign patent filing rate in growth stage (%) | 4.13 | 41.35 | 49.50 | 53.30 | 47.71 | 57.91 | 74.23 | 55.02 |
| Total foreign patent filing rate (%) | 4.41 | 29.03 | 49.31 | 51.57 | 47.74 | 57.78 | 74.58 | 53.75 |
| Patent Number | Assignee | Number of Forward Citations | Country | Stage |
|---|---|---|---|---|
| US20070284557 A1 | Samsung Electronics Co, Ltd | 221 | Korea | Emerging stage |
| US20090117467 A1 | Samsung Electronics Co, Ltd | 208 | Korea | Emerging stage |
| US20100021708 A1 | Massachusetts Institute of Technology | 185 | the U.S. | Emerging stage |
| US20100143798 A1 | Samsung Electronics Co, Ltd | 179 | Korea | Emerging stage |
| US20090020764 A1 | Globalfoundries Inc. | 177 | the U.S. | Emerging stage |
| US20100176337 A1 | Samsung Electronics Co, Ltd | 172 | Korea | Emerging stage |
| US20070212538 A1 | Oned Material LLC | 170 | the U.S. | Emerging stage |
| US20070053168 A1 | General Electronics Company | 157 | the U.S. | Emerging stage |
| US7623340 B1 | Samsung Electronics Co, Ltd | 152 | Korea | Emerging stage |
| US20090110627 A1 | Samsung Electronics Co, Ltd | 139 | Korea | Emerging stage |
| US20120141799 A1 | Kub Francis | 135 | the U.S. | Growth stage |
| US20080020193 A1 | Nanotek Instruments, Inc | 132 | the U.S. | Emerging stage |
| US20070187694 A1 | Provenance Asset Group LLC | 130 | the U.S. | Emerging stage |
| US20100327847 A1 | President and Fellows of Harvard College | 122 | the U.S. | Emerging stage |
| US20100105834 A1 | William Marsh Rice University | 118 | the U.S. | Emerging stage |
| CN103943925 B | Peking University | 113 | China | Growth stage |
| US20090155561 A1 | Samsung Electronics Co, Ltd | 111 | Korea | Emerging stage |
| US20090140801 A1 | Columbia University | 111 | the U.S. | Emerging stage |
| US20100028681 A1 | The Leland Stanford Junior University | 110 | the U.S. | Emerging stage |
| US20100028559 A1 | Portland State University | 109 | the U.S. | Emerging stage |
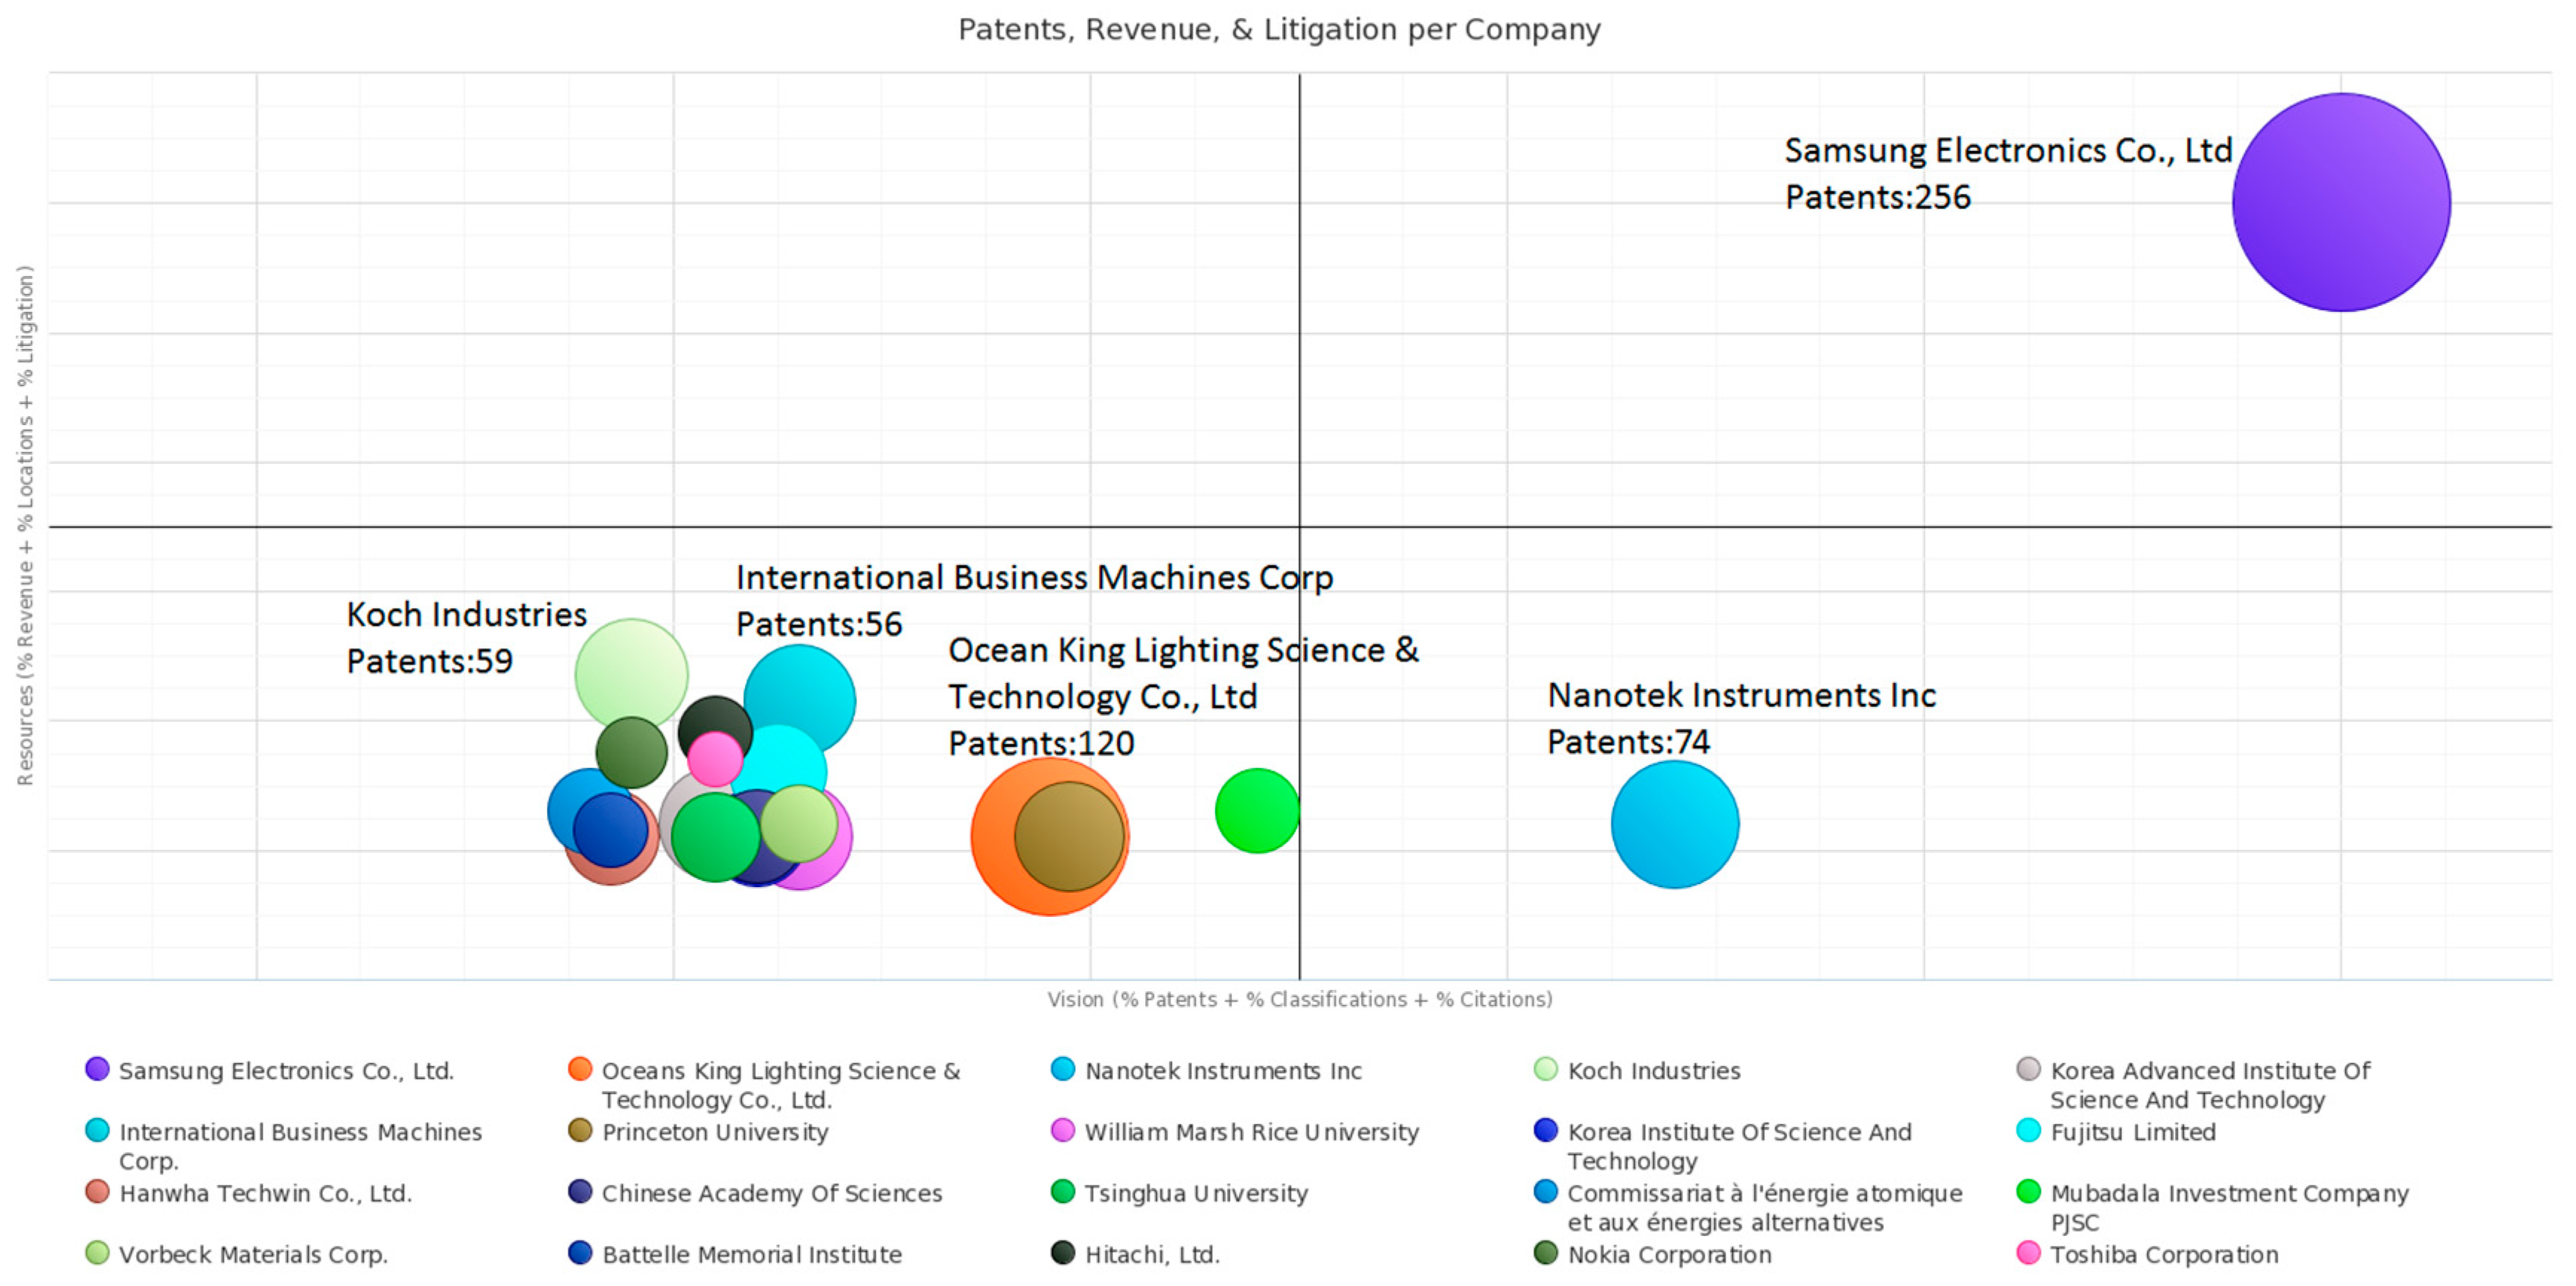
| Assignee | Country Origin | Number of Patent | Percentage |
|---|---|---|---|
| Samsung Electronics Co., Ltd | Korea | 198 | 25.3% |
| Nanotek Instruments Inc | the U.S. | 74 | 9.5% |
| Princeton University | the U.S. | 44 | 5.6% |
| Oceans King Lighting Science & Technology Co., Ltd | China | 44 | 5.6% |
| Koch Industries | the U.S. | 41 | 5.2% |
| William Marsh Rice University | the U.S. | 41 | 5.2% |
| International Business Machines Corp | the U.S. | 35 | 4.5% |
| Mubadala Investment Company PJSC | United Arab Emirates | 33 | 4.2% |
| Vorbeck Materials Corp. | the U.S. | 30 | 3.8% |
| Korea Advanced Institute Of Science And Technology | Korea | 30 | 3.8% |
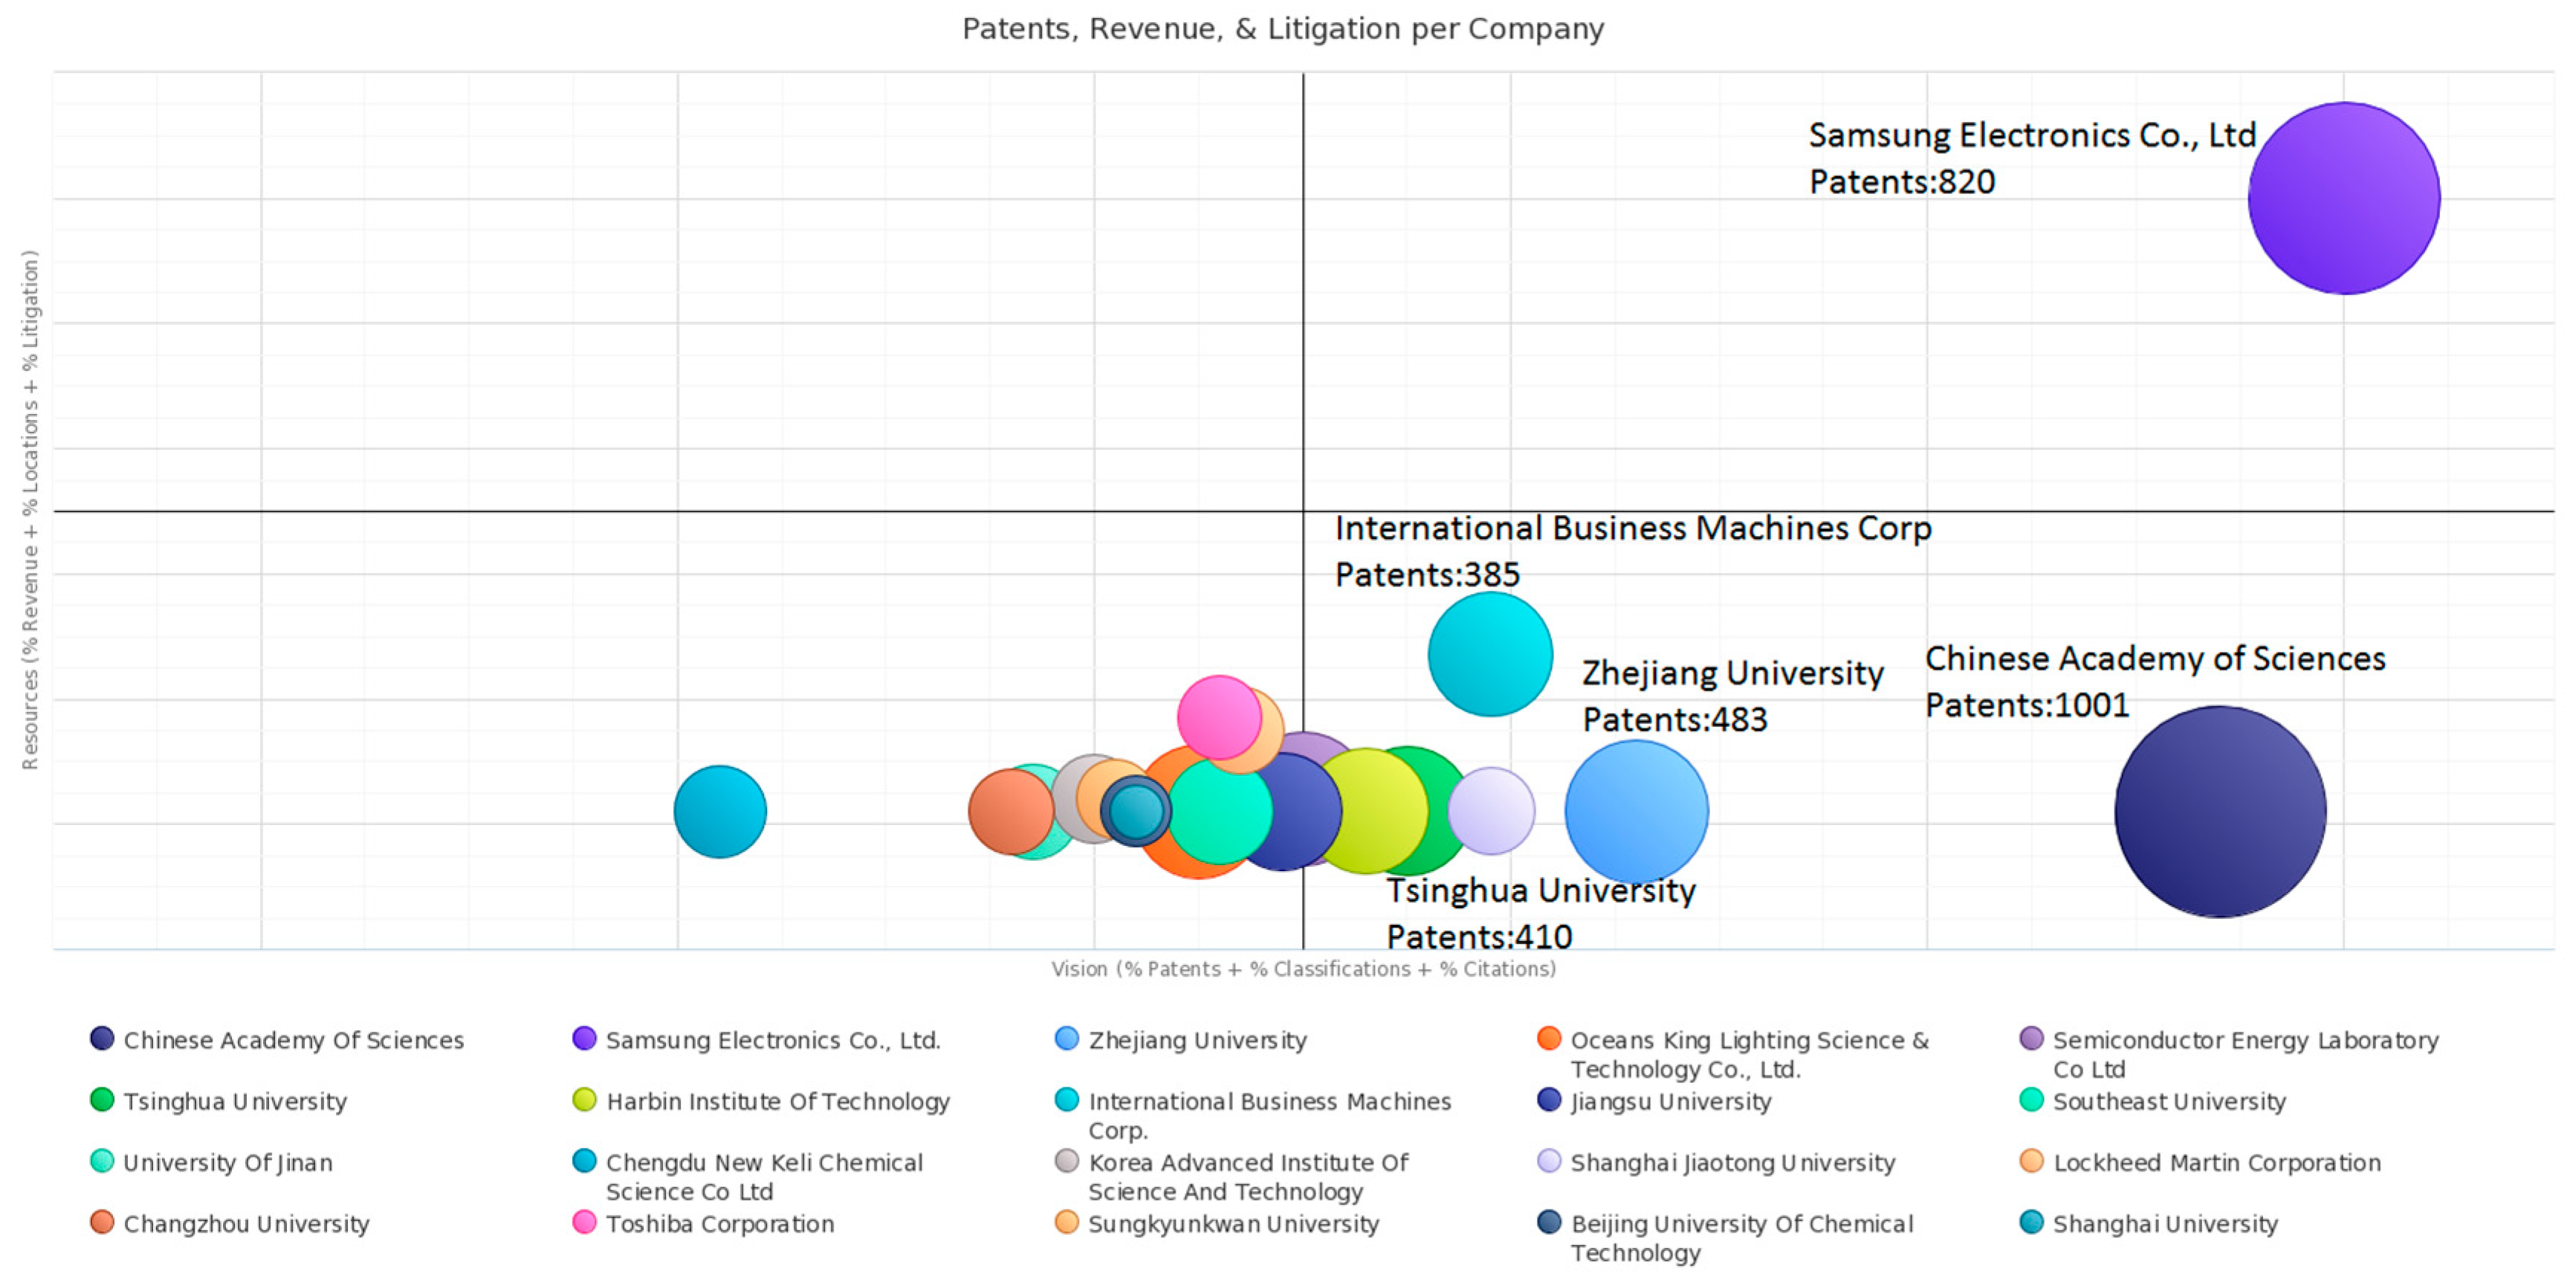
| Assignee | Country Origin | Number of Patent | Percentage |
|---|---|---|---|
| Samsung Electronics Co., Ltd | Korea | 412 | 16.3% |
| Chinese Academy of Sciences | China | 247 | 9.8% |
| International Business Machines Corp | the U.S. | 179 | 7.1% |
| Semiconductor Energy Laboratory Co Ltd | Japan | 138 | 5.5% |
| Tsinghua University | China | 130 | 5.1% |
| Nanotek Instruments Inc | the U.S. | 125 | 4.9% |
| Oceans King Lighting Science & Technology Co., Ltd | China | 123 | 4.9% |
| Zhejiang University | China | 121 | 4.8% |
| Intellectual Ventures Management, LLC | the U.S. | 120 | 4.8% |
| Lockheed Martin Corperation | the U.S. | 112 | 4.4% |
© 2018 by the authors. Licensee MDPI, Basel, Switzerland. This article is an open access article distributed under the terms and conditions of the Creative Commons Attribution (CC BY) license (http://creativecommons.org/licenses/by/4.0/).
Share and Cite
Yang, X.; Yu, X.; Liu, X. Obtaining a Sustainable Competitive Advantage from Patent Information: A Patent Analysis of the Graphene Industry. Sustainability 2018, 10, 4800. https://doi.org/10.3390/su10124800
Yang X, Yu X, Liu X. Obtaining a Sustainable Competitive Advantage from Patent Information: A Patent Analysis of the Graphene Industry. Sustainability. 2018; 10(12):4800. https://doi.org/10.3390/su10124800
Chicago/Turabian StyleYang, Xi, Xiang Yu, and Xin Liu. 2018. "Obtaining a Sustainable Competitive Advantage from Patent Information: A Patent Analysis of the Graphene Industry" Sustainability 10, no. 12: 4800. https://doi.org/10.3390/su10124800
APA StyleYang, X., Yu, X., & Liu, X. (2018). Obtaining a Sustainable Competitive Advantage from Patent Information: A Patent Analysis of the Graphene Industry. Sustainability, 10(12), 4800. https://doi.org/10.3390/su10124800