Article

Dynamics of Cooperation in Minority Games in Alliance Networks

1
School of Management and Economics, University of Electronic Science and Technology of China, Chengdu 610054, China
2
School of Computer Science and Engineering, University of Electronic Science and Technology of China, Chengdu 610054, China
3
Department of Physics, University of Fribourg, 1700 Fribourg, Switzerland
4
Walker College of Business, Appalachian State University, Boone, NC 28608-2037, USA
5
School of Information and Software Engineering, University of Electronic Science and Technology of China, Chengdu 610054, China
*
Author to whom correspondence should be addressed.
Sustainability 2018, 10(12), 4746; https://doi.org/10.3390/su10124746
Submission received: 3 November 2018 / Revised: 7 December 2018 / Accepted: 11 December 2018 / Published: 12 December 2018
(This article belongs to the Section Economic and Business Aspects of Sustainability)

Abstract

:
Alliance networks are the underlying structures of social systems in business, management, and society. The sustainability and dynamics of a social system rely on the structural evolutions of the topologies. Understanding the evolution sheds light on the dynamics and sustainability of a social system. Minority game models have been successfully applied across social science, economy, management, and engineering. They provide simple yet applicable modeling to articulate the evolutionary cooperation dynamics of competitive players in binary decision situations. By extending the minority games played in alliance networks, the cooperation in structured systems of different network topologies is analyzed. In this model, local and global score strategies are considered with and without cooperation rewiring options. The cooperation level, the score, and the topological properties are investigated. The research uses a numerical simulation approach on random networks, scale-free networks, and small-world networks. The results suggest that the network rewiring strategy leads to higher systemic performance with a higher score and a higher level of stability in decision-making. Competitive decision-making can lead to a higher level of cooperation from a poor initial start. However, stubbornness in decision-making can lead to a poor situation when cooperation is discouraged. Players with local or global information adopt local and global score strategies. The results show that local strategies might lead to imbalance, while a global strategy might achieve a relatively stable outcome. This work contributes to bridge minority games in structured networks to study the cooperation between formation and evolution, and calls for future minority game modeling on social networks.

1. Introduction

The cooperation in social society at an individual or institutional level is a result of social choices made by a group of parties. The sustainability of a social system in business, management, or society relies on the dynamics of the topology. A cooperative alliance network can enhance the benefits of the whole system. Understanding the relationship between cooperation behaviors and the underlying network dynamics is essential for better policy-making. Even though a rich body of literature has studied the emergence and dynamics of cooperation from the perspective of social science, economics, game theory, organization science, and social networks [1,2,3,4], the understanding of cooperation remains a major challenge, especially regarding the intersection of the above disciplines. More specifically, in the eyes of scholars of organization science and management science, cooperations are bonds among participating parties within which alliances are formed to achieve certain goals beyond individual capabilities [5,6]. Alliance networks can be widely found in many aspects of human society [6,7]. The cooperations of multiple partners in industries such as construction [8], software [9], and enterprises [10] have been studied and modeled in alliance networks. These studies shed light into the understanding of the dynamics and performance of whole systems. For example, in the movie industry, creative individuals, such as directors, screen writers, actors, and actresses, are constantly forming movie alliances when they are working on movie projects. The performance of these movie alliances is related to network formations [11].
The alliance networks are the result of multilateral cooperations. In game theory, cooperation is usually treated as a result of games played by two or multiple sides facing certain payoffs [3,12]. From the perspective of social dynamics, especially opinion dynamics, cooperations can also be modeled as the result of opinion formation when players reach an agreement. In Deffuant models [13,14], linked players adjust their opinions when their opinions reach a threshold. In this manner, various cases can be modeled [15,16]. This work focuses on the case without a Deffuant threshold. Considering that the cooperation diversifications of structured heterogeneous populations are naturally modeled as the dynamics of social networks, there is an emerging thread of studies exploring the evolutionary games played in networks [12,17,18,19,20,21,22]. Putting all the above together, in a structured population or social ecosystem, one game player may choose, rationally or irrationally, to cooperate with other players. In this manner, alliances are formed with newly established edges in the network. On the other hand, if a player chooses to be uncooperative in a game, this could lead to possible cancelation of existing edges; thus, an alliance is disbanded. To model this kind of binary decision situation, the Minority Game (MG) was proposed [23], and due to its simplicity and broad applicability, MG has been adopted into a wide range of domains, such as social science, economics, and beyond. As the simplest game model, MG sheds lights on the emergence of cooperation and competition of agents [23,24]. Along with this thread of studies, it is interesting to study how cooperation evolves for a group of heterogeneous players in a structured alliance network when their decisions are binary, and how the topology of the alliance network and cooperation mutually influence each other. Meanwhile, it is important to understand how cooperation evolves in the face of local and global information on the alliance networks. Formally speaking, to extend and combine the above threads of studies of cooperation, alliance networks, and the minority game in social networks, in this study, we investigate the evolutionary minority game played in networks to study how alliances form and evolve and how the topological properties conversely influence the evolutions.
This work contributes to the literature by marrying the minority game to the alliance social network context. Unlike most existing models in which the networks are fixed, our model introduces the edge rewiring process to allow players to change the topologies. Meanwhile, local and global information is considered. In this work, agent-based simulations are conducted in various topological networks, including random networks, small-world networks, and scale-free networks. Moreover, local and global information is considered in this work, as well as the decision-making probability, which is adjustable for allow a player to be adaptable or stubborn. The numerical simulation results show that in certain situations, the network rewiring strategy can lead to higher systemic performance with a higher score and a higher level of stability in decision-making. It is also observed that competitive decision-making can improve the network into a state with a higher level of cooperation from poor initial starts. However, stubbornness in decision-making might lead to a poor situation in which cooperation is discouraged.
The rest of this paper is organized as follows. Section 2 presents the theoretical background with a review of the literature as well as the motivation of this study. In Section 3, the model of the evolutionary minority game played on alliance networks is developed. In Section 4, numerical simulations are conducted and the results are presented. Finally, Section 5 presents the conclusions and discussion.

2. Theory and Motivation

Cooperation, the fundamental behavior fabricating the complexity of human society, lies at the crossroad of two threads of study: one is the evolutionary minority game in networks (MGN), another is the alliance network (AN).
Decision-making can be continuous or even hybrid in many cases [25,26]. However, in many scenarios, complicated decision-making can be simplified as a chain or combination of binary decisions. Open innovation is defined as the “use of purposive inflows and outflows of knowledge to accelerate internal innovation and expand it to external innovation” (page 1) [27]. Open innovation suggests that innovation activities can be extended within an organization. More importantly, open innovation paves the way for collaboration and cooperation across different organizations [28]. In this research, we argue that the dynamics of innovations lead to evolutionary positive changes [29]. This also leads to a lower innovation cost across society. Open innovation is considered to be the main driving force for sustainable development [28]. Open business model innovation entails the business model innovation is critically important for the long-term sustainable development. Evidence of open innovation can be found from many organizations. For example, almost 300 years ago, Mr. James Watt fundamentally changed the world by improving the stream engine. More recently, Mr. Steve Jobs started Apple with many innovative services and products. Those innovations were not invented from zero. Instead, it was the cooperation and collaboration between different individuals and organizations that led to the development [30]. The insights for the sustainability of economic growth can also be achieved by open innovations. However, the dismantling of the inverted U-Curve of open innovation suggests that there is not much deep learning, but rather, autonomous learning of open innovation for sustainable artificial intelligence [29,31]. In other words, a long-term question that a lot of business owners and policy-makers keep asking is how do we conquer the growth limits of capitalism? The dynamic model of an open innovation economy system (OIES) is proposed to further answer the research question [32]. This research adopts the OIES and further investigates the cooperation within OIES. Thus, this paper fills the research gap that connects the open innovation and a deep understanding of cooperation. To catch the nature of the competitive binary decisions of a population, MG is introduced as the most simple but non-trivial game model to study how collective cooperation and competition behaviors emerge and evolve. Originally developed to study the El Farol Bar problem [33], MG considers an odd number of individuals in a population in which all agents independently choose from two possible actions based on their observations and corresponding strategy sets. For each round of MG, there will be a minority side with fewer agents compared to the majority side with more agents. Considering the symmetry of the two sides, without loss of generality, the agents on the minority side happen to have a better payoff than those on the majority side. Though the game is relatively simple, studies show that complexity and randomness arise from multiple rounds. Due to its simple beauty and applicability, MG has inspired a thread of studies to explore the behavior complexity of competitive but cooperative agents. Variations of MG have been developed in various fields to model the stock market [24,34], heading behavior [35,36], network congestion control [37], resource allocation [38], and spectrum management [39].
With the development of network science [40,41], social, biological, and technical systems are modeled as networks in which the evolutionary dynamics and topologies are studied [42]. In light of the fact that players are socially structured in the form of networks, it is natural to see the emergence of playing evolutionary games in networks [3,4,12,17,18,22]. According to different payoff matrices, games such as the prisoner’s dilemma (PD) and the snowdrift dilemma (SD) are studied in structured populations in networks [1,3,12,43]. Recent years have witnessed a thread of the evolutionary MGN. In existing MGN studies, different topologies have been considered; however, most have involved simplified networks such as the square lattice [44], the one dimension linear chain and circle [45,46,47,48], the star [49], the ring and torus [50], and the Kauffman network [51,52], while some have adopted the weighted directed network [53], von Neumann network [54,55], Erdős-Rényi random network [48,56], directed Kauffman network [51], or small-world and scale-free networks [48,49,57,58,59]. In some cases, these networks are fixed, so players participate in games with the same local neighborhood [60,61], while some models incorporate varying networks in which edges might be deleted and added [53].
Most previous studies of MGN have only considered global information that is universally available for all players as common knowledge. This is very common in reality, for example, in presidential elections, referendums, public voting, etc. All participants have equal knowledge of the globally available information of the outcome of a collective social outcome. However, in a social network, it is possible to investigate how local information can influence the results. Focal players have local information of their surroundings, and they play the local game with their neighbors of certain distances; usually, a distance of one is considered [55,58,62,63]. Actually, by using local information, MGN can achieve better coordination [50]. To evaluate the performance of the population, a standard deviation between two sides—the majority and the minority—is calculated as a fluctuation. A small deviation indicates better resource usage and better cooperation [44,46,50]. In most studies, the network is kept unchanged. In other words, the decisions and results of one round of play have no effects on the connectivities among players. By relaxing this constraint, agents can assign weights to their edges with neighbors and delete poor edges in an endogenous directed network model [53]. The results show that these policies can lead to fast convergence to stable states with better overall performance for the population. In a common setup of the MGN, a decision probability p is used in several studies to describe the probability that the agent follows the stored strategy. In this case, the agent chooses an opposite decision with a probability of 1 p [47,49,52,57]. The p values of all agents are adjusted repeatedly according to the game outcomes.
In a dynamic population, the establishment and defection of cooperation among participants leads to the formation or disbandment of existing alliances. Cooperation-based strategic alliances can enable resource exchange, knowledge transmission, and risk sharing [6,64]. When a group of partners comes into cooperation, an AN forms. By marrying social network theories with organization science, economics, and management, the formation, dynamics, and studies on ANs contribute to the understanding of performance and promote of the formation of cooperation [6,64,65,66,67,68]. In a connected AN, the global position and local connectivity of a given player determine their knowledge and importance in the structured population. This can be translated into social capital, centrality, and structural holes for the players. In a dynamically evolving network, these properties are constantly changing. In turn, this leads to players having to face changing local and global environments, not only as the result of the evolutionary game, but also a condition for the game itself.
As the studies of both MGN and AN concern the emergence of cooperation and its environment, namely the network, it would be interesting to use the simplicity of MG to study AN with the cooperation as the bonding point. Keeping this as our motivation, we intend to bridge these two threads of study by exploring the cooperation phenomenon in ANs modeled as the evolutionary minority game or MGAN for short.

3. Model

We consider an artificial population of N players. In a global MG, we let N be odd as in other MG models [23,48,59]. However, it should be noted that this constraint is not applied to local MGs where even players might reach a tie. Each player is randomly placed on the vertex of a network with the same scale. By connecting to each other, the players form a structured population, and one edge between two directly connected vertices stands for the cooperative alliance. All these alliances turn this network into an AN. To study how the topologies of ANs affect the dynamics, we consider three kinds of initial network model, namely the Erdős–Rényi random network (ER), the small-world network (SW), and the scale-free network (SF). For an ER network, an edge is added independently with a probability p e r . To generate SW and SF networks, a standard rewiring generating process [41] and a preferential attachment mechanism are adopted [40].
To formulate our evolutionary minority game played on ANs, we introduce some denotations. We denote the ith player as v i . If v i and v j are directly connected, we say there is an edge connecting the two, thus e i j = 1 . In this case, v j is a neighbor of v i or v j Γ i and vice versa. Usually, a focal player v i has Γ i alliances with its neighbors Γ i . These alliances are known as an alliance portfolio of v i [69]. For v i , these alliances bind v i and Γ i as cooperative partners, and in the meantime, they also directly compete for limited resources. In this work, we focus on local games played with immediate neighbors.
At time t, a player v i must make a choice from two possible strategies, say A and B, with probabilities of p i t and 1 p i t , respectively [47,49,52,57]. In a local MG, player v i tries to be on the minority side with its immediate neighbors v j Γ i to win a positive unit score (+1) as a reward. Otherwise, a unit of a negative score (−1) will be granted as punishment. In the rare case of a tie occurring in the local MG, a score of zero is given. The rewarding rule is described as
r i t = + 1 if v i minority , 0 if it s a tie , 1 if v i majority .
For the global MG, the players have global information and the score is simply decided on the side one happens to be on. We refer to this score rule as the global score strategy. On the contrary, the local MG indicates that all players have only limited information of the AN; thus, the game is repeated locally for each focal player, and only local neighbors within the social distance of one are considered. For the local MG, we consider two cases: one single game case and one multiple game case. In a simple case, the score s i t for v i at time t is only determined by the one-time local MG with v i as the focal player; the score s i t = r i , M G i t . In the multiple game case or accumulative case, s i t is the sum of all scores gained from 1 + Γ i MGs in which v i and all neighbors of Γ i are considered to be the focal player one by one. For the latter, v i is a neighbor of its neighbor, that is, v i Γ j and v j Γ i , where e i j = 1 . In the MG with v j as the focal player, v i also gets a score from this MG. Thus, the total score for v i in an accumulative manner is the total score v i gained from all possible MGs it is involved in. Therefore, the local score strategy for the accumulative case can be described as
s i t = r i , M G i t + j Γ i r i , M G j t ,
where M G i denotes the local game with v i as the focal player.
If v i happens to be in the majority, it adjusts the probability to that choice by an aversion coefficient α . If A is the majority, v i updates p i t as α p i t in the hope of avoiding being in the majority again; thus, the probability for B is increased to 1 α p i t . However, if A happens to be the minority, then the probability of choosing B will be published to α ( 1 p i t ) ; thus, the probability to stick to A is strengthened to 1 α ( 1 p i t ) . This probability updating rule is described by the following equation:
p i t , 1 p i t α p i t , 1 α p i t if A is majority , 1 α ( 1 p i t ) , α ( 1 p i t ) if B is majority .
Most literature regarding EMG in networks only adopts a simplified probability adjustment policy in which the probability is randomly chosen from a relaxed range centered around the initial probability [49,59]. In our model, the probability updating rule is introduced to mimic the adoptive behaviors of intelligent agents. Moreover, in these studies, no changes are made to the connectivities of the AN. The network topologies are kept the same through all rounds. In other words, games are played on a fixed topological network configuration in which the game has no impact on the connectivities. This approach omits the evolutionary effects of games upon the networks and greatly limits their applicability to real life scenarios. In reality, the game relies on the network environment, and the outcome of a game also inevitably brings changes to the environment, in turn. For ANs, after each round of a game, players can form new alliances as well as abolish existing alliances. To capture this dynamic network evolving nature, a rewiring policy is introduced in our model. After updating decision probabilities, a focal player, who happens to be in the majority, is granted a chance to reconfigure their edge. In this rewiring, the focal player first abolishes an edge with a randomly chosen neighbor who is also in the majority and establishes a new edge from a randomly chosen non-neighbor player. This rewiring policy vividly captures the simple motivation of leaving the majority to avoid being in the majority again. Therefore, we should understand that the networks are dynamic rather than static. However, one should note that this rewiring policy is not the policy used to generate SW networks [41]. In fact, SW networks with the same degree distribution can have distinct topological features if time evolution is considered [70]. Besides, local MG which relies on the local network structures, we also consider the global MG in which the majority and minority are determined by the whole population of the network, indicating that global information is available for everyone. In the global MG, the scores are calculated for all players according to their choices. After a result of global MG is reached, the players follow the same probability updating and network evolution policies to local MG as described above. Games are played iteratively in T rounds. We conduct numerical simulations to investigate the evolutionary dynamics of both local and global MG on different initial networks.

4. Simulation and Results

4.1. Simulation

In this section, we present the numerical simulation results and discussion. We consider a population with N = 101 [47,53,60,61,71,72] placed on three types of initial network topology: random networks, SF networks, and SW networks. To conduct numerical simulations, we consider combinations of different generating parameters (different p e r for ER networks (0.05, 0.075, and 0.1), different numbers of neighbors (5, 7, and 10) for SW networks, and different numbers of added nodes for values of the aversion coefficient α (0.9 for aversion, 1 for neural policy, 1.1 for stubbornness), rounds of games T (from 500 to 5000, with steps of one), and different score strategies (global, local cumulative, and local). The results share similar patterns in different settings. In the simulations, we focus on the performance measured as the score, the number fluctuation of players choosing side A measured as the standard deviation (due to the symmetry, it is the same as considering side B), and the evolutions of network topologies measured as the degree, clustering coefficient, betweenness centrality, and eigenvector centrality. All these network properties are investigated to measure the cooperations among the structured agents.

4.2. Results

To describe the score of the whole population, we calculated the average cumulative score S at time T as
S = 1 N i = 1 N t = 1 T s i t ,
where s i t is the score of player v i at time t. S indicates the cumulative wealth gained from all T rounds of game. In Figure 1, the average cumulative score S for the ER random networks for two strategies, without rewiring and with rewiring, are plotted in Figure 1a,b, respectively. The results are based on an ER network with p e r = 0.05 and 500 rounds. The results of the SW and SF networks demonstrate similar dynamics. In Figure 1a, the network is frozen and kept the same as in other existing research [60,61]. By incorporating varying networks [53] in Figure 1b, the network will apply the rewiring strategy for the players on the majority side. Thus, the network itself is evolving each time. As the results show, the global score strategy allows the slowest score to decrease, while on the contrary, the local score strategy achieves the fastest score decrease. The results also show that α = 1 and α = 1.1 output similar outcomes that are significantly different from α = 0.9 . In Figure 1b, when α = 1.1 , the average score is observed to increase, but this increase is not observed in Figure 1a. The two cases show that the network rewiring strategy can bring a higher average score. In other words, the rewiring strategy allows for the abandonment of existing disadvantaged cooperation to establish new cooperation, which can benefit the whole population by achieving an increasing average score.
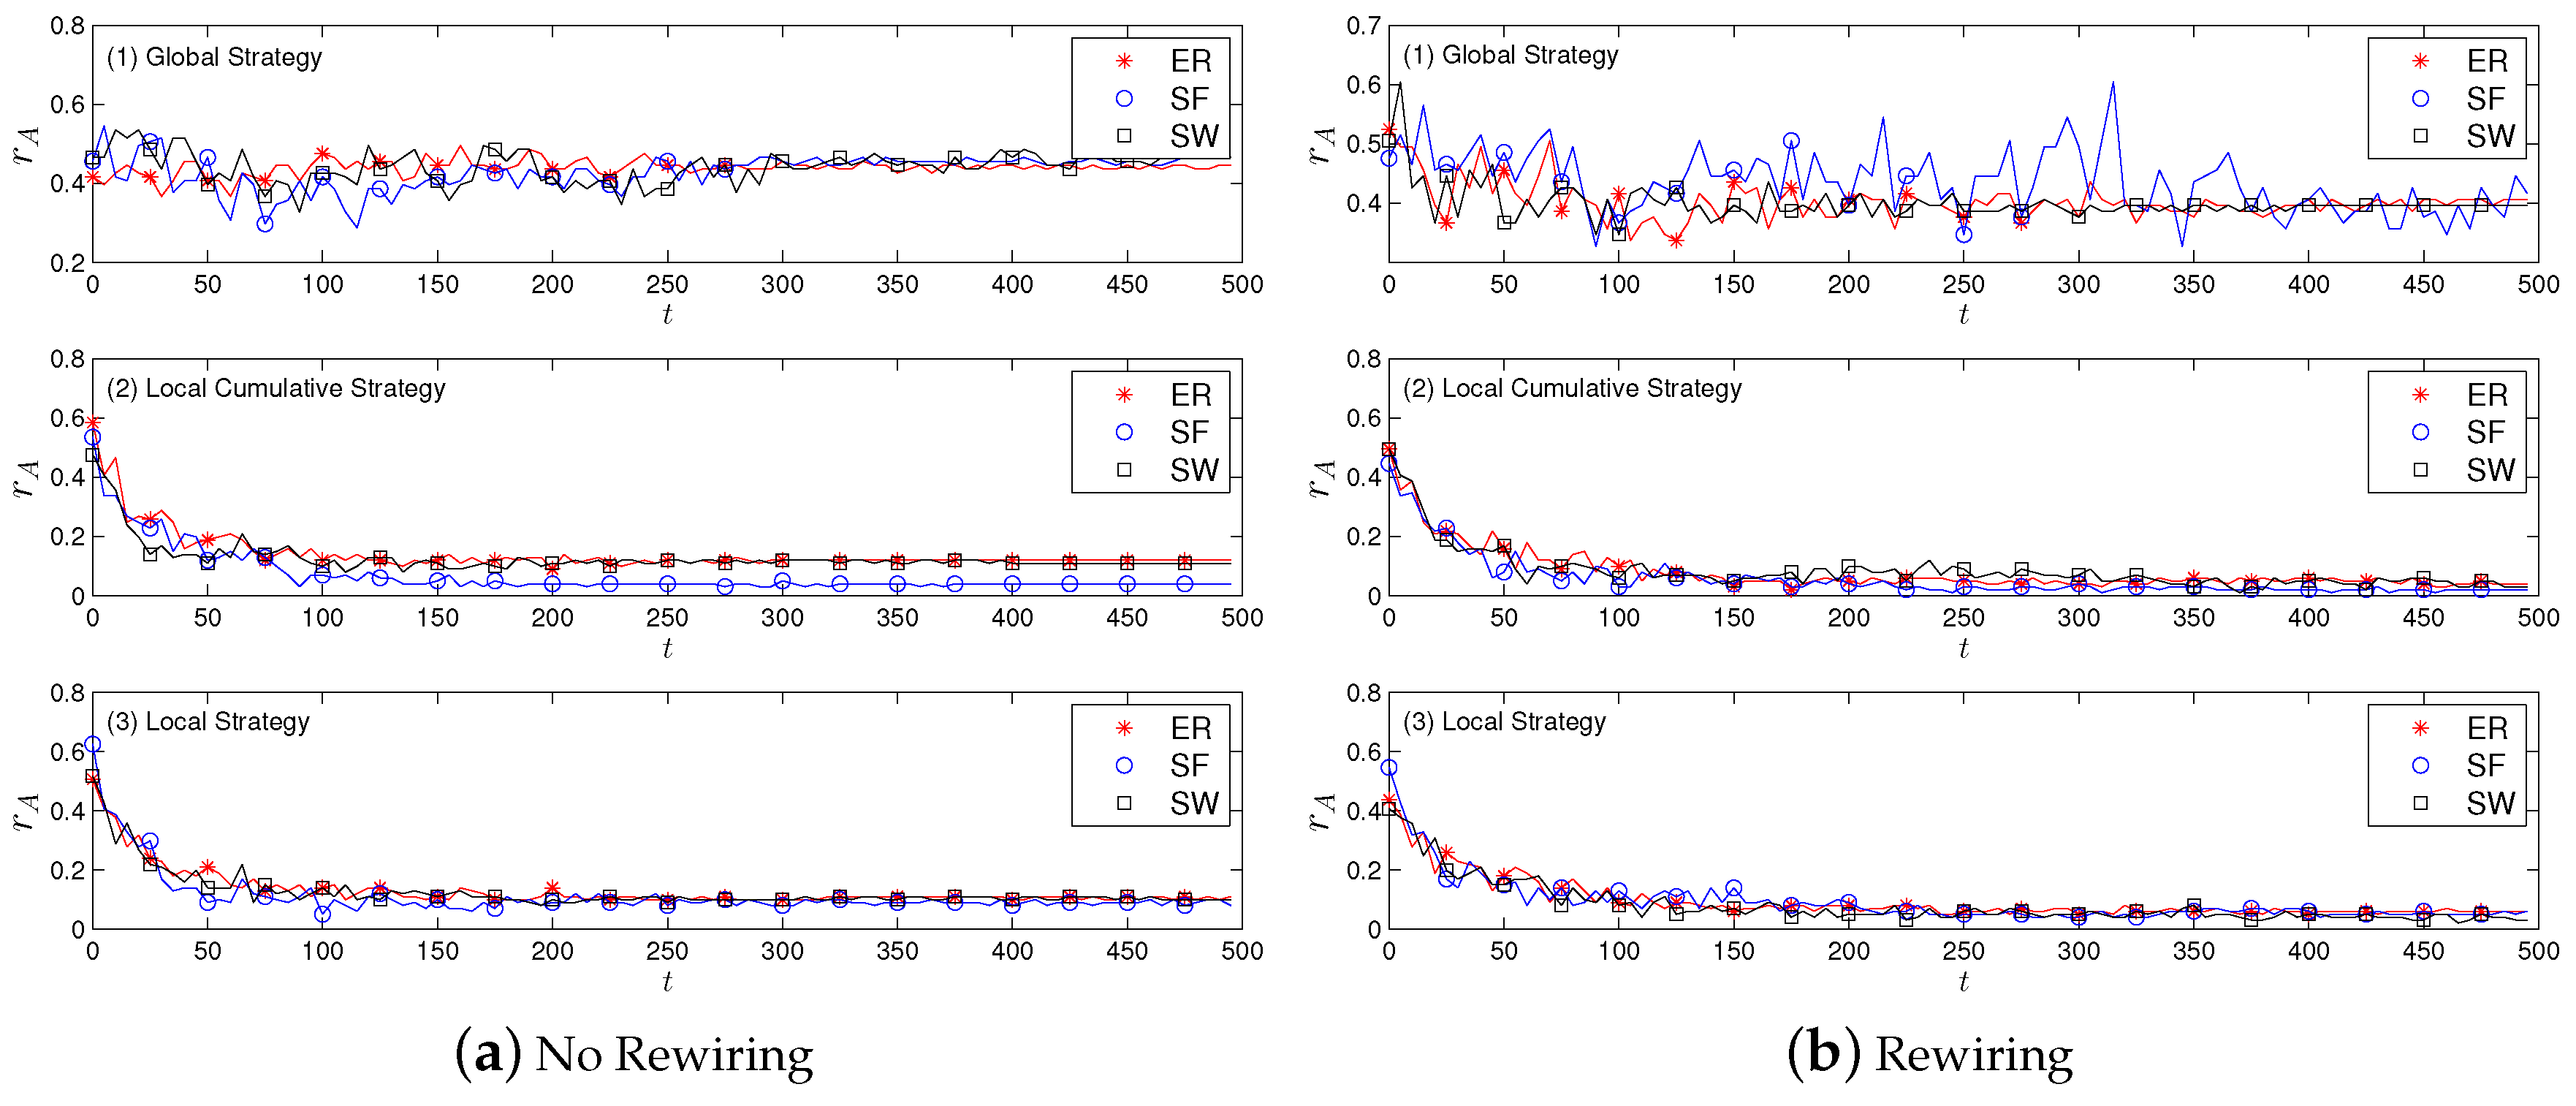
Figure 2 presents the ratios of players choosing side A, denoted as r A = A A N N . As previously mentioned, the study of A or B is symmetrical because r A + r B = 1 . This ratio value indicates the collective behavior of the population. If a huge fluctuation is observed, this indicates that the population is not close to equilibrium with stably divided agents for A or B. On the other hand, if the value is stable, then the population is reaching a stable situation without suffering from changes to the majority and minority. In Figure 2a, for the global score strategy, there are fluctuations within the first 300 rounds. After that, the ratio remains stable around a value of 0.45 for all initial networks. In Figure 2b, we see that for the global score strategy, there is a decrease in the ratio in the first 100 rounds, and a stable state of around 0.4 is reached for the ER and SW networks. However, for the SF network, the fluctuation is still obvious after 100 rounds. The three networks have similarly stable results for the two local score strategies. In the global score strategy, each player has the global information and is competing with the whole population. This allows for the emergence of stability in decision-making; in other words, the network moves closer to the expected 0.5 equilibrium state. For the local score strategies, each player only has limited local information and makes decisions only based on local limited information without ideas about the whole network. It is possible that the local majority might actually be the global minority; in this case, local players change policy only based on local observations. The results show that this limited local information could lead to global imbalance in the population, thus collective herding is possible. In our case, as shown in Figure 2a,b, most individuals chose B. Thus, the local score strategy did not promote score or global balance.
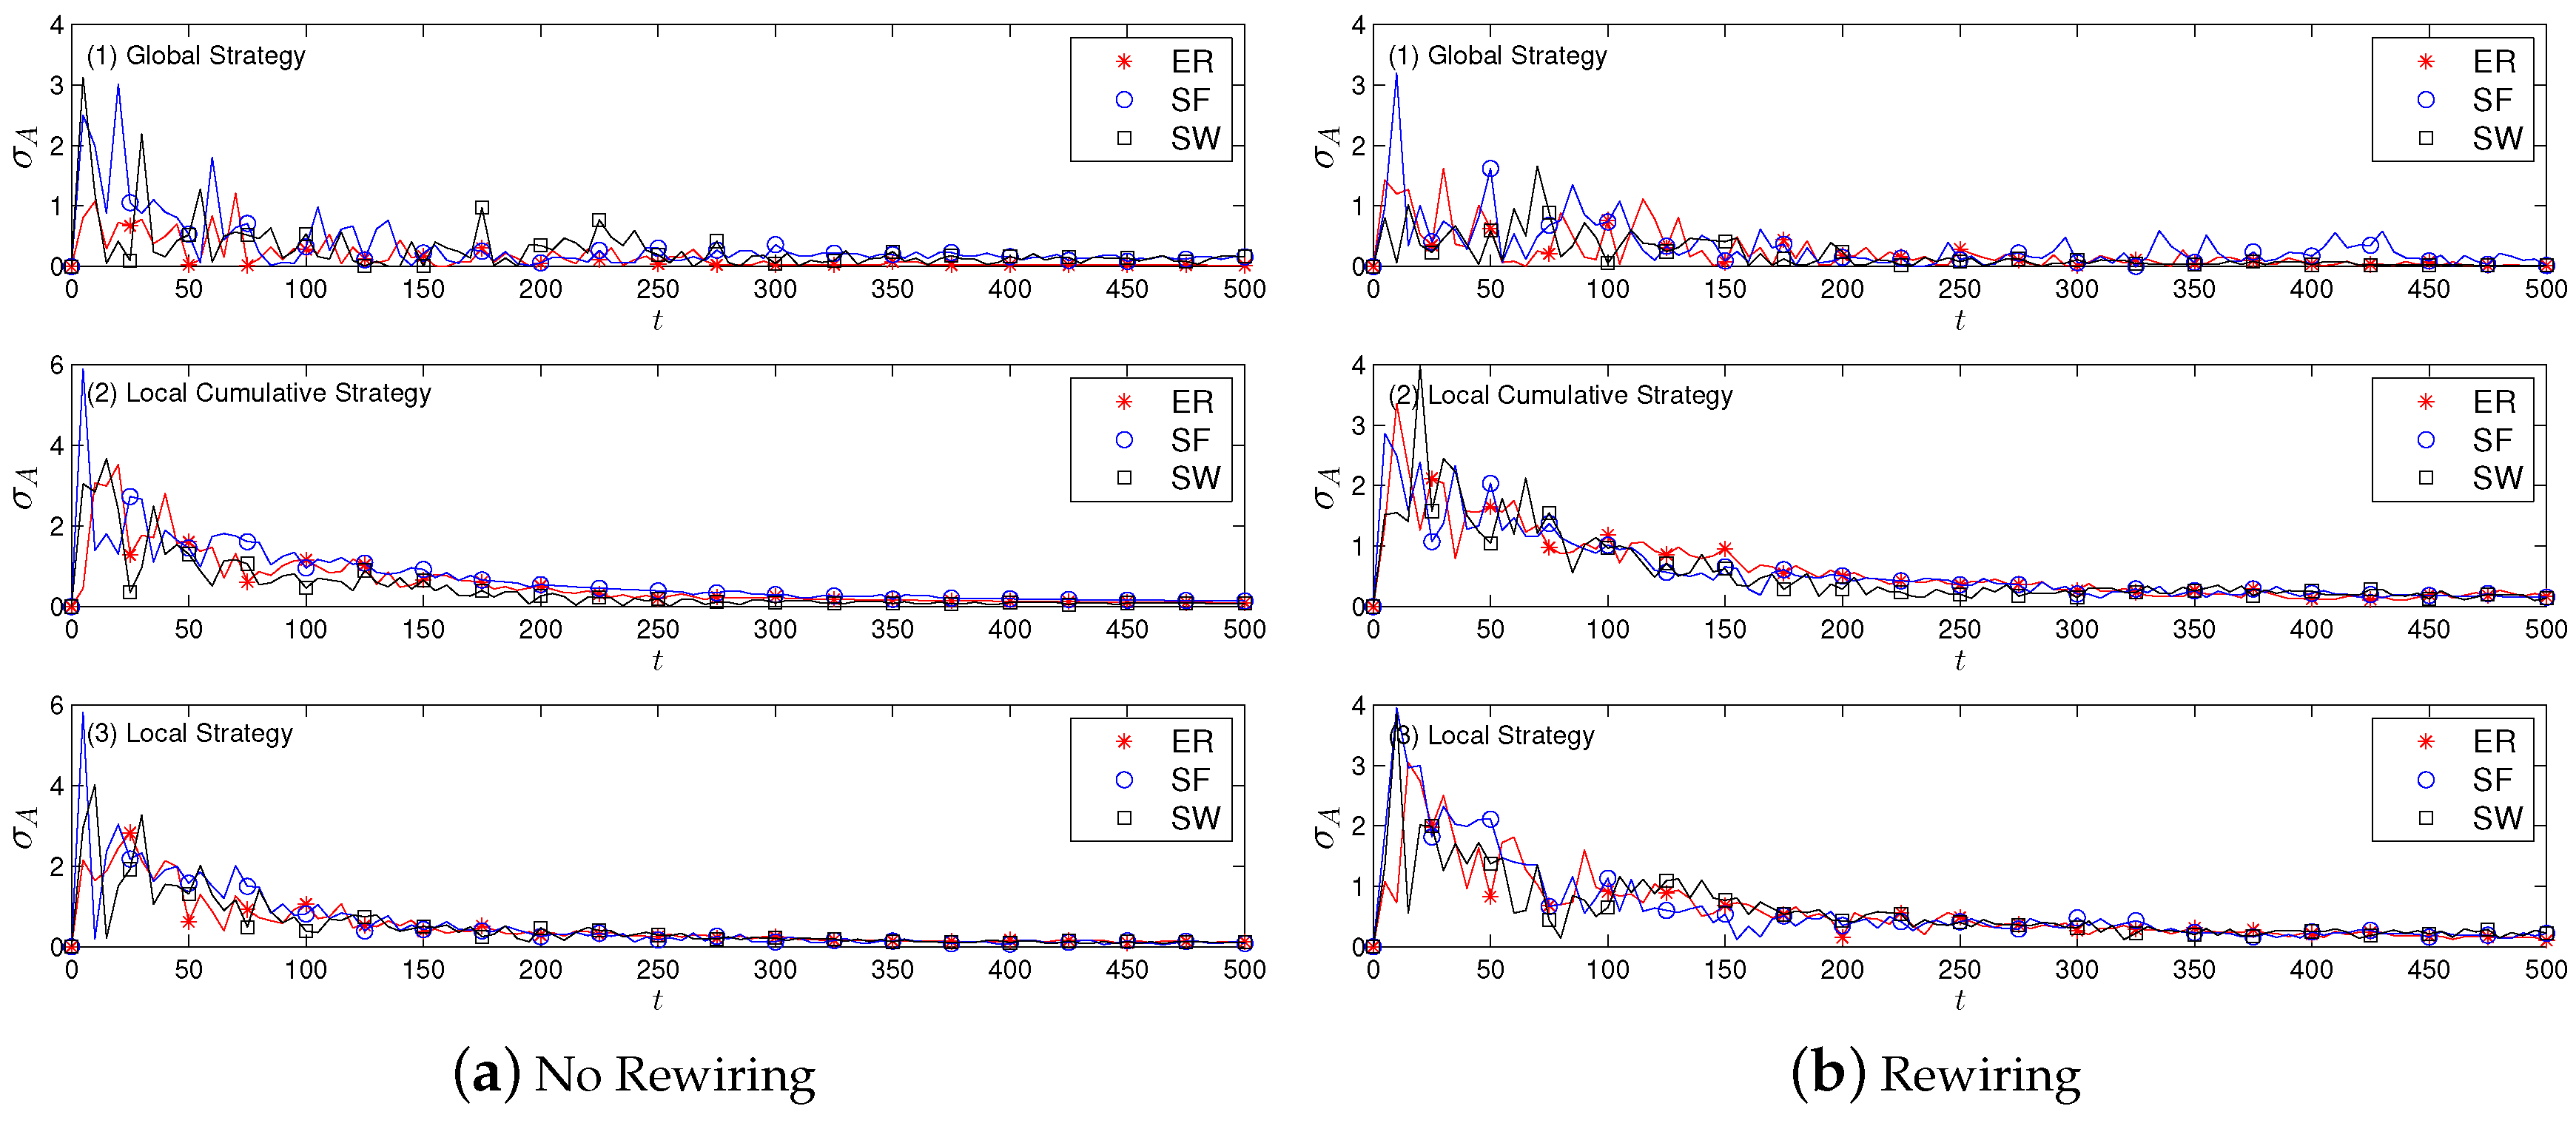
From another perspective, to investigate the changes in the number of agents that choose a certain side, we plotted the standard deviation σ A of A in Figure 3 for the global strategy, local cumulative strategy, and local strategy, respectively. Thanks to the symmetry, we only needed to study the case of side A. In the figure, we see that all curves have similar shapes. This shows that the differences in score strategies and network topologies have little influence on the standard deviation. In the beginning, there is a noticeable fluctuation, and soon, the curves decrease steadily. This phenomenon indicates that the number of players choosing A is becoming stable and an equilibrium is approached in the long run. In other words, it is possible for the players to reach a stable state after rounds of evolution in which the population becomes synchronized in decision-making with fewer fluctuations.
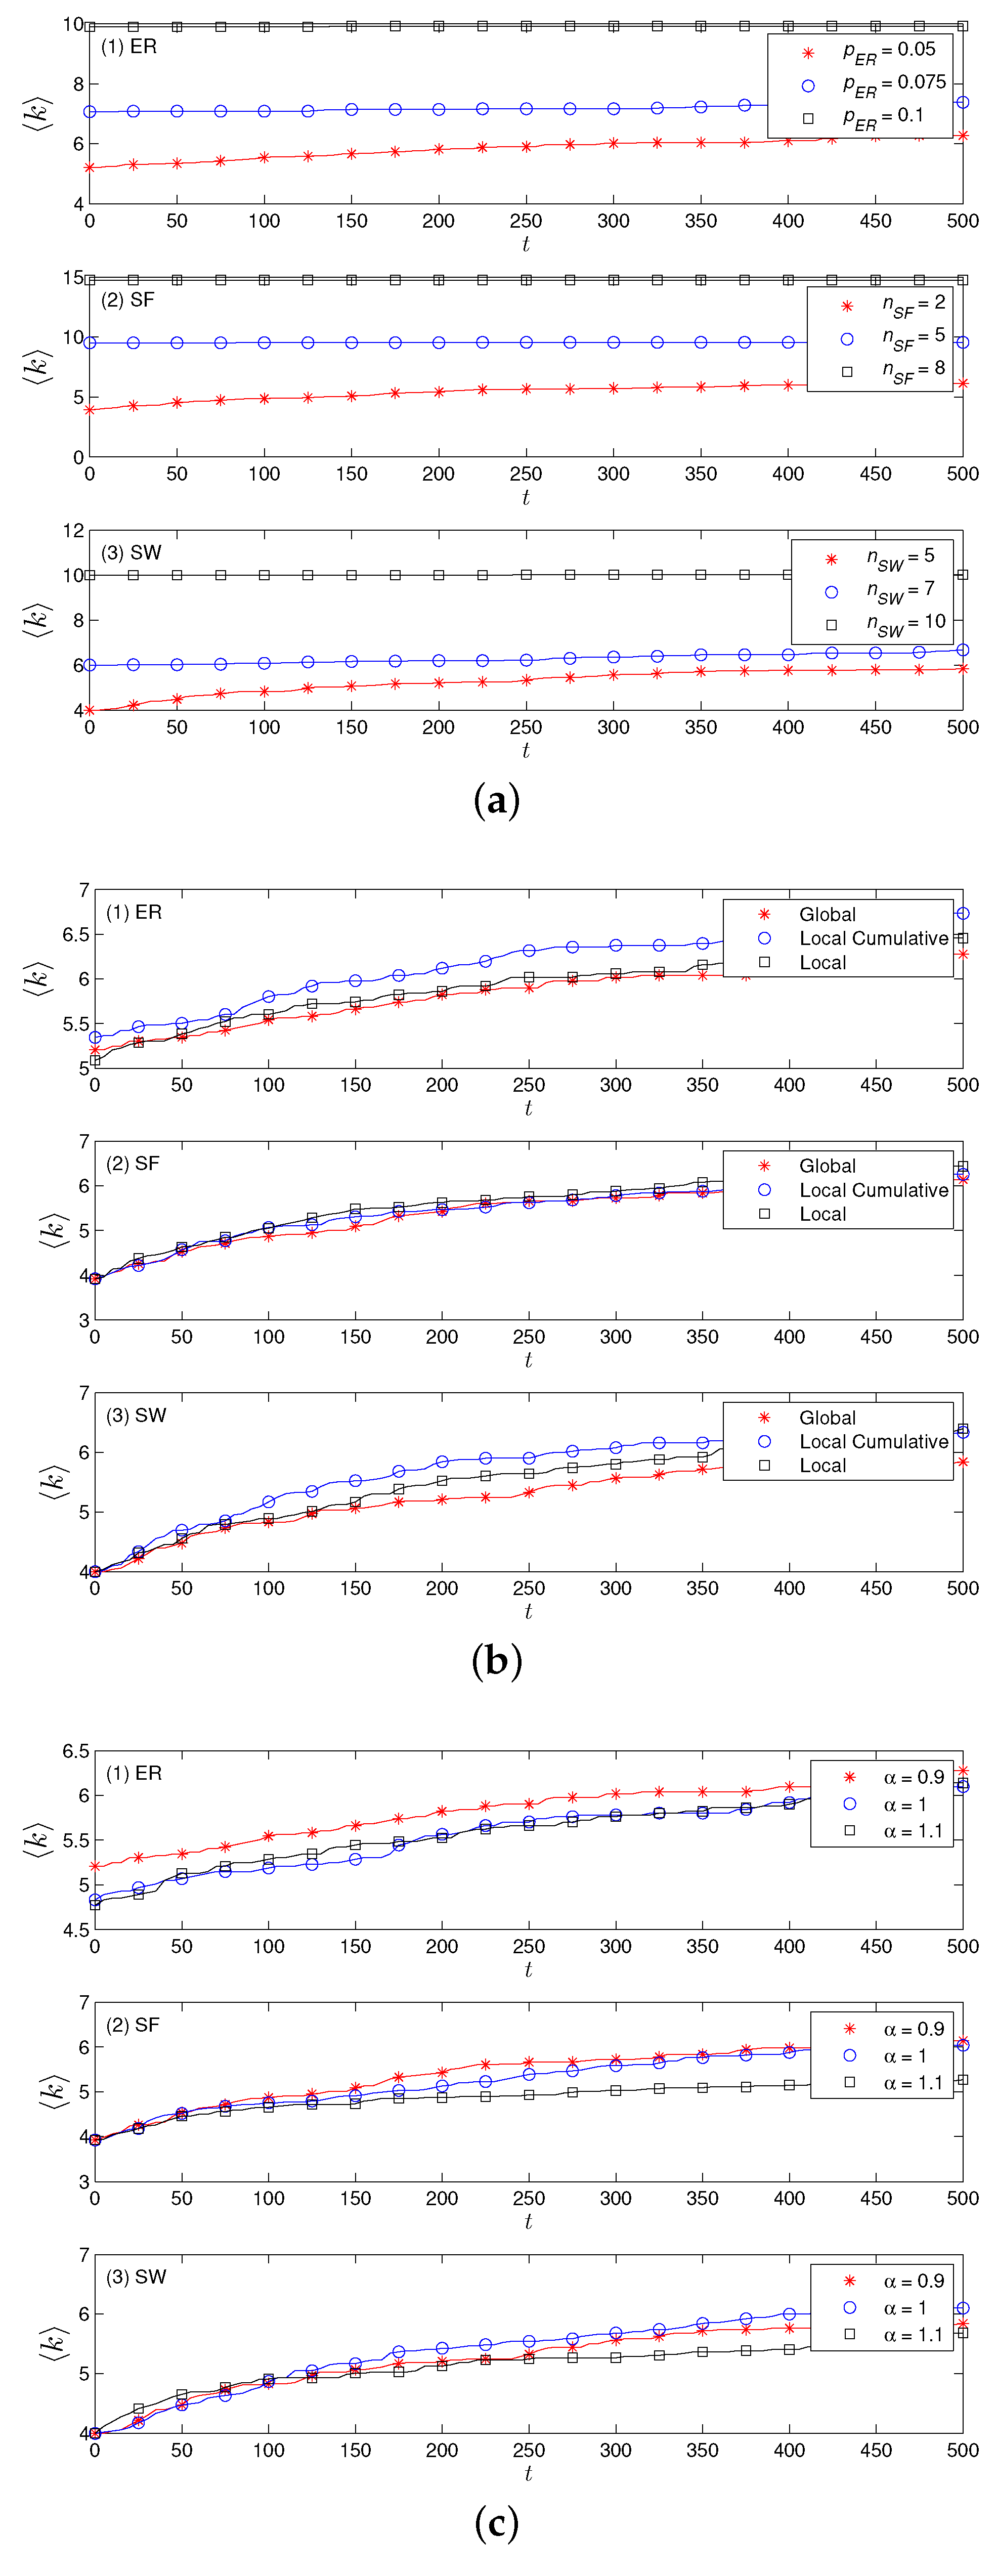
Now, for the rewiring cases, we focus on the evolution of the network by looking into how the topological properties evolve over time. The node degree is a direct indication of the cooperation level for a structured population. The cooperation level is positively related to the degree density or average degree for a population with a fixed size. When a new cooperation relationship is established, edges are created to link players. When a cooperation relationship ends, the corresponding edge is canceled. In Figure 4a, the average degree k is plotted for different initial settings of three types of network. As shown, given a higher initial k , the network can maintain a high level of k , or k can increase from a lower level of k . This means that competitive decision-making can improve the network to evolve into a state with a higher level of k for poor initial starts. In Figure 4b, the curves show how the average degree k evolves under different score strategies in different network types. The local cumulated score strategy has the highest k in ER and SW, while the steadily increasing trends for all cases in the SF network are similar. Figure 4c shows how k evolves for different punishment coefficients α . We can see that for the ER network, a smaller α = 0.9 can bring a slightly larger k ; however, the increasing trends are the same for all score strategies. For SF and SW, k is larger for α = 0.9 and α = 1 than α = 1.1 , which means that stubbornness in decision-making leads to poor k ; in other words, an appropriate adjustment introduced by lower α can improve k .
The rewiring might introduce to isolated players that the compensation process to link isolated players is beneficial to the increase of k . When k reaches a certain level, isolated players are rarely found. Thus, the rewiring can change the distribution degree among players but will not contribute to a greater degree. The different score strategies and different levels of punishment are not found to promote cooperation in three types of network.
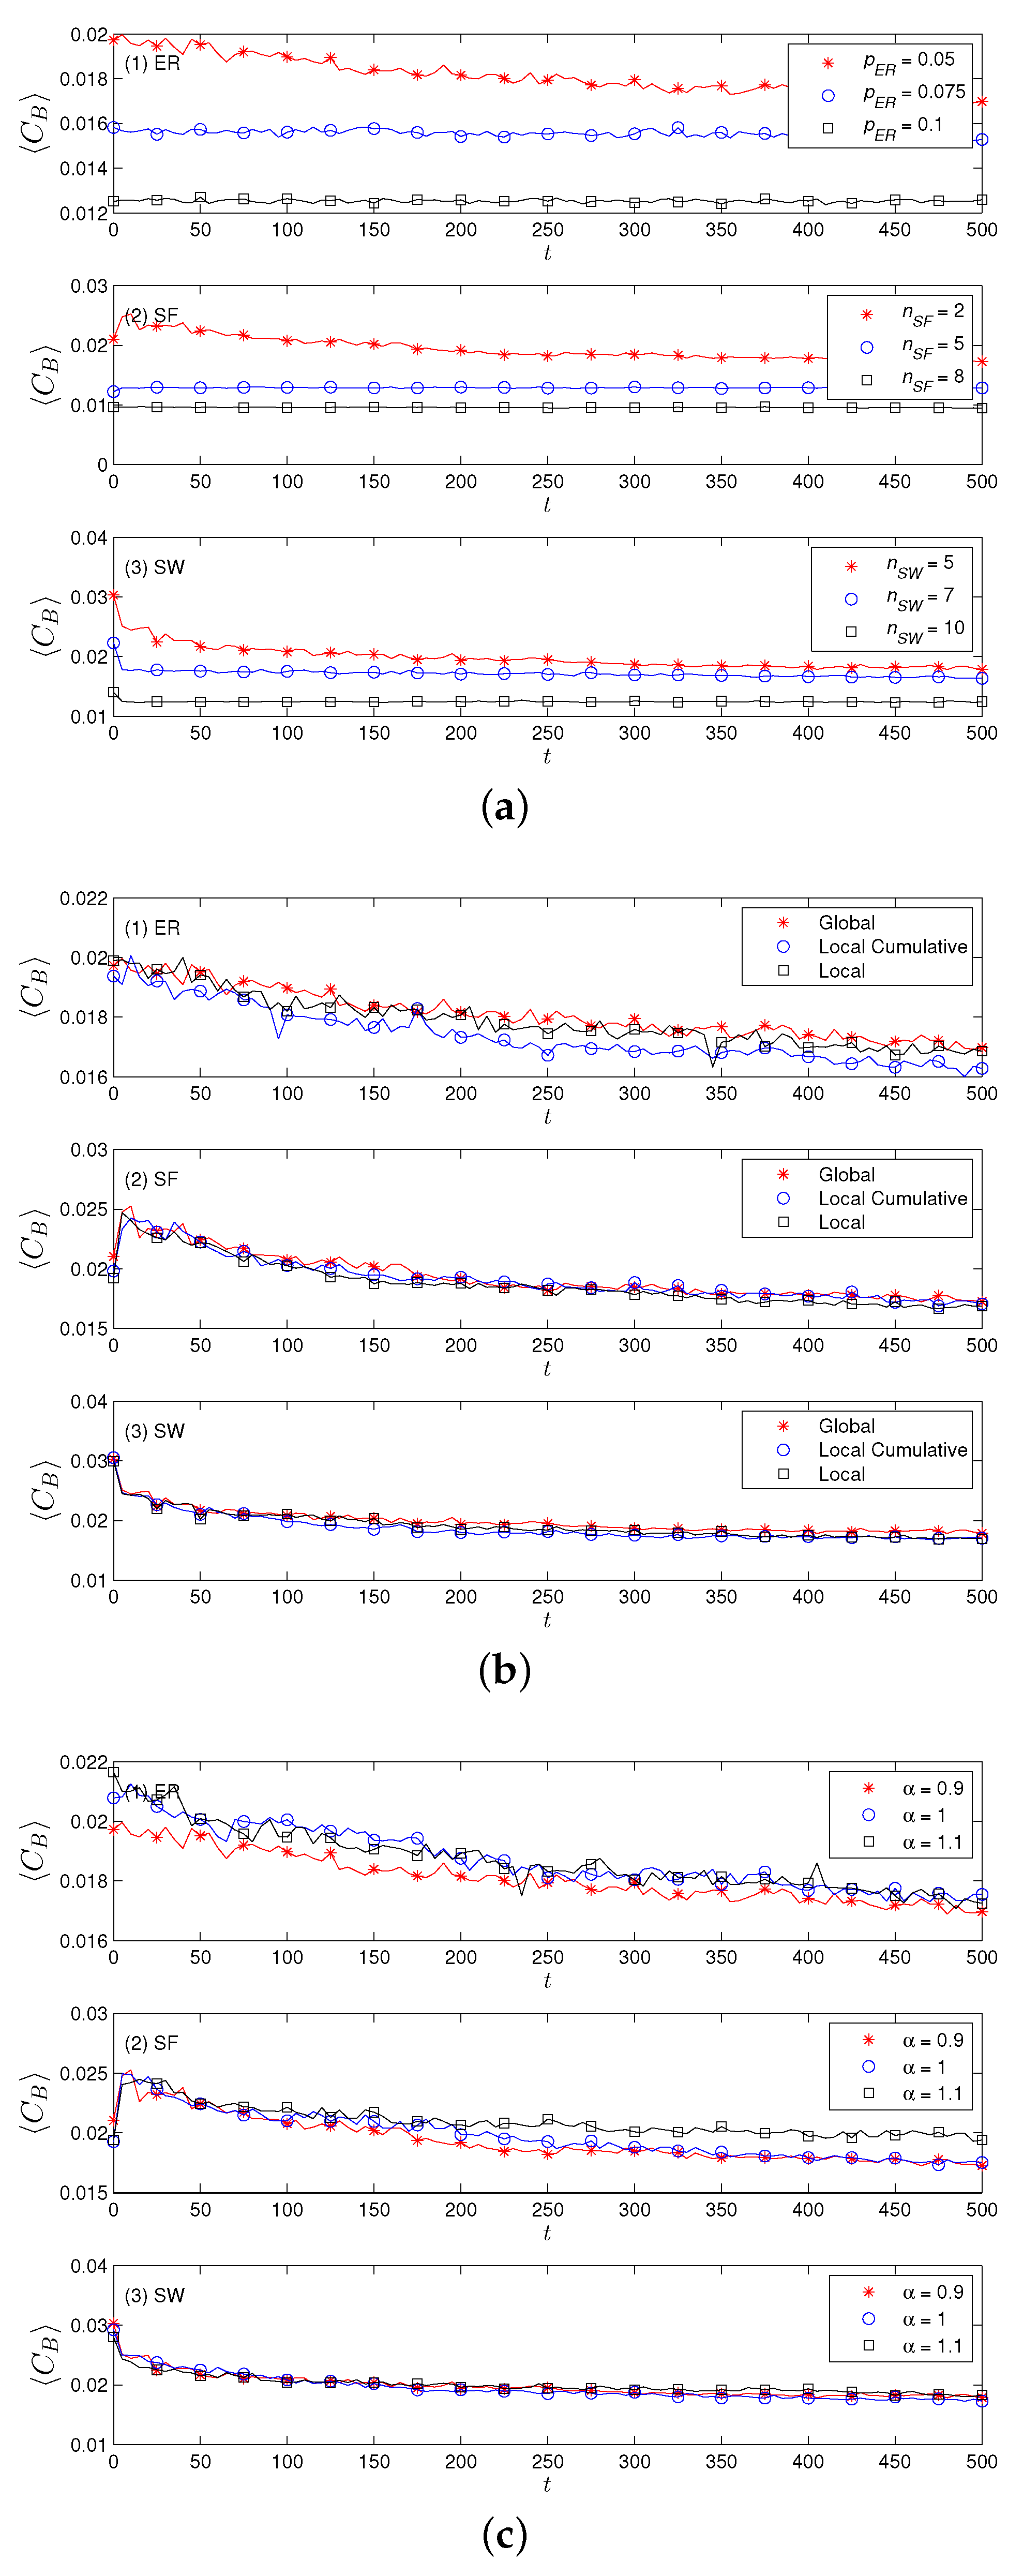
The betweenness centrality C i describes the global importance for a given player v i . In Figure 5a–c, the evolution of the average betweenness centrality C B of all networks is plotted. A lower C B indicates that less players act as intermediates. As shown, C B decreases in all cases for the three types of network, score policies, and punishment levels. This significant decrease indicates that the players are becoming less important for the whole structured population. After several rounds of evolution, C B becomes flat in a stable system.
We also investigated the changes in the average eigenvector centrality C E for all setups in Figure 6. C E depends on the adjacency matrix. We see that there was no significant change in C E after the beginning of the small fluctuations for all three types of network. C E quantifies the influence that emerged through cooperation among players in the structure population. The stable C E with less fluctuations indicates a tendency for stability in the whole population. For rewiring cases, it is possible to adjust cooperation at the first stage in which C E experiences changes and for overall trends to be stable in the long run.
For a structured population, the average clustering coefficient C C describes the average degree of completeness for all players. When all players have relatively complete environments, the network shows a higher C C indicating higher cooperation among the population. In Figure 7, the C C values for all cases are plotted. The results show that the ER network has significantly larger fluctuation compared to the SF and SW networks in all cases. A small and stable C C indicates that the network has a low level of embeddedness, and the evolution has little impact on the overall cooperation among the population. More results of large populations are available in Supplementary Materials.

5. Conclusions

In this work, we presented an evolutionary minority game on ANs to study the dynamics of cooperation. In our model, players are populated on structured networks interacting with each other. In a scenario of binary decision-making, players try to be on the minority side to gain scores. The binary decision-making manner of the players is modeled as a minority game in two cases, in which they are limited to local information or share common global information, respectively. In our model, players adjust their decision preference by dynamically adjusting the decision probability according to the outcome of a minority game. The decision also leads to possible edge rewiring, which allows for the evolving of the network topology. The model was simulated extensively in networks such as random networks, SW networks, and SF networks in various settings. The network properties, such as the degree, clustering coefficient, and centrality, were investigated. Different topologic networks (ER, SF, and SW) demonstrated different dynamics; however, different settings for the same network showed similar behaviors. For most cases, the network rewiring strategy led to a higher average score. The population choosing one certain side remained stable in ER and SW networks. The results indicate that ER networks and SW networks behave similarly in balanced side choosing and the deviation is small and stable. However, for SF networks, the global score strategy allows the emergence of stability in decision-making, and local score strategies lead to extreme imbalance in the population. The results show that even with poor initial starts, competitive decision-making can improve the network into a state with a higher level of average degree. In other words, the cooperation is improved. However, stubbornness in decision-making leads to poor situations in which cooperation is discouraged. Though the model proposed in this study is simple yet stylized, it captures the inter influences of competitive decision-making and AN dynamics. This study contributes to the literature of the minority game, the evolutionary game played in networks, and cooperation. However, there are limitations in the current work. For simplicity, we only considered the local information of immediate neighbors with a distance of one. However, this can be relaxed to other distances to see how wider topologies influence the game results. On the other hand, besides the degree, the decision balance, and the score, possible new measurements of cooperation can be introduced to model the cooperation level in evolving games. In the current model, the global and local score strategies are different and their results cannot be directly compared. Possible modifications might lead to a normalized framework in which the scores are directly comparable. Also, in line with the Deffuant model of opinion dynamics [13,14], we can model the establishing of cooperation in a similar manner. That is, the linked two players can form a cooperation only if their decisions or opinions are above a certain threshold. In this work, the decision is binary, regardless of the thresholds of certain decision factors. It would be interesting to further study the cooperation of networks taking the thresholds into consideration. These interesting extensions are beyond the scope of our present work. We hope that this work can stimulate and inspire interested scholars to further explore this line of study of using the minority game to model the cooperation in structured systems.

Supplementary Materials

Additional results are available online at https://www.mdpi.com/2071-1050/10/12/4746/s1.

Author Contributions

Conceptualization: X.-J.Z. and Y.T.; Data Curation: Y.T. and W.-J.W.; Formal Analysis: X.-J.Z., Y.T. and W.-J.W.; Funding Acquisition: Y.T.; Methodology: Y.T. and Y.-C.Z.; Writing—Original Draft Preparation: X.-J.Z., Y.T., J.X., and W.-J.W.; Writing—Review & Editing: X.-J.Z., Y.T., J.X., W.-J.W., Y.-C.Z.

Funding

This research was funded by National Natural Science Foundation of China grant number 71872027 And The APC was funded by National Natural Science Foundation of China grant number 71872027.

Acknowledgments

The authors appreciate the valuable advices of all three anonymous reviewers and one editor which greatly improved the quality of this work. The authors also thank the financial support from National Natural Science Foundation of China grant number 71872027.

Conflicts of Interest

The authors declare no conflicts of interest.

References

  1. Eguíluz, V.M.; Zimmermann, M.G.; Conde, C.J.C.; Miguel, M.S. Cooperation and the Emergence of Role Differentiation in the Dynamics of Social Networks. Am. J. Sociol. 2005, 110, 977–1008. [Google Scholar] [CrossRef] [Green Version]
  2. Gnyawali, D.R.; Charleton, T.R. Nuances in the Interplay of Competition and Cooperation: Towards a Theory of Coopetition. J. Manag. 2018, 44, 2511–2534. [Google Scholar] [CrossRef]
  3. Hauert, C.; Doebeli, M. Spatial structure often inhibits the evolution of cooperation in the snowdrift game. Nature 2004, 428, 643–646. [Google Scholar] [CrossRef] [PubMed]
  4. Hauge, K.E.; Brekke, K.A.; Nyborg, K.; Lind, J.T. Sustaining cooperation through self-sorting: The good, the bad, and the conditional. Proc. Natl. Acad. Sci. USA 2018. [Google Scholar] [CrossRef] [PubMed]
  5. Phelps, C.C. A Longitudinal Study of the Influence of Alliance Network Structure and Composition on Firm Exploratory Innovation. Acad. Manag. J. 2010, 53, 890–913. [Google Scholar] [CrossRef]
  6. Gulati, R. Network location and learning: The influence of network resources and firm capabilities on alliance formation. Strateg. Manag. J. 1999, 20, 397–420. [Google Scholar] [CrossRef]
  7. Wassmer, U. Alliance Portfolios: A Review and Research Agenda. J. Manag. 2010, 36, 141–171. [Google Scholar] [CrossRef]
  8. Helen, L.; Kerry, B.; Lisa, B.; Caroline, B.; Keith, T. Improving Employees’ Work-Life Balance in the Construction Industry: Project Alliance Case Study. J. Constr. Eng. Manag. 2007, 133, 807–815. [Google Scholar]
  9. Dovev, L. Alliance portfolios and firm performance: A study of value creation and appropriation in the U.S. software industry. Strateg. Manag. J. 2007, 28, 1187–1212. [Google Scholar]
  10. Anthony, G.; Beamish, P.W. The effect of alliance network diversity on multinational enterprise performance. Strateg. Manag. J. 2005, 26, 333–354. [Google Scholar]
  11. Cattani, G.; Ferriani, S. A Core/Periphery Perspective on Individual Creative Performance: Social Networks and Cinematic Achievements in the Hollywood Film Industry. Organ. Sci. 2008, 19, 824–844. [Google Scholar] [CrossRef] [Green Version]
  12. Gracia-Lázaro, C.; Ferrer, A.; Ruiz, G.; Tarancón, A.; Cuesta, J.A.; Sánchez, A.; Moreno, Y. Heterogeneous networks do not promote cooperation when humans play a Prisoner’s Dilemma. Proc. Natl. Acad. Sci. USA 2012, 109, 12922–12926. [Google Scholar] [CrossRef] [PubMed]
  13. Deffuant, G.; Neau, D.; Amblard, F.; Weisbuch, G. Mixing beliefs among interacting agents. Adv. Complex Syst. 2000, 3, 87–98. [Google Scholar] [CrossRef]
  14. Weisbuch, G.; Deffuant, G.; Amblard, F.; Nadal, J.P. Meet, discuss, and segregate! Complexity 2002, 7, 55–63. [Google Scholar] [CrossRef] [Green Version]
  15. Shang, Y. Deffuant model with general opinion distributions: First impression and critical confidence bound. Complexity 2013, 19, 38–49. [Google Scholar] [CrossRef]
  16. Shang, Y. Deffuant model of opinion formation in one-dimensional multiplex networks. J. Phys. A Math. Theor. 2015, 48, 395101. [Google Scholar] [CrossRef]
  17. Hanaki, N.; Peterhansl, A.; Dodds, P.S.; Watts, D.J. Cooperation in evolving social networks. Manag. Sci. 2007, 53, 1036–1050. [Google Scholar] [CrossRef]
  18. Ohtsuki, H.; Hauert, C.; Lieberman, E.; Nowak, M.A. A simple rule for the evolution of cooperation on graphs and social networks. Nature 2006, 441, 502–505. [Google Scholar] [CrossRef] [Green Version]
  19. Shirado, H.; Christakis, N.A. Locally noisy autonomous agents improve global human coordination in network experiments. Nature 2017, 545, 370–374. [Google Scholar] [CrossRef] [Green Version]
  20. Rand, D.G.; Arbesman, S.; Christakis, N.A. Dynamic social networks promote cooperation in experiments with humans. Proc. Natl. Acad. Sci. USA 2011, 108, 19193–19198. [Google Scholar] [CrossRef] [Green Version]
  21. Stewart, A.J.; Parsons, T.L.; Plotkin, J.B. Evolutionary consequences of behavioral diversity. Proc. Natl. Acad. Sci. USA 2016, 113, E7003–E7009. [Google Scholar] [CrossRef] [PubMed] [Green Version]
  22. Sekara, V.; Stopczynski, A.; Lehmann, S. Fundamental structures of dynamic social networks. Proc. Natl. Acad. Sci. USA 2016, 113, 9977–9982. [Google Scholar] [CrossRef] [PubMed] [Green Version]
  23. Challet, D.; Zhang, Y.C. Emergence of cooperation and organization in an evolutionary game. Phys. A Stat. Mech. Its Appl. 1997, 246, 407–418. [Google Scholar] [CrossRef] [Green Version]
  24. Challet, D.; Marsili, M.; Zhang, Y.C. Minority Games: Interacting Agents in Financial Markets; Number 9780199686698 in OUP Catalogue; Oxford University Press: Oxford, UK, 2013. [Google Scholar]
  25. Shang, Y. Consensus on averager-copier-voter networks of moving dynamical agents. Chaos Interdiscip. J. Nonlinear Sci. 2017, 27, 023116. [Google Scholar] [CrossRef]
  26. Shang, Y. Hybrid consensus for averager–copier–voter networks with non-rational agents. Chaossolitons Fract. 2018, 110, 244–251. [Google Scholar] [CrossRef]
  27. Chesbrough, H.; Vanhaverbeke, W.; West, J. Open Innovation: Researching a New Paradigm; Oxford University Press: Oxford, UK, 2006. [Google Scholar]
  28. Li, W.; Xu, J.; Zheng, M. Green Governance: New Perspective from Open Innovation. Sustainability 2018, 10, 3845. [Google Scholar] [CrossRef]
  29. Yun, J.J.; Won, D.; Park, K. Dynamics from open innovation to evolutionary change. J. Open Innov. Technol. Mark. Complex. 2016, 2, 7. [Google Scholar] [CrossRef]
  30. Yun, J.J.; Jung, K.; Yigitcanlar, T. Open Innovation of James Watt and Steve Jobs: Insights for Sustainability of Economic Growth. Sustainability 2018, 10, 1553. [Google Scholar] [CrossRef] [Green Version]
  31. Yun, J.J.; Won, D.; Jeong, E.; Park, K.; Lee, D.; Yigitcanlar, T. Dismantling of the Inverted U-Curve of Open Innovation. Sustainability 2017, 9, 1423. [Google Scholar] [CrossRef]
  32. Yun, J.J. How do we conquer the growth limits of capitalism? Schumpeterian Dynamics of Open Innovation. J. Open Innov. Technol. Mark. Complex. 2015, 1, 17. [Google Scholar] [CrossRef]
  33. Arthur, W.B. Inductive Reasoning and Bounded Rationality. Am. Econ. Rev. 1994, 84, 406–411. [Google Scholar]
  34. Challet, D.; Marsili, M.; Zecchina, R. Statistical Mechanics of Systems with Heterogeneous Agents: Minority Games. Phys. Rev. Lett. 2000, 84, 1824–1827. [Google Scholar] [CrossRef] [PubMed] [Green Version]
  35. Kristoufek, L.; Vosvrda, M. Herding, minority game, market clearing and efficient markets in a simple spin model framework. Commun. Nonlinear Sci. Numer. Simul. 2018, 54, 148–155. [Google Scholar] [CrossRef] [Green Version]
  36. Zhang, J.Q.; Huang, Z.G.; Wu, Z.X.; Su, R.; Lai, Y.C. Controlling herding in minority game systems. Sci. Rep. 2016, 6, 20925. [Google Scholar] [CrossRef] [Green Version]
  37. Kutsuna, H.; Tagashira, S.; Fujita, S. A Fair and Efficient Congestion Control Scheme Based on Minority Game. In Proceedings of the 2006 14th IEEE International Conference on Networks, Singapore, 13–15 September 2006; Volume 1, pp. 1–6. [Google Scholar]
  38. Shafique, M.; Bauer, L.; Ahmed, W.; Henkel, J. Minority-Game-based resource allocation for run-time reconfigurable multi-core processors. In Proceedings of the 2011 Design, Automation Test in Europe, Grenoble, France, 14–18 March 2011; pp. 1–6. [Google Scholar]
  39. Elmachkour, M.; Sabir, E.; Kobbane, A.; Ben-Othman, J.; Koutbi, M.E. The greening of spectrum sensing: A minority game-based mechanism design. IEEE Commun. Mag. 2014, 52, 150–156. [Google Scholar] [CrossRef]
  40. Barabási, A.L.; Albert, R. Emergence of Scaling in Random Networks. Science 1999, 286, 509–512. [Google Scholar] [PubMed]
  41. Watts, D.J.; Strogatz, S.H. Collective dynamics of ‘small-world’ networks. Nature 1998, 393, 440–442. [Google Scholar] [CrossRef] [PubMed]
  42. Barabási, A.L.; Pósfai, M. Network Science, 1st ed.; Cambridge University Press: New York, NY, USA, 2016. [Google Scholar]
  43. Roca, C.P.; Sánchez, A.; Cuesta, J.A. Individual Strategy Update and Emergence of Cooperation in Social Networks. J. Math. Sociol. 2012, 36, 1–21. [Google Scholar] [CrossRef] [Green Version]
  44. Caridi, I.; Ceva, H. The Minority Game with interactions. Phys. A Stat. Mech. Its Appl. 2004, 339, 574–582. [Google Scholar] [CrossRef] [Green Version]
  45. Slanina, F. Social organization in the Minority Game model. Phys. A Stat. Mech. Its Appl. 2000, 286, 367–376. [Google Scholar] [CrossRef] [Green Version]
  46. Kalinowski, T.; Schulz, H.J.; Briese, M. Cooperation in the Minority Game with local information. Phys. A Stat. Mech. Its Appl. 2000, 277, 502–508. [Google Scholar] [CrossRef]
  47. Quan, H.J.; Wang, B.H.; Hui, P.; Luo, X.S. Self-segregation and enhanced cooperation in an evolving population through local information transmission. Phys. A Stat. Mech. Its Appl. 2003, 321, 300–308. [Google Scholar] [CrossRef]
  48. Lavička, H.; Slanina, F. Evolution of imitation networks in Minority Game model. Eur. Phys. J. B 2007, 56, 53–63. [Google Scholar] [CrossRef]
  49. Shang, L.; Wang, X.F. Evolutionary minority game on complex networks. Phys. A Stat. Mech. Its Appl. 2007, 377, 616–624. [Google Scholar] [CrossRef]
  50. Burgos, E.; Ceva, H.; Perazzo, R. The evolutionary minority game with local coordination. Phys. A Stat. Mech. Its Appl. 2004, 337, 635–644. [Google Scholar] [CrossRef] [Green Version]
  51. Paczuski, M.; Bassler, K.E.; Corral, A. Self-Organized Networks of Competing Boolean Agents. Phys. Rev. Lett. 2000, 84, 3185–3188. [Google Scholar] [CrossRef] [PubMed] [Green Version]
  52. Shang, L.; Wang, X.F. A modified evolutionary minority game with local imitation. Phys. A Stat. Mech. Its Appl. 2006, 361, 643–650. [Google Scholar] [CrossRef]
  53. Fagiolo, G.; Valente, M. Minority Games, Local Interactions, and Endogenous Networks. Comput. Econ. 2005, 25, 41–57. [Google Scholar] [CrossRef] [Green Version]
  54. Chen, S.H.; Gostoli, U. On the complexity of the El Farol Bar game: A sensitivity analysis. Evol. Intell. 2016, 9, 113–123. [Google Scholar] [CrossRef]
  55. Chen, S.H.; Gostoli, U. Coordination in the El Farol Bar problem: The role of social preferences and social networks. J. Econ. Interact. Coord. 2017, 12, 59–93. [Google Scholar] [CrossRef]
  56. Anghel, M.; Toroczkai, Z.; Bassler, K.E.; Korniss, G. Competition-Driven Network Dynamics: Emergence of a Scale-Free Leadership Structure and Collective Efficiency. Phys. Rev. Lett. 2004, 92, 058701. [Google Scholar] [CrossRef] [PubMed]
  57. Kirley, M. Evolutionary minority games with small-world interactions. Phys. A Stat. Mech. Its Appl. 2006, 365, 52–528. [Google Scholar] [CrossRef]
  58. Cajueiro, D.O.; Camargo, R.S.D. Minority game with local interactions due to the presence of herding behavior. Phys. Lett. A 2006, 355, 280–284. [Google Scholar] [CrossRef] [Green Version]
  59. Quan, H.J.; Zhu, C.Y. Behaviors of imitated agents in an evolutionary minority game on NW small world networks. Phys. Procedia 2010, 3, 1741–1745. [Google Scholar] [CrossRef]
  60. Mello, B.A.; Souza, V.M.; Cajueiro, D.O.; Andrade, R.F. Network evolution based on minority game with herding behavior. Eur. Phys. J. B 2010, 76, 147–156. [Google Scholar] [CrossRef]
  61. Nishimoto, K.; Tanev, I.; Shimohara, K. Proposal of a Network-Based Minority Game Model with Observation and Modification Processes. Int. J. Comput. Theory Eng. 2013, 5, 690. [Google Scholar] [CrossRef]
  62. Chen, J.; Quan, H. Effect of imitation in evolutionary minority game on small-world networks. Phys. A Stat. Mech. Its Appl. 2009, 388, 945–952. [Google Scholar] [CrossRef]
  63. Moelbert, S.; Rios, P.D.L. The local minority game. Phys. A Stat. Mech. Its Appl. 2002, 303, 217–225. [Google Scholar] [CrossRef] [Green Version]
  64. Gulati, R.; Nohria, N.; Zaheer, A. Strategic Networks. Strateg. Manag. J. 2000, 21, 203–215. [Google Scholar] [CrossRef]
  65. Ahuja, G. Collaboration Networks, Structural Holes, and Innovation: A Longitudinal Study. Adm. Sci. Q. 2000, 45, 425–455. [Google Scholar] [CrossRef]
  66. Baum, J.A.C.; Calabrese, T.; Silverman, B.S. Do not go it alone: Alliance network composition and startups’ performance in Canadian biotechnology. Strateg. Manag. J. 2000, 21, 267–294. [Google Scholar] [CrossRef]
  67. Bae, J.; Insead, M.G. Partner Substitutability, Alliance Network Structure, and Firm Profitability in the Telecommunications Industry. Acad. Manag. J. 2004, 47, 843–859. [Google Scholar] [CrossRef]
  68. Walker, G.; Kogut, B.; Shan, W. Social Capital, Structural Holes and the Formation of an Industry Network. Organ. Sci. 1997, 8, 109–125. [Google Scholar] [CrossRef]
  69. Castro, I.; Casanueva, C.; Galán, J.L. Dynamic evolution of alliance portfolios. Eur. Manag. J. 2014, 32, 423–433. [Google Scholar] [CrossRef]
  70. Shang, Y. Distinct Clusterings and Characteristic Path Lengths in Dynamic Small-World Networks with Identical Limit Degree Distribution. J. Stat. Phys. 2012, 149, 505–518. [Google Scholar] [CrossRef]
  71. Hart, M.; Jefferies, P.; Johnson, N.; Hui, P. Crowd–anticrowd theory of the minority game. Phys. A Stat. Mech. Its Appl. 2001, 298, 537–544. [Google Scholar] [CrossRef] [Green Version]
  72. Sasidevan, V. Effect of detailed information in the minority game: Optimality of 2-day memory and enhanced efficiency due to random exogenous data. J. Stat. Mech. Theory Exp. 2016, 2016, 073405. [Google Scholar] [CrossRef]
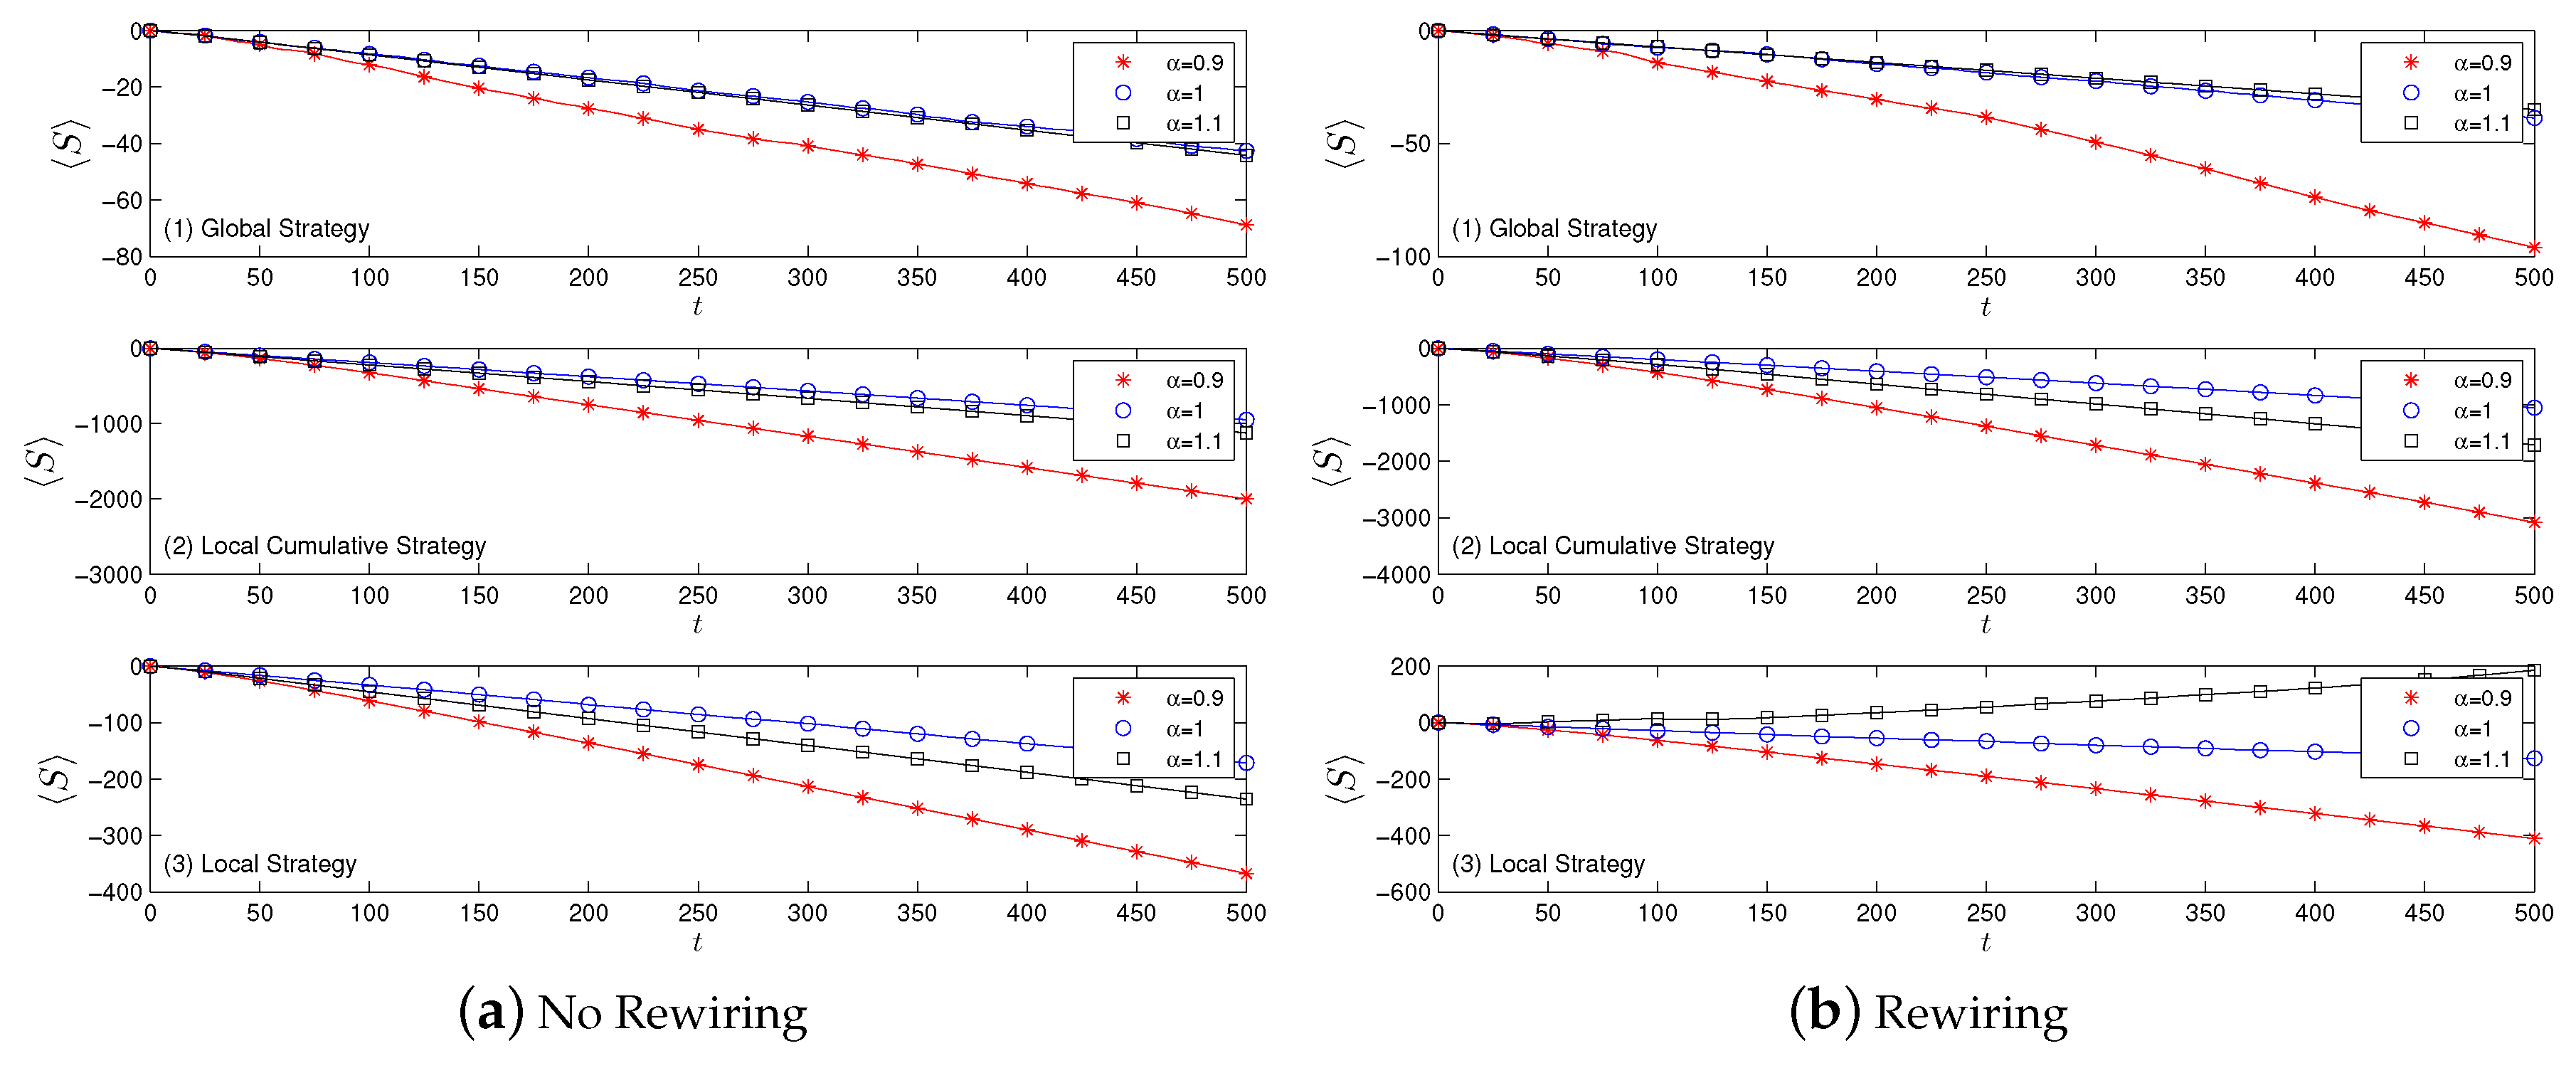
Figure 1. The average cumulative scores 〈S〉 of of all three score strategies without rewiring (a) and with rewiring (b). Different α values indicate the aversion coefficients. α = 0.9 means preferring to change the policy, while a value larger than one, such as α = 1.1, means stubbornness. Depicted here is based on the Erdős-Rényi (ER) random network. Similar patterns are observed in SW and SF networks. The top, middle, and bottom panels are the results of the global strategy, local cumulative strategy, and local strategy, respectively. Since the major side has more players which all get a score of −1, the values are negative. Steep slopes represent an imbalance between the two sides, resulting in lower values.
Sustainability 10 04746 g001
Figure 2. Evolution of rA, the ratio of players choosing A for the ER, SF, and SW networks, in cases both without rewiring (a) and with rewiring (b). Three different score strategies—global, local cumulative, and local—are considered in top, middle, and bottom graphs, respectively. As shown, global strategies can maintain a balance of two sides with high rA values of around 0.5; however, local strategies lead to imbalance with small values of rA which become stable gradually.
Sustainability 10 04746 g002
Figure 3. The standard deviation σA of the number of players choosing A without rewiring (a) and with rewiring (b). Three strategies of global, local cumulative, and local are considered in three networks of ER, SF, and SW. Eventually, the results become stable after a fluctuating period in all cases.
Sustainability 10 04746 g003
Figure 4. The average node degree k for different cases is plotted. (a) Different configurations of three networks—ER (top), SF (middle), and SW (bottom)—are considered. (b) Different score strategies—global, local cumulative, and local. (c) Different values of the aversion coefficient α .
Sustainability 10 04746 g004
Figure 5. Average betweenness centrality C B for different cases are plotted. (a) Different configurations of the three networks—ER (top), SF (middle), and SW (bottom)—are considered. (b) Different score strategies—global, local cumulative, and local. (c) Different values of the aversion coefficient α .
Sustainability 10 04746 g005
Figure 6. The average eigenvector centrality C E for different cases is plotted. (a) Different configurations of the three networks—ER (top), SF (middle), and SW (bottom)—are considered. (b) Different score strategies—global, local cumulative, and local. (c) Different values of the aversion coefficient α .
Sustainability 10 04746 g006
Figure 7. The average clustering coefficient C C for different cases is plotted. (a) Different configurations of the three networks—ER (top), SF (middle), and SW (bottom)—are considered. (b) Different score strategies—global, local cumulative, and local. (c) Different values of the aversion coefficient α .
Sustainability 10 04746 g007