Article

Optimal Time for Consumers to Purchase Electronic Products with Consideration of Consumer Value and Eco-Efficiency

Department of Industrial and Systems Engineering, Chung Yuan Christian University, Taoyuan City 32023, Taiwan
*
Authors to whom correspondence should be addressed.
Sustainability 2018, 10(12), 4664; https://doi.org/10.3390/su10124664
Submission received: 4 October 2018 / Revised: 4 November 2018 / Accepted: 4 December 2018 / Published: 7 December 2018
(This article belongs to the Section Sustainable Engineering and Science)

Abstract

:
In recent years, owing to the improvements in technologies and the rapid changes in market demands, the life-cycle of consumer electronic products has been shortened and new products are being released constantly. With rising environmental awareness, product value, and cost are not the only factors defining consumer value; the impact of the product to the environment has become another new factor to affect consumers purchase decisions. A key concept to transform unsustainable to sustainable development is eco-efficiency, a concept that uses less energy and resource to make a product, producing less waste and pollution. However, there has been very little discussion on how beneficial these environmentally friendly products actually are to the consumer. In view of this, the present study proposes a set of methods for consumer value and ecological benefit evaluation from the perspective of consumers. A model for determining the most suitable time to make a purchase is developed with the inclusion of the time factor, and the Technique for Order of Preference by Similarity to Ideal Solution (TOPSIS) is used to find the suggested order of purchase at different times on the model. Finally, factors such as different groups of consumers and different types of products are considered in investigating the most appropriate time to make a purchase under different circumstances. This study focused on notebook computers, which are having high variety and easily get obsolete. As for the investigation of different consumer groups, this study found that there is a relatively good product selection order of Ultrabooks for price-conscious and environmentally conscious consumer groups. Business Notebooks are the most suitable option for general consumer groups. Being able to know optimal time to purchase and to evaluate the product ecological benefit would be beneficial to both consumers and the environment nowadays.

1. Introduction

In the past forty years, the continuous development and breakthrough in technology has caused the surge in the popularity of consumer electronic devices (CEDs) for communication, entertainment, and personal usage. From the 1980s until now, more than 900 million desktop computers and laptops were sold in the United States [1]. Due to the massive production and usage of these CEDs, environmental problems have grown along and contributed to the global climate change [2]. In recent years, government agencies, manufacturers, and consumers have attempted to use green design concepts and recycled materials for manufacturing products. In addition, they have attempted to achieve the reduction in the products energy consumption with the aim of increasing their reusability and improving recycling methods, which consequently will reduce the harm caused by these devices to the environment. When choosing between products with the same function, consumers have started to lean toward products that have a lower environmental impact [3]. However, the real benefits of green product labelling to the consumer value are the major factor affecting consumer purchase decisions.
Consumer value has great influence on the consumer purchase decision. Tasci [4] proposed that consumer value is an intangible asset in the field of marketing and reflects the consumers’ perspective, attitudes, and desires. Values can be separated into two correlated but different types of values. The first type is brand value, which attracts or drives consumer desire to purchase. The second type is perceived value, which is simply defined as the ratio between the consumers’ perceived benefits and the cost. Brand value influences the consumers’ subjective preference. Since a consumer already has a preconceived notion for a particular brand, even if the brand product is not essentially different to other brand products, the consumer will still be willing to pay a higher price for his preferred brand product. Similarly, if the prices are the same, the consumer will choose a product from his preferred brand. Schult and Barnes [5] considered that brand value refers to the price of the brand when traded in a capitalist market. Zeithaml [6] defined the perceived value as “the consumers’ overall assessment of the utility of a product based on a perception of what is received over what is given.” Consumers’ value is derived from the perception of what is received, such as quality, function, or personal values, and other positive perceptions. It is also derived from the perception of what is given, such as money, time, energy, and other negative perceptions.
In the rapidly changing environment of CEDs, the decisions faced by consumers are complicated and diverse. These decisions are not simply resolved by using just one set of criteria from the various existing criteria such as product function, specification, price, time of release, brand, and energy efficiency. In fact, all the evaluation criteria are required for the consideration of a single decision problem to make the most appropriate decision. The Multiple Criteria Decision Making (MCDM) is one of the most commonly used methods for such decision-making problems [7]. The Technique for Order Preference by Similarity to Ideal Solution (TOPSIS) is a multi-attribute decision-making method used in situation determination. Deng et al. [8] used TOPSIS as an evaluation method that has simple principles with easy calculations. Abo-Sinna and Amer [9] pointed the advantages of TOPSIS, such as it can provide effective solutions for compromised solution problems; it is an easy to use method; and it is intuitive and easily accepted by decision makers. Shih et al. [10] thought that the TOPSIS evaluation method is the clearest and most intuitive decision-making method amongst the various multi-attribute decision-making methods.
Most previous studies on consumer product selection [11,12,13] have used value-engineering methods to evaluate the value of products. However, over time, the time to market of new-products was shortened and the release time for product replacements was accelerated [14]; thus, considering only the function and costs of the product itself in the calculation is insufficient to satisfy the demands of consumer selection. Effective references for consumer purchase can only be provided by comparing products released at different times and by considering more factors. Hence, this study is different from previous studies in that it adds the factors of time and brand to create a set of value evaluation models as a function of time to provide a weighted evaluation method for consumer purchasing decisions. This will allow the consumer to understand when is the best time to make a purchase and to gain the greatest value. As environmental awareness has risen in the past few years, many manufacturers have released low-energy-consumption and environmentally friendly products one after another [15]. However, since energy-efficient products provide great value to consumers and there are no standard evaluation methods, this study will include environmental factors into the consumer value evaluation model and create an evaluation model function with ecological and time-related factors in order to obtain the eco-efficacy of products purchased at different times. Finally, TOPSIS is used to find the suggested purchasing order of the products to provide a reference to the consumer for purchasing at different times. The structure of this study is described in Figure 1.
This paper is structured as follows. Besides this introduction, Section 2 discusses the development of a proposed assessment model. Section 3 illustrates the proposed assessment model using real data collected regarding laptop computers. Finally, Section 4 gives a conclusion with suggestions for future research.

2. Methodology

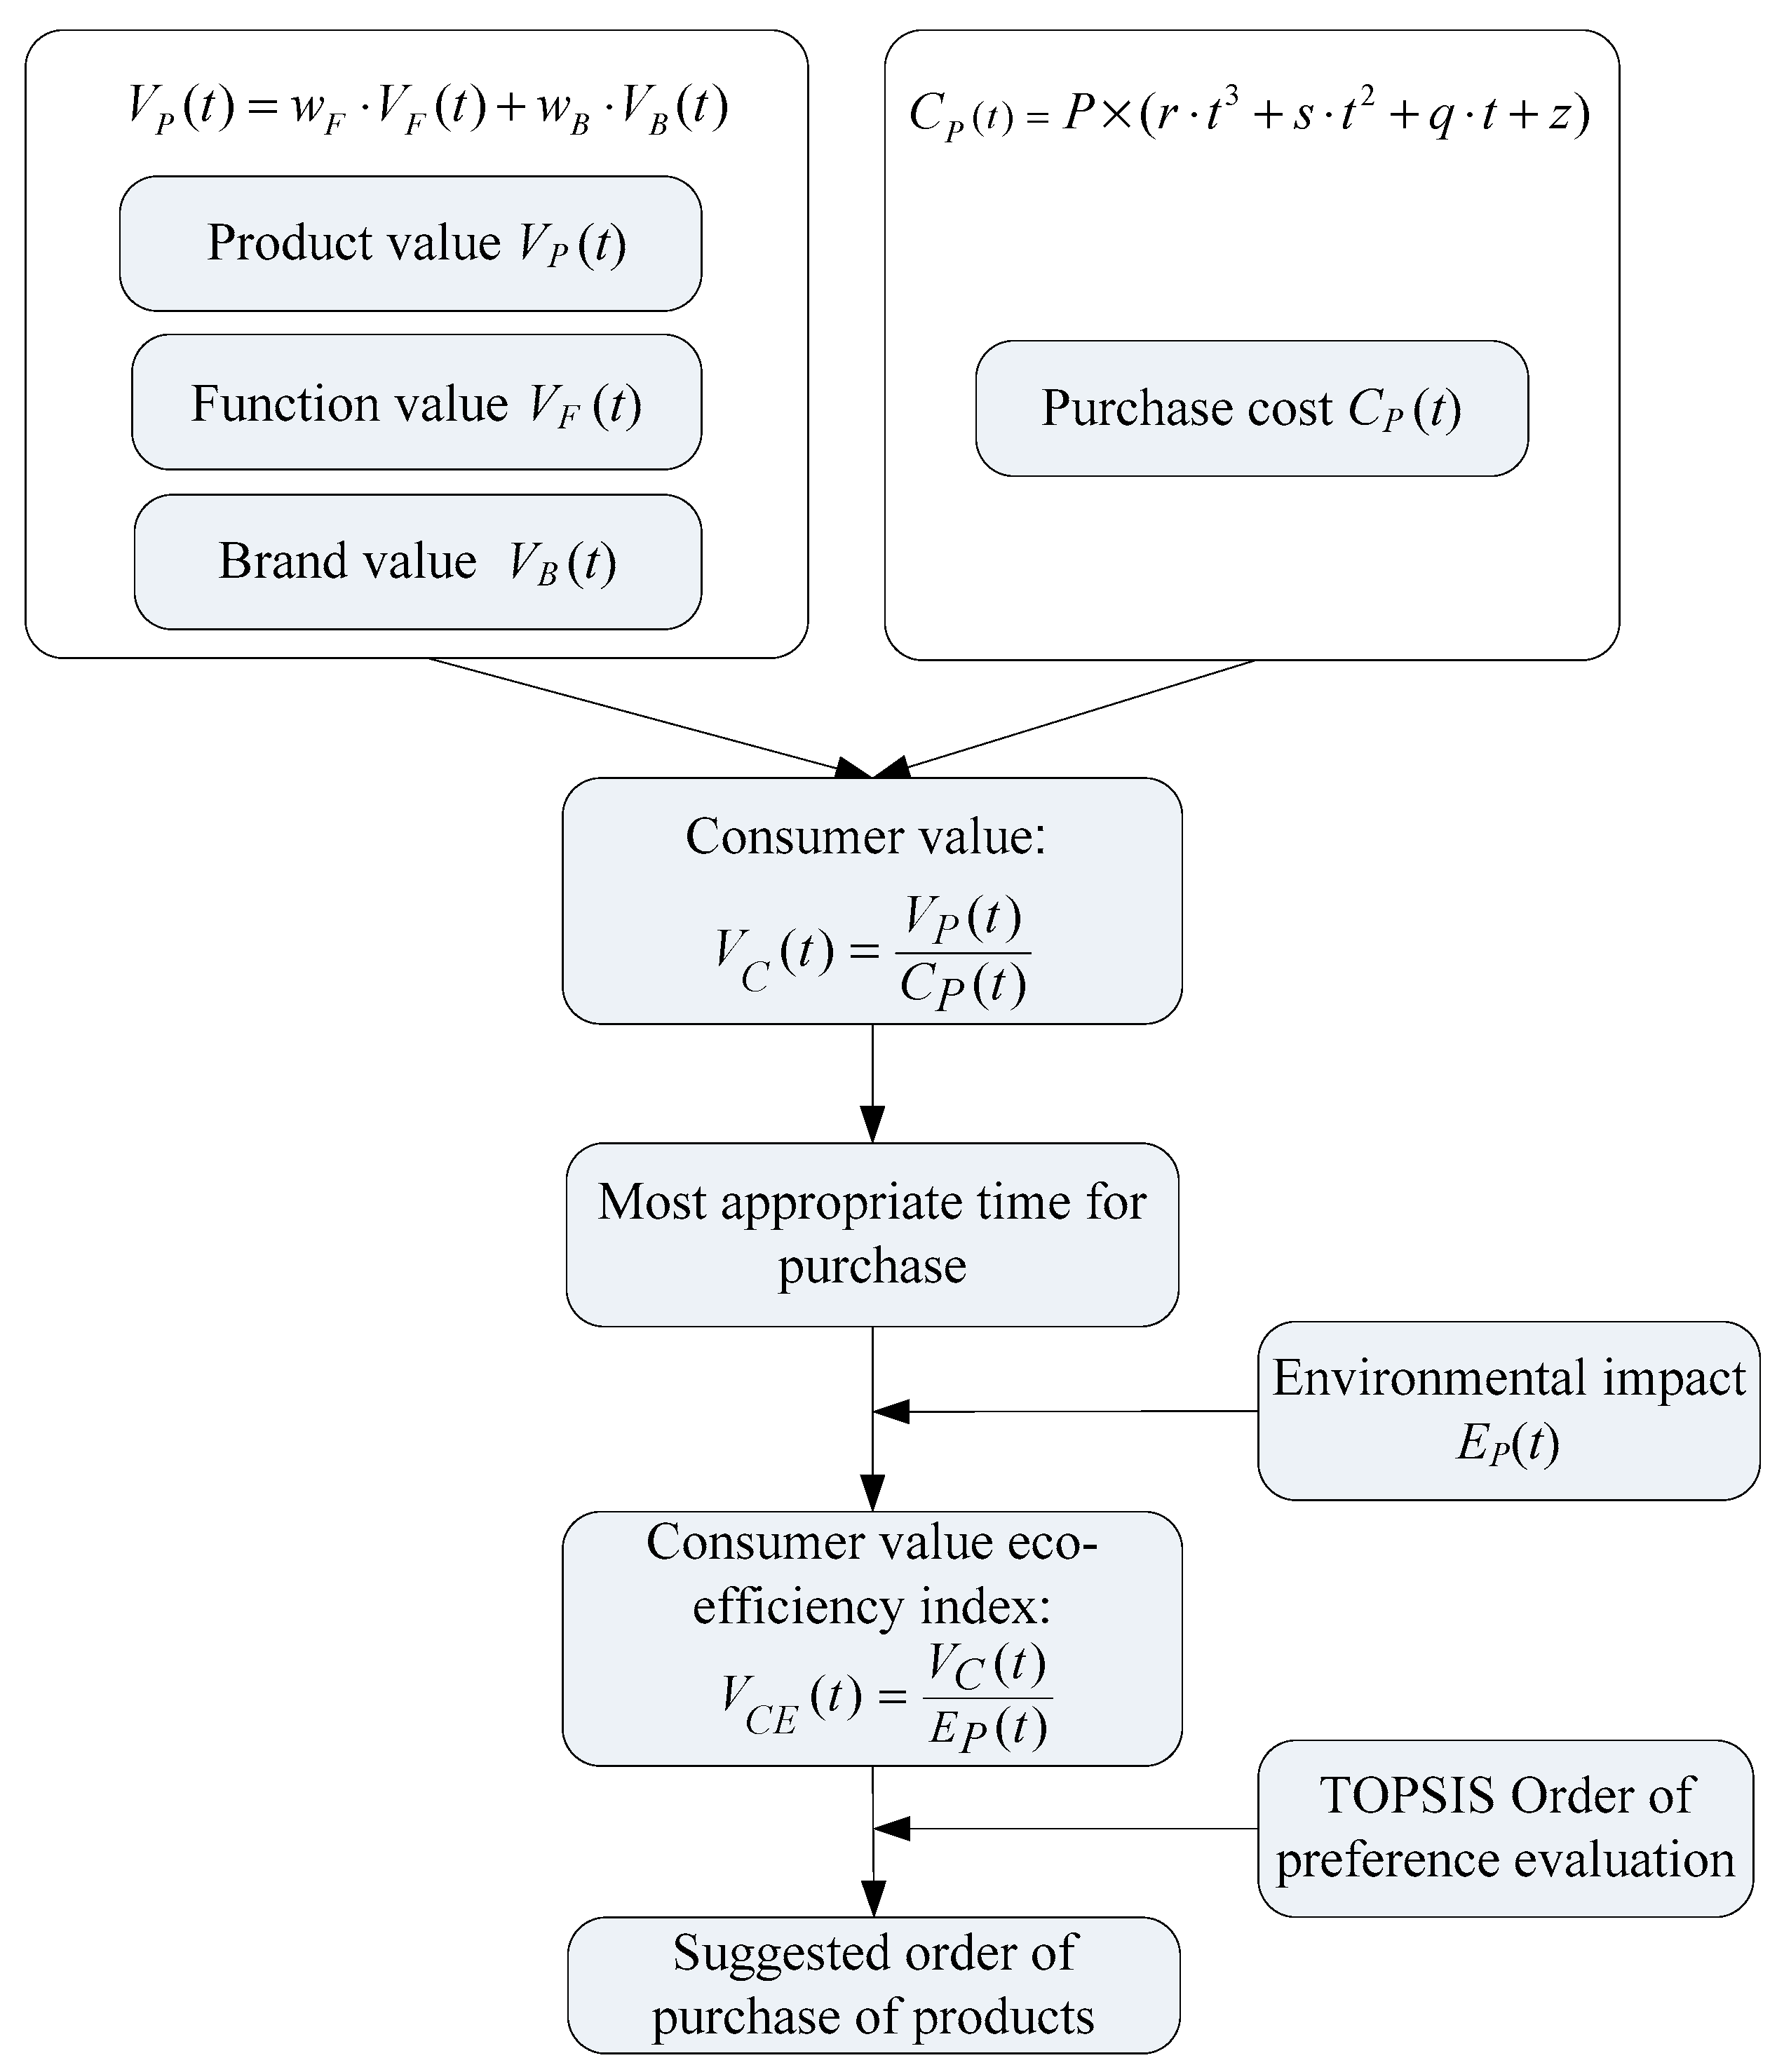
2.1. Establishing the Consumer Value-Time Function

In the definition of consumer value proposed by researcher Zeithaml [6], as shown in Equation (1), RC represents perceived gain (functions obtained from using the product), CC represents perceived loss or sacrifice (price paid for buying the product), and the ratio of the two is the consumer value VC. This study continues and advances this concept, adding the time variable to create a time function evaluation model VC(t), as shown in Equation (2). By investigating the change in consumer value as a function of time, the maximum consumer value can be found and used as the most appropriate time for purchase:
V C = R C C C
V C ( t ) = V P ( t ) C P ( t )
where VC(t) is the consumer value given by the ratio of the gain and loss at the time of purchase. VP(t) represents the value gained at the time of purchase, and CP(t) represents the consumer cost at the time of purchase.

2.1.1. Establishing the Product Value-Time Function

Kondoh et al. [16] defined that under general circumstances, product value deteriorates as time goes on and proposed that the main factors affecting product value are functional and physical deterioration. This study uses this definition of product value deterioration to investigate the best time to make purchases. Assuming that the product considered for purchase by the consumer is a brand new product, physical deterioration will not be factored in. Moreover, in addition to the consideration of the functional value, the brand value is usually one of the factors that consumers will consider during a purchase. Hence, in the definition of the product value-time function VP(t), the consideration for the evaluation index in this study includes the product functional value VF(t), and product brand value VB(t), as shown in Equation (3). The product value is the sum of the functional value and the brand value. Weighted factors are also added for the consideration of consumers’ preference for functional value and brand value, with wF and wB representing the weighted preference for functional and brand value, respectively:
V P ( t ) = w F · V F ( t ) + w B · V B ( t ) w h e r e   w F + w B = 1 ,     0 w F , w B 1
In the calculation of product function value VF(t); this study assumes that product deterioration rate is a natural exponential function, as shown in Equation (4), where the function value of the product is continuously declining to zero. The remaining product function value is also influenced by the value of the newly released product that follows the current product. In this equation, X represents the remaining value after product value deterioration at time t and α represents the functional deterioration rate. In the calculation of α, this study referenced the calculation model proposed by Fang and Rau [17], sets new products as reference products, and finds the product’s deterioration rate by comparing the function and specification of the products with the reference products, as shown in Equation (5):
V F ( t ) = ( 1 X w F ) · e α · t + X w F   ,   0 X ,   0 t ,   0 < α
Functional   deterioration   value = Evaluated   product   specification   ( old ) Reference   product   specification   ( new )
The steps involved in the calculation of the functional deterioration value are as follows:
(1)
Determine which product will be the evaluated or case product (Pe) and the reference product (Pf).
(2)
Identify key specifications of the product (m = 1, 2, … M).
(3)
Choose the most significant attributes or functions for each key specification and then determine their performance (Pem is the performance of the key specification m of the evaluated product).
(4)
Apply the weighting factor (wm) to express the contribution of each key specification.
(5)
Determine the key specifications progress vector. Use Equation (6) to find each attributes performance when the progress vector goes up (the larger the value, the better the performance). Use Equation (7) to find each attribute’s performance when the progress vector goes down (the lower the value, the better the performance). Pfm notation in the Equations (6) and (7) is the performance of key component m of the reference product.
(6)
Multiply the attribute’s performance by the weighting factor and sum the values of the specifications to obtain the total deterioration value of the product (Dp), as shown in Equation (8). Substituting Dp into Equation (4), we can obtain α:
D p m = P e m P f m
D p m = 1 P e m 1 P f m
D P = m = 1 M D p m · w m

2.1.2. Establishing the Brand Value-Time Function

The definition for product brand value-time function VB(t), is the amount that consumer is willing to pay when the products have similar functions and specifications, and it is used as the brand value in this study, as shown in Equation (9). In addition, CP(t) represents purchasing cost as a function of time, CB is the material cost of the product, and CM is the manufacturing cost of the product. This study assumes that the material cost and manufacturing costs of products with similar functions and specifications will be the same. When VB(t) = 1, the product price is equal to the material and manufacturing costs. When VB(t) > 1, the product price is greater than the material and manufacturing costs. The value also incorporates brand value, and a higher value means a higher brand value:
V B ( t ) = C P ( t ) C B + C M ,   1 V B ( t )

2.2. Establishing the Product Cost-Time Function

When consumers select products, the purchasing cost of a product (CP), which is the product’s price (P), will decrease as time goes on and when new products appear under general market mechanisms. This study used data from Amazon [18] to obtain product historical price curves in order to perform curve fitting, as shown in Equation (10), r, s, q, and z are the coefficients of equation after curve-fitting. This was done to calculate the product sales price with respect to time:
C P ( t ) = P × ( r · t 3 + s · t 2 + q · t + z )

2.3. Establishing the Consumer Eco-Efficiency-Time Function

In recent years, many countries have made laws to restrict manufacturers, for example Waste Electrical and Electronic Equipment (WEEE) directive, Restriction of Hazardous Substances (RoHS) directive and directive of Eco-design Requirements, for example Energy-related Products (ErP) [19]. Only when the production processes meet the standards can these manufacturers start their sales. Environment awareness has risen and many manufacturers have released low-energy-consumption, environmentally friendly products one after another. Energy saving products are currently giving a great benefit to consumers. However, no standard evaluation method exists for these products. Therefore, this study proposes a consumer eco-efficiency-time function evaluation model to calculate the benefits to the consumer from energy-saving products in order to provide it as a reference to consumers. The product energy consumption performance is one of the main factors in eco-efficiency. During product selection, the consumer will take into consideration the function and specifications provided by the manufacturer and the brand. This study uses the energy consumption specified in product specifications as an evaluation standard, as shown in Equation (11), where EP(t) represents the product energy consumption index with respect to time, and e1, e2, e3, and e4 are the coefficients of equation after curve-fitting. The lower the value of EP(t), the lower the energy consumption, which translates to low impact on the environment, and vice versa:
E P ( t ) = e 1 · t 3 + e 2 · t 2 + e 3 · t + e 4
Eco-efficiency of a product is a concept firstly proposed by the World Business Council for Sustainable Development (WBCSD) in 1991 [20]. It is achieved through the delivery of “competitively priced goods and services that satisfy human needs and bring quality of life while progressively reducing the environmental impact of the goods and the resource intensity throughout the entire life-cycle to a level at least in line with the Earth’s estimated carrying capacity.” The calculation of eco-efficiency is as shown in Equation (12). By referencing the concept of eco-efficiency, this study defines the consumer value eco-efficiency index VCE(t), as the ratio between consumer value VC(t), and the product energy consumption index EP(t), at time t, as shown in Equation (13):
Eco efficiency = Product   Value   ( Input ) Environmental   impact   ( Output )
V C E ( t ) = V C ( t ) E P ( t )
Considering that the consumer value-time function, VC(t), and the product energy consumption index-time function, EP(t), have different units, they are normalized for calculation convenience. Their normalization is shown in Equations (14) and (15). The normalized consumer value VC(t), and normalized product energy consumption index EP(t), are substituted into Equation (16) to obtain normalized consumer value eco-efficiency index, VCE(t), as a function of time:
V C ( t ) = V P ( t ) V P ( 0 ) C P ( t ) C P ( 0 )
E P ( t ) = E P ( t ) E P ( 0 )
V C E ( t ) = V C ( t ) E P ( t )

2.4. TOPSIS

The TOPSIS (Technique for Order Preference by Similarity to Ideal Solution) method is a multi-criteria decision-making method proposed by Yoon and Hwang in 1981 [7]. It uses the relative distance of the best and worst solution to compare the pros and cons of the order solution. The basic concept of this method involves a decision maker finding the ideal solution and the negative-ideal solution formed by the best and the worst combination of criteria values based on various criteria of the feasible solutions and then comparing them. The ideal solution is a solution that has the largest benefit evaluation values and the least cost evaluation values from all of the alternatives. On the other hand, the negative-ideal solution is the solution with the lowest benefit evaluation values and the largest cost evaluation values among all alternatives. The ideal and negative-ideal solutions may not exist in reality but they can still be used as reference points for the decision maker. Then, the idea that the “ideal solution is the closest and the negative-ideal solution is the furthest” is used to calculate the distance between each feasible solution and these two solutions, i.e., the ideal solution and the negative-ideal solution. Finally, the relative distance is used to find the most suitable solution. Because of the logical coherence and intuitiveness of TOPSIS evaluation, it has been widely used for various purposes. The steps for solving TOPSIS are as follows:
(1) Establish a decision matrix (D)
The decision matrix has m alternatives, n criteria, where the rows are placed as the alternatives, and the columns are placed as the evaluation criteria. Inside the matrix, there is xij that is used to represent the evaluation values of the scheme under the criteria. Equation (17) is the decision matrix:
D = [ x 11 x 12 x 21 x 22 x 1 n x 2 n x m 1 x m 2 x m n ] ;   i = 1 , 2 , , m ;   j = 1 , 2 , , n
(2) Normalize the decision matrix (D) into the evaluation matrix (R) as shown in Equation (18):
R = [ x 11 x 12 x 21 x 22 x 1 n x 2 n x m 1 x m 2 x mn ] x ij i = 1 m x ij 2 [ r 11 r 12 r 21 r 22 r 1 n r 2 n r m 1 r m 2 r mn ]
(3) Calculate the weighed normalized decision matrix (V) as in Equation (19):
V [ v ij ] = R × W = [ v 11 v 12 v 21 v 22 v 1 n v 2 n v m 1 v m 2 v mn ] = [ w 1 r 11 w 2 r 12 w 1 r 21 w 2 r 22 w n r 1 n w n r 2 n w 1 r m 1 w 2 r m 2 w n r mn ]
(4) Determine the positive alternative (A+) and the negative alternative (A):
A + = { ( max i v i j | j J ) , ( min i v i j | j J ) | i = 1 , 2 , , m } = { v 1 + , v 2 + , , v n + }
A = { ( min i v i j | j J ) , ( max i v i j | j J ) | i = 1 , 2 , , m } = { v 1 , v 2 , , v n }
In above Equations (20) and (21), J is associated with the criteria having a positive impact, and J’ associated with the criteria having a negative impact.
(5) Calculate the degree of separation
The Degree of separation consists of the following two distances:
(a)
The distance between the alternative and the positive ideal solution is S i + , which is shown in Equation (22):
S i + = j = 1 n ( v i j v j + ) 2 ,   i = 1 ,   2 ,   ,   m
(b)
The distance between alternative and the negative ideal solution is S i , which is shown in Equation (23):
S i = j = 1 n ( v i j v j ) 2   ,   i = 1 ,   2 ,   ,   m
(6) Calculate the degree of similarity:
C i * = S i S i + + S i ,   0 C i * 1 ,   i = 1 ,   2 ,   ,   m
In Equation (24), if plan i is a positive ideal solution, then the degree of similarity Ci* = 1, and if plan i is a negative ideal solution, then Ci* =0. The larger the Ci* value, the better the solution.
(7) Rank the alternatives according to Ci* and choose the best solution from it.

3. Numerical Illustration

This study used the screen sizes and types of notebook computers available in the market to categorize them. Notebook computers with different screen sizes are described in Table 1. They can be categorized as ultrabooks, business notebooks, and gaming notebooks, and these three types are used as examples for investigation. Two notebooks of the same price but different brands are chosen from each category for comparison and investigation purposes, and the products are identified with letters from A to F. The specifications of products A–F are shown in Table 2.

3.1. Calculation of Product Value

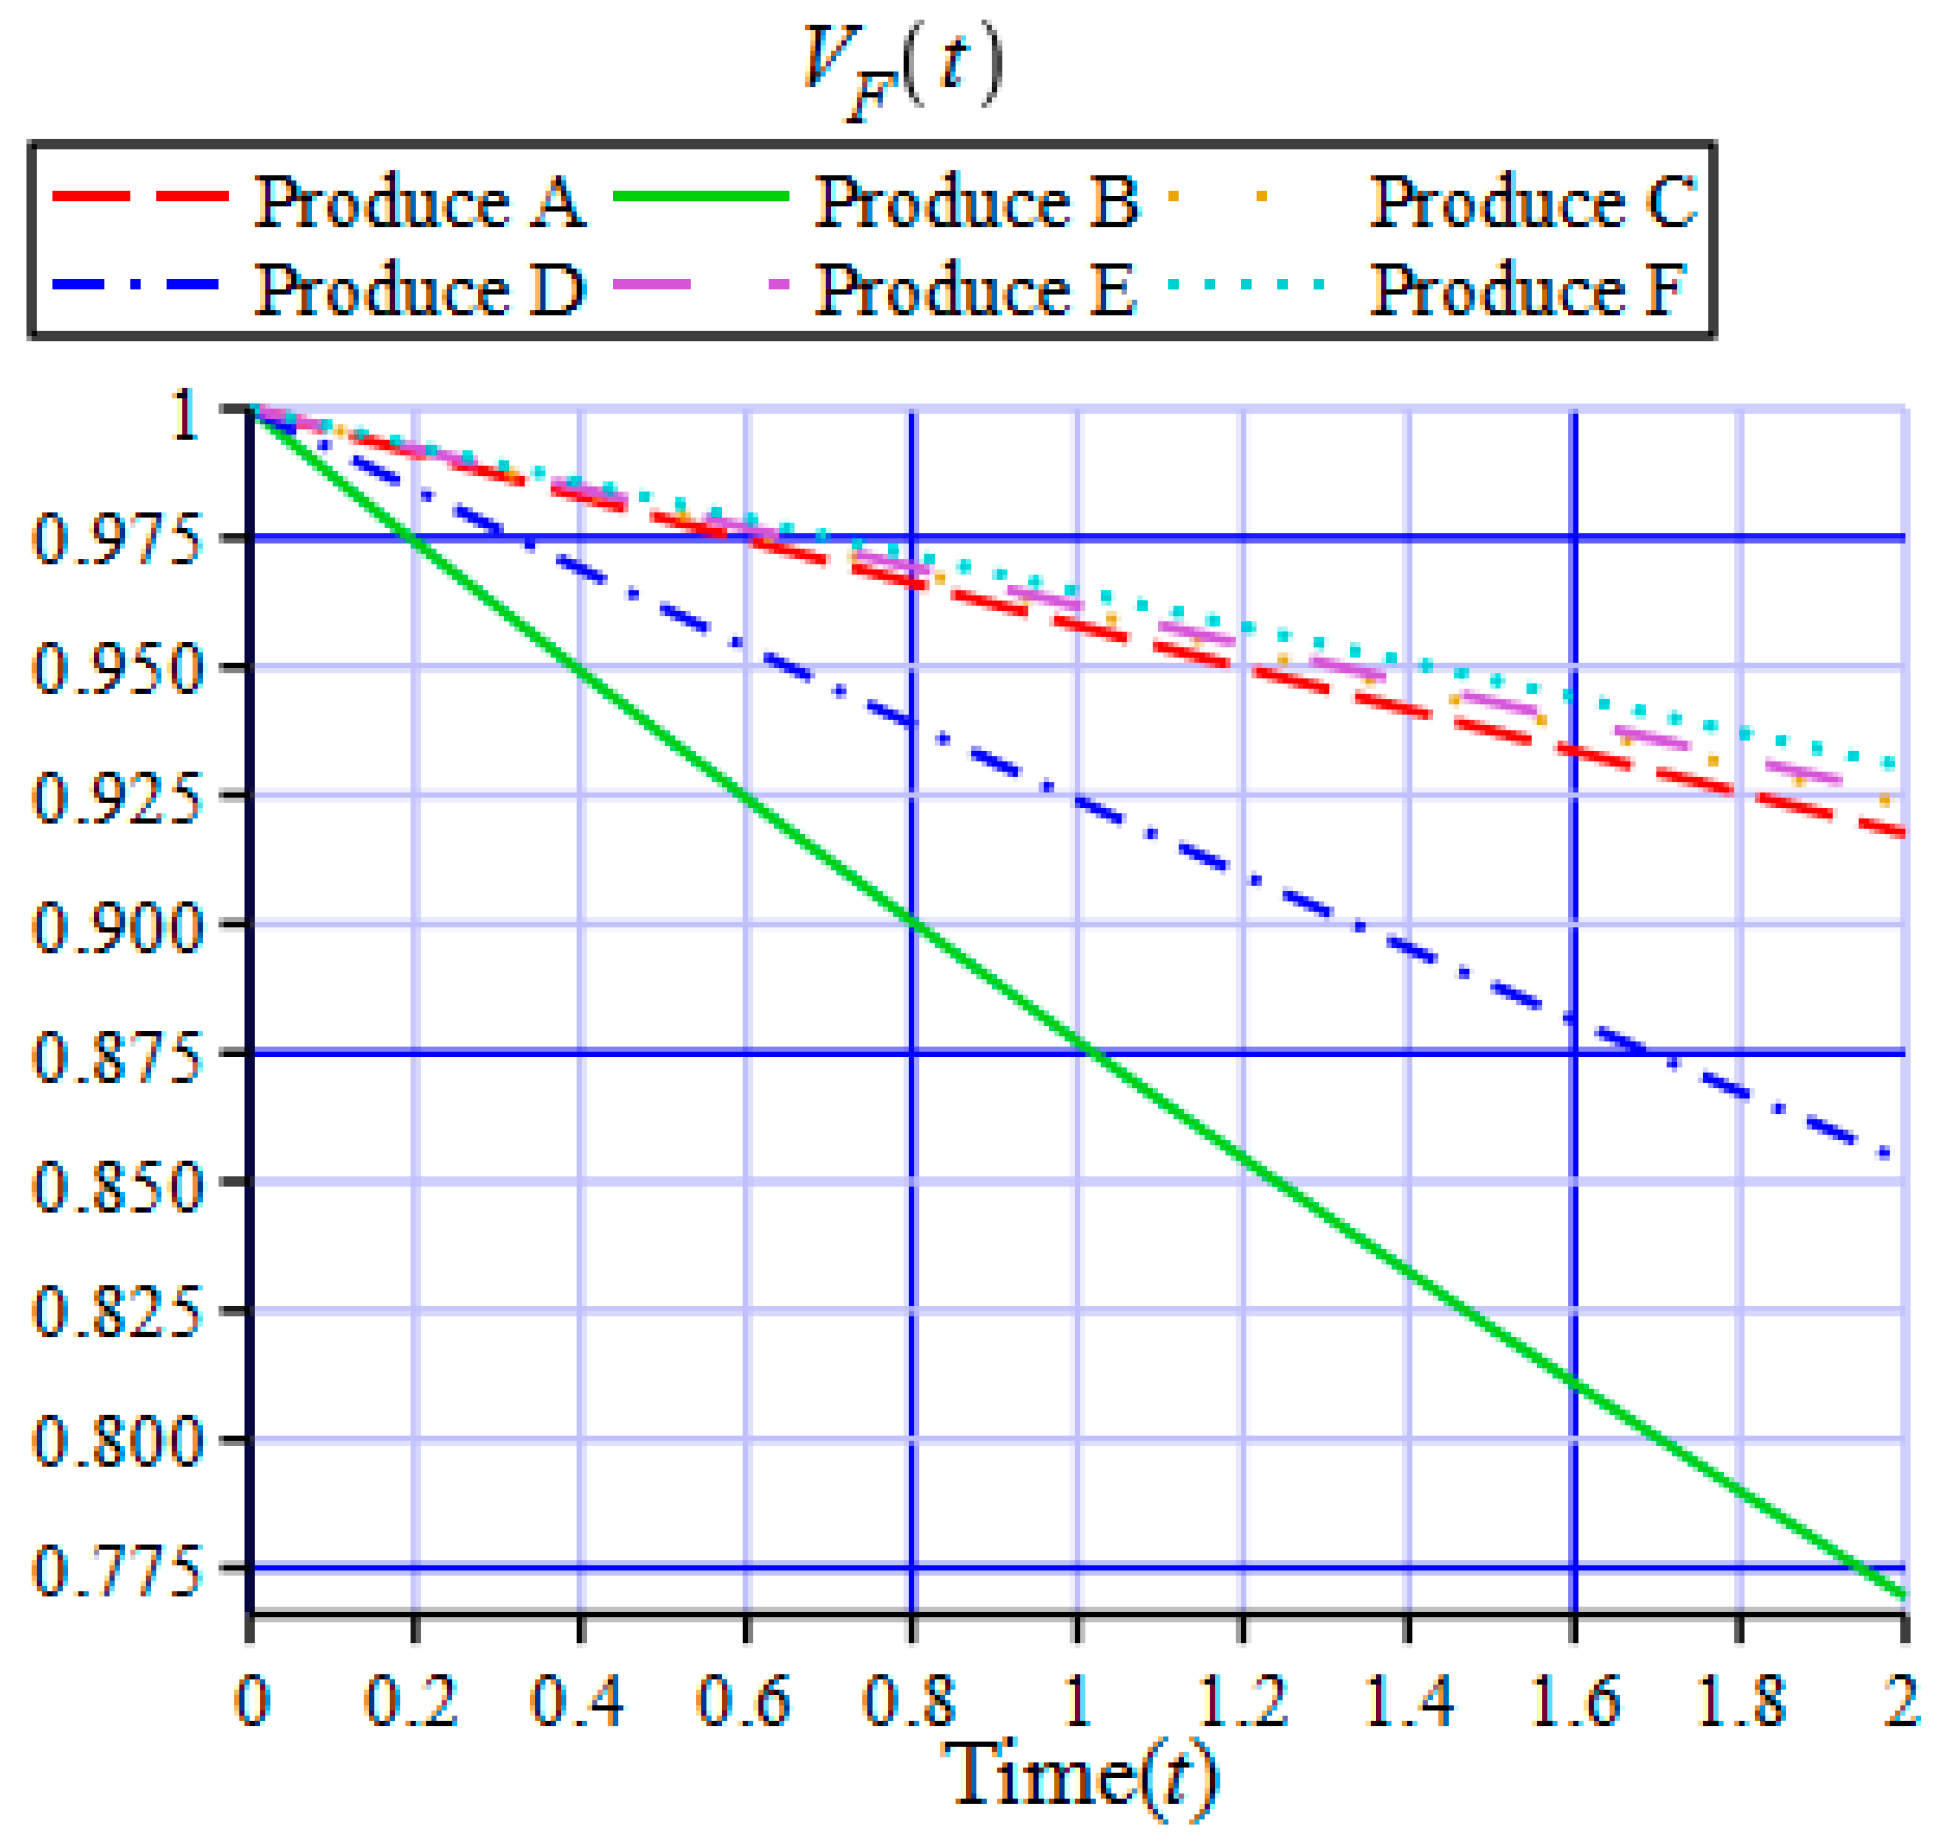
3.1.1. Calculation of Functional Value

The product value is calculated by first selecting reference products for comparison; to this end, products with similar functions, specifications, and prices are chosen from the different categories of notebooks (ultrabook, business notebook, and gaming notebook) and a newly released product from each season is chosen as the reference product (L1–L4). Table 3 shows the reference products (L1–L4) for an ultrabook only for illustration. We then investigate how the newly released product affects the price of the case product in every season. The evaluation items for product specifications are the processor, RAM, video card, display, hard drive, USB ports, battery, dimensions, and the weight. These items are used for product value evaluation, and by putting these product function and specification data into Equations (6)–(8), we obtain the product value deterioration value. Table 4 shows the product functional deterioration value of case product (A) in comparison to that of the reference product (L1).
After performing calculations using case product A and the reference product for the first season, L1, by following the aforementioned steps, the product functional value deteriorated from 1 to 0.988. Comparing it further with products released in different seasons (L2, L3, and L4), we can calculate the deterioration in the functional value of case product A over time. Using curve fitting, the product functional value deterioration rate is calculated to be 0.043, and the functional value deterioration curve is shown in Figure 2. After comparing the case products A–F with the reference products of the different categories released during the different seasons, the product functional deterioration was calculated as shown in Figure 3.

3.1.2. Calculation of Brand Value

As for the calculation of product brand value, this study defines brand value as the amount the consumer is willing to pay for a product of the same specification, which is considered to be the value brought to the consumer by the product. The prices stated on the official websites of the various products are used as the products’ purchase cost CP, while CB (BOM cost) and CM (manufacturing cost) were obtained on the basis of the Notebook Teardowns and Cost Benchmarking Report released by IHS iSuppli [33]. Since the report only provides information for certain types of notebook computers, this study used the costs of components of similar specifications for calculation purposes. Table 5 shows the calculations for case products A–F.
After finding the product functional value-time function and the brand value-time function, standardization of the starting point of the product was performed. Figure 4, Figure 5 and Figure 6 show the time function curves of the different case products after standardization. Based on the ultrabook product value curve shown in Figure 4, it is observed that case product A exhibits slower value deterioration than product B in both functional and brand value deterioration. This means that the functions, specifications, brand, and price of case product A were of the higher specifications and relatively unaffected by the release of similar products onto the market. However, case product B exhibits higher value deterioration when new products are released, and the deterioration increases with time.
Among Business Notebooks, case product C exhibits a higher product value than case product D over time as shown in Figure 5. This phenomenon is also observed in the ultrabook category. As for gaming notebooks, case products E and F show similar product value deterioration; however, the functional deterioration is much faster than the brand value deterioration. This is because although this type of product is affected by newly released products, its functional specifications and product value do not change significantly and are able to maintain their values, as shown in Figure 6.

3.2. Calculation of Product Cost and Product Eco-efficiency

This study uses the historical price records from the Amazon website [18] to perform historical price data curve fitting for the notebook products A–F and uses the least squares method from regression analysis to perform historical price simulation. Equation (10) is used to obtain the product cost-time function, which is then substituted into Equation (2) to obtain the consumer value-time function. Figure 7 shows the historical price curve fitting for case product A, performed using Maple 13 software tool (Waterloo Maple Inc., Waterloo, ON, Canada), as well as the effects of time and the release of new products on the product price.
In the calculation for product eco-efficiency evaluation, this study uses the energy consumption of the notebook computers as the energy consumption evaluation index. This index represents the product’s maximum energy consumption. Using Equation (17), we can determine the energy consumption performance for case products A–F at different times, as shown in Table 6. Ee is the evaluated product energy or power consumption in watts, as shown in Table 2. Ef(t) represents the reference product energy consumption in watts and t = Seasons 1–4, as shown in Table 3 for products A-B. Substituting these values into Equation (11) for curve fitting, we can find the product energy consumption index-time function:
E p ( t ) = E e E f ( t )

3.3. Investigation of the Most Appropriate Time of Purchase for Different Types of Products

Based on the aforementioned calculations, the product value and product purchasing cost-time function curves for ultrabooks, business notebooks, and gaming notebooks are shown in Figure 8, Figure 9 and Figure 10. After substituting the product value VP(t), and the product purchasing cost CP(t), into Equation (14), the consumer value can be calculated. This section will investigate the changes in the consumer value curve for the different case products over time. The time where consumer value is the highest will be the most appropriate time of purchase. The consumer value curves for each case product in the categories of ultrabook, business notebooks, and gaming notebooks are shown in Figure 11, Figure 12 and Figure 13. These will be discussed below separately.
(1)
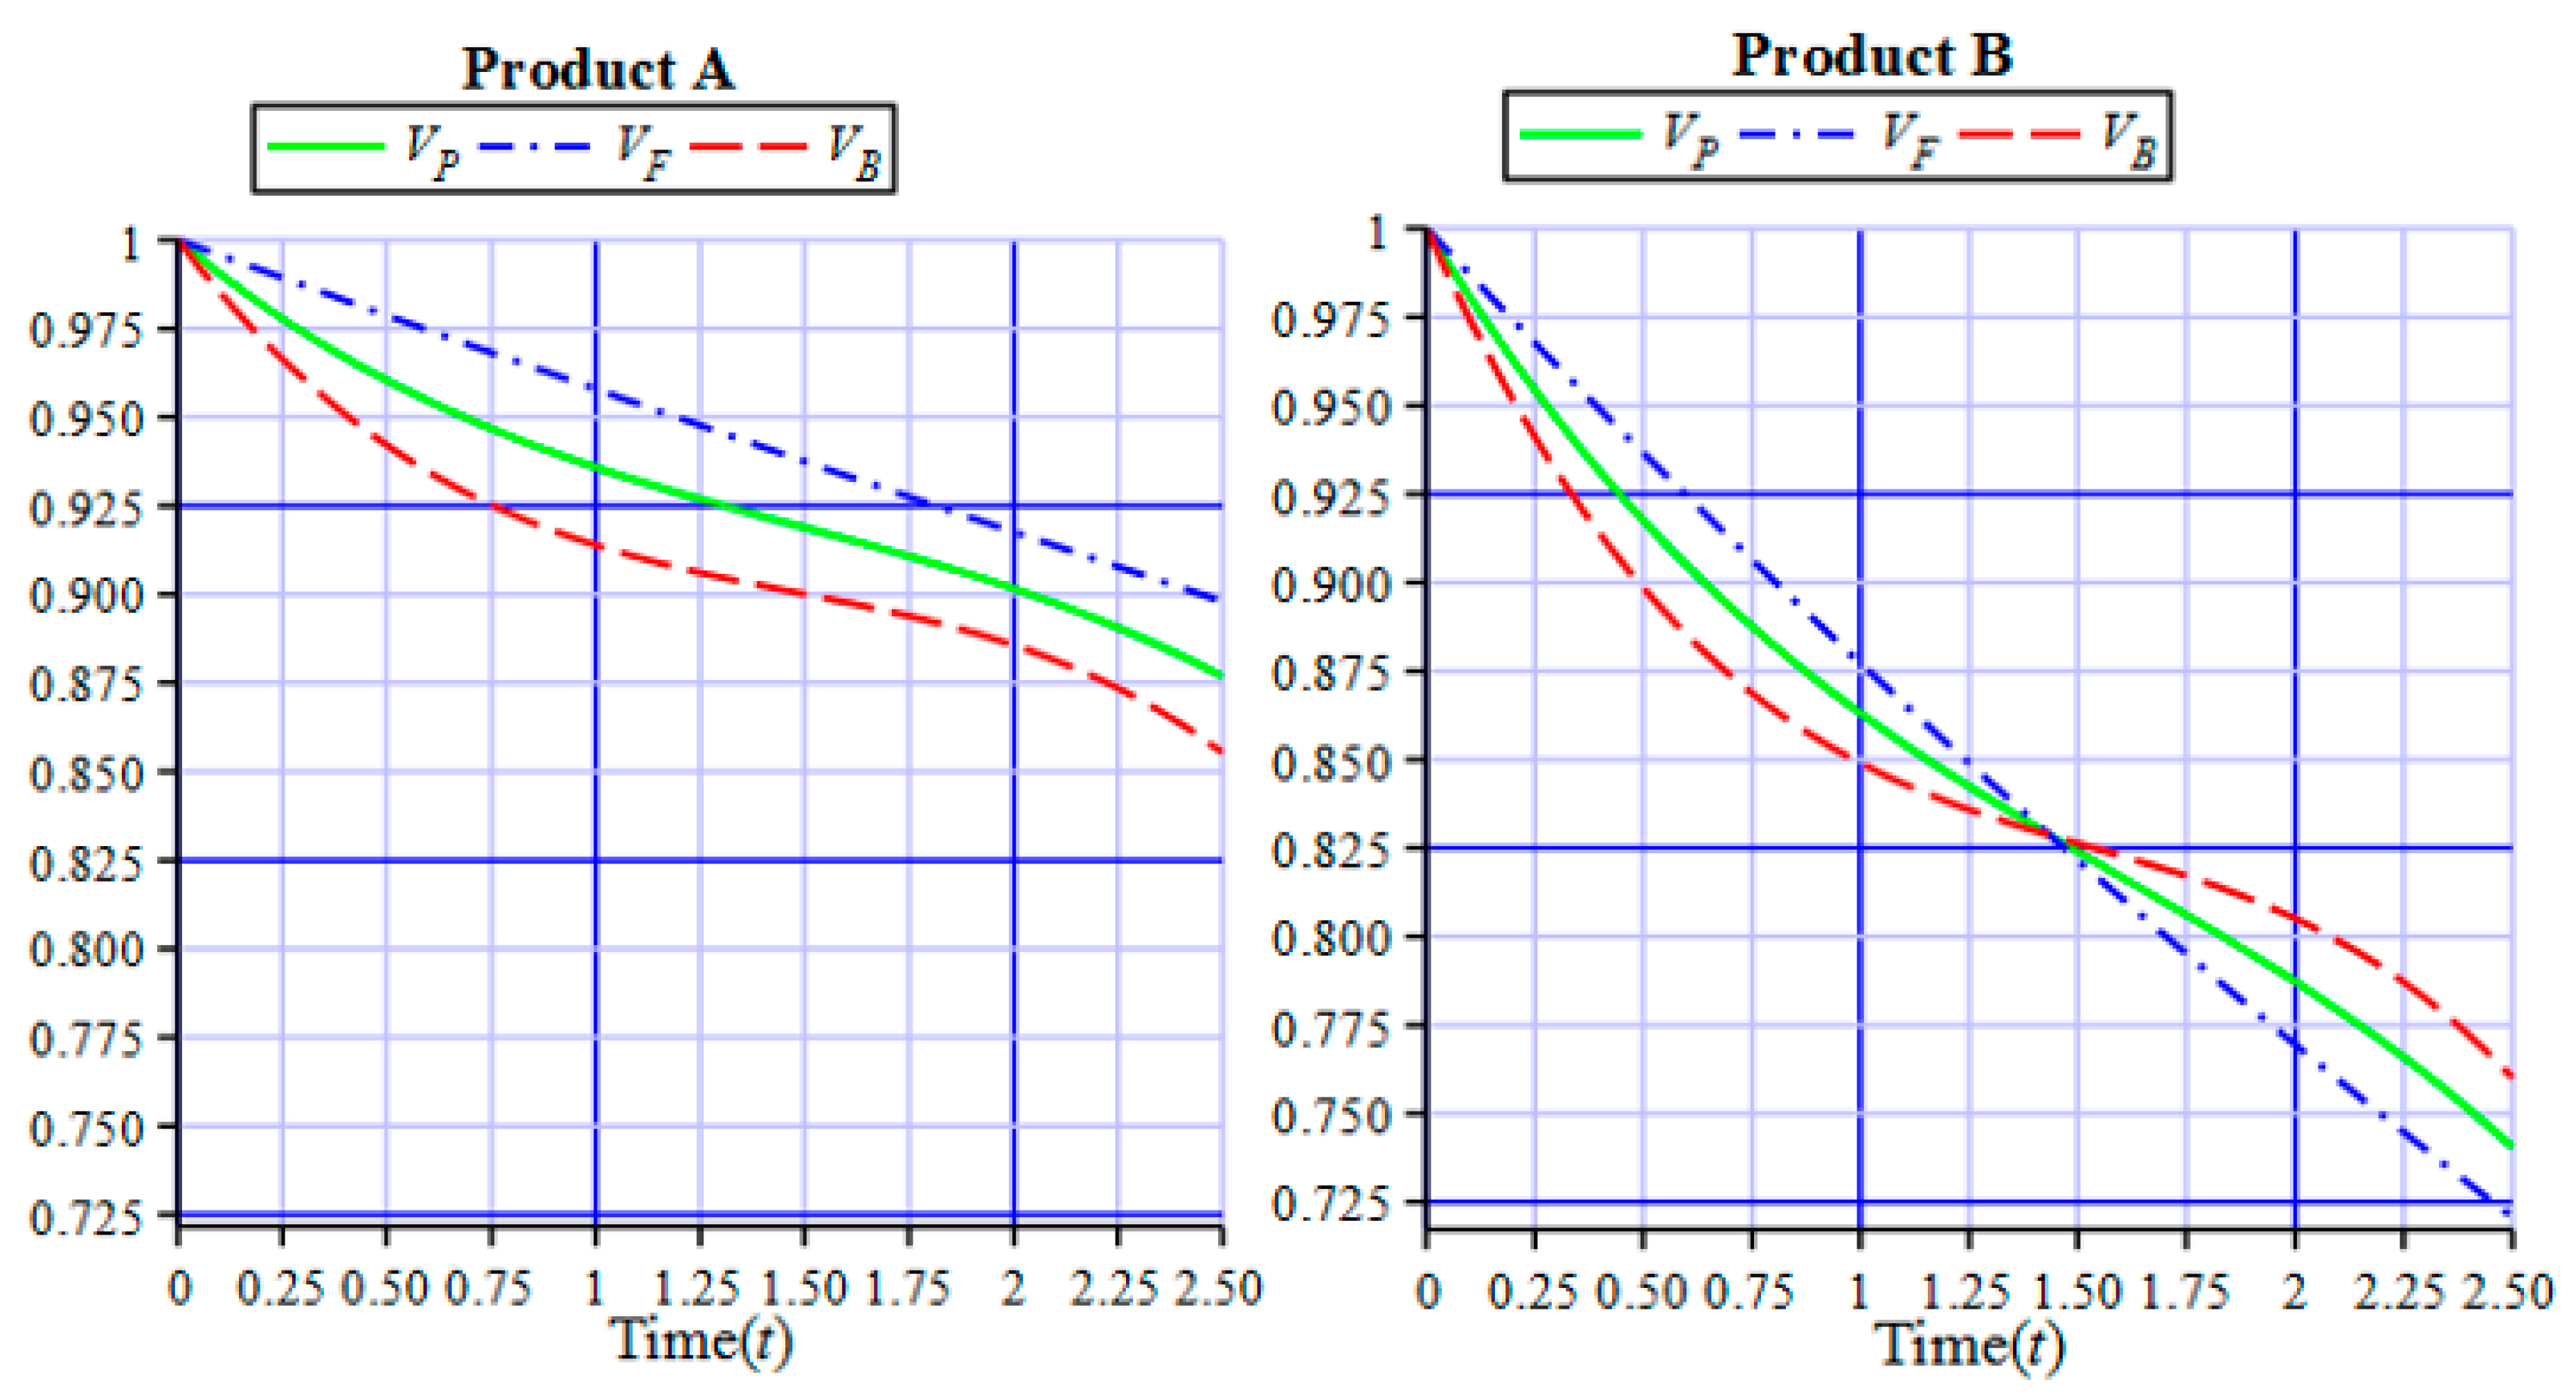
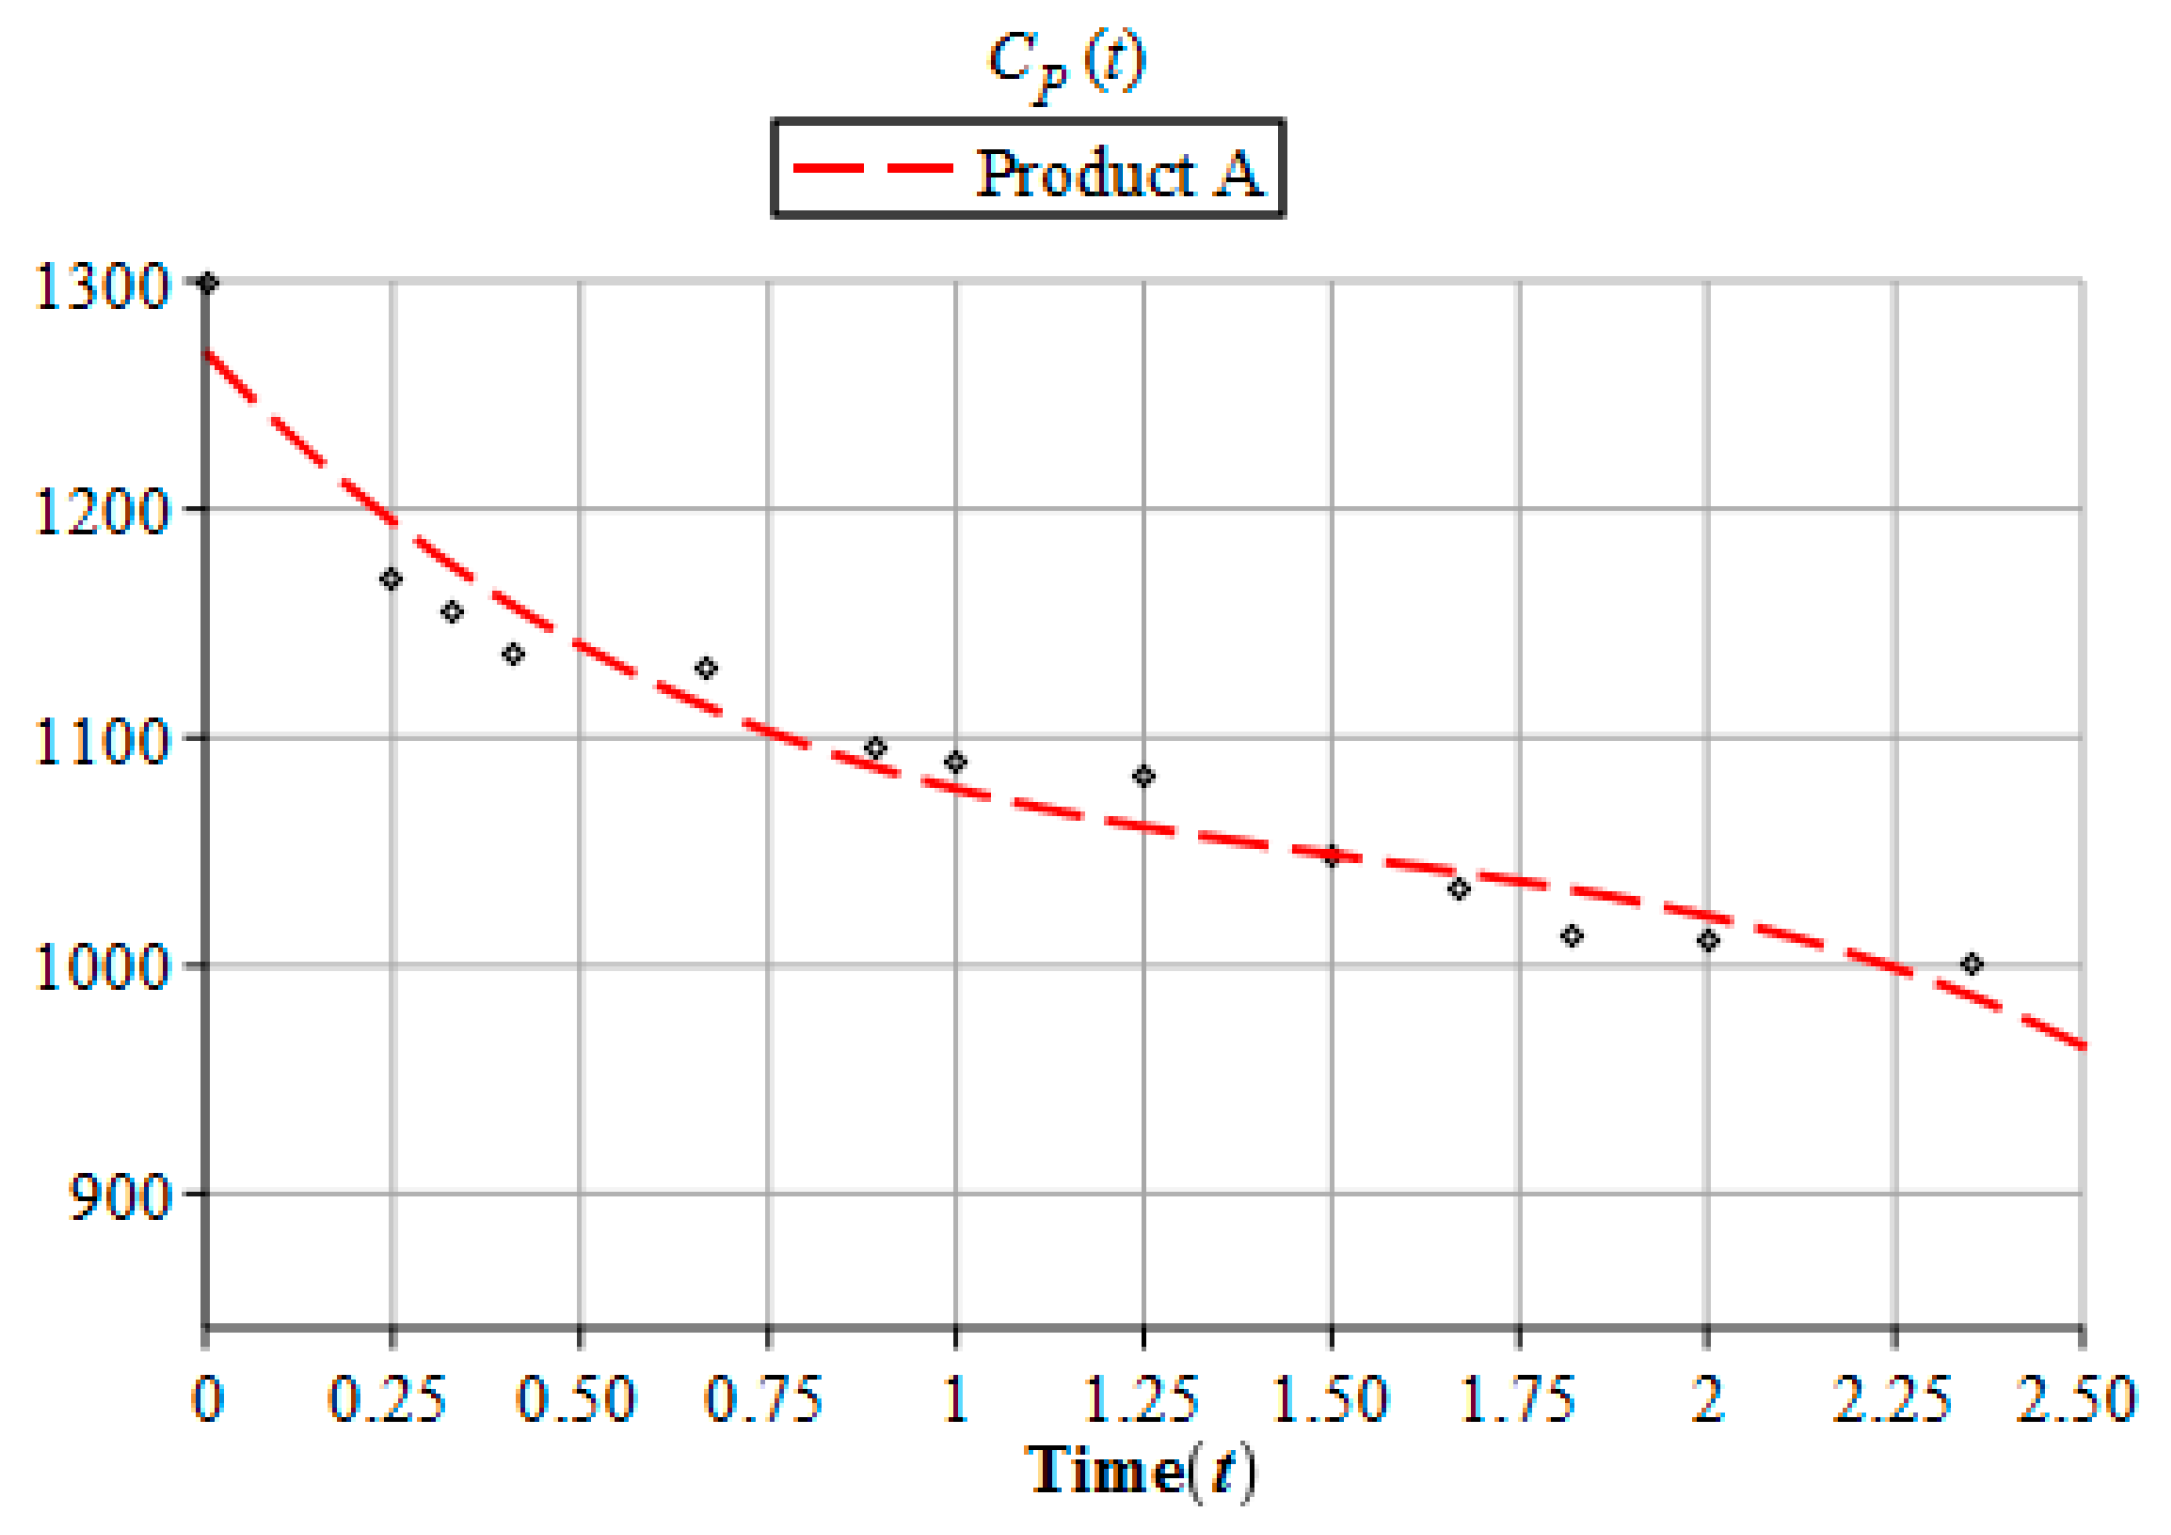
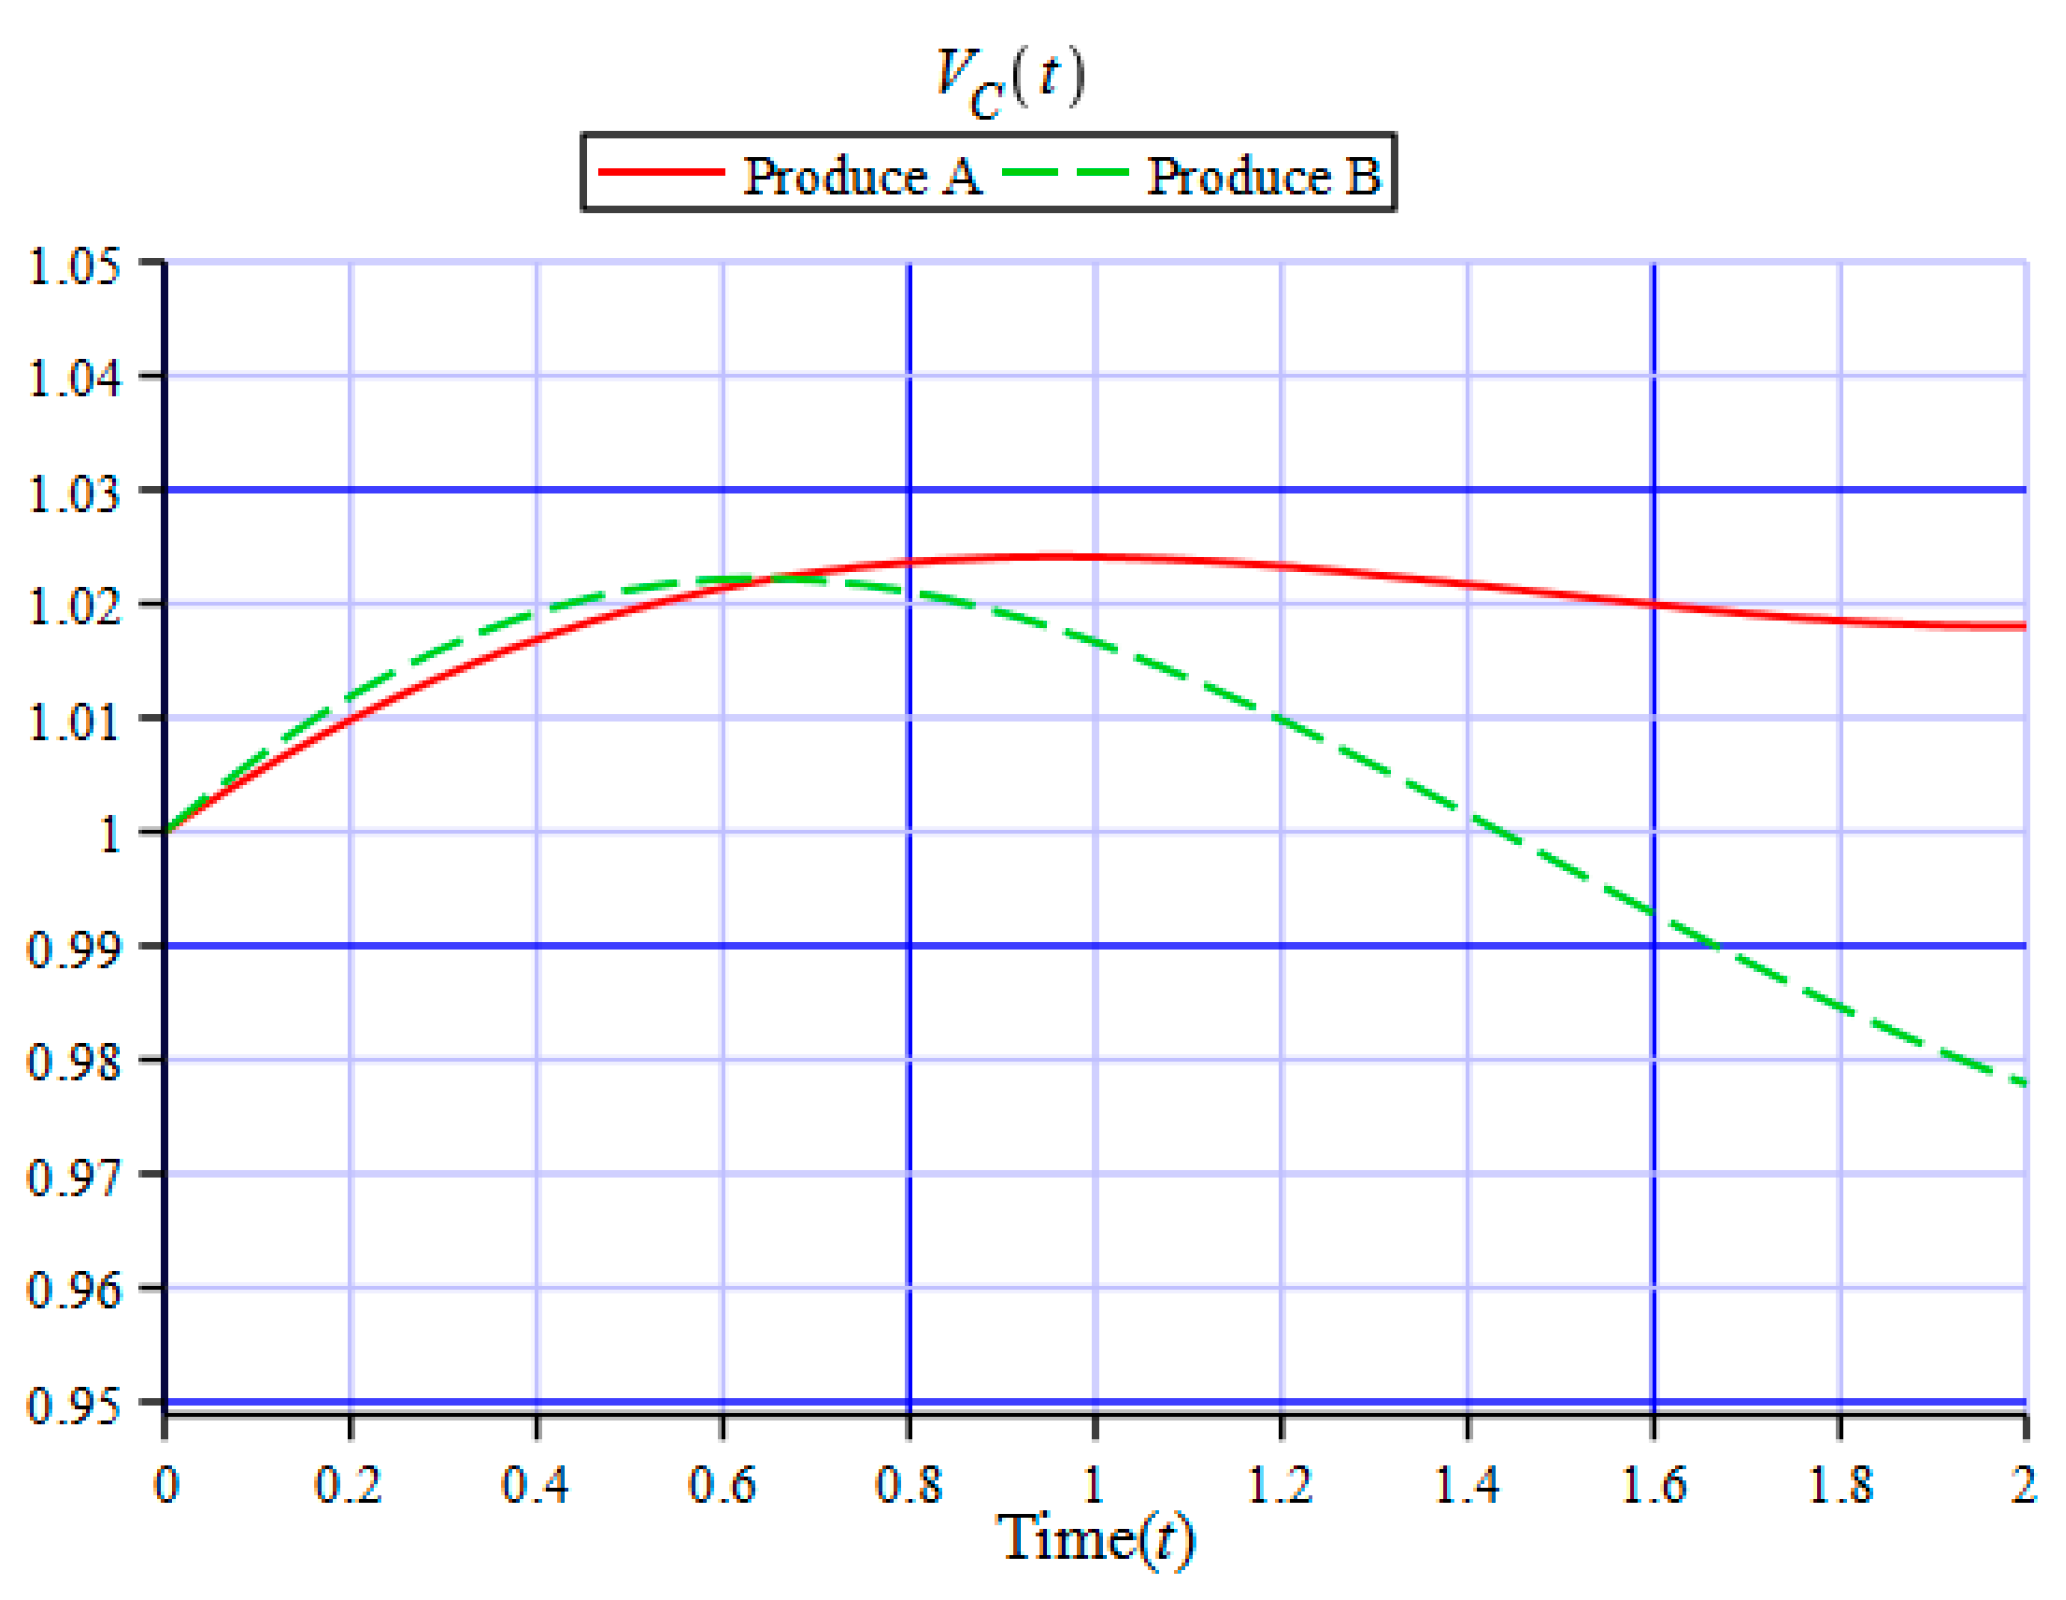
Ultrabooks: Figure 9 shows that before time t = 0.64, the consumer value for case product B is similar to that of case product A. However, as time goes on, because the rate of deterioration of the product value VP(t) is larger than the rate of deterioration for the product purchasing cost CP(t), consumer value VC(t) is reduced. At the beginning of the second season, case product B shows a drastic deterioration in the consumer value, whereas case product A experiences a small amount of deterioration only by the fourth season (starting around t = 1.5). It can be seen from Figure 8 that Product B’s deterioration in product value VP(t) and purchasing cost CP(t) is larger than Product A’s. Since Product A has a higher functional value and brand value, its product functional value and purchasing cost are not significantly affected by the introduction of new products with new functions and specifications over time. Hence, it retains a relatively high consumer value. However, in the fourth season, it starts to show significant deterioration in product value due to the release of a new-generation product of the same brand.
(2)
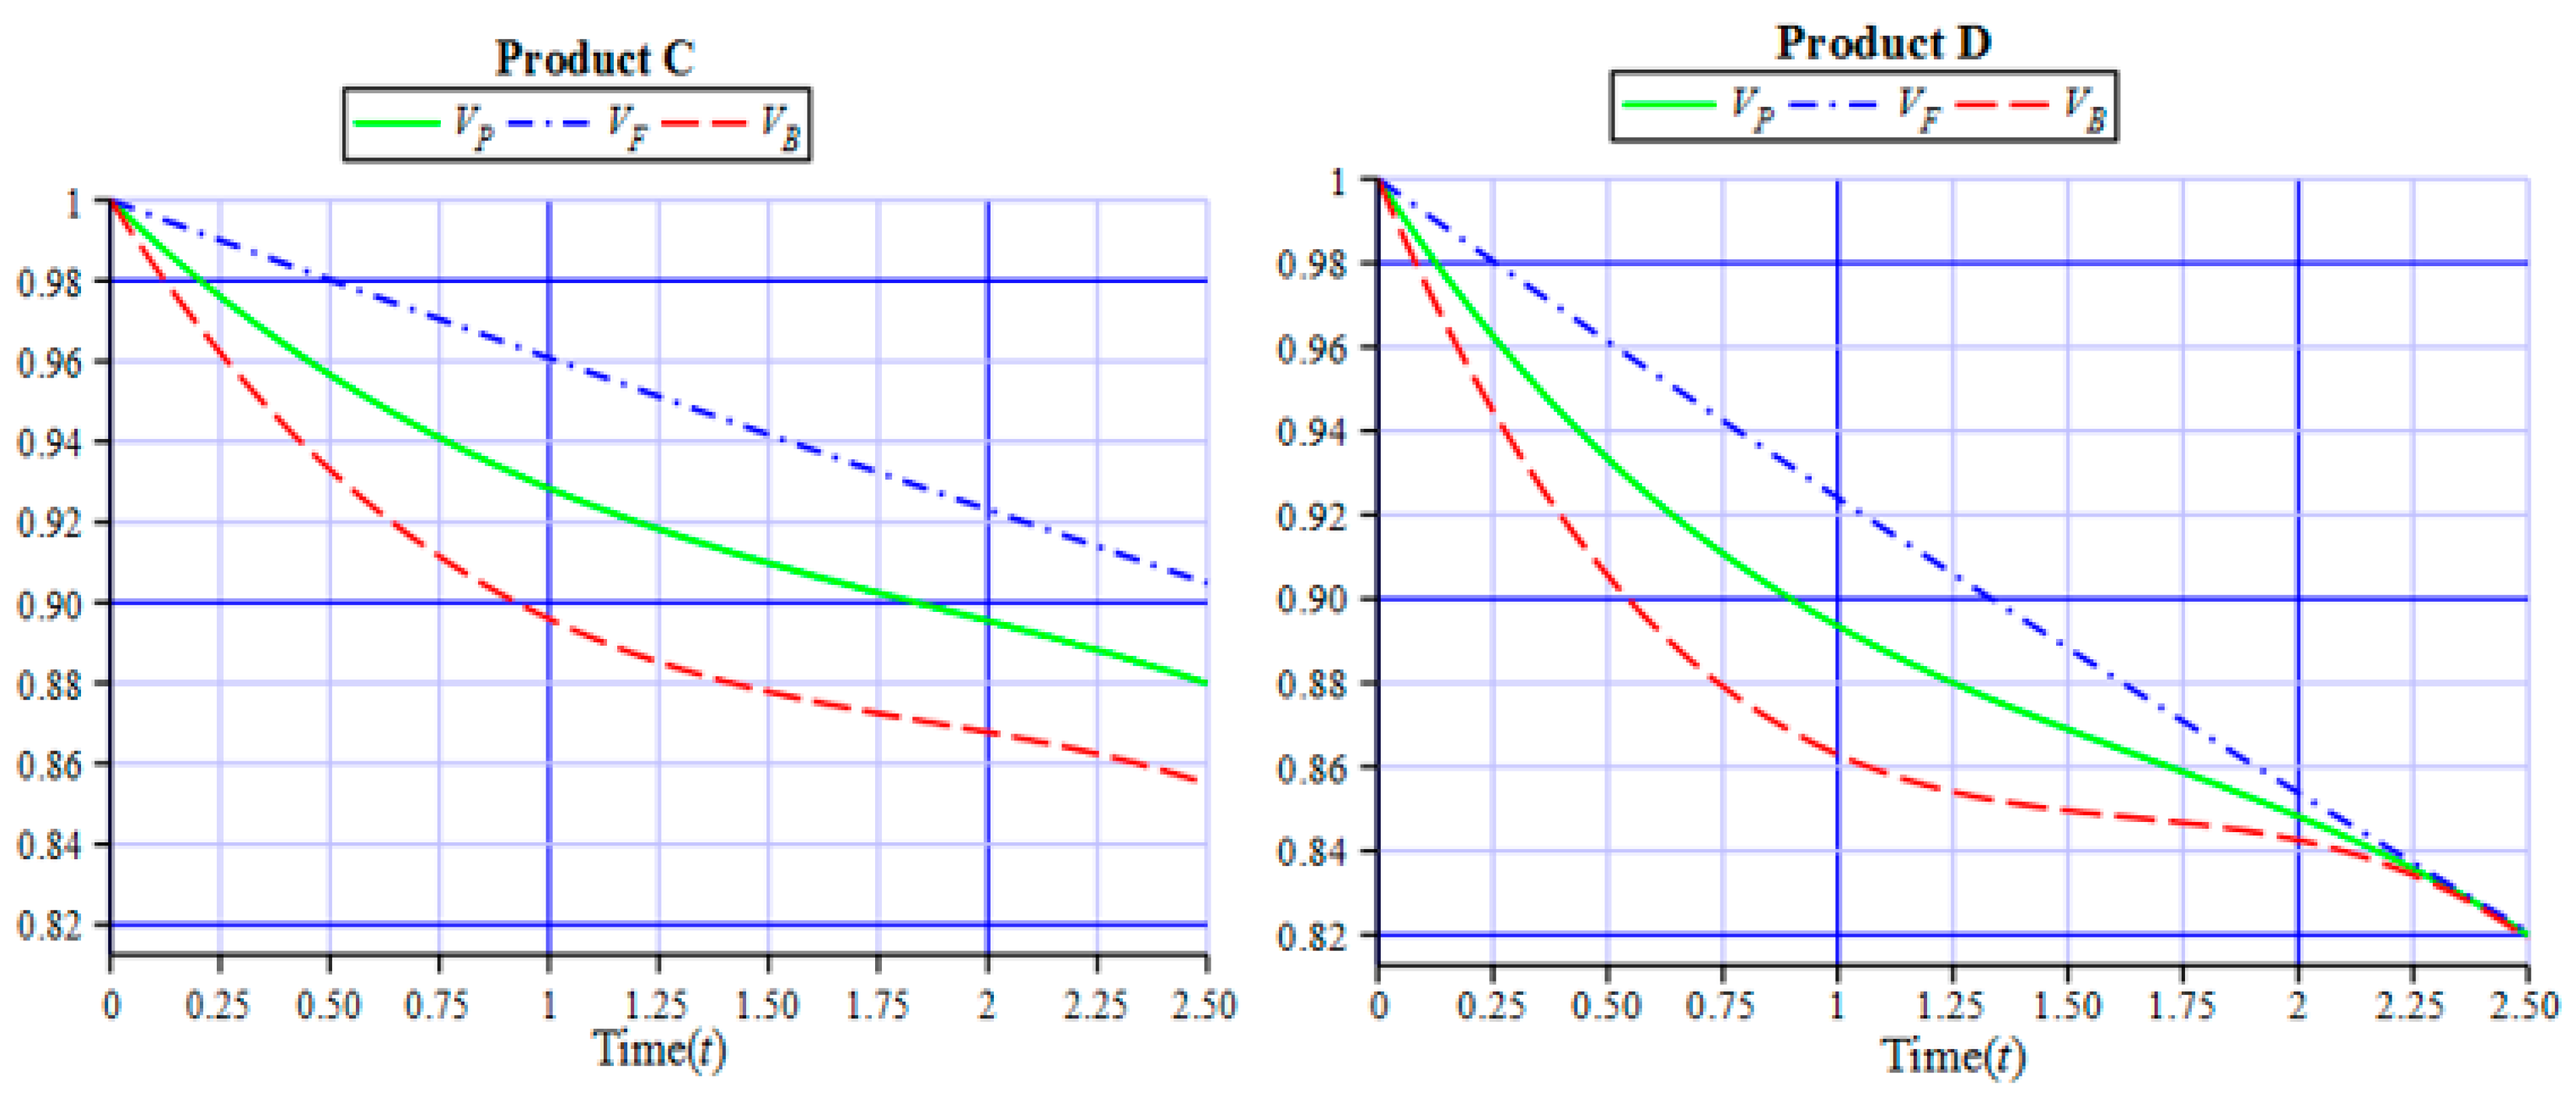
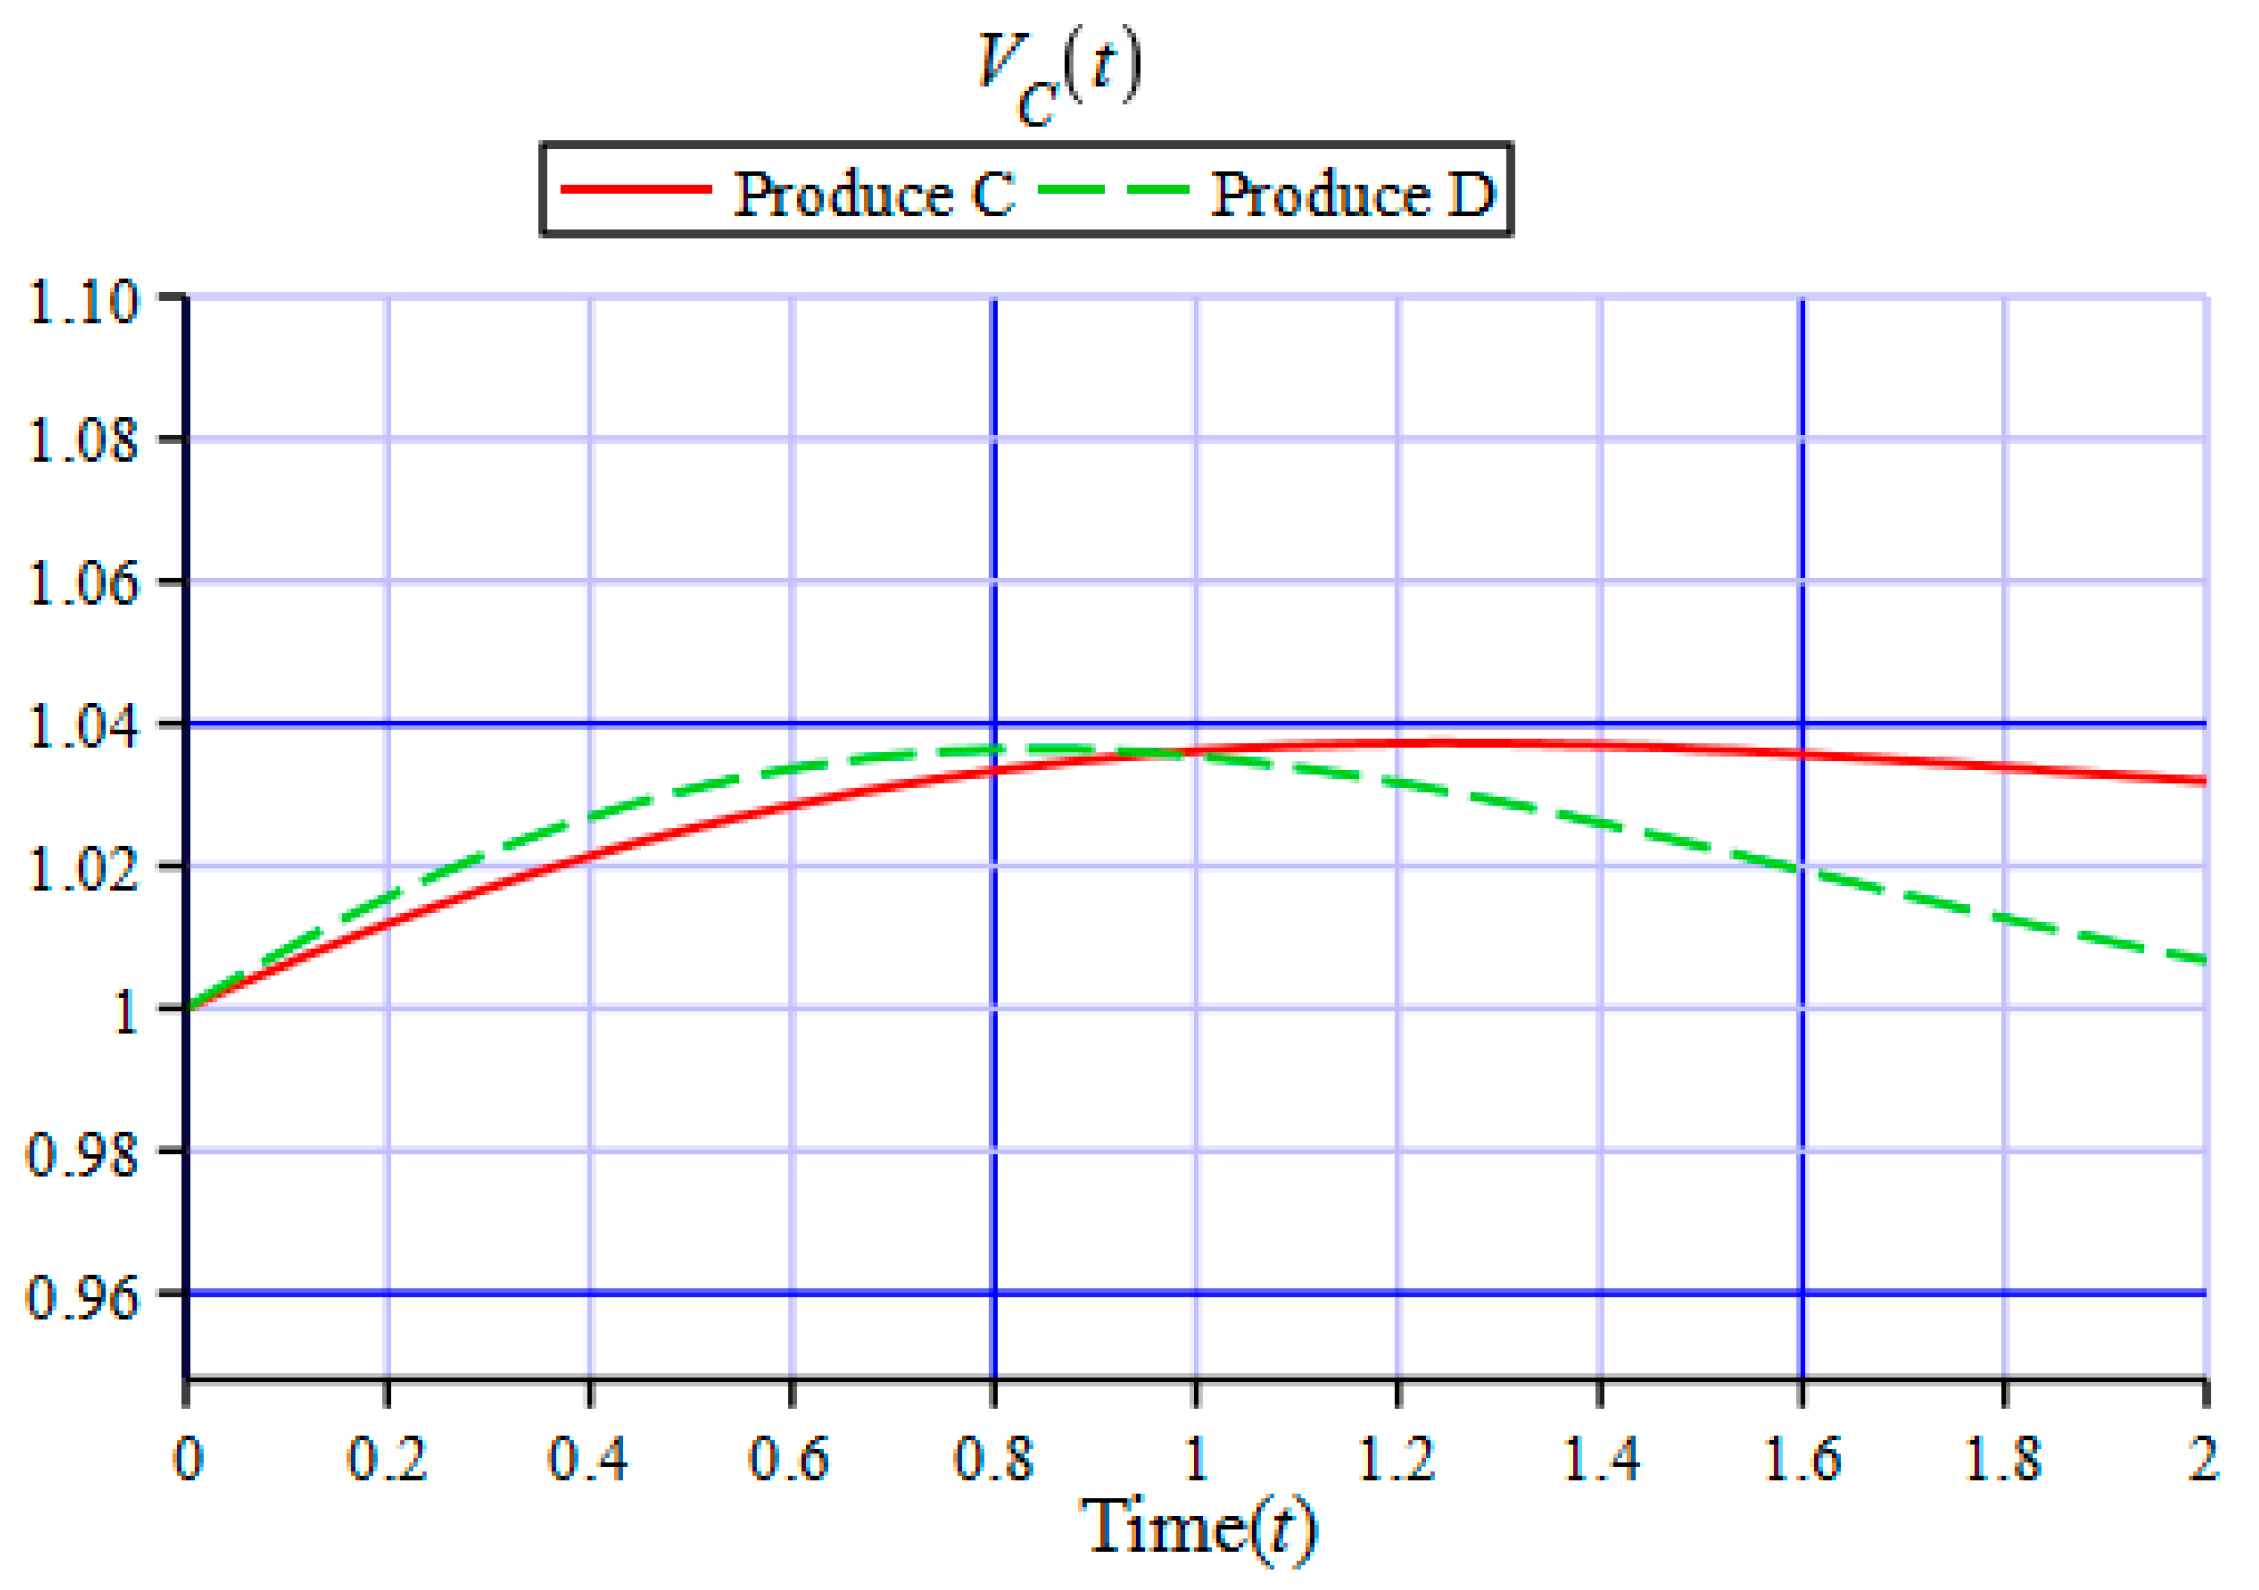
Business Notebooks: It can be seen from Figure 11 that the consumer value of case product D is lower than that of product C after time t = 0.92. This is because the deterioration of the product value VP(t) is greater than the deterioration of the product purchasing cost CP(t), similar to the ultrabook case product B. Comparing the two types of products, we discovered that with time, the general products (C and D) exhibit lower value deterioration than the ultrabook products (A and B). This means products C and D brings a higher value to the consumers than products A and B.
(3)
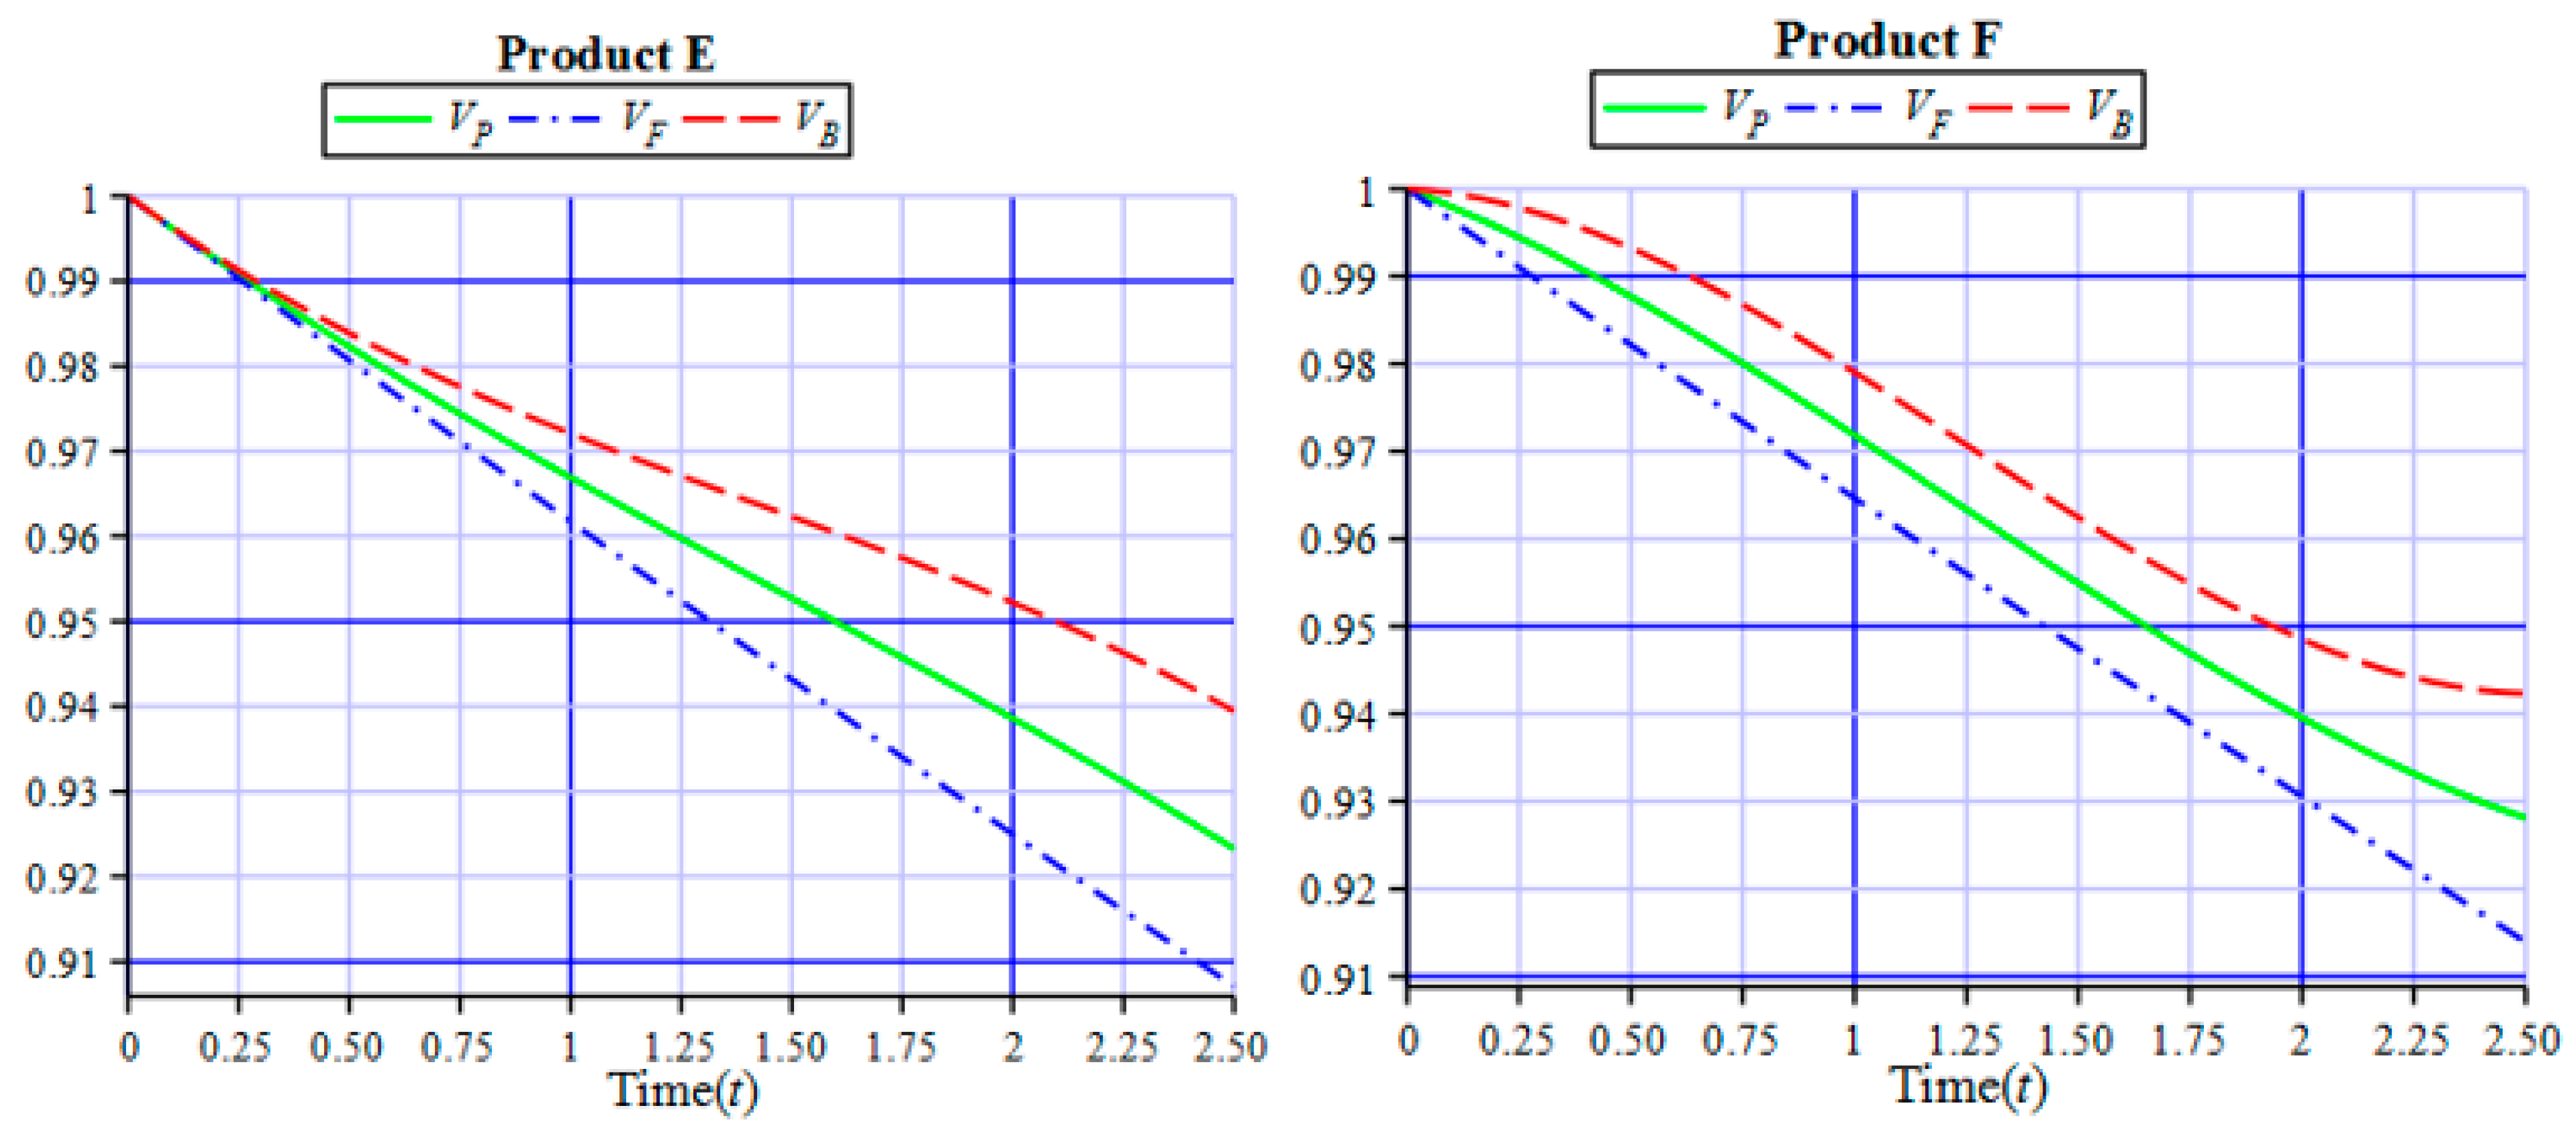
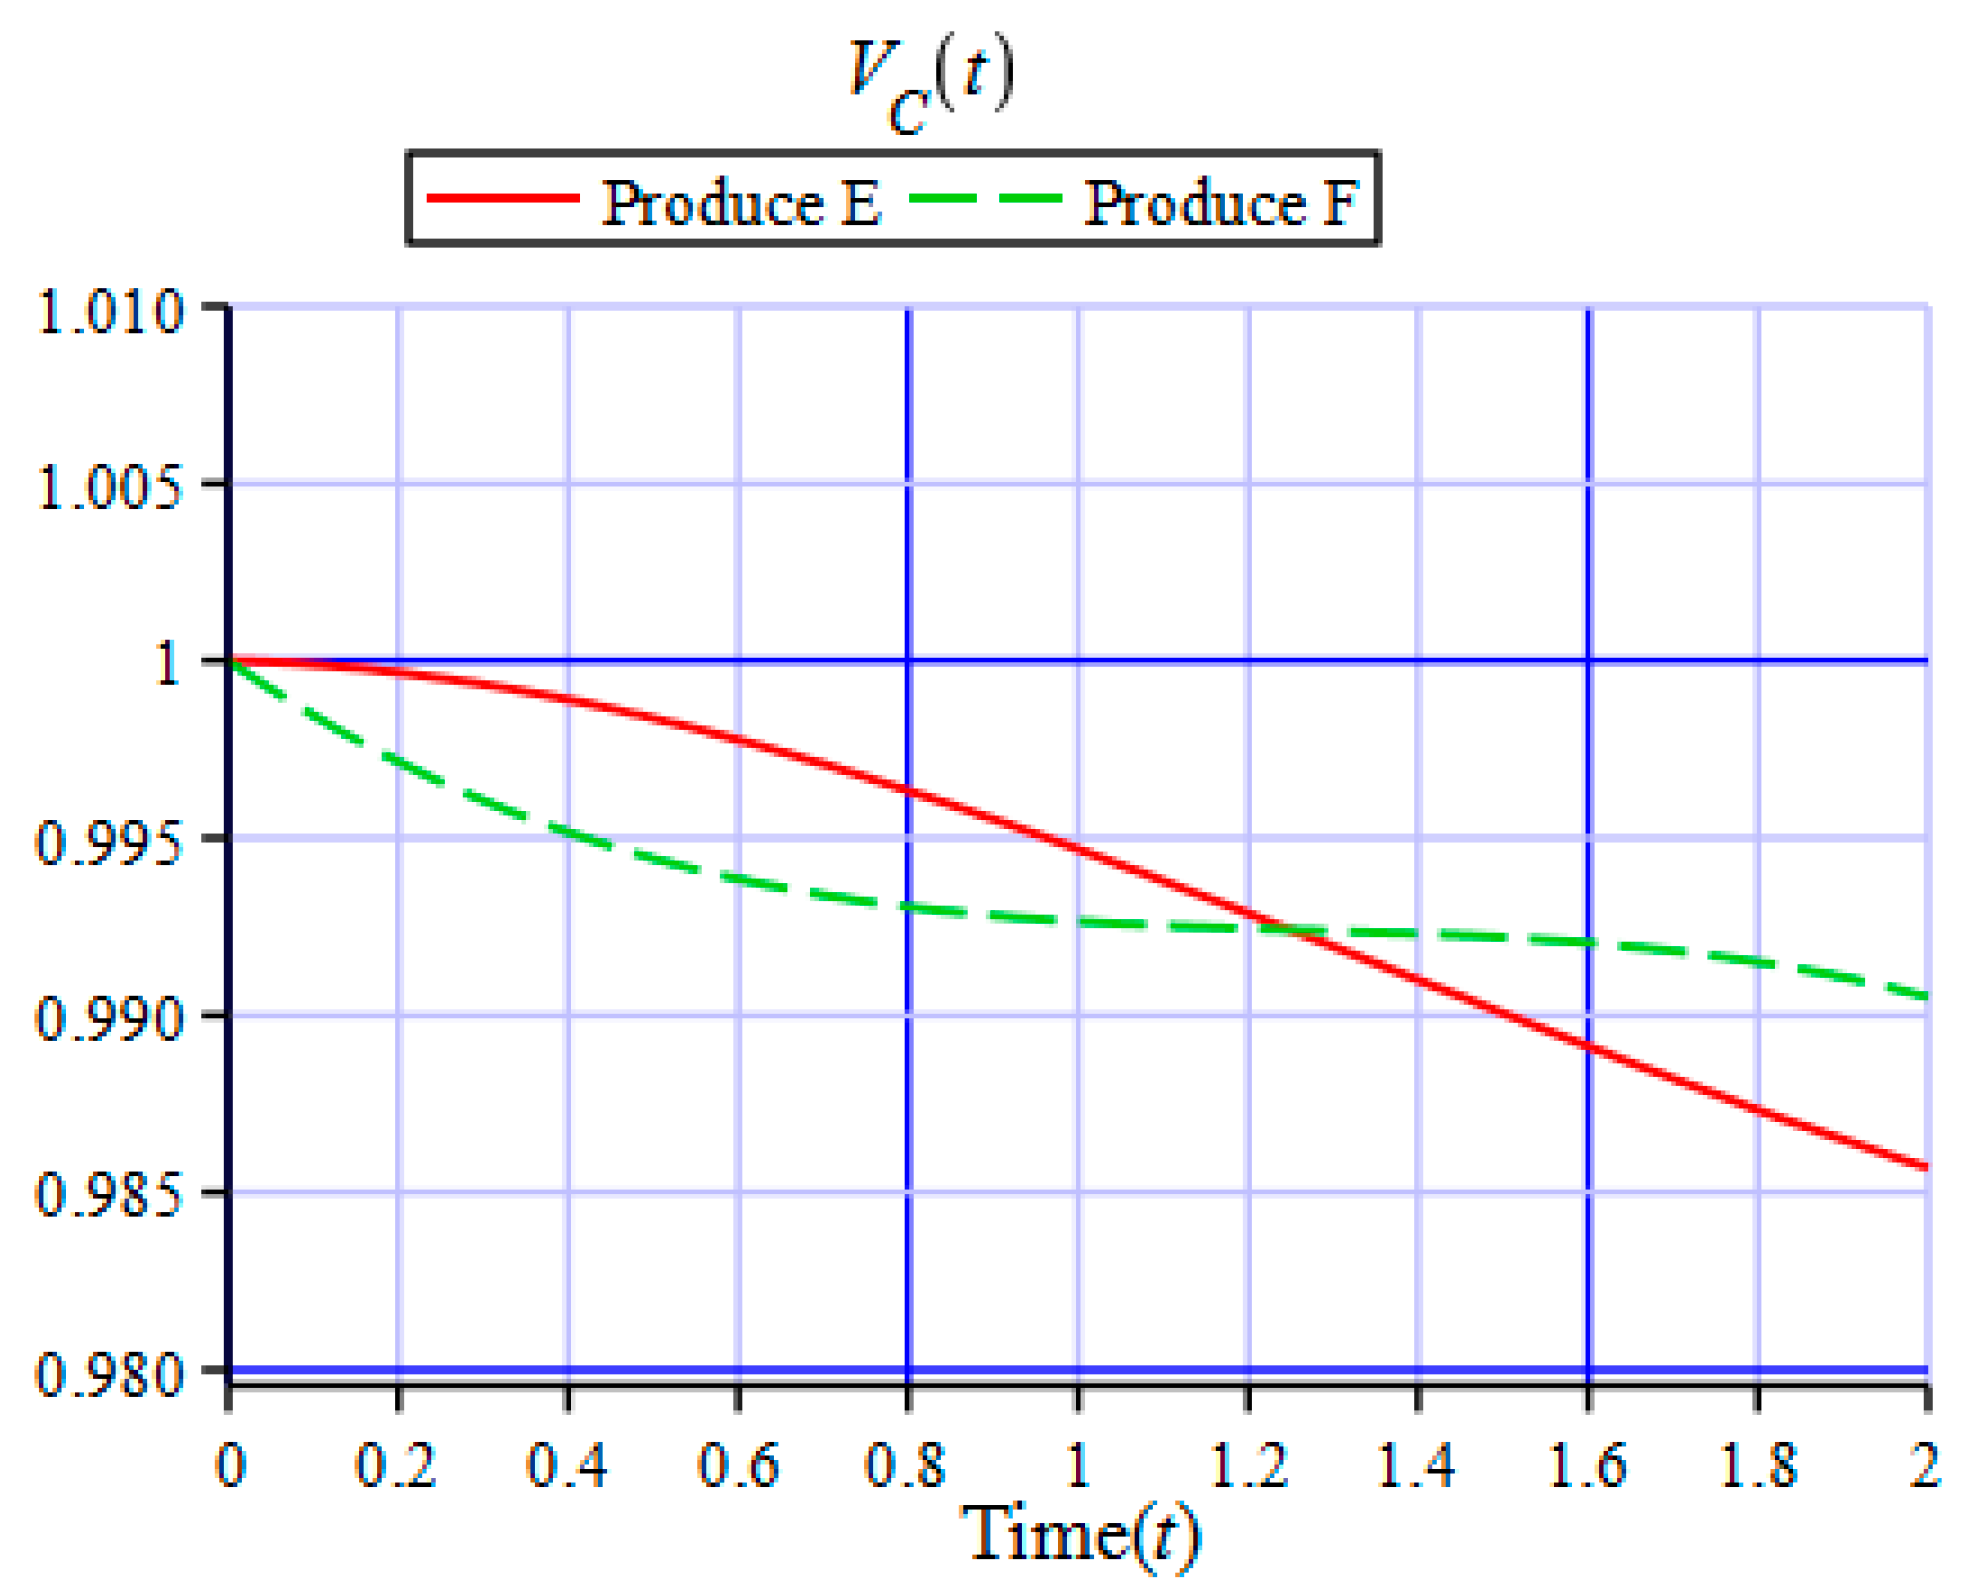
Gaming Notebooks: It can be seen from Figure 13 that as time progresses, the deterioration of product purchasing cost CP(t) becomes greater than the deterioration of product value VP(t) for both case products E and F. Hence, after t = 0, consumer value VC(t) starts to decrease immediately. This can be explained since audio–visual-type products have high specifications and the difference between older and newly released products is small. However, the reduction in the sales price is still greater than the reduction in specifications and functions (product value); therefore, for high-specification notebook products, consumers should buy them immediately after the product release to get the maximum consumer value.
The most appropriate time of purchase and the maximum normalized consumer value eco-efficiency index (VCE’) for case products A–F are shown in Figure 14 and Table 7; t = 0.55, 0.35, 0.77, 0.84, 0, and 0.48 year are the points of maximum consumer value for case products A–F, respectively. These times are the best times to purchase the product, and after the suggested times, the deterioration of product value will begin to become greater than the product purchasing cost; hence, a reduction in consumer value will occur.

3.4. Suggested Purchasing Order for Different Groups of Consumers

This study considers the preferences of consumers during product purchasing selection and came up with four different consumer groups with different preferences to investigate the differences in product purchasing orders. These groups are the brand and function conscious group, price and cost conscious group, environmentally conscious group, and unbiased and indifferent group. The weightings for group preferences are defined in Table 8, and the brand and function conscious group has a higher weight in product value, the price and cost conscious group has a higher weight in product cost, and the environmentally conscious group has a higher weight in product energy consumption. For the indifferent consumer group, the weightings of three key weights are the same. TOPSIS is used to calculate the suggested product purchasing order solution with respect to time to provide a reference for consumers during product purchase.
The TOPSIS decision factors are product value, product purchasing cost, and product energy consumption in this study. A decision matrix is used to calculate the suggested purchasing order of case products in different seasons. The explanation of the steps to calculate the suggested purchasing order in the first season (t = 0.25) for the indifferent consumer group are shown below.
(1) Establish a decision matrix (D)
The decision matrix is established using the data of the notebook computer case products A–F obtained above. The decision matrix is shown below:
D =   V P         C p         E P A B C D E F [ 0.9604 0.9175 0.9421 0.8984 0.6923 1.0000 0.9566 0.9334 0.9331 0.9054 0.7083 0.7500 0.9823 0.9877 0.9839 0.9932 1.5000 1.0455 ]
(2) Establish a standardized evaluation matrix (R)
In this phase, the TOPSIS decision matrix D is normalized using Equation (18) and different units are converted to the same unit to obtain matrix R for a convenient comparison.
R =   V P                 C p                 E P A B C D E F [ 0.4098600 0.3915515 0.4076994 0.3887997 0.2853452 0.4121653 0.4082448 0.3983117 0.4037879 0.3918337 0.2919504 0.3091239 0.4191914 0.4215029 0.4257767 0.4298278 0.6182479 0.4309000   ]
(3) Calculate the weighed normalized decision matrix (V)
The weighted normalized decision matrix V is obtained using Equation (19). The decision factor weightings shown in Table 8 are used differently for various consumer groups.
V =   V P                 C p                 E P A B C D E F [ 0.1364834 0.1303867 0.1357639 0.1294703 0.0950199 0.1372510 0.1359455 0.1326378 0.1344614 0.1304806 0.0972195 0.1029383 0.1395907 0.1403605 0.1417836 0.1431326 0.2058765 0.1434897 ]
(4) Determine the positive alternative (A+) and the negative alternative (A)
The positive solution A+ and the negative-ideal solution A sets of the various decision factors are obtained from matrix V using Equations (20) and (21), respectively. The product value is categorized as the larger the better, with the maximum value as the ideal solution, whereas product cost and energy consumption are categorized as the smaller the better, with the minimum values as the ideal solution:
A + = { V V p   ,   + V C p   ,   + V E p   ,   + } = { 0.1403605 ,   0.1294703 ,   0.0950199 }
A + = { V V p   ,   V C p   ,   V E p   ,   } = { 0.1303867 ,   0.1431326 ,   0.2058765 }
(5) Calculate the degree of separation
After finding the ideal solution A+ and negative-solution A for each decision factor, using Equations (22) and (23), respectively, we can calculate S+ and S. S+ is the distance between each notebook computer solution and A+, while S is the distance between each notebook computer solution and A. The results are shown in Table 9.
(6) Calculate the degree of similarity and choose the best alternative from C*
After finding the measurements points S+ and S for each notebook computer solution, Equation (24) is used to calculate the corresponding degree of similarity C*, as shown in Table 10. The order of purchasing is shown and case product C has the best value among other products. This decision helps consumers to choose the products to purchase by considering the product value, product cost, and product energy consumption.
The calculation steps mentioned above are going to be used to find the suggested optimized purchasing order for the different types of consumers (brand and function, price and cost, environmentally conscious and indifferent consumer groups) during different seasons and are shown in Figure 15, Figure 16, Figure 17 and Figure 18.
(1)
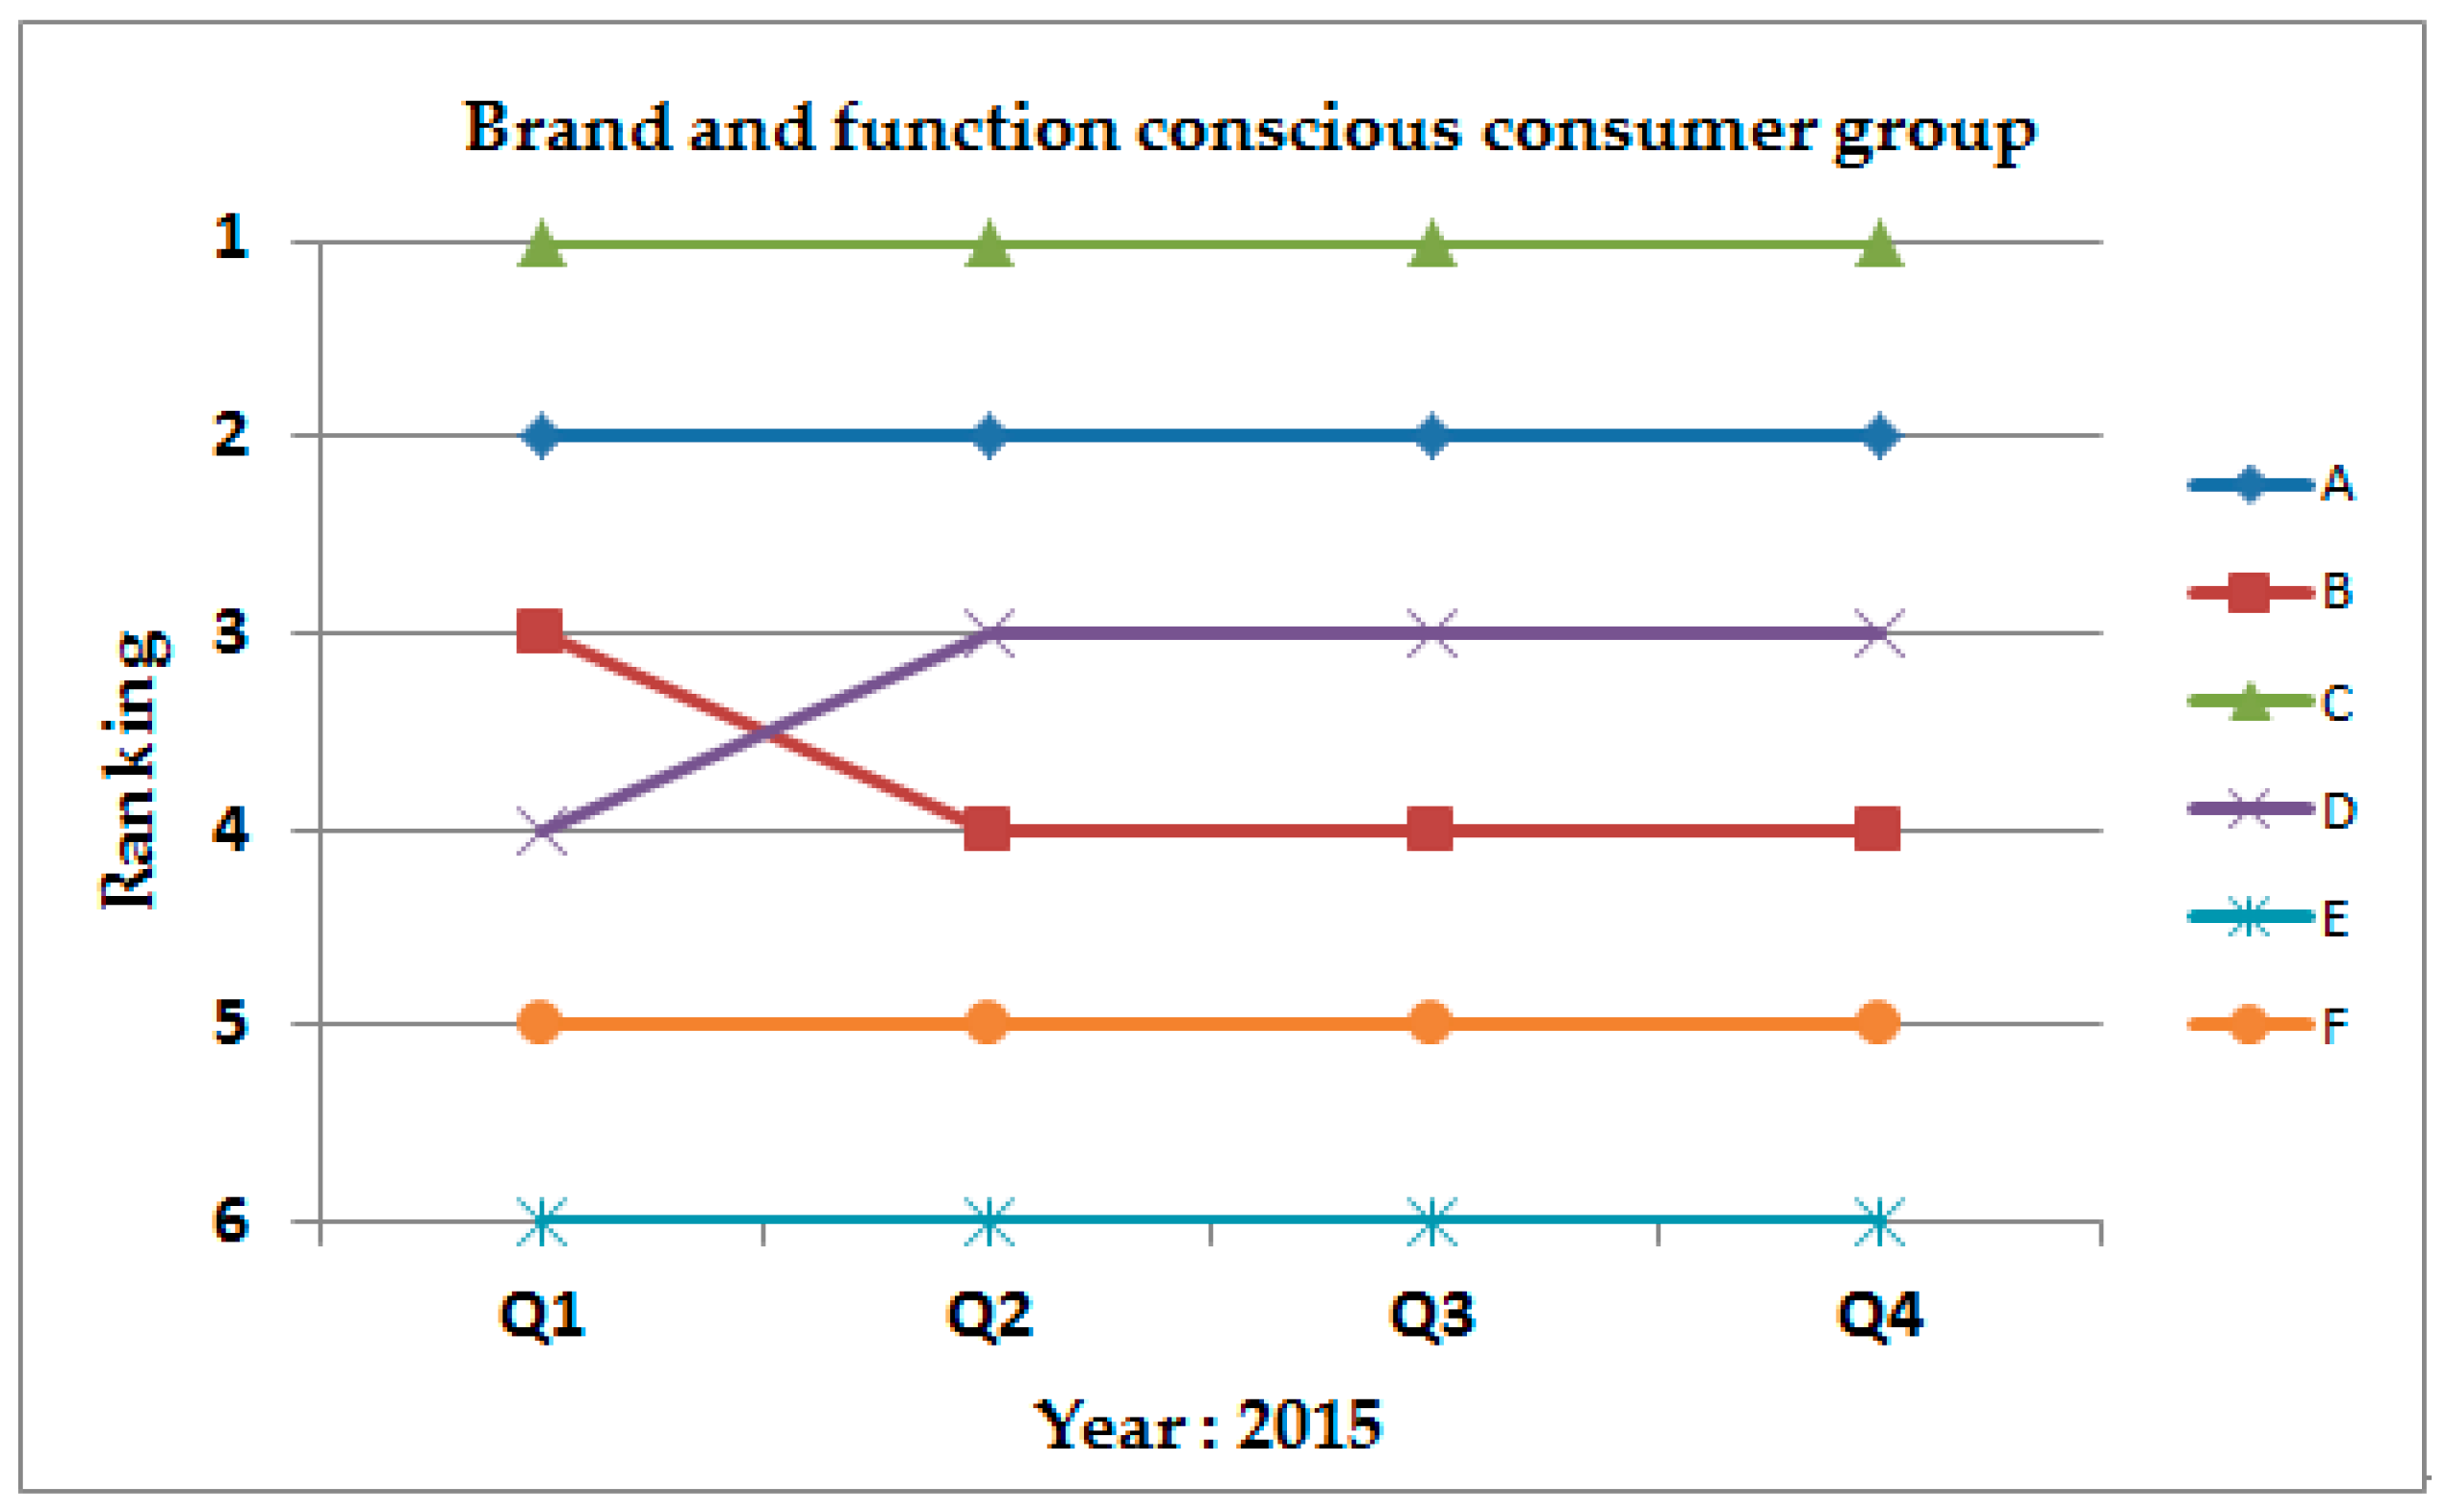
Brand-conscious and function-conscious consumers have higher sensitivity to product brand, function, and specifications, as shown in Figure 15. Hence, case product C, which has higher brand value and specifications, will be their preference. Owing to the high deterioration of case product B’s function and specification, its ranking is lowered, whereas the rankings of case products E and F, which have higher functions and specifications, did not change significantly.
(2)
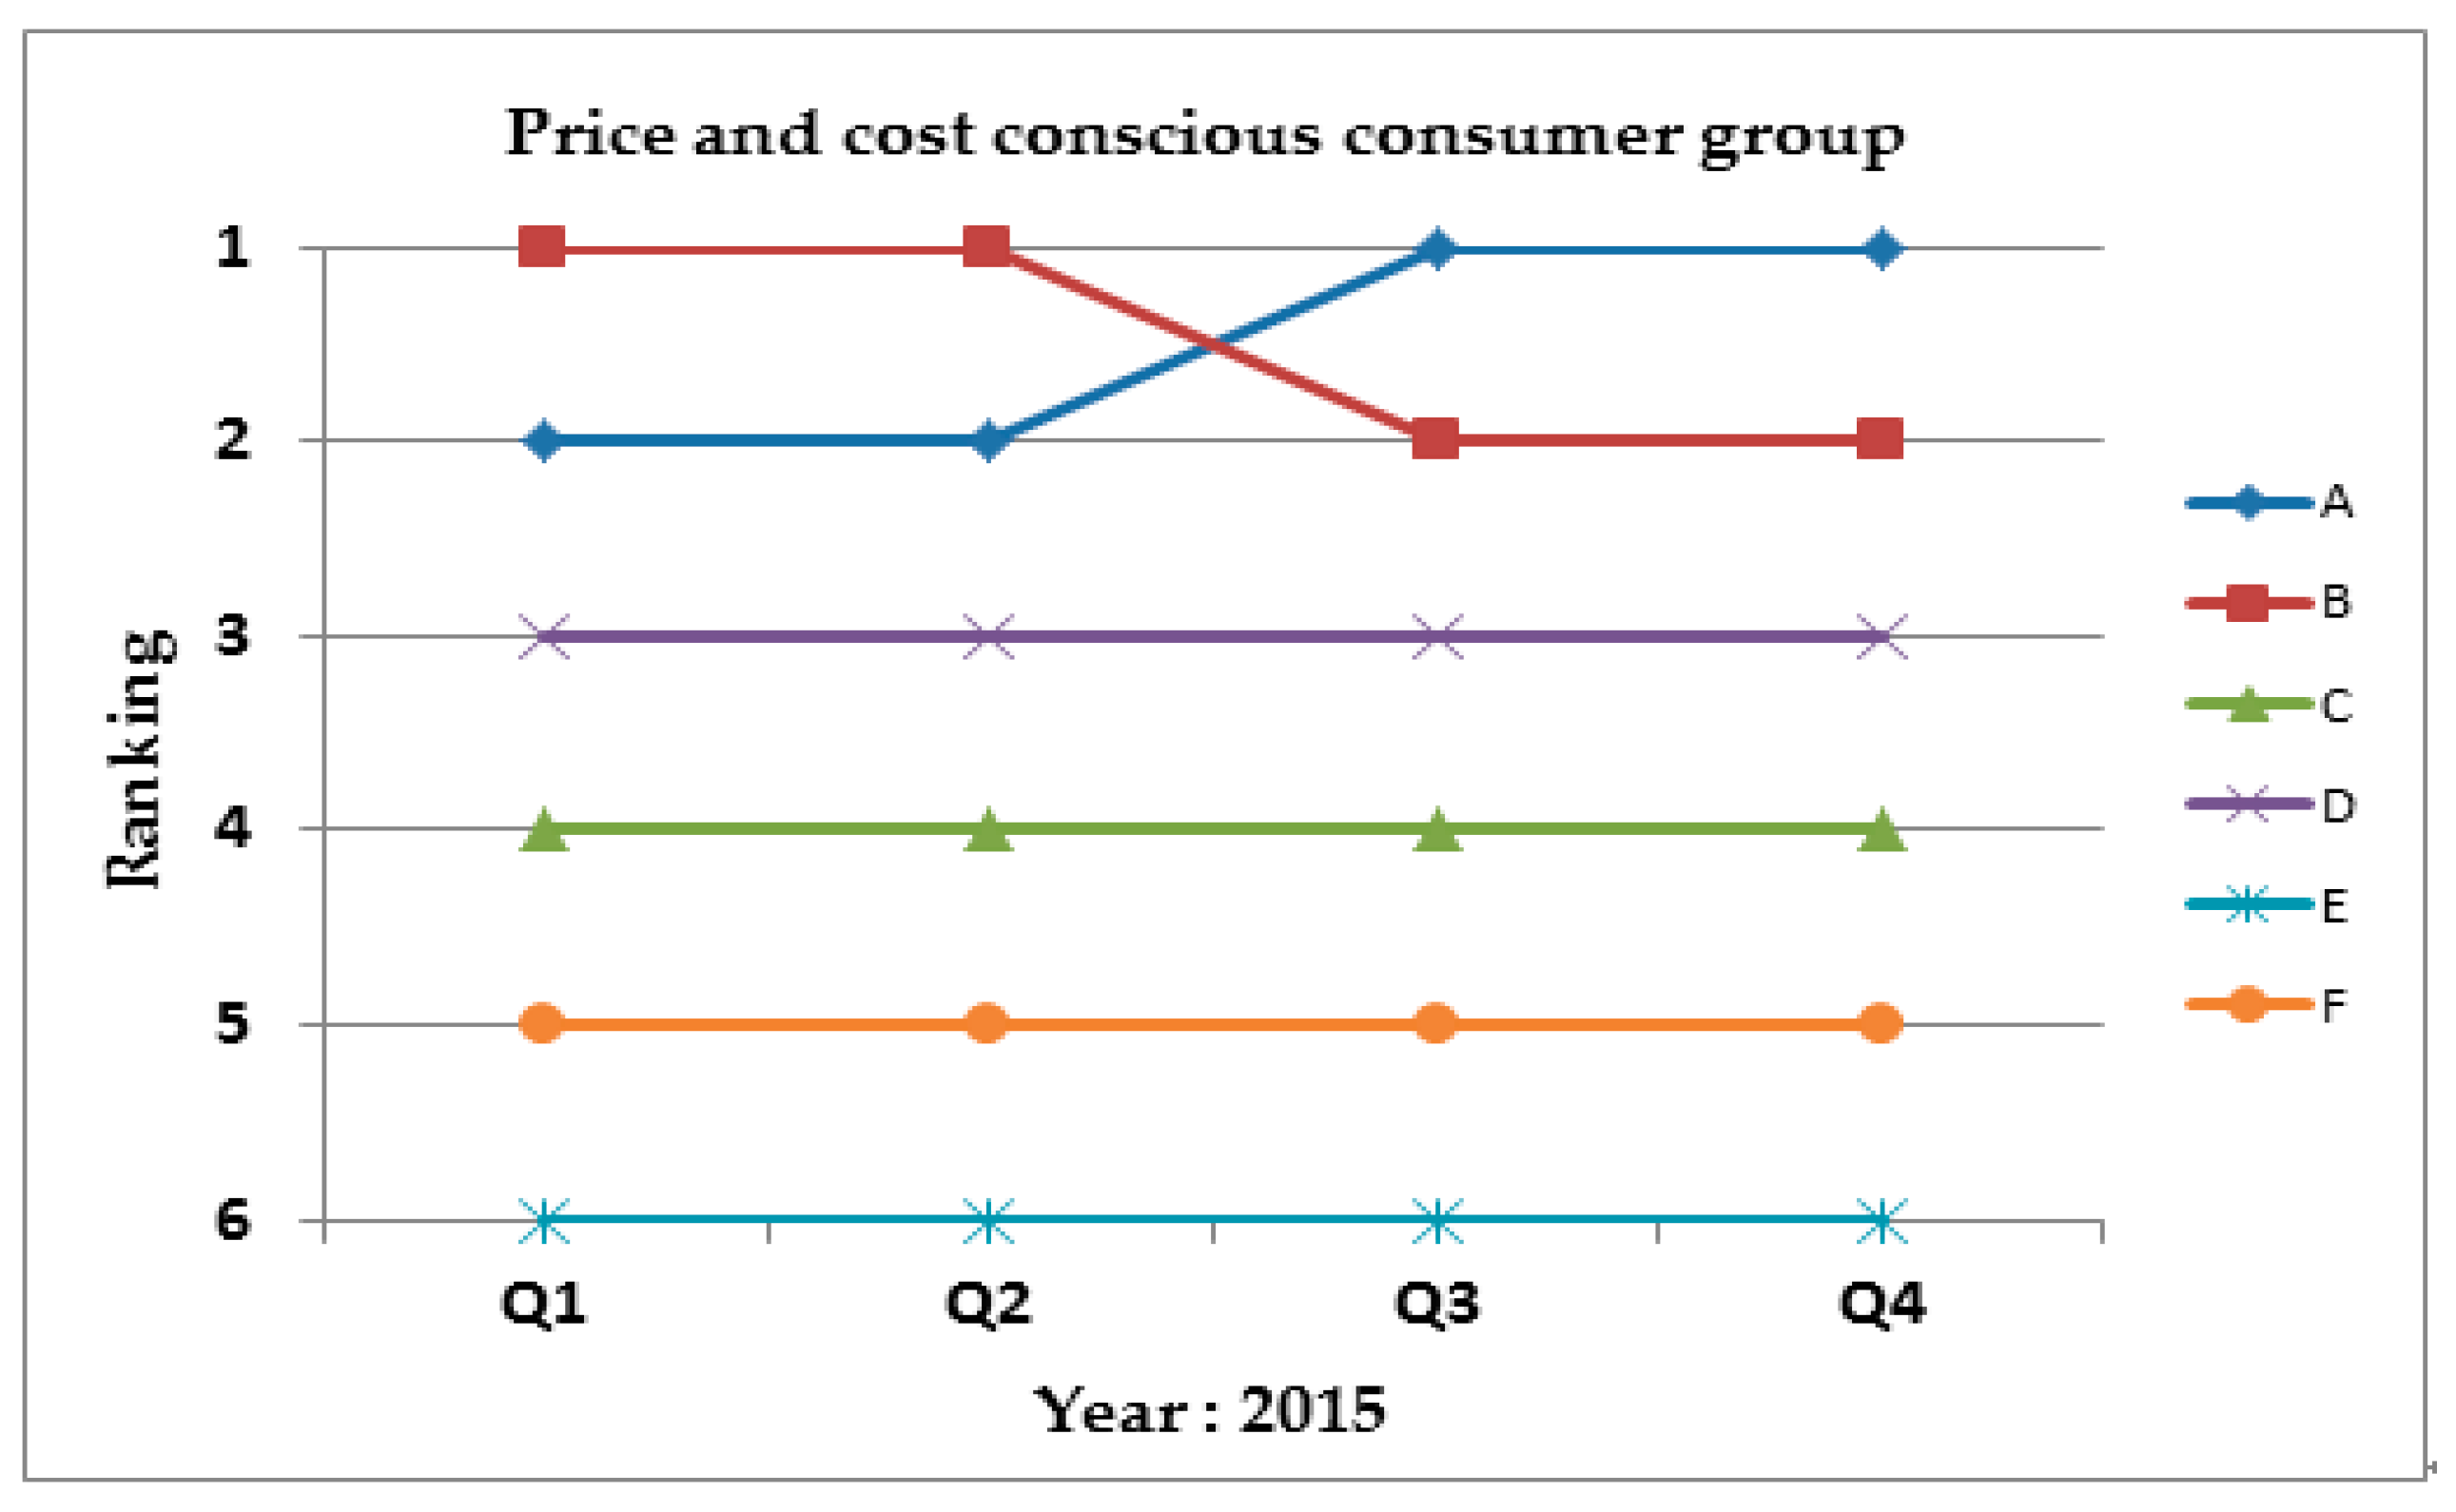
As for the price-conscious and cost-conscious consumers, shown in Figure 16, after the release of new products, the prices of the ultrabook products A and B dropped significantly. However, owing to case product A’s high brand value, it was able to better maintain consumer value over time and was still the preferred choice for consumers. Other types of products were priced highly and did not show significant price reductions. For consumers that place great importance on price and costs, these products were not as enticing and ranked low.
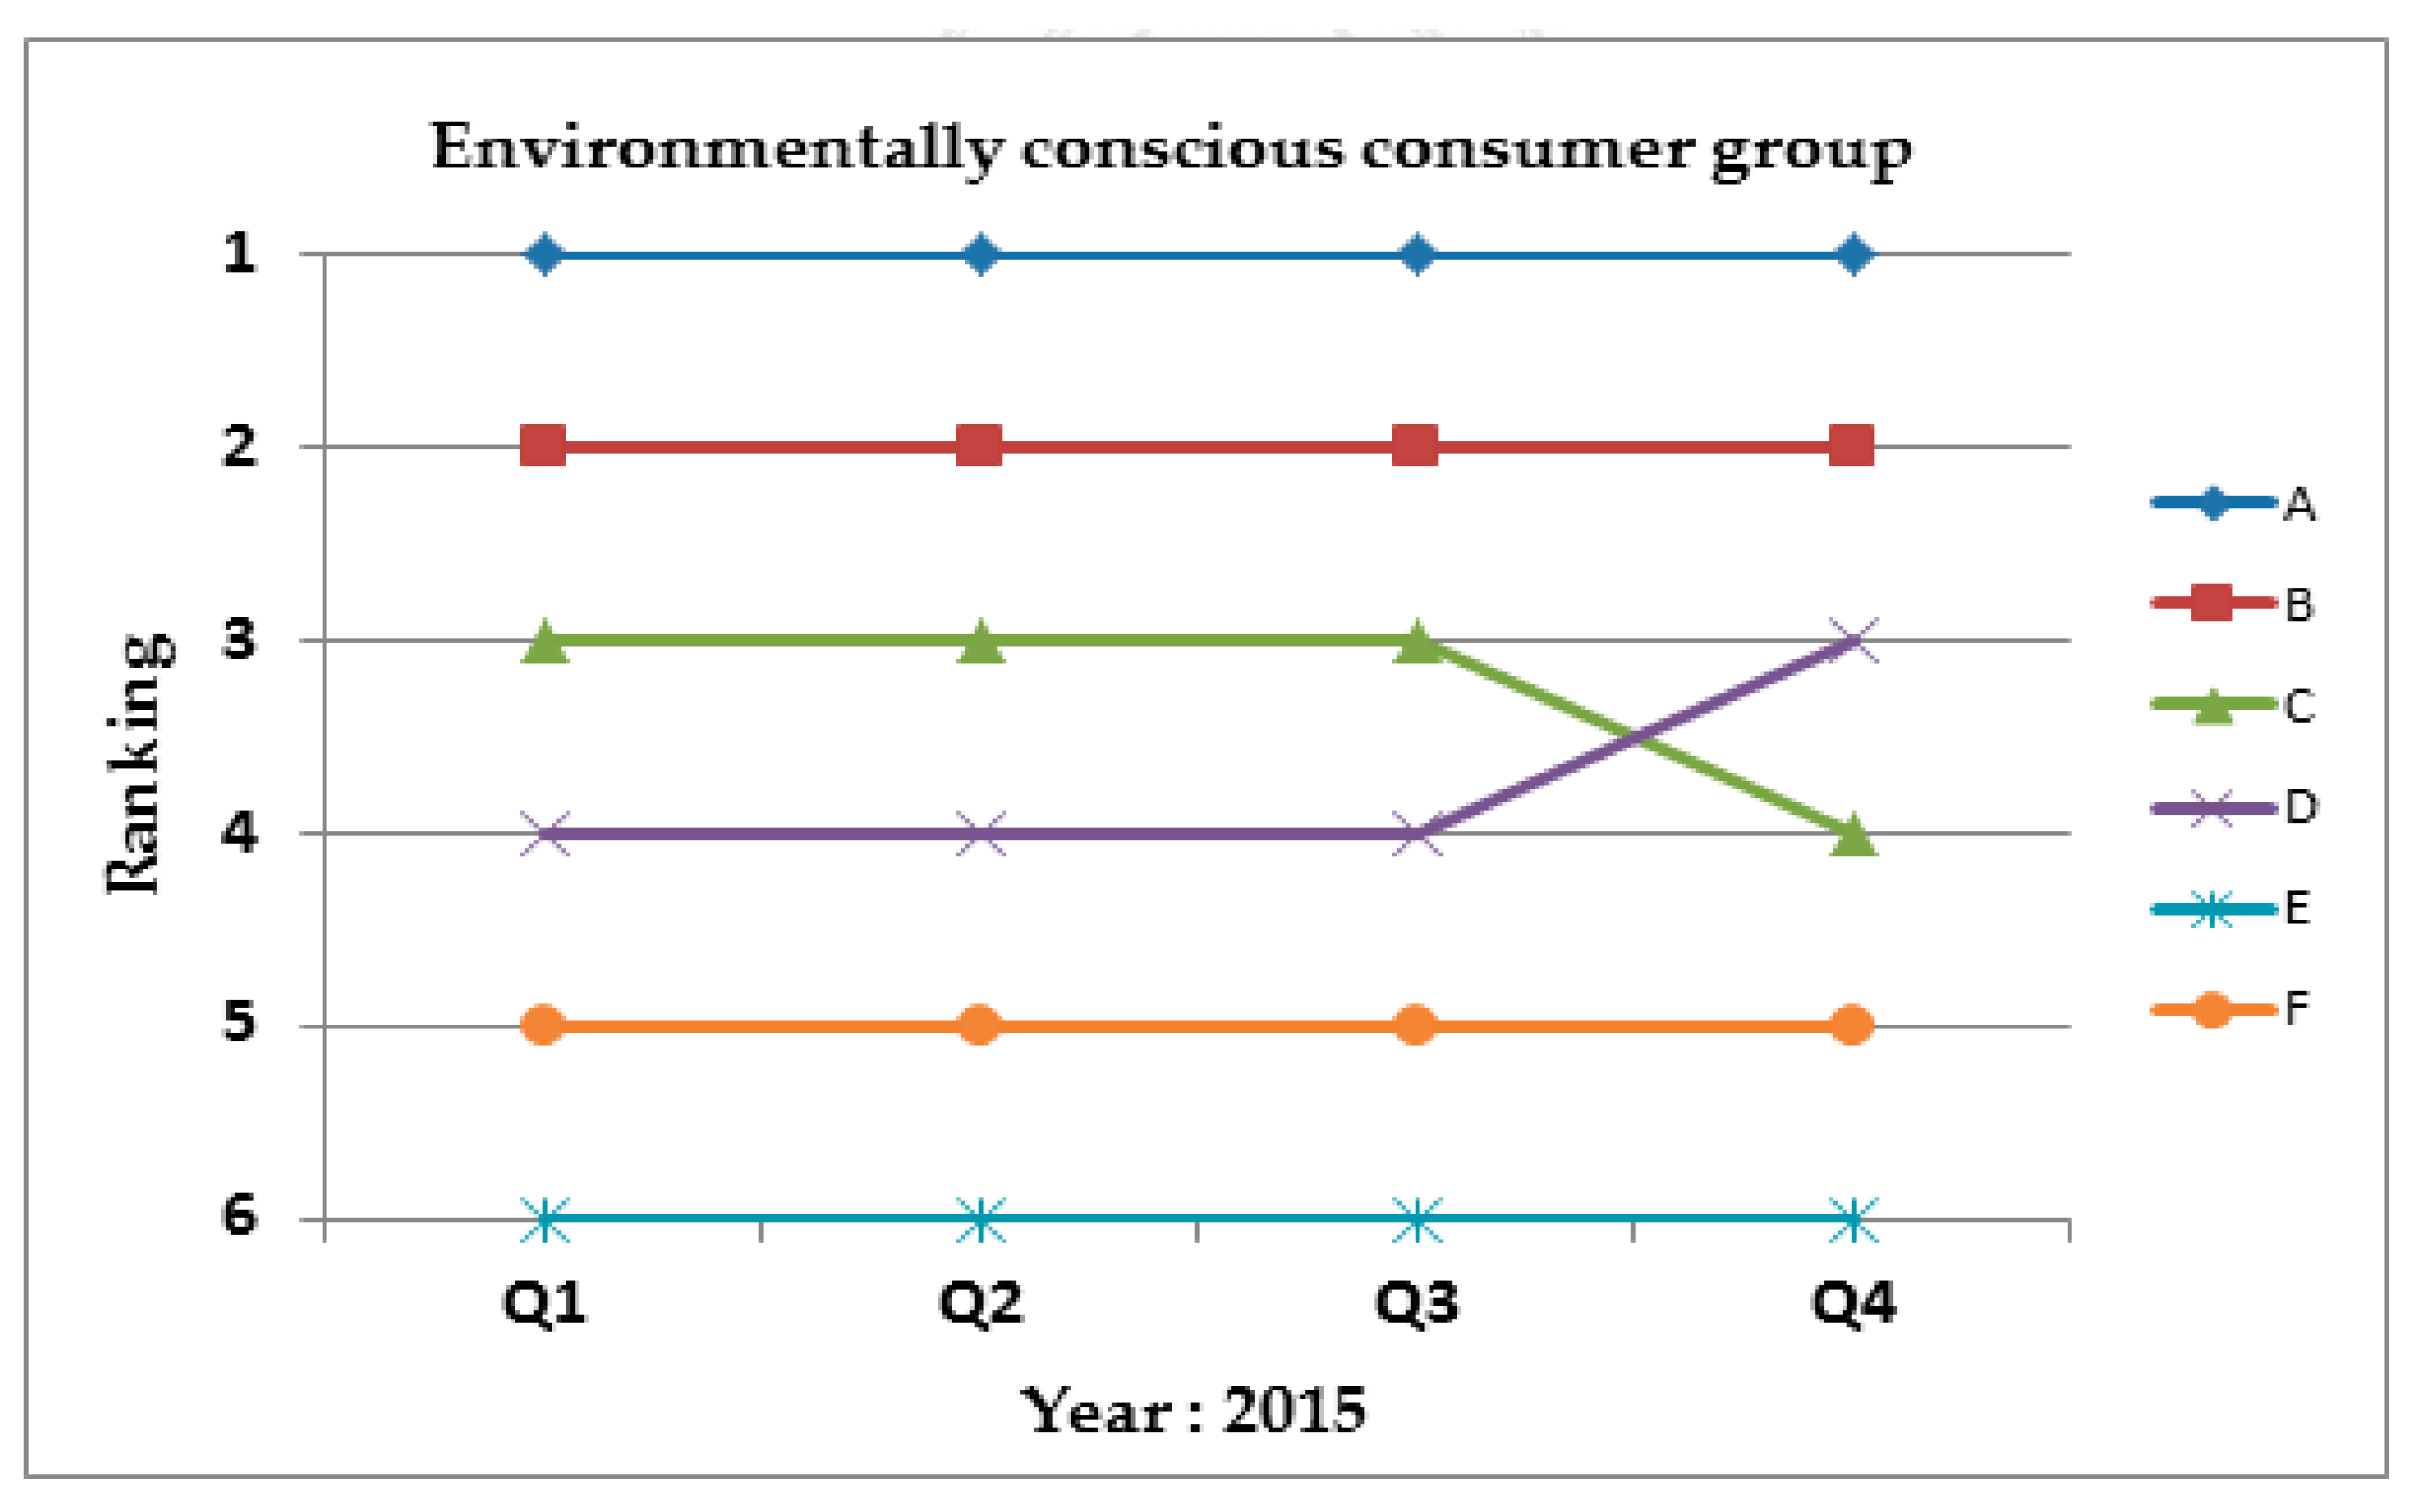
(3)
Environmentally conscious consumers, shown in Figure 17, are highly sensitive to product energy consumption performance; hence, owing to functional demands, audio–visual-type computers with high-energy consumption components are ranked last in terms of the preference of this group. Owing to the lightweight, convenience, and long-term use of ultrabook notebooks, their energy consumption performance is better than other types of products. Hence, they are the preferred choice for environmentally conscious consumer groups.
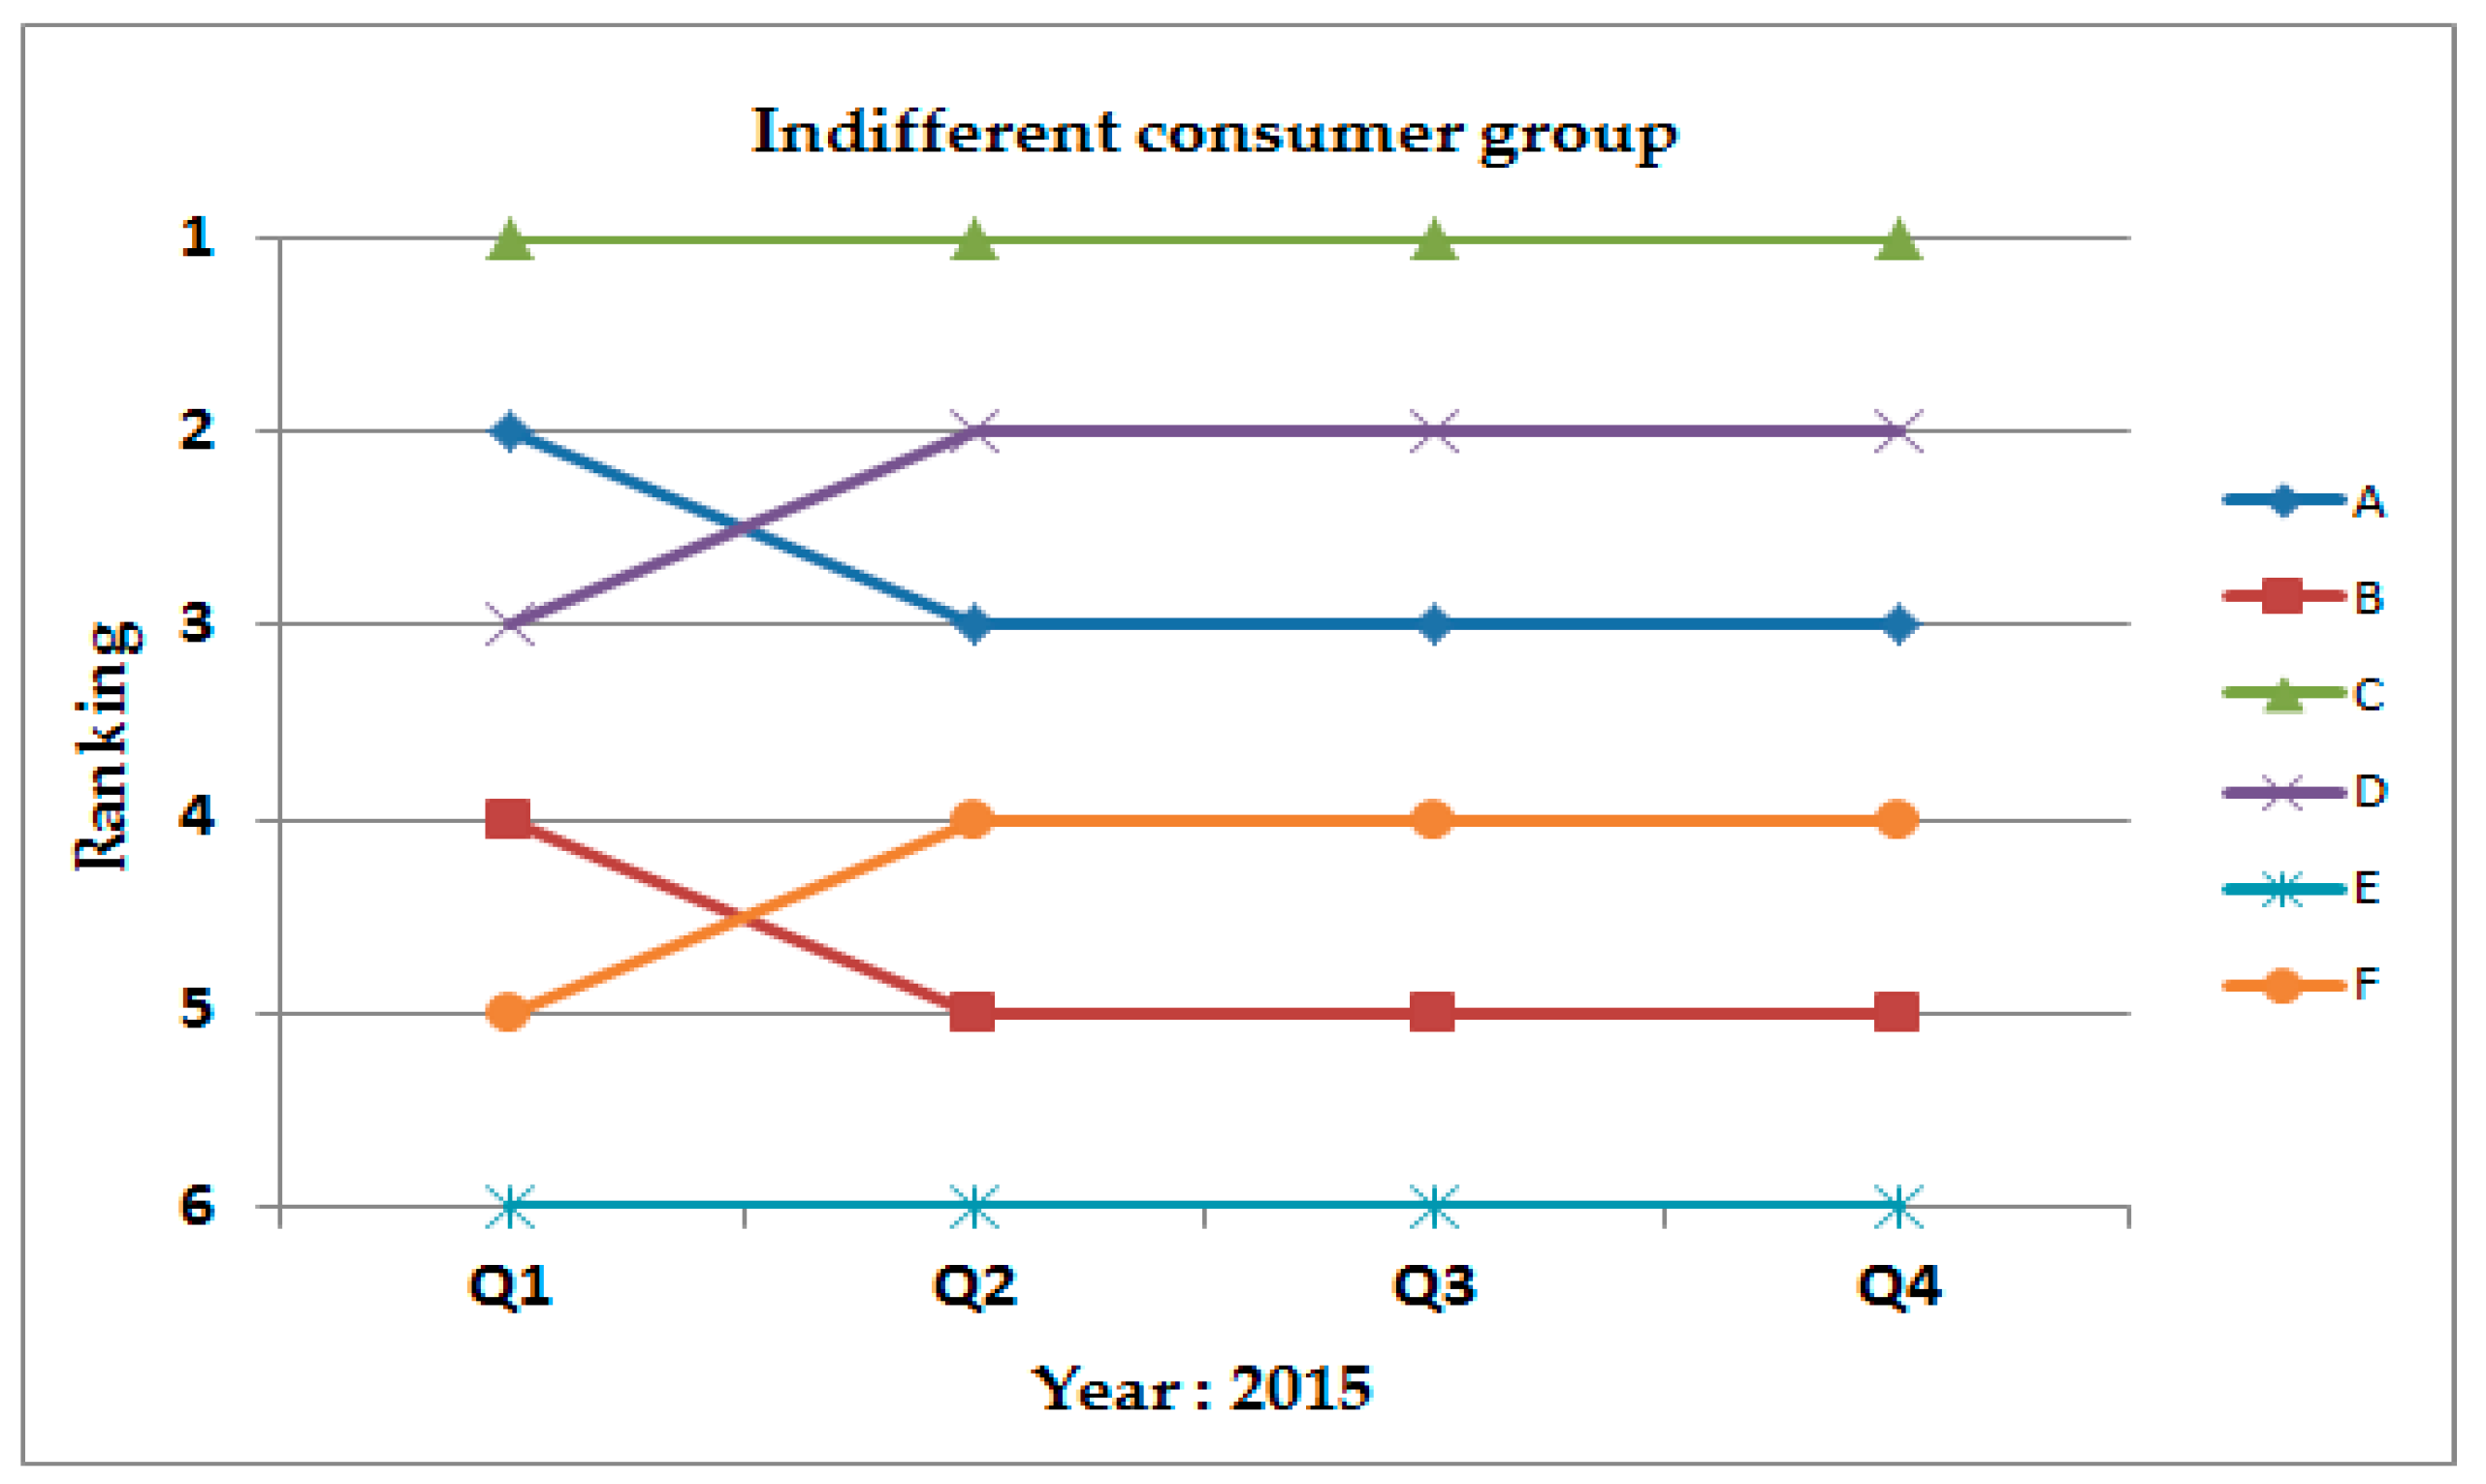
(4)
As for the indifferent group, shown in Figure 18, they have equal preference on product value, purchasing cost, and eco-efficiency. They can be used as a reference for purchasing by regular consumers. Changes in the ultrabook products happen at any time and the consumer value can reduce at any time. This is because in 2015, these types of notebook computers were the main products for every manufacturer and were affected by new products entering the market. This led to high deterioration in product value in the second season. However, owing to the low impact of new products, general-use notebook computers maintained their good purchasing ranking.

4. Discussion

This study develops a consumer value-time function and evaluation model to find the most appropriate time to make a purchase. Using model research, it is found that ultrabooks are severely affected by the release of new products onto the market and should be bought early for obtaining better value, whereas business notebooks are not affected significantly by the updated specifications of new products and should be bought when their price drops so as to obtain the best value. As for gaming notebooks, owing to their high specifications and low market price reduction, it is best to buy them just when they are released to obtain the maximum value.
Furthermore, we also conducted product selection order investigation for different groups of consumers toward all of the product types. We found that ultrabooks were the most suitable for price-conscious and environmentally conscious groups and that Business Notebooks were the most suitable for consumers that were indifferent (general consumers). Owing to the high brand value of ultrabook Product A and the general-use of Product C, they are more suitable for brand-conscious and function-conscious consumers. As for gaming notebooks, they are ranked relatively low in the purchase order suggestions of all four consumer groups considered owing to its high selling price and low price reductions. This product type is more suited for special consumer groups, such as gamers.
The above findings can serve as a reference to branding companies for designing and selling their products. On the other hand, the study develops a model with more factors to consider, not only the price or cost but also value and environmental impact. This can also serve as a reference for consumers when they want to purchase a product.

5. Conclusions

This study used the concept of value engineering to develop a model for making decisions of purchasing a product and the notebook computer was used as an example. We formulated a weighted evaluation value model for consumers to make a purchasing decision that considered consumer value (defined by the product value and product cost) and environmental impact of the product with the inclusion of the time factor. This decision would determine the most suitable time for consumers to make a purchase thus allowing consumers to gain the greatest value from the product. With this model, we also compared three different notebook computer types (using two computers per product type to explore their differences. Meanwhile, this study developed another model, which used the TOPSIS method with three factors; product value, product-purchasing cost, and the product energy consumption as the previous model to find the suggested purchasing order for the three customer groups at different times. The findings showed that to obtain better value from ultrabooks it is better to buy them early, not very long after release because they are severely affected by the release of new products onto the market. On the other hand, to obtain the best value from business notebooks it is best to buy them later, when their price drops because they are not significantly affected by the updated specifications of new products. As for gaming notebooks, it is best to buy them as soon as they are released to obtain the maximum value due to their low market price reduction and high specifications.
This study provided more factors to consider, not just the price or cost but also value and environmental impact, when the consumers want to purchase a product. Moreover, according to the approaches used in this study, our developed models could be used for other products as long as their related data are collected.
In recent years, the product renting and sharing economy has continued to develop. Many products have gradually been available for rental as a replacement of purchasing. In future studies, this research can be extended to create a product rental time function model to investigate the relation between consumer product value and environmental impact. Environmental evaluation standards can be added on top of the eco-efficiency index for example, carbon emissions produced for manufacturing a product can be added to the eco-efficiency evaluation model for obtaining a more complete picture.

Author Contributions

Both authors designed the research and wrote the paper. Y.-T.F. collected and analyzed the data. H.R. controlled the quality assurance.

Funding

This work is supported in part by the Ministry of Science and Technology of Republic of China under grant MOST 107-2221-E-033-054-MY3.

Acknowledgments

This work is supported in part by the Ministry of Science and Technology of Republic of China under grant MOST 107-2221-E-033-054-MY3.

Conflicts of Interest

The authors declare no conflict of interest.

References

  1. United States Environmental Protection Agency (USEPA). Electronics Waste Management in the United States through 2009. Available online: http://www.epa.gov/wastes/conserve/materials/ecycling/docs/fullbaselinereport2011.pdf (accessed on 10 September 2016).
  2. Teehan, P.; Kandlikar, M. Comparing embodied Greenhouse Gas emissions of modern computing and electronics products. Environ. Sci. Technol. 2013, 47, 3997–4003. [Google Scholar] [CrossRef] [PubMed]
  3. Dodd, N.; Wolf, O. Development of European Eco-Label and Green Public Procurement Criteria for Desktop and Notebook Computers TECHNICAL REPORT, TASK 1 Scope and Definitions, (Draft) Working Document; European Commission Joint Research Centre, Institute for Prospective Technological Studies (IPTS): Seville, Spain, 2013. [Google Scholar]
  4. Tasci, A.D.A. A critical review of consumer value and its complex relationships in the consumer-based brand equity network. J. Destin. Mark. Manag. 2016, 5, 171–191. [Google Scholar] [CrossRef]
  5. Schult, D.E.; Barnes, B.E. Strategic Advertising Campaigns, 4th ed.; NTC Business Books: Lincolnwood, IL, USA, 1995. [Google Scholar]
  6. Zeithaml, V.A. Consumer perceptions of price, quality, and value: A means-end model and synthesis of evidence. J. Mark. 1998, 52, 2–22. [Google Scholar] [CrossRef]
  7. Hwang, C.L.; Yoon, K. Multiple Attribute Decision Making Methods and Applications: A State-of-the-Art Survey; Springer: New York, NY, USA, 1981. [Google Scholar]
  8. Deng, H.; Yeh, C.H.; Willis, R.J. Inter-company comparison using modified TOPSIS with objective weights. Comput. Oper. Res. 2000, 27, 963–973. [Google Scholar] [CrossRef]
  9. Abo-Sinna, M.A.; Amer, A.H. Extensions of TOPSIS for multi-objective large-scale nonlinear programming problems. Appl. Math. Comput. 2005, 162, 243–256. [Google Scholar] [CrossRef]
  10. Shih, H.S.; Shyur, H.J.; Lee, E.S. An extension of TOPSIS for group decision making. Math. Comput. Model. 2007, 45, 801–813. [Google Scholar] [CrossRef]
  11. Kotler, P. Marketing Management: The Millennium Edition; Prentice Hall: Upper Saddle River, NJ, USA, 2000. [Google Scholar]
  12. Roy, R.; Colmer, S.; Griggs, T. Estimating the cost of a new technology intensive automotive product: A case study approach. Int. J. Prod. Econ. 2004, 97, 210–226. [Google Scholar] [CrossRef] [Green Version]
  13. Adam, L.; Finn, W. Value in business markets: What do we know? Where are we going? Ind. Mark. Manag. 2005, 34, 732–748. [Google Scholar] [Green Version]
  14. Cooper, T. Inadequate life? evidence of consumer attitudes to product obsolescence. J. Consum. Policy 2004, 27, 421–449. [Google Scholar] [CrossRef]
  15. Yugang, Y.; Xiaoya, H.; Guiping, H. Optimal production for manufacturers considering consumer environmental awareness and green subsidies. Int. J. Prod. Econ. 2016, 182, 397–408. [Google Scholar]
  16. Kondoh, S.; Masui, K.; Hattori, M.; Mishima, N.; Matsumoto, M. Total performance analysis of product life cycle considering the deterioration and obsolescence of product value. Int. J. Prod. Dev. 2008, 6, 334–352. [Google Scholar] [CrossRef]
  17. Fang, Y.T.; Rau, H. Optimal Consumer Electronics Product Take-Back Time with Consideration of Consumer Value. Sustainability 2017, 9, 385. [Google Scholar] [CrossRef]
  18. Amazon. Price History Charts. 2016. Available online: https://camelcamelcamel.com/ (accessed on 10 February 2016).
  19. European Commission. Environment. Available online: http://ec.europa.eu/environment/waste/weee/index_en.htm (accessed on 30 September 2018).
  20. WBCSD. Eco-Efficiency Learning Model. Available online: https://docs.wbcsd.org/2006/08/EfficiencyLearningModule.pdf (accessed on 30 September 2018).
  21. Apple Official Website. Available online: https://support.apple.com/kb/SP714?viewlocale=zh_TW&locale=ja_JP (accessed on 20 September 2018).
  22. Kocpc. Available online: https://www.kocpc.com.tw/archives/13517 (accessed on 20 September 2018).
  23. Apple Official Website. Available online: https://support.apple.com/kb/SP715?locale=zh_TW&viewlocale=zh_TW (accessed on 20 September 2018).
  24. HP Official Website. Available online: https://support.hp.com/tw-zh/product/hp-elitebook-840-g2-notebook-pc/7343202/document/c04556099#AbT3 (accessed on 20 September 2018).
  25. MSI Official Website. Available online: https://tw.msi.com/Laptop/GT80-2QE-Titan-SLI/Specification (accessed on 20 September 2018).
  26. ASUS Official Website. Available online: https://www.asus.com/tw/Laptops/ROG-G751JY/specifications/ (accessed on 20 September 2018).
  27. ASUS Official Website. Available online: https://www.asus.com/tw/Laptops/ASUS-ZenBook-UX330UA/specifications/ (accessed on 20 September 2018).
  28. Amazon. Available online: https://www.amazon.com/HP-13-ab016nr-Notebook-i5-7200U-Windows/dp/B01LZKY7RB (accessed on 20 September 2018).
  29. DELL Official Website. Available online: https://www.dell.com/au/partner/p/xps-13-9360-laptop/pd (accessed on 20 September 2018).
  30. Amazon. Available online: https://www.amazon.com/Lenovo-Ideapad-720S-13IKB-3840x2160-Laptop/dp/B07B1227CT (accessed on 20 September 2018).
  31. Geekbench 3 Software—MacBook Air Benchmarks. Available online: http://www.primatelabs.com/blog/2013/06/macbook-air-benchmarks/?utm_source=feedburner&utm_medium=feed&utm_campaign=Feed%3A+primatelabsblog+%28Primate+Labs+Blog%29 (accessed on 5 February 2016).
  32. PassMark Software—PC Benchmark and Test Software. Available online: http://www.cpubenchmark.net/ (accessed on 10 February 2016).
  33. IHS iSuppli, Teardowns & Cost Benchmarking. Available online: https://technology.ihs.com/Categories/450461/teardowns-cost-benchmarking (accessed on 10 February 2016).
Figure 1. Structure of the present study.
Sustainability 10 04664 g001
Figure 2. Product functional value deterioration curve for case product A.
Sustainability 10 04664 g002
Figure 3. Product functional value deterioration curve for case products A–F.
Sustainability 10 04664 g003
Figure 4. Product value-time function curve for case products A and B.
Sustainability 10 04664 g004
Figure 5. Product value-time function curve for case products C and D.
Sustainability 10 04664 g005
Figure 6. Product value-time function curve for case products E and F.
Sustainability 10 04664 g006
Figure 7. Purchase cost-time curve for case products A and B.
Sustainability 10 04664 g007
Figure 8. Product value and product purchasing cost-time function curves for ultrabooks.
Sustainability 10 04664 g008
Figure 9. Product value and product purchasing cost-time function curves for business notebooks.
Sustainability 10 04664 g009
Figure 10. Product value and product purchasing cost-time function curves for gaming notebooks.
Sustainability 10 04664 g010
Figure 11. Consumer value curve for ultrabooks.
Sustainability 10 04664 g011
Figure 12. Consumer value curve for business notebooks.
Sustainability 10 04664 g012
Figure 13. Consumer value curve for gaming notebooks.
Sustainability 10 04664 g013
Figure 14. Normalized consumer value eco-efficiency index curve for case products A–F.
Sustainability 10 04664 g014
Figure 15. Evaluation order for the suggested product purchase (brand-conscious and function-conscious consumer group).
Sustainability 10 04664 g015
Figure 16. Evaluation order for suggested product purchase (price- and cost-conscious consumer group).
Sustainability 10 04664 g016
Figure 17. Evaluation order for suggested product purchase (environmentally conscious consumer group).
Sustainability 10 04664 g017
Figure 18. Evaluation order for suggested product purchase (indifferent consumer group).
Sustainability 10 04664 g018
Table 1. Categories of notebook computers [21,22,23,24,25,26].
TypeScreen SizePrice Range (US$)Description
Ultrabook13″900–1700Light, portable
Business Notebook14″~15″500–2100Ordinary specs, office use
Gaming Notebook16″ (inclusive) and above600–4000Advanced specs, professional use
Table 2. Product specification of evaluated products [21,22,23,24,25,26].
Ultrabook (A)Ultrabook (B)Business Notebook (C)Business Notebook (D)Gaming Notebook (E)Gaming Notebook (F)
Introduction date2015/3/92015/2/252015/3/92015/3/312015/3/302015/3/9
Processor Type (Speed) Intel Core i5 6250UIntel Core i5 6200UIntel Core i7 5557UIntel Core i5-5200UIntel Core i7 5950HQIntel Core i7 4860HQ
RAM Type (Speed)DDR3 1600 MHz
4 GB
DDR3 1600 MHz
4 GB
DDR3 1866 MHz
8 GB
DDR3 1600 MHz
8 GB
DDR3L 32 GBDDR3L 16 GB
Video CardIntel HD Graphics 6000Intel HD Graphics 520Intel HD Graphics6100Intel HD Graphics 5500Intel HD Graphics 6000Intel HD Graphics 520
Display (Resolution)13.3″ (1440 × 900)13.3″ (1440 × 900)15.6″ (3840 × 2160)15.6″ (1600 × 900)18.4″ (1920 × 1080)17.3″ (1920 × 1080)
Hard DriveSSD 128 GSSD 128 GSSD 256 GB500 G 7200RPM1TB HDD 7200 + 512 G SSD1TB HDD 7200 + 256 G SSD
Battery life12 h8 h9.6 h10 h6 h6 h
Dimensions (H × W × D)1.7 × 32.5 × 22.7 cm1.23 × 32.4 × 22.6 cm1.8 × 31.4 × 21.9 cm2.1 × 33.9 × 23.7 cm4.9 × 45.6 × 33 cm2 × 41.6 × 31.8 cm
System weight1.35 kg1.2 kg1.58 kg1.55 kg4.8 kg4.8 kg
Power consumption45 W65 W85 W90 W330 W230 W
Original price1299 US$1099 US$1580 US$1530 US$3360 US$3160 US$
Table 3. Reference products.
TimeSeason 1Season 2Season 3Season 4
Code nameL1L2L3L4
TypeUltrabook (13″)Ultrabook (13″)Ultrabook (13″)Ultrabook (13″)
Product modelASUS Zenbook UX330CA [27]HP ENVY 13-ab016nr [28]Dell XPS 13-9360 [29]Lenovo 720S [30]
Processor Type (Speed) Intel Core i5 6200UIntel Core i5 7200UIntel Core i7 7300UIntel Core i7-7500U
RAM Type (Speed)DDR3 1600 MHz
8 GB
DDR3 1600 MHz
8 BG
DDR3 1866 MHz
8 GB
DDR3 1600 MHz
8 GB
Video CardIntel HD Graphics 520Intel HD Graphics 600Intel HD Graphics 620Intel HD Graphics 620
Display (Resolution)13.3″ (1920 × 1080)13.3″ (3200 × 1800)13.3″ (3200 × 1800)13.3″ (3840 × 2160)
Hard DriveSSD 128 GSSD 256 GSSD 128 GBSSD 512 GB
Battery life10 h12 h12 h16 h
Dimensions (H × W × D)1.36 × 32.3 × 22.2 cm1.1 × 30.4 × 21.6 cm1.85 × 30.4 × 22.6 cm1.09 × 31.3 × 21.8 cm
System weight1.2 kg1.18 kg1.2 kg1.1 kg
Power consumption65 W50 W50 W45 W
Table 4. Value of overall functional deterioration for case product A.
SpecificationCharacteristicsUnitPemPfmDpmWmDp
CPU/RAMGeekbench Performance 1Score ↑770081500.940.340.988
Graphic CardPassMark G3D Rating 2Score ↑223024000.930.13
DisplayResolutionPixel ↑1,296,0001,296,00010.17
Hard DrivePassMark Disk Rating 3Score ↑6500650010.09
USB PortsTransfer speedGbps ↑101010.01
BatteryMax standby timeHours ↑12101.200.15
DimensionsThicknesscm ↓1.71.360.080.03
WeightWeightkg ↓1.351.20.890.09
1 Geekbench uses a number of different benchmarks to measure performance, which includes Integer Performance, Loathing Point Performance, Memory Performance, and Stream Performance [31]. 2 G3D Rating conducts three different tests and then averages the results together to determine the PassMark 3D Mark for a system [32]. 3 Disk rating conducts three different tests, Disk Sequential Read, Disk Sequential Write, and Disk Random Seek RW and finally averages the results together to determine the PassMark Disk Mark for a system.
Table 5. Brand value of case products A–F.
Case ProductUltrabookBusiness NotebookGaming Notebook
ABCDEF
PriceUS$ 1299US$ 1099US$ 1580US$ 1530US$ 3360US$ 3160
Material costs + Manufacturing costsUS$ 618US$ 709US$ 822US$ 1055US$ 1429US$ 1239
Brand value2.11.551.921.452.352.55
Table 6. Product energy consumption index for case products A–F.
Case ProductProduct Energy Consumption Index Ep
t = Season 1t = Season 2t = Season 3t = Season 4
A0.69230.90.91
B11.31.31.4444
C0.94440.70830.70830.8095
D10.750.750.8571
E1.51.51.83331.8333
F1.04541.04541.27771.2777
Table 7. Most appropriate time to buy case products A–F.
Case ProductUltrabookBusiness NotebookGaming Notebook
ABCDEF
Most appropriate time to purchase (year)0.550.350.770.8400.48
Normalized consumer value eco-efficiency index1.031.011.051.0411..01
Table 8. Decision factor weightings for different consumer groups.
Consumer GroupProduct Value Weight (WVP)Product Cost Weight (WCP)Product Energy Consumption Weight (WEP)
Brand and function conscious0.50.250.25
Price and cost conscious0.250.50.25
Environmentally conscious0.250.250.5
Indifferent0.330.330.33
Table 9. Measurement points S+ and S of the case products.
Case ProductS+S
A0.0073920.111268
B0.0433930.069972
C0.0070170.109144
D0.0111070.103737
E0.1115410.009302
F0.0503590.063179
Table 10. Relative degree of similarity of case products A–F with the ideal solution.
Case ProductC*Order
A0.9377052
B0.6172294
C0.9395911
D0.9032883
E0.0769796
F0.5564605

