1. Introduction
Soil amendments such as natural products (compost and manure) or synthetic polymers are used to sustain good soil properties and optimum water resources for crop production in arid and semi-arid regions. Application of suitable soil amendments to develop soil properties has become an increasingly common option to improve the sustainability of agriculture in arid and semi-arid areas. In addition, the application of appropriate soil amendments can considerably improve soil chemical, physical, and biological properties [
1,
2,
3] and reduce the soil salinity and other stresses, i.e., water and nutrient deficiency [
4].
Biochar material is a carbon (C) rich organic material that can be produced from farm crop residue, waste manure, and forest residue. Biochar is highly heterogeneous, has high porosity and large specific surface area, and is dependent on feedstock types and pyrolysis conditions such as air exposure, duration of combustion, and temperature [
5].
Recently, the use of biochar in improving soil physical properties has been investigated by Obia et al. [
5], Baiamonte et al. [
6], and Laird et al. [
7]. Obia et al. [
5] evaluated the effects of maize cob biochar on the physical properties of sandy loam and loamy sand soils in fields of maize and soybeans. They found that bulk density decreased by 3–5% and porosity and available water capacity increased by 2–3% after adding biochar to the soil for both crops. Under soybeans crop, the soil aggregates stability increased by 4.6 ± 1.9% and 6.8 ± 1.9% for aggregates of 0.6–2 and 2–6 mm, respectively. While the stable soil aggregates for the maize crop increased by 2.6 ± 1.9% and 2.9 ± 1.9% for the 0.6–2 and 2–6 mm aggregates, respectively.
Baiamonte et al. [
6] studied the effects of different amounts of biochar on the structure of a sandy-clay soil. They revealed that progressive additions of biochar increased soil aggregate stability by enhancing the volume of drainable pores, field capacity, maximum available water, the stability ratio, and the saturated water content (θs). Laird et al. [
7] did not find significant influence of hardwood biochar on the soil saturated Ks. Asai et al. [
8] and Uzoma et al. [
9] observed that biochar application improved the soil saturated Ks. Novak et al. [
10] reported significant differences in water retention capacity among soils treated with different biochar. Safari et al. [
11] used the anionic PAM in a greenhouse experiment and found that the PAM significantly increased the mean weight diameter (MWD) and Ks. However, the beneficial effects of PAM on soil physical quality decreased over time. Hussien et al. [
12] studied the effect of A poly[(acrylic acid)-co-acrylamide] hydrogel on Ks; they concluded that Ks values decrease at low concentrations of both polymers without additive and polymers with 5% (
w/w) kaolinite clay mineral. The Ks values decreased significantly (
P < 0.05) in the range 53.68–87.19% compared to the control.
Numerous researchers have reported that superabsorbent polymers (SAPs), also known as soil polymers or macromolecular polymers, are capable of repeatedly absorbing, retaining, and releasing extremely large amounts of water relative to their own weight. Thus, they can improve water conservation in soils, prevent deep percolation and soil nutrient loss, and maximize the efficient use of water and fertilizer [
13,
14,
15]. SAPs can absorb more than a thousand times their original weight in water and they can retain liquids even under pressure [
13]. SAPs have superior water absorption capacities relative to traditional absorbent materials, so they have been used widely in agriculture, horticulture, bioengineering, biomedicine, water purification, and food storage [
15,
16,
17,
18]. Hou et al. [
19] reported that the use of organic-inorganic hybrid SAP (water absorbency rate = 500–600 and pH = 6.0–8.0) with a rate ranging between 60 to 90 kg ha
−1 on a dry-farming region of Ningxia, China, led to significant decrease of soil bulk density and an increase of soil total porosity, crop water use efficiency, and final yield of potato compared with the control. Qin et al. [
20] showed that the application of Wote (organic-inorganic hybrid) and microbe (microbial strain multifunctional preparation) SAPs could significantly increase the crop water use efficiency and enhance physical properties of soil. Wote SAPs exhibit a stronger effect than microbe SAPs. El-Asmar et al. [
21] studied the use of polymer on clay and sandy-clay loam (SCL) soils with two pot experiments using Zea mays and Pinus pinea. They found that the polymer improves corn’s fresh and dry aboveground biomass and prolongs survival time of pine seedlings in both soils. However, the polymer enhanced the water retention only in SCL soil and had negligible effect on clay soils. Furthermore, Alghamdi et al. [
22] study the impact of bentonite (Ben), compost (Com), biochar (Bio) and mixture of them on soil physical and chemical characteristics and found that the mixture of Ben and Com, and Bio, Ben, and Com were the best in term of improving hydraulic properties of sandy soils. This study hypothesis that the biochar and polymer have their own advantages and by adding both can get all their advantages.
Therefore, the objective of this study was to investigate the effects of biochar, polymers, and mixtures of them on the hydro-physical properties of sandy soil.
2. Materials and Methods
The soil used in this experiment was collected from the educational farm of the College of Food and Agriculture Science, Riyadh Saudi Arabia, King Saud University (24°44′13.4′′N, and 46°37′06.7′′E). The soil sample was air dried for two days and passed through a 2-mm sieve. Chemical and physical properties were determined according to standard procedures [
23]. The saturate soil paste extract was prepared and the salinity of the soil extract (ECe) was determined using electrical conductivity (EC) meter (test kit model 1500_20, Cole and Parmer) at 25 °C. While the pH were determined using pH meter (Hanna, HI 9811-5).The Ca
+2and Mg
+2 were determined by titration with Ethylenediaminetetraacetic acid (EDTA), Na
+ and K
+ by flame photometer apparatus (Corning 400), CO
3−2 and HCO
3− by titration with acid, Cl
− measured by titration with silver nitrate, and SO
4−2 determined by turbidity method (
Table 1).The texture determined by hydrometer method and the soil texture was loamy sand [
23]. The bulk density of the soil in the column was 1.450 g cm
−3.
3. Production and Characterization of Biochar.
Biochar was produced from date palm residuals such as fronds and rachis that were exposed to direct sunlight to dry out and then cut down to small pieces (10–15 cm). The date palm pieces were packed tightly in a stainless-steel cylinder (50 cm radius and 80 cm length) to minimize air volume and to provide nearly oxygen-free conditions. The container was tightly covered and subject to outdoor pyrolysis at a temperature of 400–450 °C ± 10 °C. The biochar had a pH of 9.85, EC of 1.23 ± 0.2 dS m−1, biochar-to-water ratio of 1:10, and a bulk density of 0.33 g cm−3.
The biochar was passed through a 2-mm sieve, and then mixed with soil at ratios of 20, 40, 60 and 80 g kg
−1 (hereafter referred to as B
1, B
2, B
3, and B
4). The bulk density of the mixtures of soil and biochar was calculated based on the following equation [
24]:
where
b is the bulk density of the mixtures (g cm
−3), x is the percentage by weight of biochar,
1 is the bulk density of biochar (g cm
−3), and
2 is the soil bulk density (g cm
−3). Based on Equation (1) the bulk densities of different biochar amended soils were 1, 0.99, 0.99, and 0.98 g cm
−3, respectively.
4. Polymer: Polyacrylamide
The SAP (commercial name PagriSap) was purchased from Riyadh agriculture facility. The polymer is polyacrylamide (produced by Polykem Sarl, Switzerland) with pH = 7.51 and EC = 2.12 dSm
−1 (measured in 1:10 extract by EC and pH meters (Hanna, HI 9811-5)). Infrared Spectroscopy (FT-IR) was used for polymer identification (FT-IR, Bruker Optic Tensor27, Germany). The FT-IR spectrum of polymer hydrogel shows many characteristic bands. The band at approximately 3433 cm
−1 is attributed to the –OH stretching vibrations while the peak at 2928 and 2863 cm
−1 were assigned to –CH stretching and vibration. The band at 1664 cm
−1 is related to carbonyl group stretching. The band at 1562 cm
−1 is assigned to the stretching mode of –C=C– groups. Additional bands at 1448, 1400 and 1350 cm
−1 are attributed to –O–CH
3 and vibration of the hydroxyl group. The strong peak at 1113 cm
−1 was assigned to the C–O–C group [
25] (
Figure 1).
The polymer was mixed with soil at ratios of 2, 4, 6 and 8 g kg−1 (hereafter referred to as P1, P2, P3, and P4).The mixture of biochar and polymer with soil at ratios of 20:2, 40:4, 6:60, and 8:80 g kg−1 are hereafter referred to as B1:P1, B2:P2, B3:P3, and B4:P4, respectively.
5. Intermittent Evaporation
Soil columns made of a transparent plastic with an internal diameter of 5 cm and length of 40 cm were used in this experiment. The columns were sealed from the end by two filter papers and a piece of gauze fabric firmly held using tape and string. The columns were filled with the soil to 30 cm height with an adjusted bulk density of 1.5 g cm
−3. All treatments were mixed with soil and added thoroughly to the top 10 cm of the soil columns. The columns were mounted vertically on a wooden holder inside the laboratory and kept at a controlled temperature of 22 °C ± 2 °C [
26]. 25 mL of tap water (EC of 0.73 dS m
−1) was added weekly for five wetting/drying cycles. Each treatment was replicated three times. Cumulative evaporation against time was recorded each day by weighing the soil columns. After five weeks, soil columns were divided at 2.5 cm intervals to a depth of 10 cm, then at 5 cm intervals subsequently. Soil water content was measured gravimetrically, and the distribution of the soil water with depth was determined. The water conserved amount in each column was calculated using the water content and cumulative evaporation data [
26,
27].
6. Infiltration Experiment
Infiltration was measured using a mini disk infiltrometer (model M12, 2-cm suction; Decagon Devices, Pullman, WA, USA). Soil columns described in the intermittent evaporation section were used for all treatments. The disk infiltrometer was placed in water before the stated measurement to ensure the mini disc was saturated, and then filled with water carefully to avoid air bubbles. The disk infiltrometer was in full contact with the soil surface at the beginning of the measurements and continuing for 10 or 15 min depending on the treatment. The volume of water infiltrating and the position of the wetting front was recorded every minute. The cumulative infiltration (CI) calculated according to Philip [
28]:
where I is the CI (in cm), S is the sorptivity (cm min
−0.5), A
1 is a constant related to the Ks, and t is time in minutes. A mathematical representation for Equation (2) obtained by plotting CI against the square root of time, and a second-order polynomial was fitted to the measured data. The infiltration rate was calculated as the first derivative of the CI according to the relation:
We obtained a mathematical representation for Equation (3) by plotting the infiltration rate against 1/(2 t 0.5) and fitting a linear equation to the measured data.
7. Hydraulic Conductivity
Saturated Ks was measured by constant head method technique, and measurements of Ks of saturated soils in the laboratory were based on the direct application of Darcy’s equation to a saturated soil column of uniform cross-sectional area [
29]. A hydraulic-head difference was imposed on the soil column, and out flux of water was measured. The saturated Ks can be calculated as follows:
where K
s is the saturated hydraulic conductivity, Q is the volume of water, L is the length of the soil column, A is the cross-sectional area of the soil sample, t is the time required for the volume of water Q to be discharged, and H is the water head.
8. Soil Aggregate Stability
Soil aggregate stability was determined by a wet sieving apparatus as described by Nimmo and Perkins [
30]. 2 mm air-dried aggregates with a weight of 40 g were separated manually by moving the sieves up and down by approximately 3 cm in water 30 times during a 2 min period. The sieving continued until only the sand particles were left on the sieves. The aggregates remaining on each sieve were collected and oven dried at 105 °C for 24 h. The fractions between 1 and 2 mm were corrected by removing the weight of sand to avoid overestimation. The proportion of sand assumed as constant in every size fraction retained in the eight sieves was used according to the method described in Lal and Schukla [
31], as follows:
The MWD can be calculated using the following equation [
32]:
where x
i is the mean diameter of the size fraction i that corresponds to the mean aperture of the adjacent sieves, w
i is the proportion of the total sample weight remaining on each sieve after sieving, and n is the number of aggregate sizes (8 sizes).
9. Soil Water Retention
Several soil water parameters were measured, including soil water content at 100 and 15,000 hPa retention representing field capacity (F.C) and permanent wilting (WP), respectively. In addition, the water retention curves were determined using a pressure plate extractor for a range of water potentials. The Retention Curve (RETC) program was used to fit the parameters (s, r, and n) for the van Genuchten model.
10. Statistical Analysis
Measurements were conducted in triplicate, and data analyzed using a one-way analysis of variance with biochar and polymer application rate as the independent variable. Statistical analysis was performed using the software SPSS for Windows (version 18, SPSS Inc. Chicago, IL, USA). The least significant difference (LSD at p < 0.05) test was applied to assess the differences among the means of treatments.
11. Results
11.1. Intermittent Evaporation
Effects of biochar, polymers, and amended soil on cumulative evaporation (CE) and water retained are shown in
Table 2. At the end of the wetting and evaporation cycles, the total amount of water added to the soil columns during the five cycles was 63.69 mm. The amount of water recovered from evaporation and water conserved varied between 93.54% and 99.37% and is shown in
Table 2 and
Figure 2. The addition of biochar significantly reduced evaporation for each cycle. The reductions in CE at the end of five cycles were 29.27%, 16.47%, 14.17%, and 14.61% for B
1, B
2, B
3, and B
4, respectively. The B
2 treatment resulted in a lower CE than other treatments of biochar. However, increasing the biochar rate to 8% slightly increased CE when compared to control. In contrast, the use of polymers, especially with high rate of application (P
4), increased the CE. The increases in CE were 6.87%, 13.8%, and 14.86%, for P
2, P
3, and P
4, respectively. The application of P
1 decreased CE by 10.77% that of the untreated soil. Conversely, the application of mixture treatments of biochar and polymer reduced the CE by 17.40%, 9.25%, 0.55%, and 0.9% for B
1:P
1, B
2:P
2, B
3:P
3, and B
4:P
4, respectively.
11.2. Water Conserved
Table 2 shows the amount of water conserved of the end of the fifth cycle as affected by soil amendment type and rates. The amount of water conserved by each of the amendments is ranked as follows: B
1 > B
1:P
1 > B
2 > B
4 > B
3 > B
2:P
2 > P
1 > control > B
4:P
4 > B
3:P
3 > P
2 > P
3 > P
4. The results show that the biochar gave better results at any rate, while the polymer showed good results only at low concentrations. The least amount of water conserved was observed at higher concentrations of polymer.
11.3. Infiltration
Figure 3 shows the CI as affected by biochar and polymer applications (
Figure 3a). The CI was reduced by increasing the biochar rate. The percentage decreases of CI were 34.38%, 43.37%, 58.89%, and 57.07%, for B
1, B
2, B
3, and B
4, respectively. The addition of polymer increased the CI for all treatment rates, except treatment P
3, where CI decreased by 7.5% compared to control. The CI increased with polymer addition by 19.17%, 22.20%, and 6.33% for P
1, P
2, and P
4, respectively. The biochar and polymer mixture treatment led to decreases in CI by 32.12%, 56.45%, 52.40%, and 57.43% with the additions of B
1:P
1, B
2:P
2, B
3:P
3, and B
4:P
4, respectively, compared to untreated soil. The largest decrease in CI was observed with the addition of biochar followed by the mixture, as shown in
Figure 3b, with the equation constant presented in a
supplementary file.
The addition of biochar and polymers also affected the infiltration rate as shown in
Figure 3c. The decreased infiltration rates for the biochar and mixture treatment were 32.73%, 42.17%, 57.82%, 56.85%, 4.72%, 30.81%, 57.58%, 52.05%, and 57.31% for B
1, B
2, B
3, B
4, P
3, B
1:P
1, B
2:P
2, B
3:P
3, and B
4:P
4, respectively. In contrast, the polymer increased the infiltration rate by 21.87%, 25.82%, and 9.32% for P
1, P
2, and P
4, as shown in
Figure 3d, when compared to the control treatment, with the equation constant presented in
supplementary file.
11.4. Saturated Hydraulic Conductivity
Figure 4 shows the K
s values for soil amendment with biochar, polymer, and mixtures of biochar and polymer. The K
s values decreased significantly for mixture application rate B
2:P
2 (2% and 0.2%) compared with untreated soil. In addition, the K
s value decreased more with biochar application rate B
1. Thus, with application of biochar and polymer, the average value of decrease was 85.35% and 53.98% for B
1 and B
2, respectively.
11.5. Soil Moisture Distribution
Figure 5 shows the soil moisture distribution (SMD) profile for the soil column with depth at the end of the evaporation experiment. The largest increase in soil moisture content as compared to the untreated soil was found 5–10.5 cm from the surface, followed by the top surface (0–2.5 cm). The percentage of increase in soil moisture content ranged between 6.84% and 68.03%, depending on the soil amendment. Additionally, biochar increased soil moisture content 68.03%, 54.36%, 54.05%, and 16.53%, for B
1, B
2, B
3, and B
4, respectively. The SMD for the mixture treatments increased by 55.41%, 65.11%, 7.13%, and 9.17% for B
1:P
1, B
2:P
2, B
3:P
3, and B
4:P
4, respectively. SMD increased by 16.91%, 22.19%, 8.60%, and 43.01% for B
1:P
1, B
2:P
2, B
3:P
3, and B
4:P
4, respectively. The exception was polymer application at rates of P
2 (0.4%) and P
3 (0.6%). Results indicate that the use of polymer reduced the soil moisture content when compared to the control.
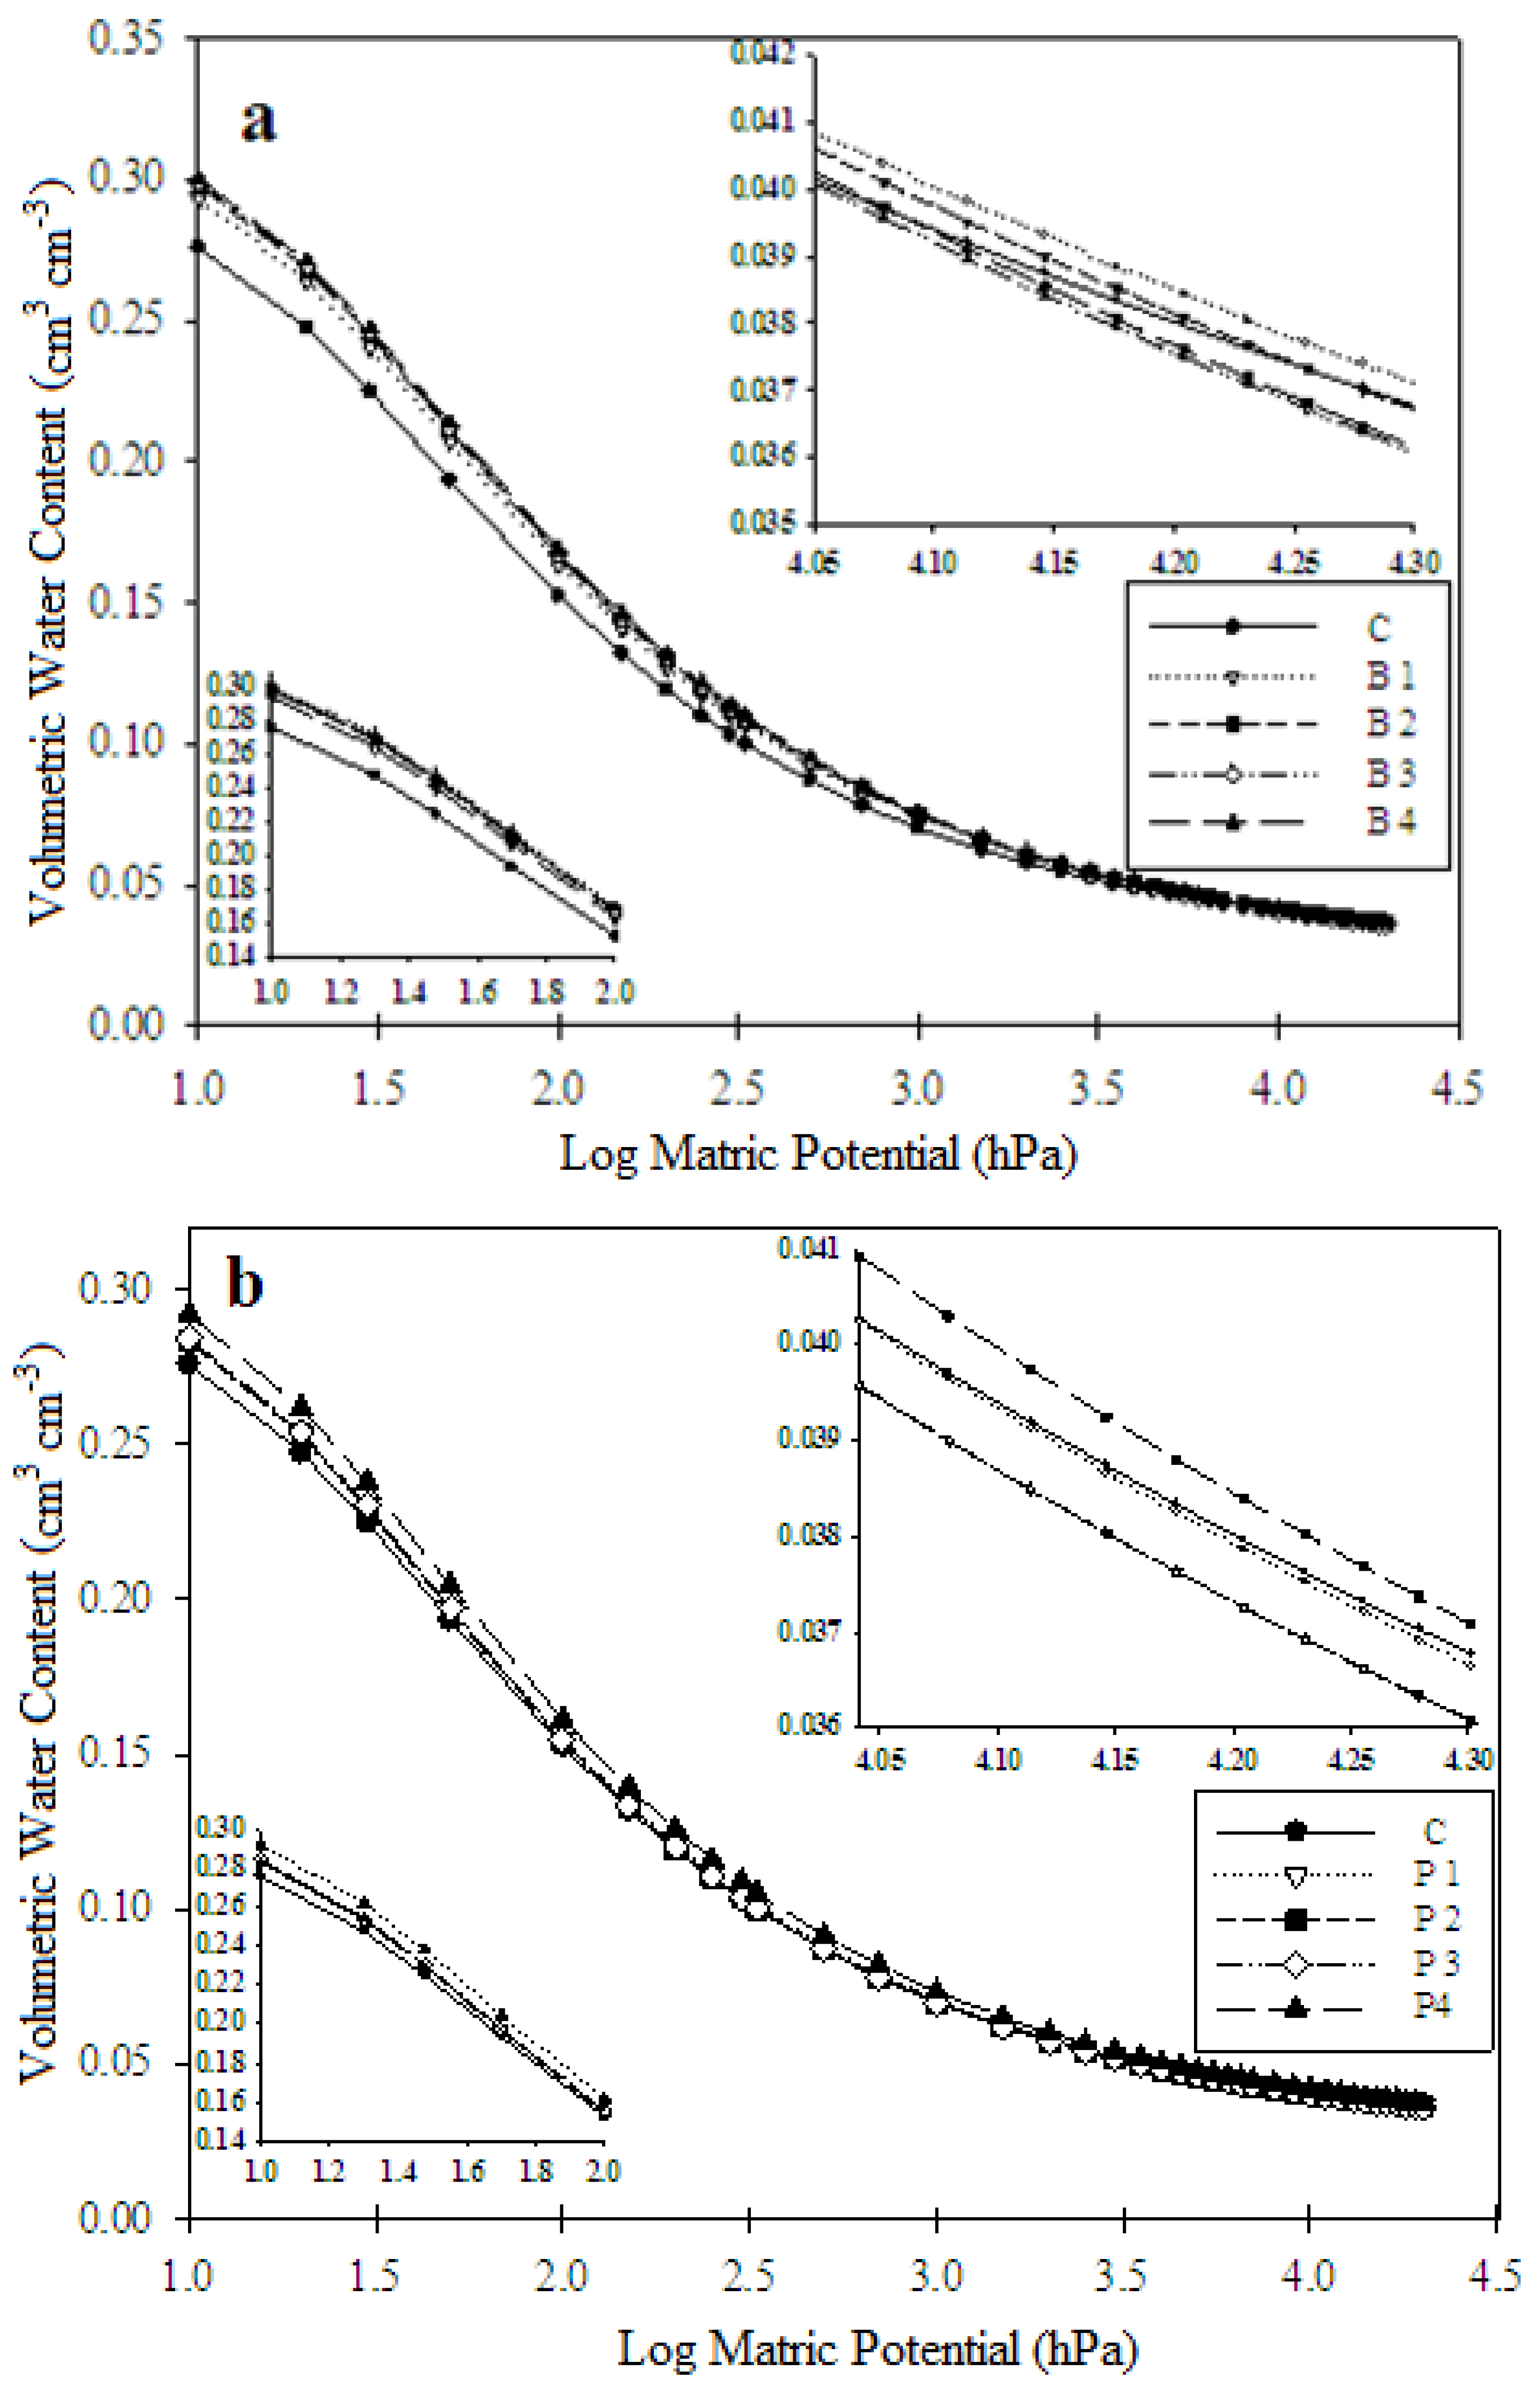
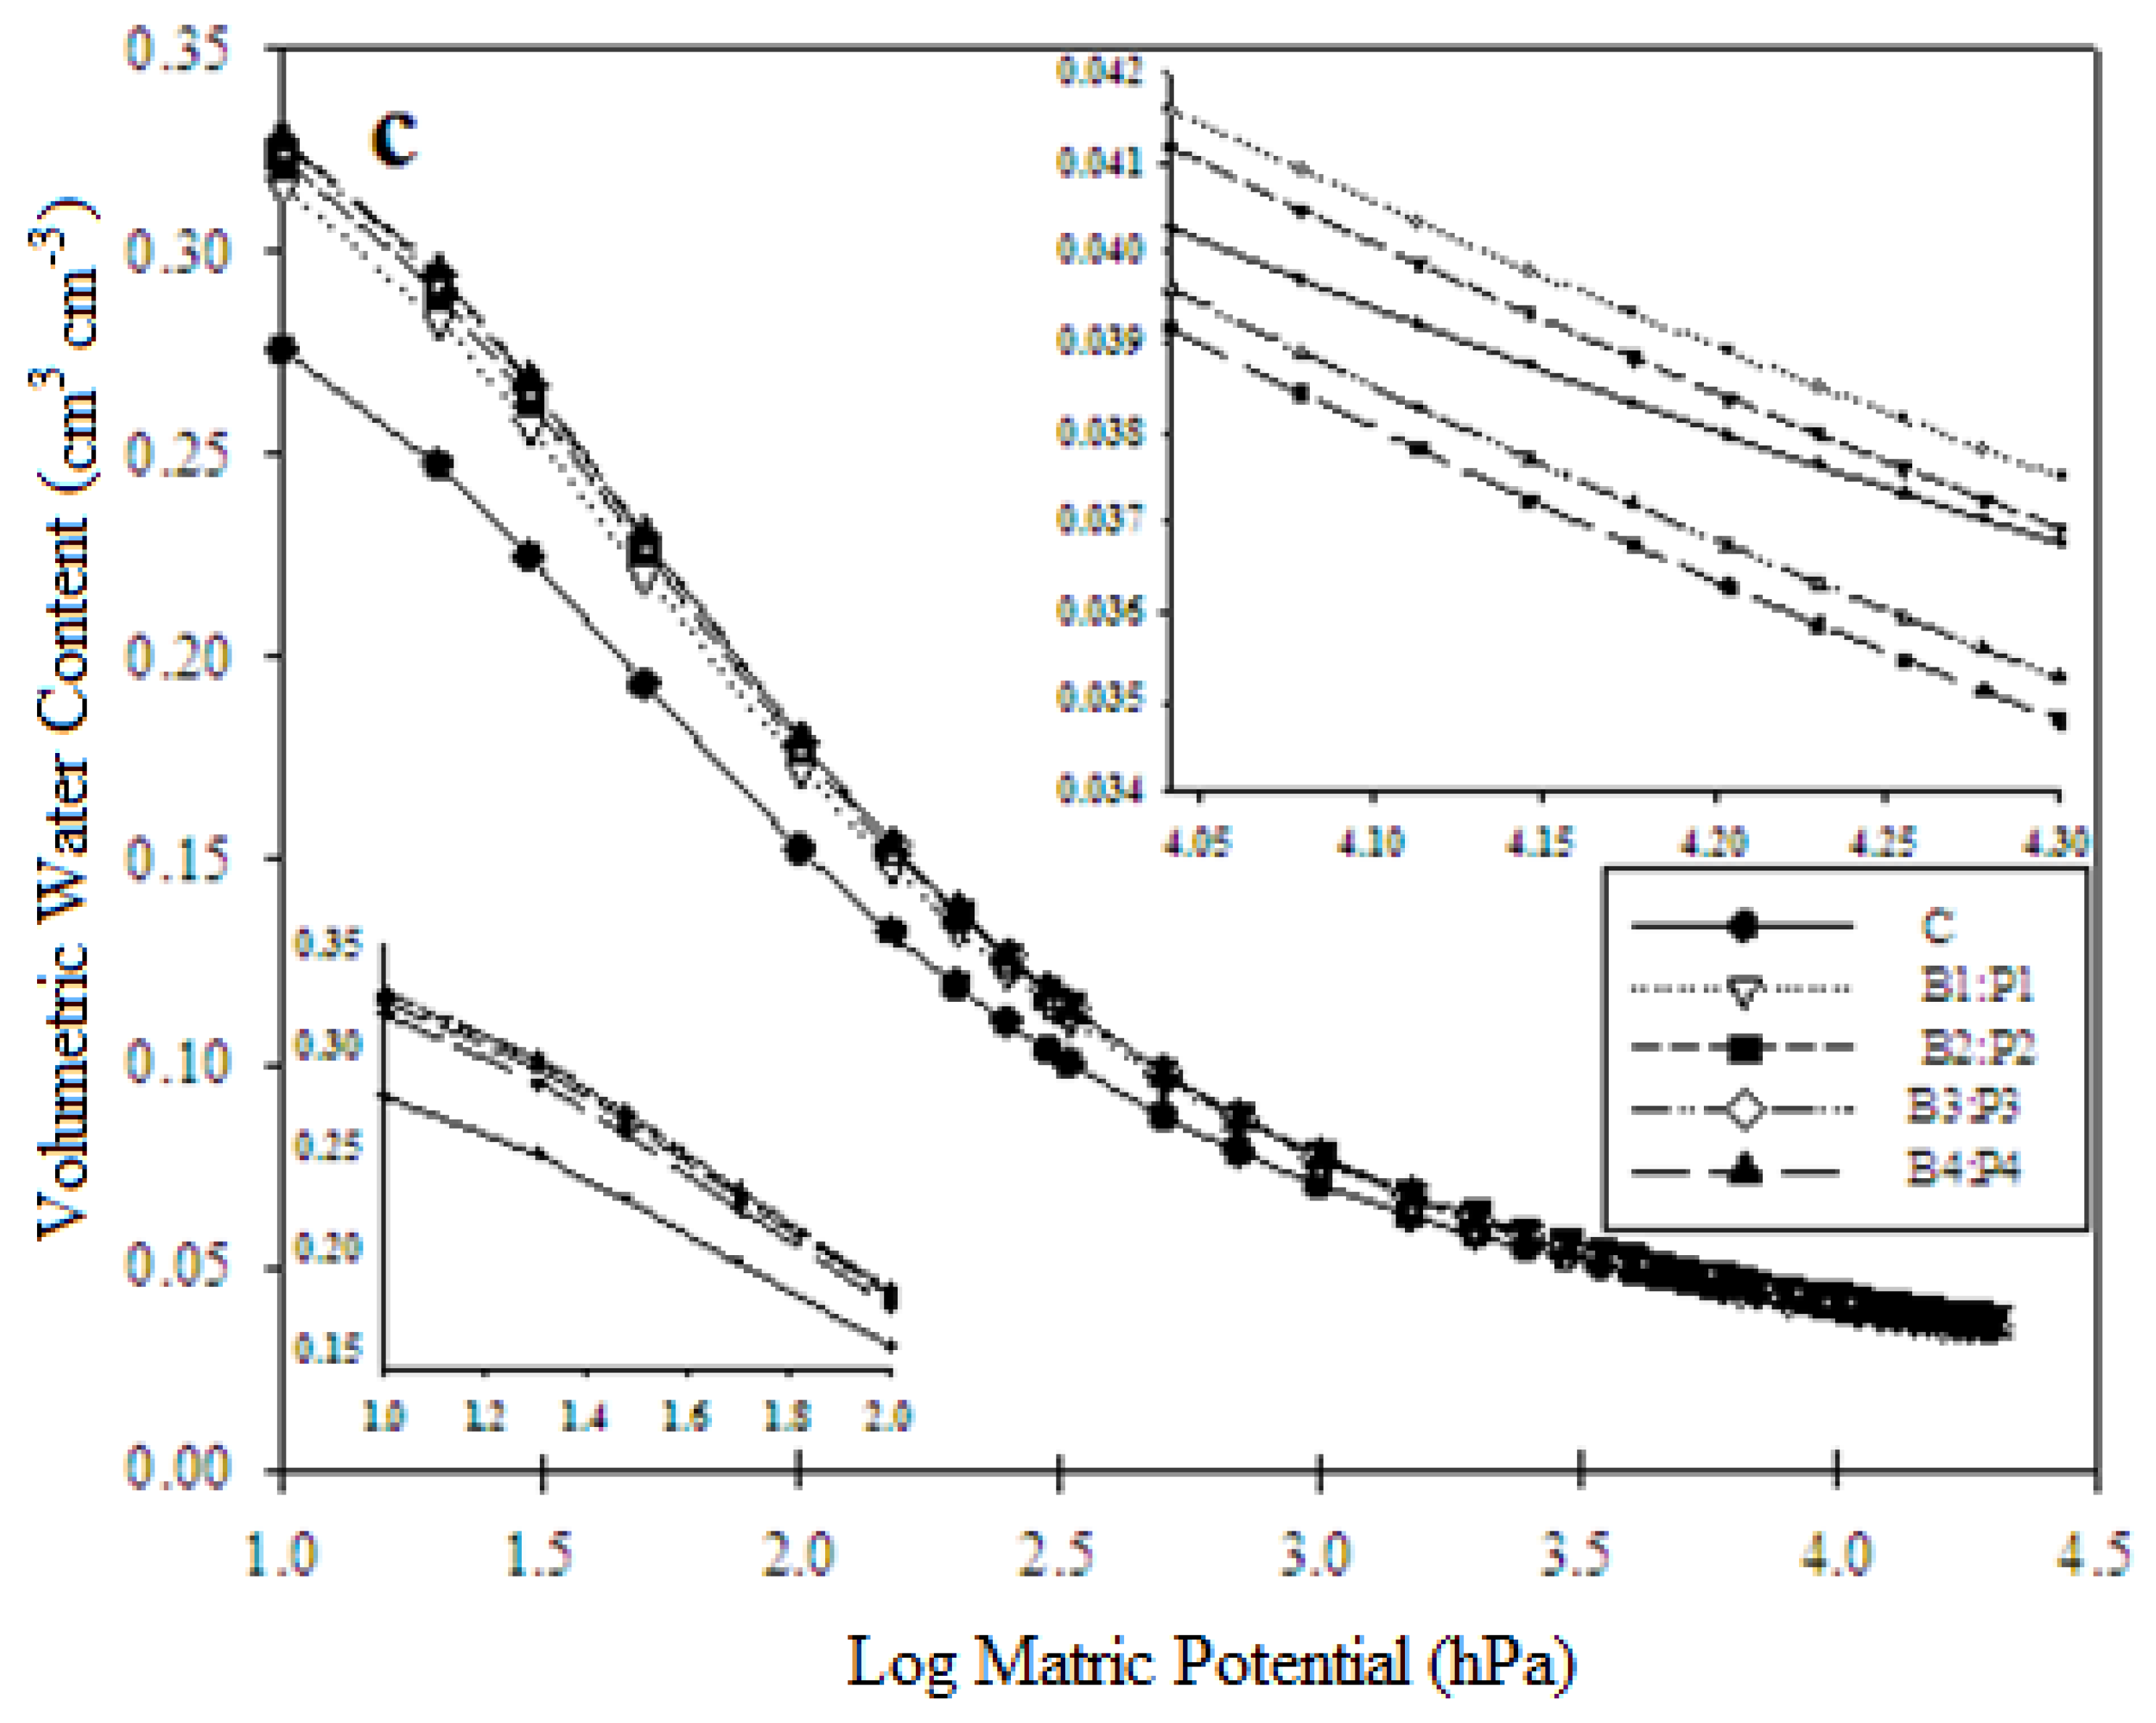
11.6. Water Retention Curve
Measured and simulated soil moisture characteristic curves for all treatments are presented in
Figure 6. Increasing the rate of biochar and the mixture of biochar and polymer increased soil moisture content at both higher and lower water potentials as shown in
Figure 6a–c. The water content at lower water potential increased by 6.01%, 7.39%, 7.71%, and 8.12% for B
1, B
2, B
3, and B
4, respectively. The increase for the mixture treatments at the lower potential was 12.81%, 14.65%, 15.66%, and 15.92% for B
1:P
1, B
2:P
2, B
3:P
3, and B
4:P
4, respectively. However, the use of polymer increased the soil moisture content by 2.49%, 2.61%, 2.96% and 5.53% at P
1, P
2, P
3, and P
4, respectively. The application of soil amendment as compared to untreated soil enhanced the available water especially at higher water potentials (100 hPa).
Table 3 shows that the F.C increased compared to control by 6.64%, 8.40%, 8.98%, and 9.77% for B
1, B
2, B
3, and B
4, respectively. The F.C. for each mixture increased by 11.64%, 13.92% 14.94%, and 15.13% for B
1:P
1, B
2:P
2, B
3:P
3 and B
4:P
4, respectively. Additionally,
Table 3 shows the hydrological parameters of soil amended as affected by application rate of biochar, polymer, and mixtures of biochar and polymers. Significant differences were found in soil moisture content at saturation
and residual water
. The results show significant differences in other parameters (α and n) for van Genunchten model with application of biochar, polymer and the mixtures of biochar and polymers.
11.7. Aggregate Stability
Figure 7a illustrates the percentages of stable aggregates, as affected by different soil amendments (biochar, polymer, and mixtures of biochar and polymers), in eight fraction sizes. For fraction size 0.22–0.125 mm, aggregate stability (AS) increased with the application of B
2:P
2 and P
4 treatments to 50.82% and 50%, respectively. For fraction size 2–1 mm, AS increased by 7.72% with the highest application to mixture rate B
4:P
4. However, for fraction size 0.63–0.38 mm, AS decreased in all treatments except in untreated soil. For the fraction size of <0.038 mm, AS was corrected after dispersion of the soil and subtracted for the sand coarse fraction; the sand proportion was assumed constant in every size fraction.
Figure 7b shows the corrected sum of AS as affected by the increase in soil conditioner (biochar and polymer) applications. The corrected sum of AS increased for all treatments to 53.68%, 64.57%, 90.74%, 99.91%, 25.10%, 12.90%, 60.37%, 180.28%, 38.12%, 129.63%, 70.52%, and 85.69% for B
1, B
2, B
3, B
4, P
1, P
2, P
3, P
4, B
1:P
1, B
2:P
2, B
3:P
3, and B
4:P
4, respectively, as compared with untreated soil. MWD increased with increase in the application rate of biochar, and highest rate of polymer increased MWD by 31.82%, 28.70%, 34.21%, 25.85%, 53.55%, 56.22%, 35.70%, 14.40%, 37.58%, 11.67%, 35.02%, and 52.52% for B
1, B
2, B
3, B
4, P
1, P
2, P
3, P
4, B
1:P
1, B
2:P
2, B
3:P
3, and B
4:P
4, respectively, as compared with untreated soil.
12. Discussion
12.1. Intermittent Evaporation
In this study, it is evident that application of biochar to course–texture soils decreased the evaporation from soil columns. The biochar addition clearly enhanced the capacity of soil to retain water and, consequently, resulted in higher water conservation. This is also evident with application of the mixture of biochar and polymer at lower application rates. Biochar application reduced CE by 29.27%, 16.47%, 14.17%, and 14.61% for B
1, B
2, B
3, and B
4, respectively. This finding is similar to other research reports on the addition of biochar [
26,
34,
35,
36]. Ibrahim, et al. [
36] reported that CE was reduced by 13.3–21.2% for soils treated with conocarpus biochar and the amount of water conserved increased by 6.3%.
The addition of polymer decreased the CE at low concentrations, and increases in the polymer rates to 0.4%, 0.6% and 0.8% led to increases in CE by 6.87%, 13.81%, and 14.86%, respectively, compared with untreated soil. Thus, the amount of water conserved at these rates was lower than the control or other treatments. Increasing the polymer rate to 0.8% increased CE; this finding is similar to results reported by Al-Omran et al. [
1] on the use of Jalma conditioners. They reported a similar influence of Jalma on CI at 0.05 m surface layer due to it is effect on aggregation and swelling. These two phenomena affect CE.
12.2. Infiltration
The results indicated that application of biochar and the mixture of polymer and biochar restricted water movement in soil. Thus, the soil treated with biochar needed more time to advance in the soil columns as the rate increased from 2% to 8%. The lowest values of infiltration were observed with higher concentration of biochar (8%), and this can be explained by the settling of very fine particles of biochar into the soil pore, blocking soil pores and reducing infiltration [
36,
37]. Busscher et al. [
38] and Ibrahim et al. [
27] concluded that biochar addition to sandy soils having coarse texture can lower water percolation through soil and thus conserve soil moisture, resulting in more water available to plants. The application of polymers with rates from 0.2% to 0.8% significantly increased CI; this behavior may be attributed to the swelling effect of the higher application of polymer. The same finding was reported using super absorbent polymer by [
39].
Soil Water Retention
The positive impact of application of biochar in soil led to improved soil properties, including an increase the capacity of the soil to retain water at higher and lower potentials, and an increase in water content at F.C with the addition of biochar between 7.14% and 10.81% for B
1 and B
4, respectively, and 1.7% to 5.77% for polymer application rates P
1 to P
4. The highest increase of F.C was 13.18% to 17.84% for B
1:P
1 and B
4:P
4, respectively. There was an increase of welting point (WP) from 0.52% to 1.35%, and 1.3% to 2.6%, for lower application of biochar and the mixture of biochar and polymers, respectively. Similar results were reported by Kinney et al. [
40] in which they found that water retained at F.C. was increasing by 25% with the addition of biochar using sandy soil. The increase of water retained might be attributed to the increasing number of small pores in soil after the addition of biochar [
41]. Additionally, a high surface area of biochar could explain the increased soil water retention of sandy soil [
31]. Thus, the results indicate that adding biochar may have enhanced the soil pores effect on soil water content compared to untreated soil. Also, biochar decreased infiltration and saturated Ks. However, polymer increased infiltration with addition of polymers rates of 0.2% to 0.8%. Biochar application also affected SA with all biochar rates. MWD increased by increasing application rate. The biochar and polymer amendment enhanced the formation and stabilization of the soil macro aggregates, especially in the sandy loam soil [
27,
42].
13. Conclusions
In this study, the impact of date palm biochar rates between 2% and 8%, polymer rates between 0.2% and 0.8%, and mixture of these was investigated for improvement of hydro-physical properties of sandy soils using fresh water. The results showed that CE from treated soil with biochar was reduced by 29.27% and 14.61% for B1 and B4, respectively, and 0.55% to 17.40% for B1:P1 and B4:P4, respectively. However, the application of polymer increased CI by 6.87% to 14.86%, when increasing the rate from 0.2% to 0.8%, compared to untreated soil. The application of biochar enhanced the capacity of soil to conserve water; the amount of water conserved increased by 68.03%, 54.36%, 54.05%, and 16.53% for rates 2%, 4%, 6%, and 8%, respectively.
This study found that the use of the mixture of B4:P4 can improve the hydro-physical properties of sandy soil in arid environments; this mixture has the highest water content at F.C and available water compared to the other treatments and control. Conversely, the addition of date palm biochar at a low rate (B1) to sandy soil improved soil hydraulic properties (water retention, water holding capacity, Ks, and infiltration ate) and reduced CE. Therefore, under arid conditions where water shortages and limited water quality are issues, the date palm biochar might be a promising soil amendment for soil productivity and could improve crop productivity for crops exposed to water stress in sandy soils.
Author Contributions
Formal analysis, A.A., A.A.-O. and A.A.A.; Methodology, A.A.-O. and A.A.A.; Writing—original draft, A.A.-O. and A.A.A.; Writing—review & editing.
Funding
Deanship of the Scientific Researches, King Saud University and Agricultural Researches Center, College of Food and Agricultural Sciences: KSU11451.
Acknowledgments
The authors wish to thank King Saud University, Deanship of Scientific Research, College of Food and Agricultural Sciences, Research Center for supporting this work. The authors also thank the Deanship of Scientific Research and RSSU at King Saud University for their technical support.
Conflicts of Interest
The authors declare no conflict of interest.
References
- Al-Omran, A.M.; Mustafa, M.A.; Shalaby, A.A. Intermittent evaporation from soil columns as affected by gel-forming conditioners. Soil Sci. Soc. Am. J. 1987, 51, 1593–1599. [Google Scholar] [CrossRef]
- Hueso-González, P.; Martínez-Murillo, J.F.; Ruiz-Sinoga, J.D. The impact of organic amendments on forest soil properties under Mediterranean climatic conditions. Land Degrad. Dev. 2014, 25, 604–612. [Google Scholar] [CrossRef]
- Mann, K.K.; Schumann, A.W.; Obreza, T.A.; Sartain, J.B.; Harris, W.G.; Shukla, S. Analyzing the efficiency of soil amendments and irrigation for plant production on heterogeneous sandy soils under greenhouse conditions. J. Plant Nutr. Soil Sci. 2011, 174, 925–932. [Google Scholar] [CrossRef]
- Ahmad, S.; Ghafoor, A.; Akhtar, M.E.; Khan, M.Z. Ionic displacement and reclamation of soline-sodic soils using chemical amendments and crop rotation. Land Degrad. Dev. 2013, 24, 170–178. [Google Scholar] [CrossRef]
- Obia, A.; Mulder, J.; Martinsen, V.; Cornelissen, G.; Børresen, T. In situ effects of biochar on aggregation, water retention and porosity in light-textured tropical soils. Soil Tillage Res. 2016, 155, 35–44. [Google Scholar] [CrossRef]
- Baiamonte, G.; De Pasquale, C.; Marsala, V.; Cimò, G.; Alonzo, G.; Crescimanno, G.; Conte, P. Structure alteration of a sandy-clay soil by biochar amendments. J. Soils Sediments 2015, 15, 816–824. [Google Scholar] [CrossRef]
- Laird, D.A.; Fleming, P.; Davis, D.D.; Horton, R.; Wang, B.; Karlen, D.L. Impact of biochar amendments on the quality of a typical midwestern agricultural soil. Geoderma 2010, 158, 443–449. [Google Scholar] [CrossRef]
- Asai, H.; Samson, B.K.; Stephan, H.M.; Songyikhangsuthor, K.; Homma, K.; Kiyono, Y.; Inoue, Y.; Shiraiwa, T.; Horie, T. Biochar amendment techniques for upland rice production in northern laos. Field Crops Res. 2009, 111, 81–84. [Google Scholar] [CrossRef]
- Uzoma, K.C.; Inoue, M.; Andry, H.; Fujimaki, H.; Zahoor, A.; Nishihara, E. Effect of cow manure biochar on maize productivity under sandy soil condition. Soil Use Manag. 2011, 27, 205–212. [Google Scholar] [CrossRef]
- Novak, J.M.; Lima, I.; Xing, B.; Gaskin, J.W.; Steiner, C.; Das, K.C.; Ahmedna, M.; Rehrah, D.; Watts, D.W.; Busscher, W.J.; et al. Characterization of designer biochar produced at different temperatures and their effects on a loamy sand. Ann. Environ. Sci. 2009, 3, 195–206. [Google Scholar]
- Safari, N.; Aliasgharzad, N.; Asghari, S. The effects of polyacrylamide on the parameters of physical quality in a clay loam soil selected from semiarid region. J. Soil Environ. 2015, 1, 10–17. [Google Scholar]
- Hussien, R.A.; Donia, A.M.; Atia, A.A.; El-Sedfy, O.F.; El-Hamid, A.A.; Rashad, R.T. Studying some hydro-physical properties of two soils amended with kaolinite-modified cross-linked poly-acrylamides. Catena 2012, 92, 172–178. [Google Scholar] [CrossRef]
- Liu, Z.; Miao, Y.; Wang, Z.; Yin, G. Synthesis and characterization of a novel super-absorbent based on chemically modified pulverized wheat straw and acrylic acid. Carbohydr. Polym. 2009, 77, 131–135. [Google Scholar] [CrossRef]
- Beckett, C.T.; Augarde, C.E. Prediction of soil water retention properties using pore-size distribution and porosity. Can. Geotech. J. 2013, 50, 435–450. [Google Scholar] [CrossRef]
- Chen, Z.; Liu, M.; Qi, X. Synthesis and Properties of a Superabsorbent Polymer Prepared by Copolymerization of Sodium Acrylate with Sodium 1-(Acryloyloxy) propan-2-yl Phosphate. Macromol. React. Eng. 2007, 1, 275–283. [Google Scholar] [CrossRef]
- Han, Y.G.; Yang, P.L.; Luo, Y.P.; Ren, S.M.; Zhang, L.X.; Xu, L. Porosity change model for watered super absorbent polymer-treated soil. Environ. Earth Sci. 2010, 61, 1197–1205. [Google Scholar] [CrossRef]
- Zohuriaan-Mehr, M.J.; Omidian, H.; Doroudiani, S.; Kabiri, K. Advances in non-hygienic applications of superabsorbent hydrogel materials. J. Mater. Sci. 2010, 45, 5711–5735. [Google Scholar] [CrossRef]
- Islam, M.R.; Hu, Y.; Mao, S.; Mao, J.; Eneji, A.E.; Xue, X. Effectiveness of a water-saving super-absorbent polymer in soil water conservation for corn (Zea mays L.) based on eco-physiological parameters. J. Sci. Food Agric. 2011, 91, 1998–2005. [Google Scholar] [CrossRef]
- Hou, X.; Li, R.; He, W.; Dai, X.; Ma, K.; Liang, Y. Superabsorbent polymers influence soil physical properties and increase potato tuber yield in a dry-farming region. J. Soils Sediments 2018, 18, 816–826. [Google Scholar] [CrossRef]
- Qin, S.H.; Wang, D.; Zhang, J.L.; Dai, H.L.; Niu, G.Q.; Guo, R. Effects of aquasorbs on soil water characteristic and yield formation of potato. J. Gansu Agric. Univ. 2013, 2, 008. [Google Scholar]
- El-Asmar, J.; Jaafar, H.; Bashour, I.; Farran, M.T.; Saoud, I.P. Hydrogel banding improves plant growth, survival, and water use efficiency in two calcareous soils. CLEAN–Soil Air Water 2017, 45, 1700251. [Google Scholar] [CrossRef]
- Alghamdi, A.G.; Aly, A.A.; Al-Omran, A.M.; Alkhasha, A. Impact of biochar, bentonite, and compost on physical and chemical characteristics of a sandy soil. Arab. J. Geosci. 2018, 11, 670–678. [Google Scholar] [CrossRef]
- Gupta, S.K.; Gupta, I.C.; Yaduvanshi, N.P.S. Standard Methods for Analysis of Soil Plant Water; Scientific Publishers: Jodhpur, India, 2012. [Google Scholar]
- Adams, W.A. The effect of organic matter on the bulk and true densities of some uncultivated podsoilc soils. J. Soil Sci. 1973, 24, 11–17. [Google Scholar] [CrossRef]
- Siesler, H.W. Fourier transform infrared (ftir) spectroscopy in polymer research. J. Mol. Struct. 1980, 59, 15–37. [Google Scholar] [CrossRef]
- Ibrahim, H.M.; Al-Wabel, M.I.; Usman, A.R.A.; Al-Omran, A. Effect of conocarpus biochar application on the hydraulic properties of a sandy loam soil. Soil Sci. 2013, 178, 165–173. [Google Scholar] [CrossRef]
- Ibrahim, A.; Usman, A.R.A.; Al-Wabel, M.I.; Nadeem, M.; Ok, Y.S.; Al-Omran, A. Effects of conocarpus biochar on hydraulic properties of calcareous sandy soil: Influence of particle size and application depth. Arch. Agron. Soil Sci. 2016, 63, 185–197. [Google Scholar] [CrossRef]
- Philip, J.R. The theory of infiltration: The infiltration equation and its solution. Soil Sci. 1957, 83, 345–357. [Google Scholar] [CrossRef]
- Klute, A. Physical and Mineralogical Methods of Soil Analysis; American Society of Agronomy: Madison, WI, USA, 1986. [Google Scholar]
- Nimmo, J.R.; Perkins, K.S. Aggregate Stability and Size Distribution. In Methods of Soil Analysis; Madison, Wisconsin, Soil Science Society of America: Madison, WI, USA, 2002; Volume 4, pp. 317–328. [Google Scholar]
- Lal, R.; Shukla, M.K. Principles of Soil Physics; CRC Press: Boca Raton, FL, USA, 2004. [Google Scholar]
- Tang, J.; Mo, Y.; Zhang, J.; Zhang, R. Influence of biological aggregating agents associated with microbial population on soil aggregate stability. Appl. Soil Ecol. 2011, 47, 153–159. [Google Scholar] [CrossRef]
- van Genuchten, M.T. A closed-form equation for predicting the hydraulic conductivity of unsaturated soils. Soil Sci. Soc. Am. J. 1980, 44, 892–898. [Google Scholar] [CrossRef]
- Akhter, J.; Mahmood, K.; Malik, K.; Mardan, A.; Ahmad, M.; Iqbal, M. Effects of hydrogel amendment on water storage of sandy loam and loam soils and seedling growth of barley, wheat and chickpea. Plant Soil Environ. 2004, 50, 463–469. [Google Scholar] [CrossRef]
- Herath, H.M.S.K.; Camps-Arbestain, M.; Hedley, M. Effect of biochar on soil physical properties in two contrasting soils: An alfisol and an andisol. Geoderma 2013, 209–210, 188–197. [Google Scholar] [CrossRef]
- Mukherjee, A.; Lal, R. Biochar impacts on soil physical properties and greenhouse gas emissions. Agronomy 2013, 3, 313–339. [Google Scholar] [CrossRef]
- George, C.; Wagner, M.; Kücke, M.; Rillig, M.C. Divergent consequences of hydrochar in the plant–soil system: Arbuscular mycorrhiza, nodulation, plant growth and soil aggregation effects. Appl. Soil Ecol. 2012, 59, 68–72. [Google Scholar] [CrossRef]
- Busscher, W.J.; Novak, J.M.; Evans, D.E.; Watts, D.W.; Niandou, M.A.S.; Ahmedna, M. Influence of pecan biochar on physical properties of a norfolk loamy sand. Soil Sci. 2010, 175, 10–14. [Google Scholar] [CrossRef]
- Al-Omran, A.M.; Mustafa, M.A.; Al-Darby, A.M.; Shalaby, A.A. Gel-conditioned barriers for water management of sandy soils. Irrig. Sci. 1991, 12, 7–12. [Google Scholar] [CrossRef]
- Kinney, T.J.; Masiello, C.A.; Dugan, B.; Hockaday, W.C.; Dean, M.R.; Zygourakis, K.; Barnes, R.T. Hydrologic properties of biochars produced at different temperatures. Biomass Bioenergy 2012, 41, 34–43. [Google Scholar] [CrossRef]
- Glaser, B.; Lehmann, J.; Zech, W. Ameliorating physical and chemical properties of highly weathered soils in the tropics with charcoal—A review. Boil. Fertil. Soils 2002, 35, 219–230. [Google Scholar] [CrossRef]
- Liang, B.; Lehmann, J.; Solomon, D.; Kinyangi, J.; Grossman, J.; O’neill, B.; Skjemstad, J.O.; Thies, J.; Luizao, F.J.; Petersen, J.; et al. Black carbon increases cation exchange capacity in soils. Soil Sci. Soc. Am. J. 2006, 70, 1719–1730. [Google Scholar] [CrossRef]
© 2018 by the authors. Licensee MDPI, Basel, Switzerland. This article is an open access article distributed under the terms and conditions of the Creative Commons Attribution (CC BY) license (http://creativecommons.org/licenses/by/4.0/).


