Article

Eco-Efficiency Evaluation of Agricultural Production in the EU-28

by
Magdalena Rybaczewska-Błażejowska
* and
Wacław Gierulski
Department of Production Engineering, Kielce University of Technology, Tysiąclecia Państwa Polskiego 7, 25-314 Kielce, Poland
*
Author to whom correspondence should be addressed.
Sustainability 2018, 10(12), 4544; https://doi.org/10.3390/su10124544
Submission received: 25 October 2018 / Revised: 16 November 2018 / Accepted: 29 November 2018 / Published: 2 December 2018
(This article belongs to the Special Issue Environmental Life Cycle Assessment)

Abstract

:
This paper evaluates the eco-efficiency performance of agriculture at the sector level using the joint application of life cycle assessment (LCA) and data envelopment analysis (DEA) techniques. The research has been performed for the agricultural production of the 28 member states of the European Union (the EU-28). The foundation for the calculation of the eco-efficiency performance was a statistically selected set of impact categories derived from the life cycle impact assessment (LCIA) phase as input values and economic indicators, with the gross domestic product (GDP) of their agriculture as the output value. The results of the analysis showed that the agricultural sectors of 10 member states of the European Union (i.e., Belgium, Bulgaria, Estonia, Finland, Greece, Italy, Malta, the Netherlands, Romania, and Sweden) are relatively eco-efficient. The remaining 18 member states of the EU-28 have eco-inefficient agricultural sectors, though to a varying extent. This means that their agricultural sectors consume too many natural resources (in particular, energy), use too much fertilizer, and produce considerable amounts of airborne emissions in relation to the current level of GDP per hectare. These insights into the eco-efficiency performance of agriculture in the EU-28 may contribute to the adoption of better management techniques and more effective agricultural policies.

1. Introduction

Agriculture is one of the primary economic sectors of the European Union, because it plays a vital role in producing food, maintaining natural resources, and land management. This is the reason why promoting the trade-off between the environmental and economic performance of agricultural production is one of the major objectives of the common agricultural policy (CAP) of the European Union. The need for the integration of environmental concerns into agricultural practices was reflected, among others, in the General Union Environment Action Programme to 2020 ‘Living well within the limits of our planet’, whose authors argue that funds for agriculture should be spent in line with environmental and climate objectives [1]. This, however, requires a good understanding of the relationship between agriculture and the environment, expressed in a quantitative manner [2]. Therefore, from the policymakers’ standpoint, there is a strong need for new methodologies that enable the integrated assessment of the environmental and economic performance of agriculture in order to design appropriate economic instruments, upon which decisions can be based [3].
Eco-efficiency has been coined in the literature as a quantitative management tool for studying environmental and economic aspects concurrently. The concept of eco-efficiency is defined as an aspect of sustainability relating environmental performance along with the product system value [4]. Although the World Business Council for Sustainable Development (WBCSD) originally designed the concept of eco-efficiency with enterprises in mind, further work conducted by the Organisation for Economic Co-operation and Development (OECD) and the European Environmental Agency (EEA) extended the application of this management philosophy to entire economic sectors, technologies, regions, and countries. The analyses of the relationship between environmental performance and economic growth provide scientifically based directives for policy development, programme implementation, public finance management, and issuing decisions and permits [5]. For monitoring purposes, eco-efficiency is expressed as the ratio of either the product system value to its environmental impacts or the environmental impacts of a product system to the product system value [6,7,8]. The ratio approach can be applied into one of two ways: as a partial approach, where the environmental assessment is made based on selected environmental indicators or an integrated approach where the environmental assessment is made according to aggregated environmental indicators. The aggregation of environmental indicators is based, however, on a subjective weighting scheme [9]. Due to the fact that even specialists are unable to reach a consensus about the weights, an alternative frontier approach—data envelopment analysis (DEA)—has been proposed as an instrument for quantifying eco-efficiency [9,10,11,12,13]. Although DEA is one of the most recognised methods for quantifying eco-efficiency, its sole application does not allow the environmental impacts to be included over the entire life cycle. Therefore, recently it has been combined with life cycle assessment (LCA) [14,15].
Former eco-efficiency studies of agriculture have been carried out for single crops or production processes at the farm level [16,17,18,19,20,21,22,23,24,25,26,27,28,29,30]. They employed either partial eco-efficiency indicators (e.g., productivity indicators in relation to each environmental indicator separately) or aggregated eco-efficiency indicators (e.g., the overall farm productivity indicators in relation to environmental indicators). The environmental component of the eco-efficiency assessment was expressed at the input–output level (e.g., energy used, fertilizer rate, pesticide use, emissions to air, etc.) [19,26,30] or at the impact category level (e.g., global warming potential, acidification, eutrophication, land use, and terrestrial ecotoxicity) [18,22,25]. The economic component of the eco-efficiency assessment was expressed, inter alia, as the work income per family work unit (FWU), value added, or gross domestic product (GDP) [26,30]. To tackle the aggregation challenge of environmental indicators, the DEA approach has been applied basically [19,20,22,26]. The combined implementation of LCA and DEA has also recently been used for measuring the eco-efficiency of agricultural production, such as dairying [17,22], grape production [21,29], soybean cultivation [23], rice cultivation [24], wheat production [25], cotton cropping [27], and rapeseed and sunflower cultivation [28]. However, there are currently no studies using the combination of LCA+DEA methods to explore the eco-efficiency performance of agriculture at the sector level. Achieving higher efficiency at a micro level does not guarantee the achievement of environmental objectives at a macro level [5].
The central objective of this study is to show the applicability of the LCA+DEA methodology for measuring the eco-efficiency performance of agriculture at the sector level. This is the first attempt to use this type of methodology for the agricultural production of the 28 member states of the European Union (the EU-28). Despite the fact that the eco-efficiency of agriculture from the macro-level perspective is a research topic that is garnering increased interest, to the best of our knowledge, selected aspects of the eco-efficiency of the agricultural production of the EU countries have only been researched by Vlontzos et al. (2017) [31,32], albeit with the use of other indicators and methodologies. Therefore, the aim of this research, besides calculating the eco-efficiency scores for the agricultural production of the EU-28, is to provide answers to the following questions: how can the eco-efficiency of agriculture at the sector level be measured with the use of LCA+DEA methods, what kind of possible environmental and economic indicators can be used, which indicators may be omitted without influencing the results, and, finally, which impact categories cover the core environmental impacts of agriculture? Notwithstanding, such insights into the eco-efficiency performance of agriculture in the EU-28 may contribute to the adoption of better management techniques and more effective agricultural policies.
The paper is organised as follows. Section 2 outlines the materials and methods used for the present research, with a particular focus on the approach applied to calculate the environmental performance of agriculture. Section 3 presents the results of the eco-efficiency evaluation of agriculture in the EU-28. Subsequently, the achieved results and their limitations are discussed in Section 4, and, finally, Section 5 concludes the paper.

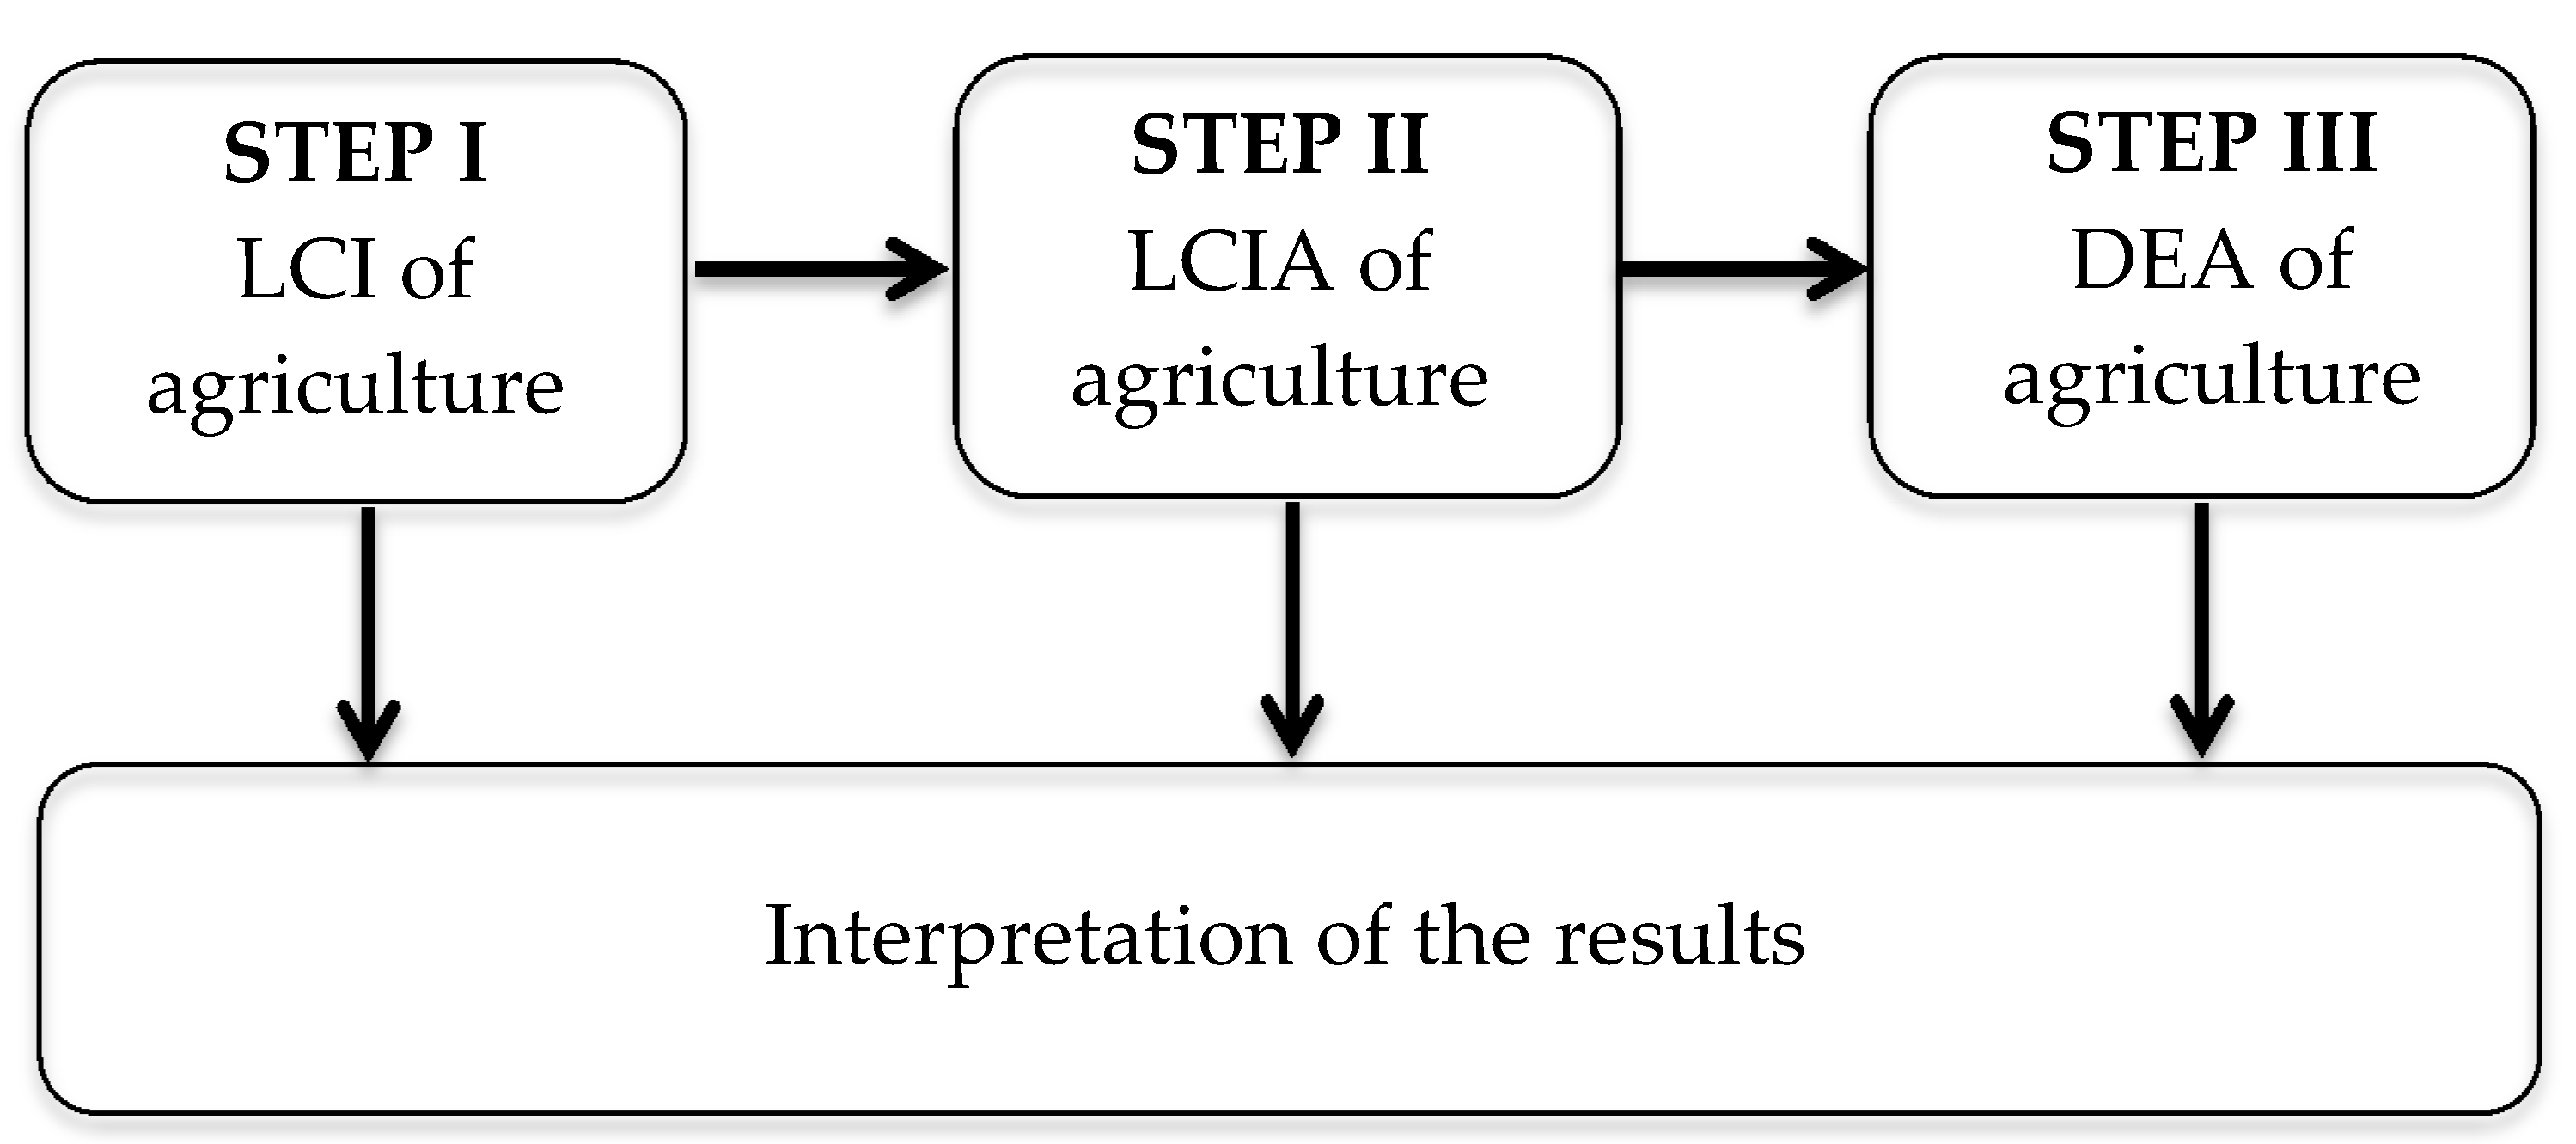
2. Materials and Methods

The joint application of LCA+DEA constitutes a relatively recent conceptual and methodological advancement in eco-efficiency quantification. It was introduced in 2009/2010 to provide a link between operational efficiency and environmental impacts [14,15]. The LCA+DEA methodology is applied as either a three-step LCA+DEA approach or a five-step LCA+DEA approach. The two formats of the joint application of LCA+DEA have analogues in the first and the second steps (i.e., the performance of the life cycle inventory (LCI) and life cycle impact assessment (LCIA) for each of the decision-making units (DMUs)) but differ in terms of the environmental inputs taken into account in the third step (i.e., the DEA analysis). While in the three-step approach, both the LCI and LCIA results are the inputs in the DEA calculation, in the five-step approach, the input set consists solely of the LCI results. Subsequently, in the five-step approach, the LCIA is performed according to the new LCI data obtained in the third step, and the achieved results are interpreted to improve eco-efficiency.
Considering the traits of both approaches, a modified three-step LCA+DEA methodology was applied for the eco-efficiency evaluation of agriculture in the EU-28 (Figure 1). It consists of the following steps:
  • The life cycle inventory (LCI) of agriculture for each of the member states of the European Union that involves the collection and calculation of relevant environmental inputs and outputs (indicators of natural resource consumption and environmental pressure indicators).
  • The life cycle impact assessment (LCIA) of agriculture for every member state of the European Union in order to translate the results of the LCI drawn in the first step into their contributions to relevant impact categories.
  • The eco-efficiency evaluation of agriculture for each member state of the European Union with the application of the DEA model, using a set of impact categories derived from the LCIA phase as input values and economic indicators as output values. This stage includes the process of environmental benchmarking.
As is apparent from the above description, the results of the LCIA constitute the only input set for the eco-efficiency quantification using the DEA method in this research. There are many arguments for such a methodological procedure. First and foremost, it is far more appropriate to quantify eco-efficiency based on environmental impacts rather than operational input–output LCI tables [25]. However, the former in contrast with the latter covers the consequences of man-made intervention from the life cycle point of view, including upstream and downstream processes. An additional advantage of the use of the LCIA results instead of those of the LCI in the DEA method is the better discriminatory power of the eco-efficiency analysis [22].
The first two steps (i.e., the LCI and LCIA) preceded by goal and scope definition, add up to the LCA. The LCA is regulated by ISO 14040:2006 (Environmental management—Life cycle assessment—Principles and framework) and ISO 14044:2006 (Environmental management—Life cycle assessment—Requirements and guidelines), and thus, the research was entirely performed according to the aforementioned standards with a few necessary adaptations regarding the choice of functional unit and characterisation method.

2.1. Life Cycle Assessment (LCA)

The LCA is defined as a method for the ‘compilation and evaluation of the inputs, outputs and the potential environmental impacts of a product system throughout its life cycle’ or ‘specific parts of the life cycle’ [33,34]. It is a relative approach, structured around a functional unit. Regarding the LCA studies of agriculture, different functional units may be used. Basically, they can be classified into mass-based or land-based units. A mass-based unit, also called a product-related functional unit, is applied when the same crop type and, thus, the same production systems are compared [35]. On the other hand, a land-based unit, also called an area-related functional unit, is applied when environmental impacts are caused by different agricultural production systems at a regional or local level [36]. Due to the fact that the LCA of agriculture in the EU-28 is performed at the sector level, the area-related functional unit of 1 ha was selected.
The scope of the analysis covers the agricultural sectors of the member states of the European Union. Through successive enlargements, currently the EU has 28 member countries (i.e., Austria, Belgium, Bulgaria, Croatia, Cyprus, the Czech Republic, Denmark, Estonia, Finland, France, Germany, Greece, Hungary, Ireland, Italy, Latvia, Lithuania, Luxembourg, Malta, the Netherlands, Poland, Portugal, Romania, Slovakia, Slovenia, Spain, Sweden, and the United Kingdom (Figure 2)). Agriculture occupied 213.6 million ha (i.e., 49% of the total land area of the European Union) in 2013, much of which was utilised agricultural area (174.4 million ha) [37]. In terms of the utilised agricultural area, France (16%) and Spain (13%), followed by the United Kingdom (10%), Germany (9.5%), Poland (8%), Romania (7.5%), and Italy (7%) had the largest share of the EU-28’s agricultural land.

2.1.1. Life Cycle Inventory (LCI)

The LCI is a phase of the LCA involving the collection and quantification of relevant environmental inputs and outputs [33,34]. The term environmental inputs and outputs refers to the elementary flows associated with the product system in the form of materials, energy, water, and emissions to air, water, and land, as well as other releases, such as noise, radiation, and odour [38].
In terms of the LCI of agriculture in the EU-28, a set of environmental inputs encompasses the following indicators of natural resources consumption:
  • Consumption of energy [in thousands Mg of oil equivalent],
  • Consumption of water [in million m3].
A set of environmental outputs encompasses the following environmental pressure indicators:
  • Use of fertilizers (including nitrogen and phosphorus) [in thousands Mg],
  • Use of pesticides (including fungicides and bactericides, herbicides, insecticides and acaricides, and molluscicides) and plant growth regulators [in Mg],
  • Emissions to air (including ammonia, carbon dioxide, carbon monoxide, methane, nitrogen oxides, non-methane volatile organic compounds (NMVOC), sulphur oxides, and particulates <2.5 µm) [in thousands Mg],
  • Production of waste (including chemical waste, recyclable waste (metal, glass, paper and cardboard, and plastic), wood waste, compost, sludge, mineral waste, and remaining waste) [in thousands Mg].
The choice of environmental inputs and outputs for the LCIA calculation of agriculture in the EU-28 was dictated by the availability of data from the European Statistical Office (Eurostat) and the Organisation for Economic Co-operation and Development (OECD). It ought to be emphasised, however, that in order to present the environmental state of the European agricultural sector as comprehensively and objectively as possible, all publicly available environmental data were applied in this research. The LCI of agriculture was based on the statistics of the agriculture, forestry, and fishing sector (Appendix A of NACE classification) of the 28 member states of the European Union.

2.1.2. Life Cycle Impact Assessment (LCIA)

The LCIA is a successive phase of the LCA aimed at understanding and evaluating the magnitude and significance of environmental inputs and outputs identified in the LCI phase [33,34]. It comprises the following steps: classification, characterisation, normalisation, grouping, and weighting, although, the last three are non-compulsory. Due to the fact that the weighting was based on the subjective value judgments of the LCIA results, it was excluded from the research.
The selection of the LCIA method remains the focal point for measuring environmental profiles. There is a broad library of mid- and endpoint methods available in SimaPro Software, which was applied to conduct this LCA analysis [39]. Considering the goal and scope of the current analysis, the ReCiPe Midpoint multi-impact characterisation method with the hierarchist perspective (ReCiPe Midpoint (H)) was selected. ReCiPe harmonises two families of LCIA methods: the midpoint-oriented CML 2002 method and the endpoint-oriented Eco-indicator 99 method. At the midpoint level, selected for this research, the ReCiPe method acknowledges the following impact categories, representing a broad scope of environmental problem areas, including: climate change (kg CO2 eq), ozone depletion (kg CFC-11 eq), terrestrial acidification (kg SO2 eq), freshwater eutrophication (kg P eq), marine eutrophication (kg N eq), human toxicity (kg 1,4-DB eq), photochemical oxidant formation (kg NMVOC), particulate matter formation (kg PM10 eq), terrestrial ecotoxicity (kg 1,4-DB eq), freshwater ecotoxicity (kg 1,4-DB eq), marine ecotoxicity (kg 1,4-DB eq), ionising radiation (kBq U235 eq), agricultural land occupation (m2a), urban land occupation (m2a), natural land transformation (m2), water depletion (m3), metal depletion (kg Fe eq), and fossil depletion (kg oil eq) [40].

2.2. Data Envelopment Analysis (DEA)

DEA was introduced by Charnes, Cooper, and Rhodes in 1978 as a mathematical programming-based approach to estimate the relative efficiency of decision-making units (DMUs) having multiple inputs and outputs [41]. DEA is considered to be a non-parametric method, because it is based on a series of optimisation issues. The goal of DEA is to indicate efficient DMUs and compute target efficient operating points for those DMUs that are found to be inefficient [15]. Consequently, DEA is a frontier method, because it works by projecting each unit on the efficient frontier on a [0, 1] scale, determined by the best practices.
The basic DEA model, known as CCR, assumes a constant return to scale (CRS), which means proportionality between the output and input values. Soon after, in 1984, Banker, Charnes, and Cooper introduced the second DEA model. The method, called BCC, assumes a variable return to scale (VRS), which means that the outputs do not change in proportion to the inputs. Therefore, it is chosen to be used in the following analysis. The dual form of the input-oriented BCC model can be presented as follows:
θ o m i n
i   j x i j λ j θ o x i o 0
r   j y i r λ j y i o 0
j λ j = 1
j   λ j 0
where θo is an eco-efficiency indicator of the j-th observed decision-making unit (DMU), λj is a weight coefficient, i stands for the inputs, r denotes the outputs, and o marks the input/output of the observed unit.
Considering the scope of the current research, the units of assessment, called DMUs, are the agricultural sectors of the member states of the European Union. They can be deemed as relatively homogenous for plenty of reasons. First and foremost, they serve similar functions, which include the cultivation of plants and livestock breeding, to provide food and raw materials. Moreover, they are subject to the CAP, and thus, each member state of the EU-28 is obliged to implement similar principles of sustainable agriculture that enable them to balance the economic growth of the agricultural sector with environmental protection [2]. Finally, agriculture in the EU-28 can be described by similar inputs and outputs. Due to the nature of the research, the normalised environmental impact categories of the ReCiPe midpoint multi-impact assessment method were selected as the inputs, whereas, following the recommendations of Gancone et al. (2017) [30], the gross domestic product (GDP) of agriculture was selected as the output in the BCC model.

3. Results

3.1. Inventory Analysis

Based on publicly available environmental data from the European Statistical Office (Eurostat) and the Organisation for Economic Co-operation and Development (OECD), the LCI of agriculture in the EU-28 was performed. The results of the LCI analysis are presented in a table format, which illustrates the environmental inputs and outputs of agriculture for each member state of the European Union separately (Table A1 of Appendix A).
The total consumption of energy by agriculture in the EU-28 amounted to 23.3 million Mg of oil equivalent that made up 2.2% of the final energy consumption of the European Union in 2015 [42]. There were considerable differences in the consumption of energy by agriculture across the member states of the European Union. The energy use by agriculture was the highest, in absolute values, in France (4.2 million Mg of oil equivalent), whereas, it was the highest per hectare, in the Netherlands (2.0 Mg of oil equivalent per ha). On the basis of available data, the overall consumption of water, including the public and private water supply, by agriculture in the EU-28 (except for Austria, Finland, Ireland, Italy, Portugal, and Sweden) accounted for 35,730.4 million of m3 [43,44]. Private (self and other water supplies) water supplies were a major source of water for agriculture in the EU-28.
In the EU-28, the use of fertilizers was at the level of 11.4 million Mg of nitrogen and 1.1 million Mg of phosphorus in 2015 [45]. Although, in absolute values, France was the biggest consumer of both nitrogen and phosphorus fertilizers (2.4 million Mg), the application rate of mineral fertilizers per hectare was the highest in the Netherlands (0.14 Mg per ha). The total sale of pesticides, including plant growth regulators, reached 383 thousand Mg in the EU-28 in 2015 [46]. Fungicides and bactericides were the most used group of pesticides (41% of the total), followed by herbicides, haulm destructors, and moss killers (34% of the total). Looking at the individual member states of the European Union, Spain (77.2 thousand Mg), France (66.8 thousand Mg), and Italy (63.0 thousand Mg) were the top three countries using the greatest amounts of pesticides in 2015. However, as regards the use of pesticides per ha, Malta (14.7 kg per ha), Cyprus (8.2 kg per ha), and the Netherlands (5.4 kg per ha) were the top three countries using the greatest amounts of pesticides in 2015.
The overall air pollutants, including ammonia, carbon dioxide, carbon monoxide, methane, nitrogen oxides, NMVOC, sulphur oxides, and particulates <2.5 µm, emitted by agriculture in the EU-28 in 2015 were at the level of 120 million Mg [47]. Moreover, cross sector analysis proved that agriculture caused 96% of the total ammonia emissions (3.7 million Mg) in 2015. Agricultural practices were also one of the primary sources of other air pollutants, such as methane (9.7 million Mg), nitrogen oxides (1.2 million Mg), NMVOC (1.2 million Mg), and particulates <2.5 µm (0.1 million Mg), albeit for smaller shares. In the EU-28, 18.8 million Mg of waste was generated by agriculture in 2014, which was 0.8% of the total waste generated in 2014 [48]. Across the EU member states, waste generation by agriculture varied from 5.8 million Mg in Spain to 3.0 thousand Mg in Luxembourg, predominantly due to the differences in the size of the agricultural sectors in the member states.

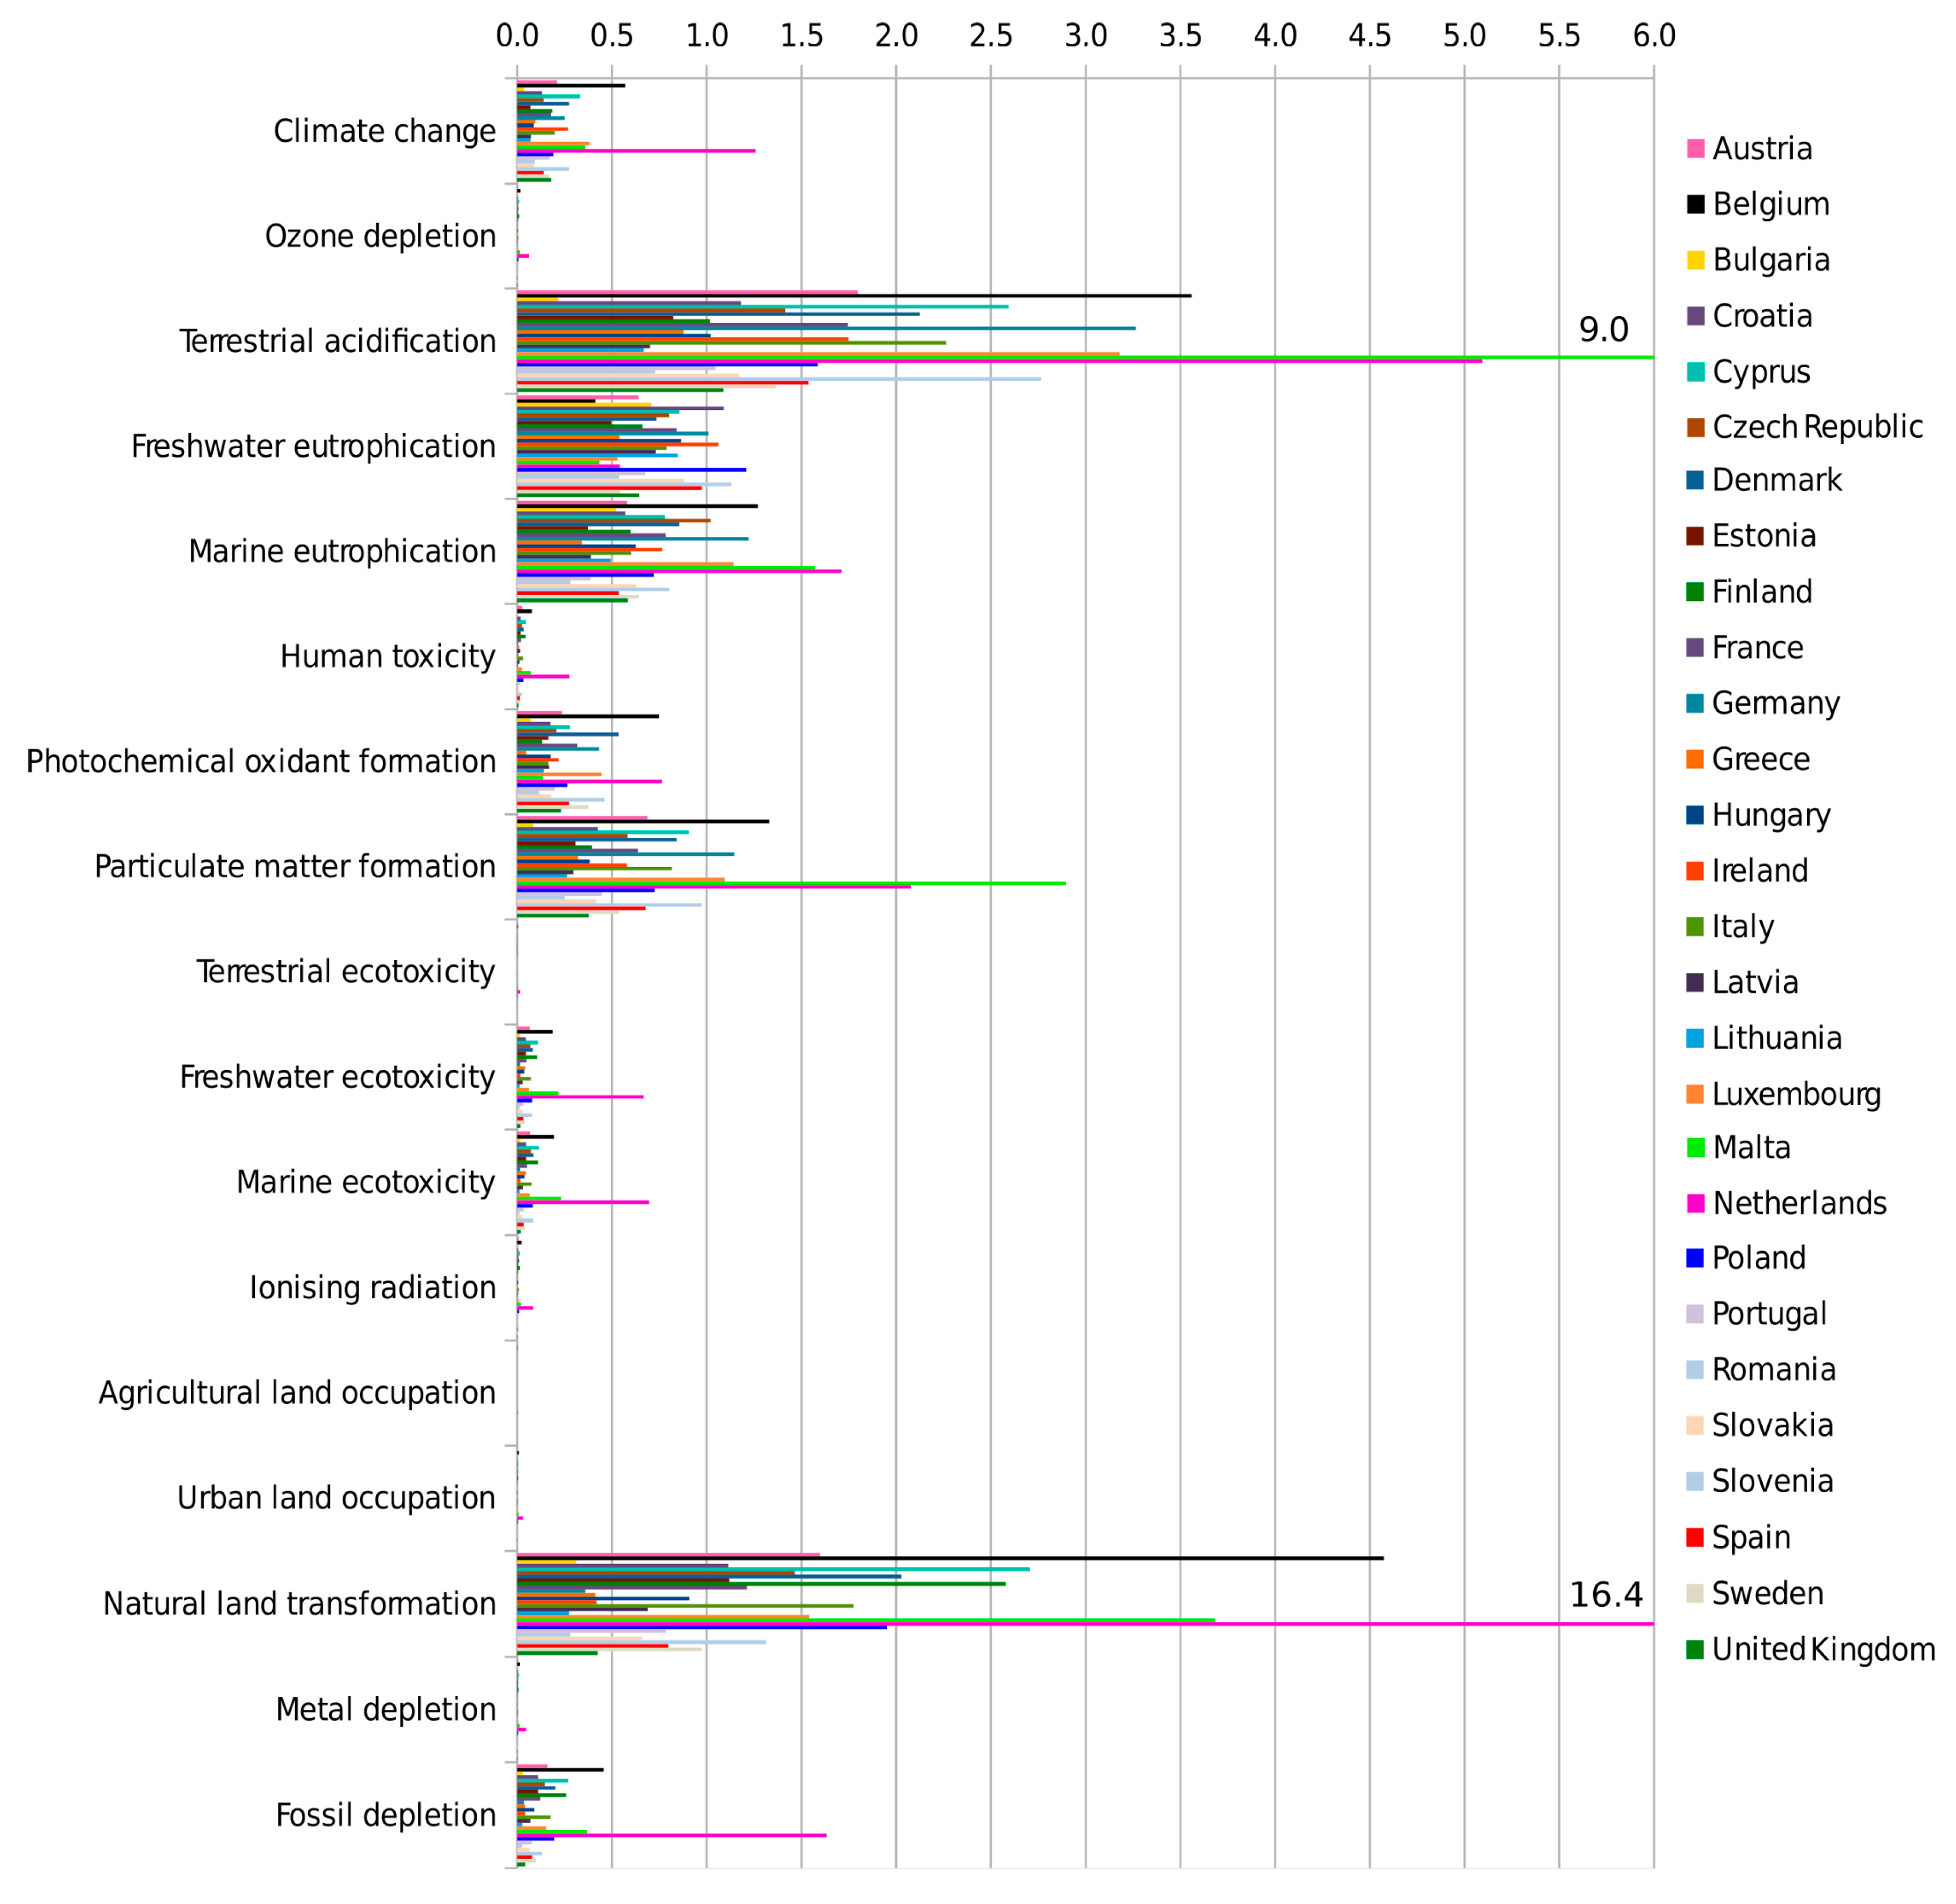
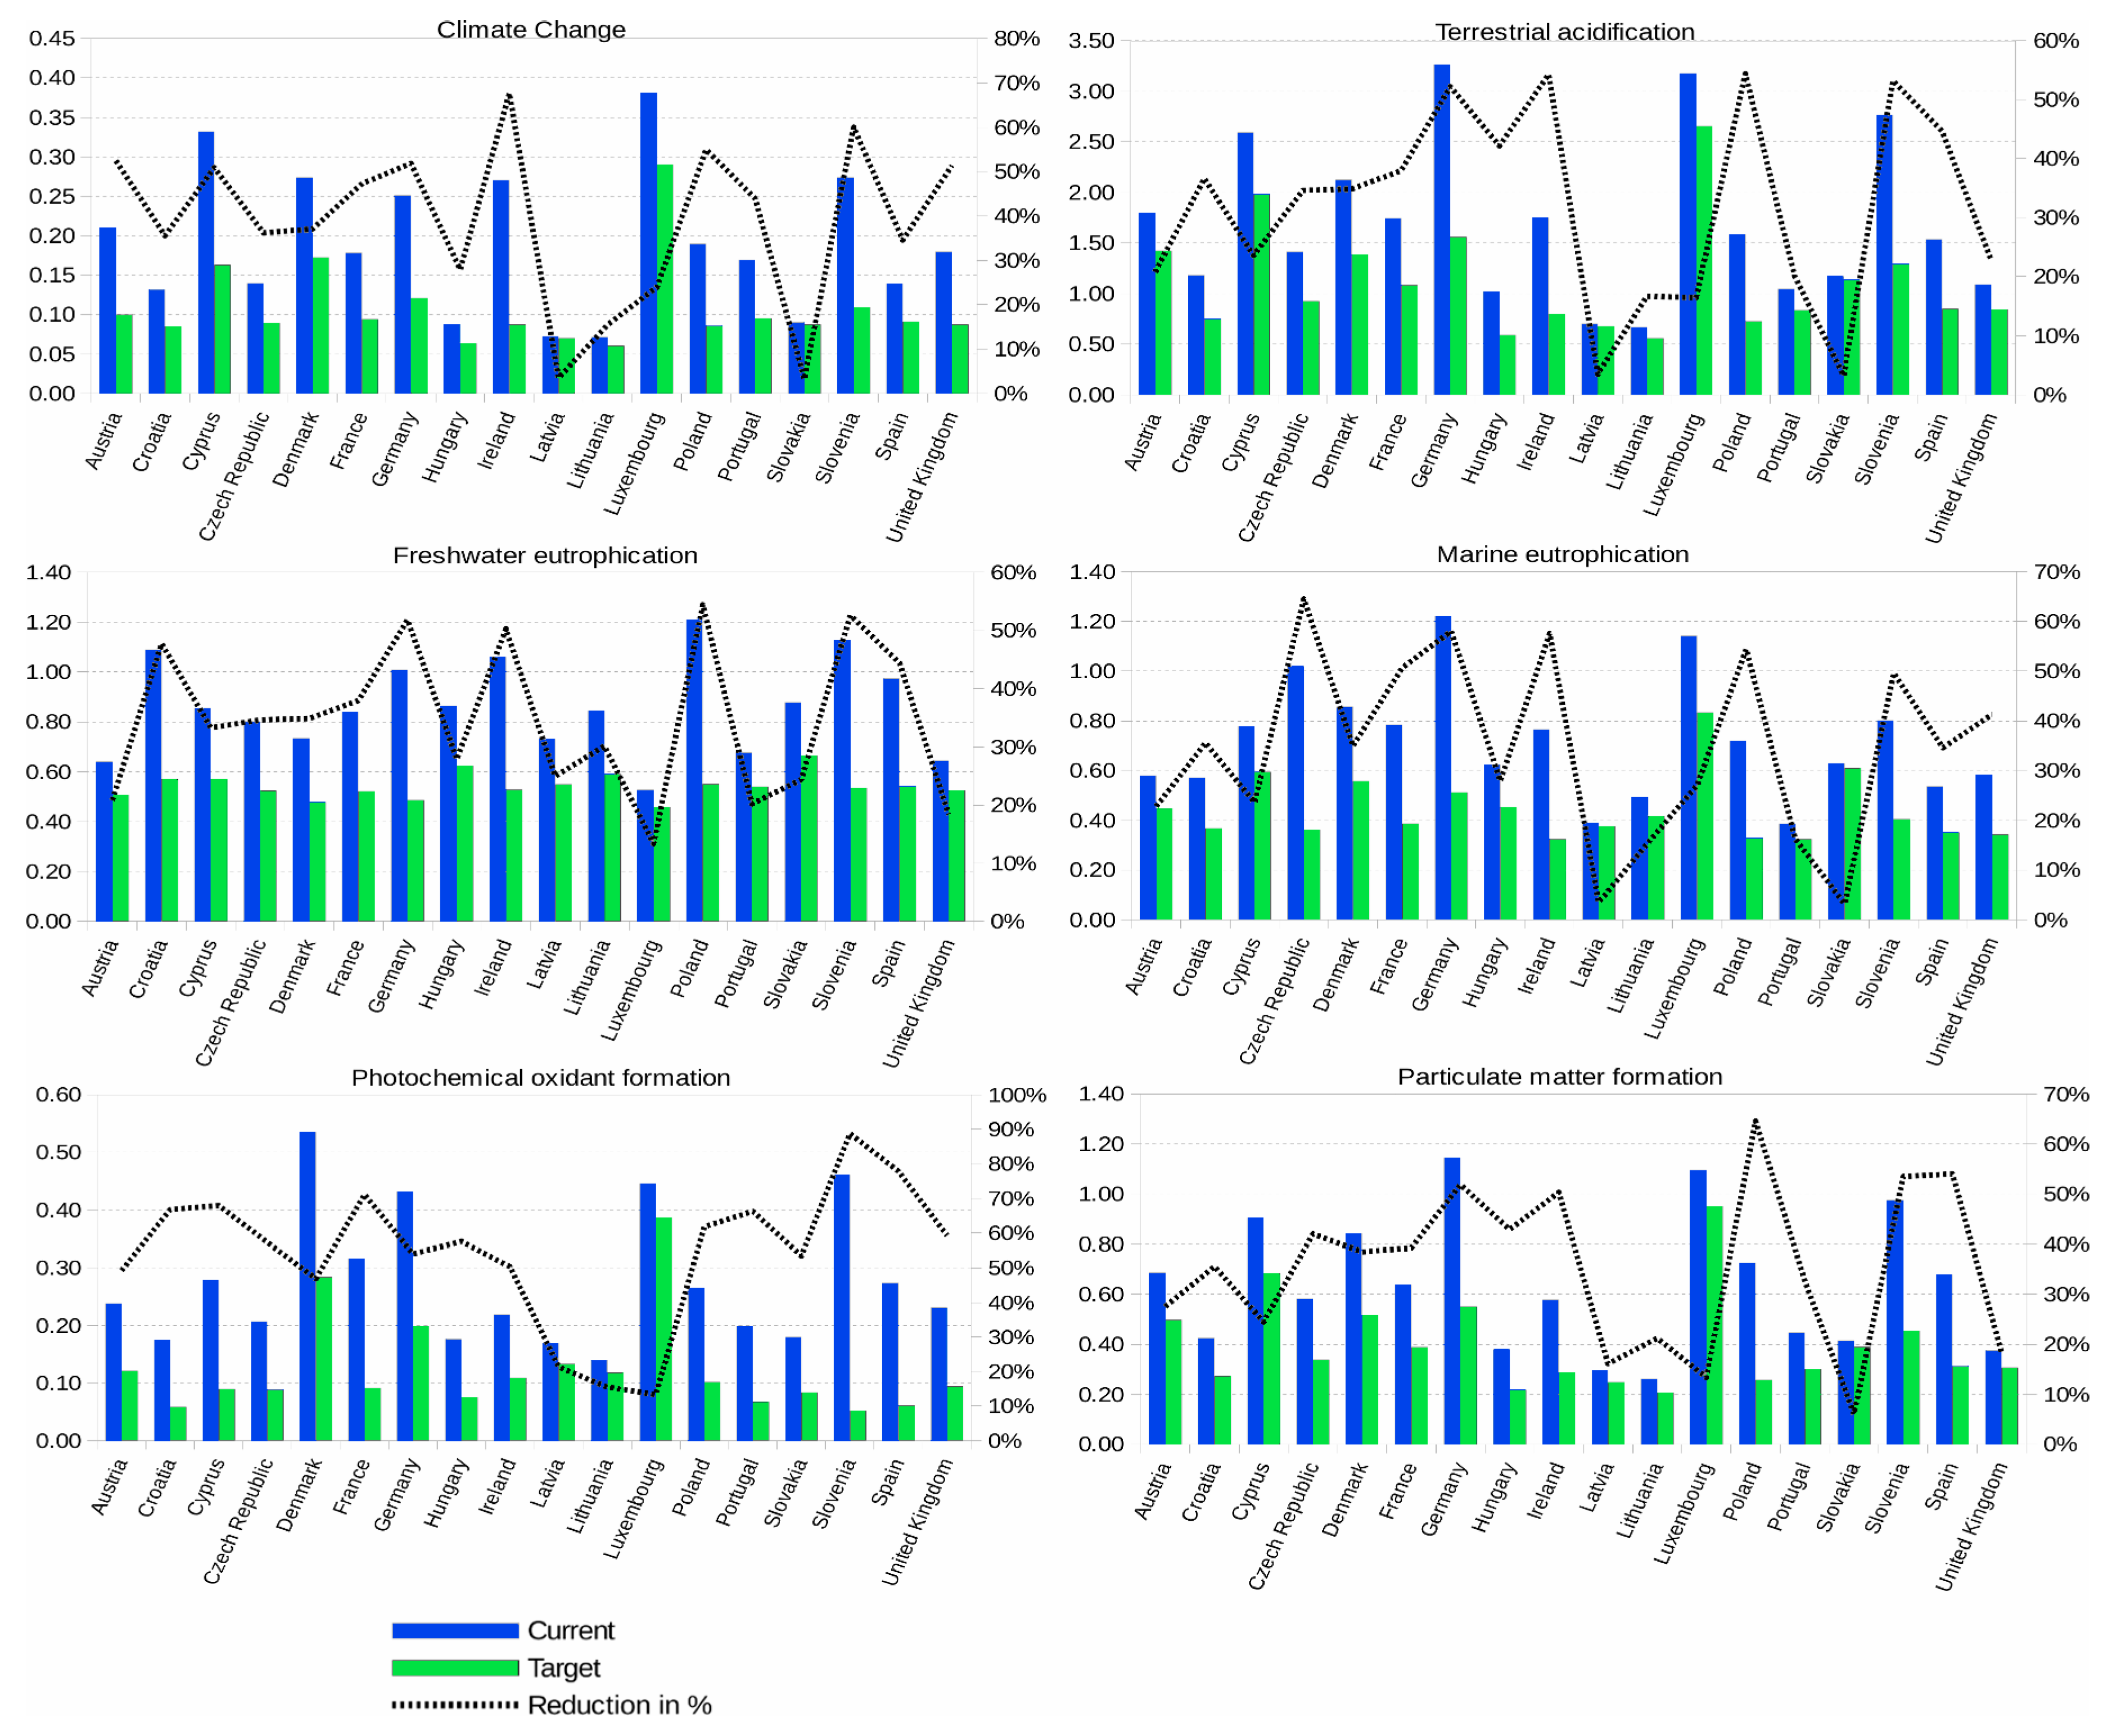
3.2. Impact Assessment

Based upon the LCI results, the LCIA profiles of the agricultural production of each member state of the European Union were calculated. As discussed in Section 2, the ReCiPe Midpoint (H) version was chosen as the impact assessment method. The impact categories of terrestrial, freshwater, and marine ecotoxicity were grouped into the larger category of ecotoxicity, whereas agricultural land occupation and urban land occupation were aggregated into land occupation.
The results of the characterisation step of agriculture in the EU-28 proved that the agricultural production in the Netherlands has the most detrimental impact on the environment in all impact categories, excluding terrestrial acidification, freshwater eutrophication, particulate matter formation, and water depletion (Figure 3, Table 1). In view of the above, the calculated characterization values for agriculture in the Netherlands, in the examined impact categories are as follows: climate change—14,110 kg CO2 eq·ha−1, ozone depletion—0.0014 kg CFC-11 eq·ha−1, marine eutrophication—17.33 kg N eq·ha−1, human toxicity—174.33 kg 1,4-DB eq·ha−1, photochemical oxidant formation—43.99 kg NMVOC·ha−1, ecotoxicity—13.52 kg 1,4-DB eq·ha−1, ionizing radiation—522.32 kBq U235 eq·ha−1, land occupation—27.69 m2a·ha−1, natural land transformation—2.64 m2·ha−1, metal depletion—34.3 kg Fe eq·ha−1, fossil depletion—2541 kg oil eq·ha−1. In the impact categories of terrestrial acidification, particulate matter formation and water depletion, agricultural practices in Malta received the highest scores: 308.45 kg SO2 eq·ha−1, 43.17 kg PM10 eq·ha−1 and 2494.7 m3·ha−1 respectively. As regards freshwater eutrophication, agriculture in Poland causes the greatest increase of phosphorus concentration in freshwater that is at the level of 0.50 kg P eq·ha−1.
The results of the normalization step of agriculture in the EU-28 revealed the environmental problem areas related to agricultural practices applied in the European Union (Figure 4). Thus, terrestrial acidification—55.56·ha−1, natural land transformation—52.33·ha−1, freshwater eutrophication—21.19·ha−1, marine eutrophication—20.81·ha−1 and particulate matter formation—20.48·ha−1 are the focal concerns of the agricultural sector. European agriculture causes also other environmental problems, such as: photochemical oxidant formation—7.66·ha−1, climate change—6.48·ha−1, fossil depletion—5.22·ha−1 and ecotoxicity (terrestrial, freshwater and marine)—4.68·ha−1, although to a lesser degree. In the remaining impact categories, the normalized impact on the environment is below 1·ha−1. Additionally, normalization confirmed that agriculture in the Netherlands has the most adverse impact on the environment in all pivotal categories, except for terrestrial acidification and particulate matter formation, in which the Netherlands was overtaken by Malta.
The results of the contribution analysis of agriculture in the EU-28 proved that airborne emissions (i.e., ammonia, carbon dioxide, carbon monoxide, methane, nitrogen oxides, NMVOC, sulphur oxides, and particulates <2.5 µm), use of fertilizers, and the consumption of energy are the predominant causative factors of the negative environmental impacts of EU agricultural practices. Gases causing acid deposition, including ammonia, nitrogen oxides, and sulphur oxides, are responsible for the formation of terrestrial acidification; the contribution of ammonia is 91% on average. Ammonia, together with particulates <2.5 µm, also plays a significant role in terms of particulate matter formation. Greenhouse gases, including carbon dioxide and methane, are responsible for climate change, although the share of methane is 68% on average. NMVOC and nitrogen oxides are responsible for photochemical oxidant formation. The use of phosphorus and nitrogen fertilizers causes freshwater and marine eutrophication, respectively. The contribution of phosphorus fertilizers in freshwater eutrophication exceeds 99% in the agricultural sectors of Bulgaria, Germany, Ireland, Lithuania, and Romania, whereas the contribution of nitrogen fertilizers in marine eutrophication reaches the level of 75% and above in the agricultural sectors of Bulgaria, the Czech Republic, Finland, Hungary, Lithuania, and the United Kingdom. Finally, the consumption of energy by agriculture in the EU-28 leads to considerable changes in the quality of the land associated with natural land transformation.

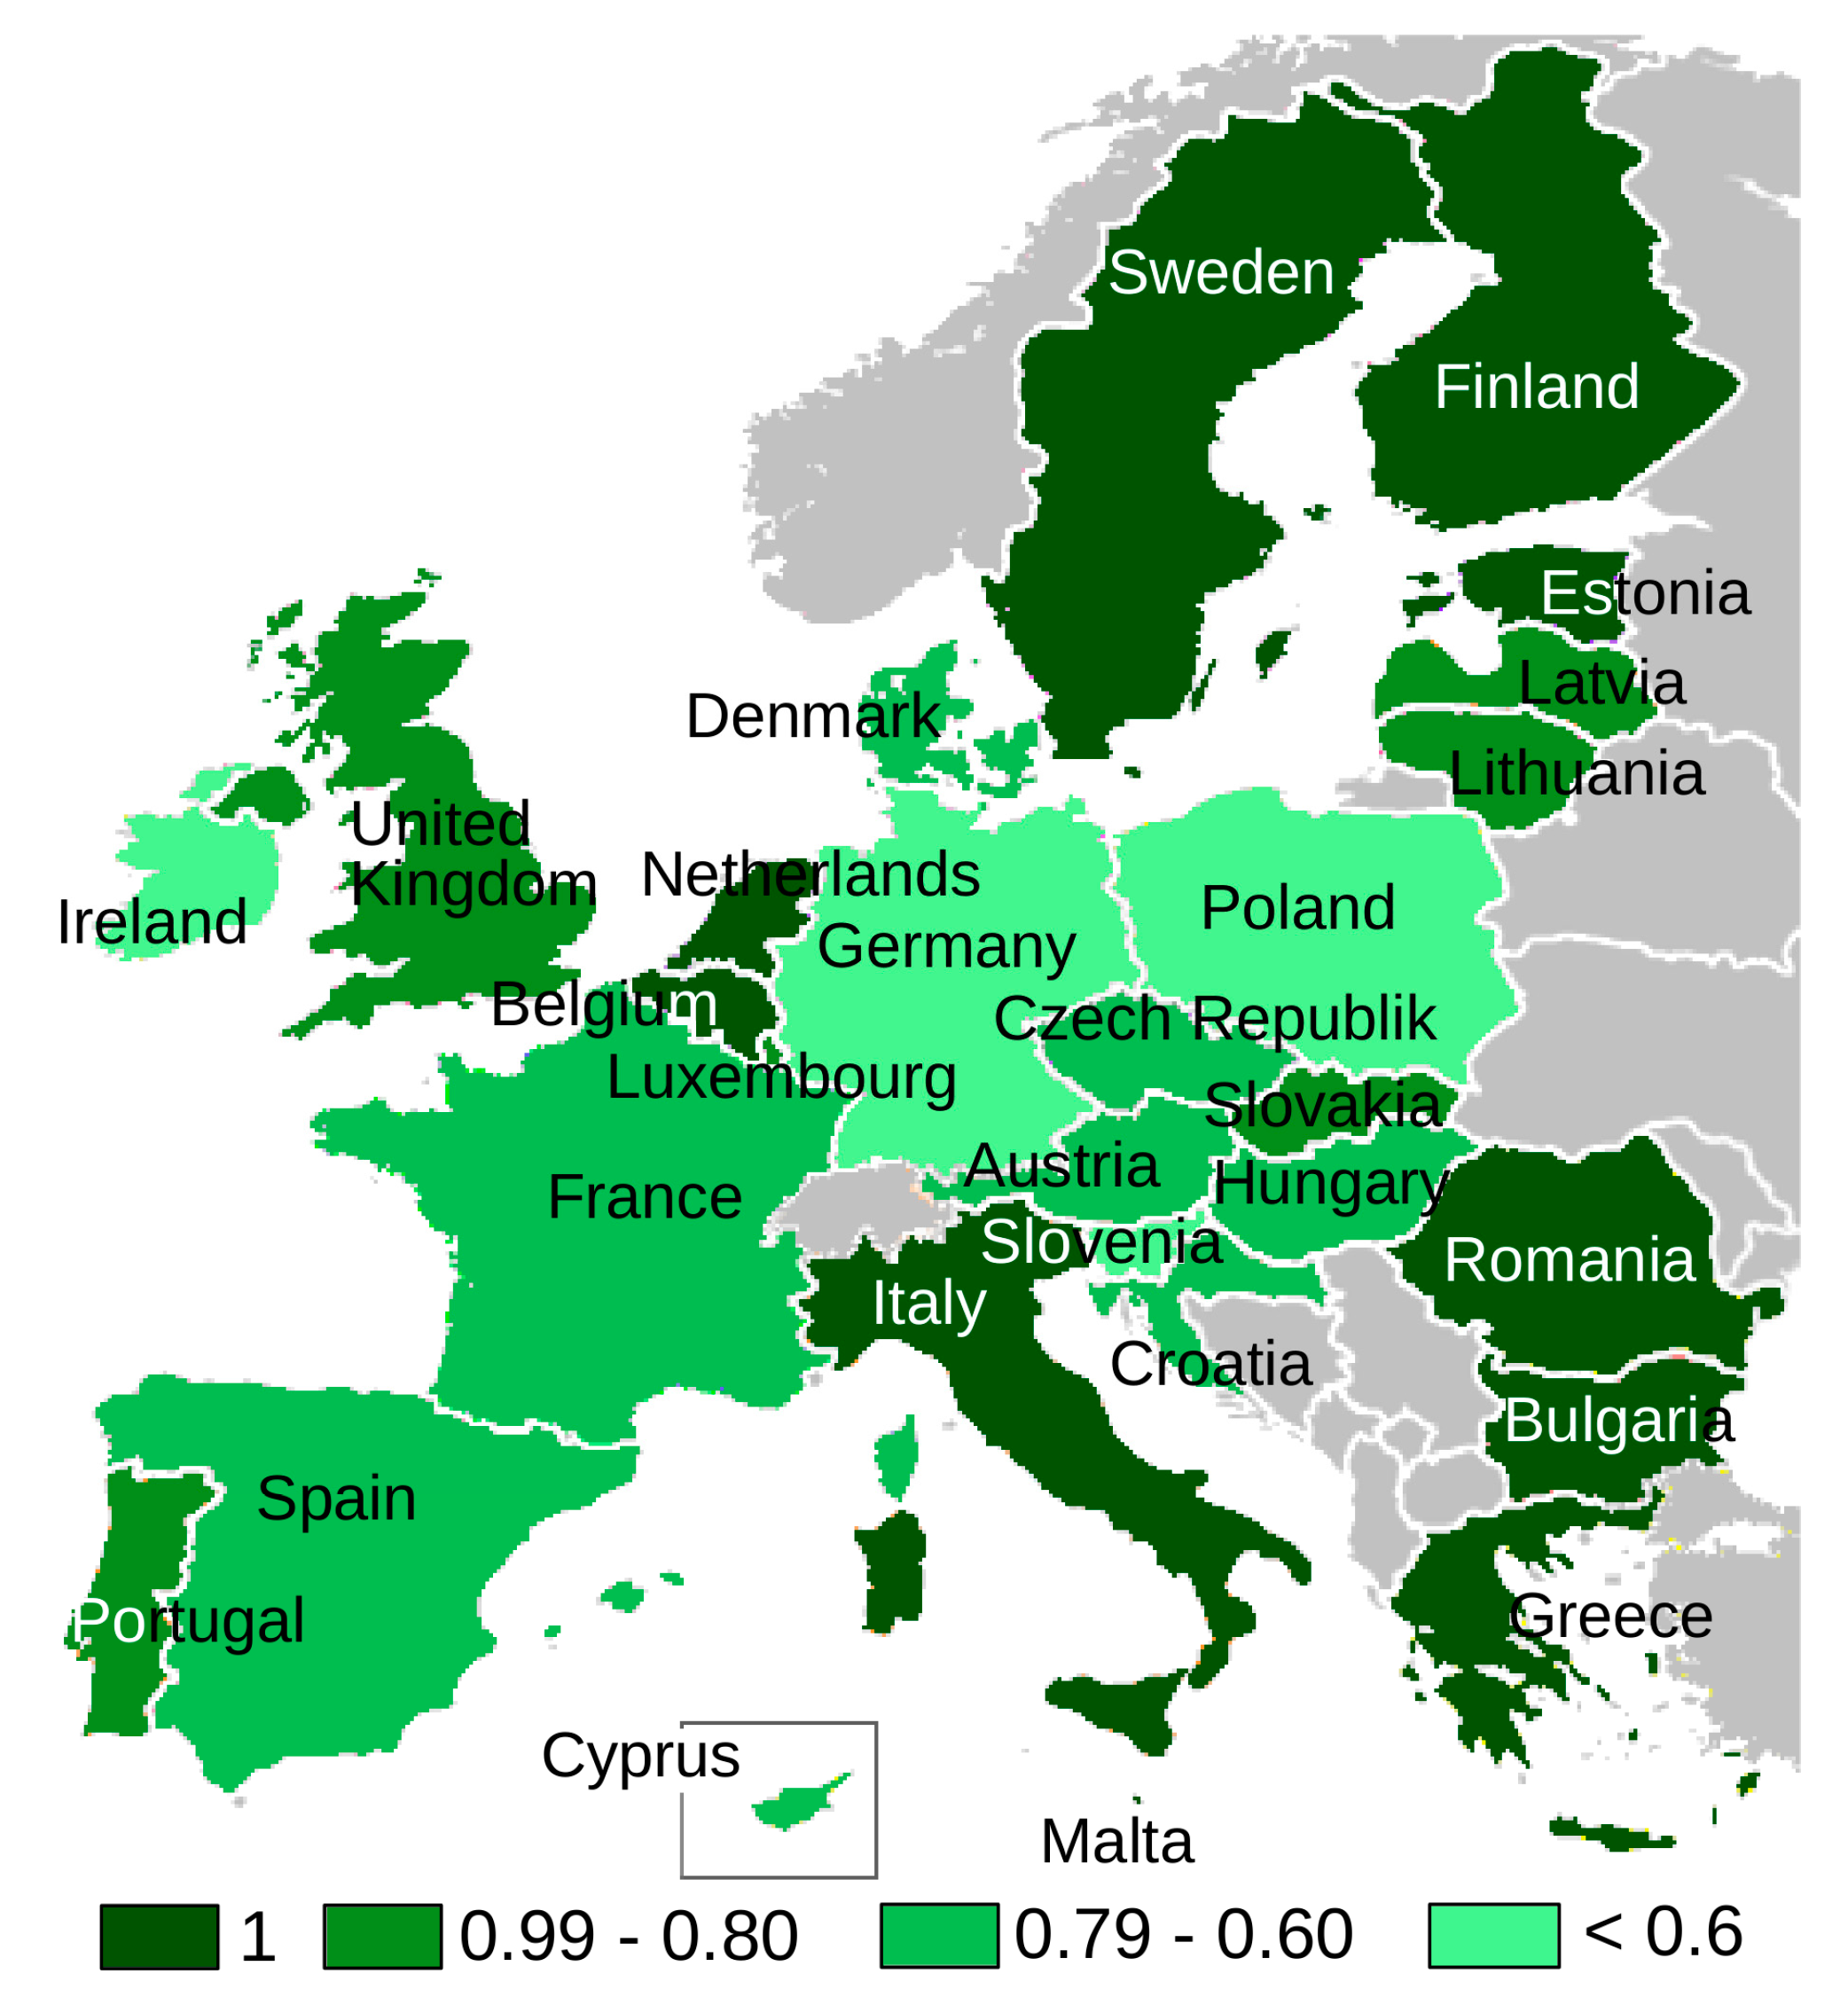
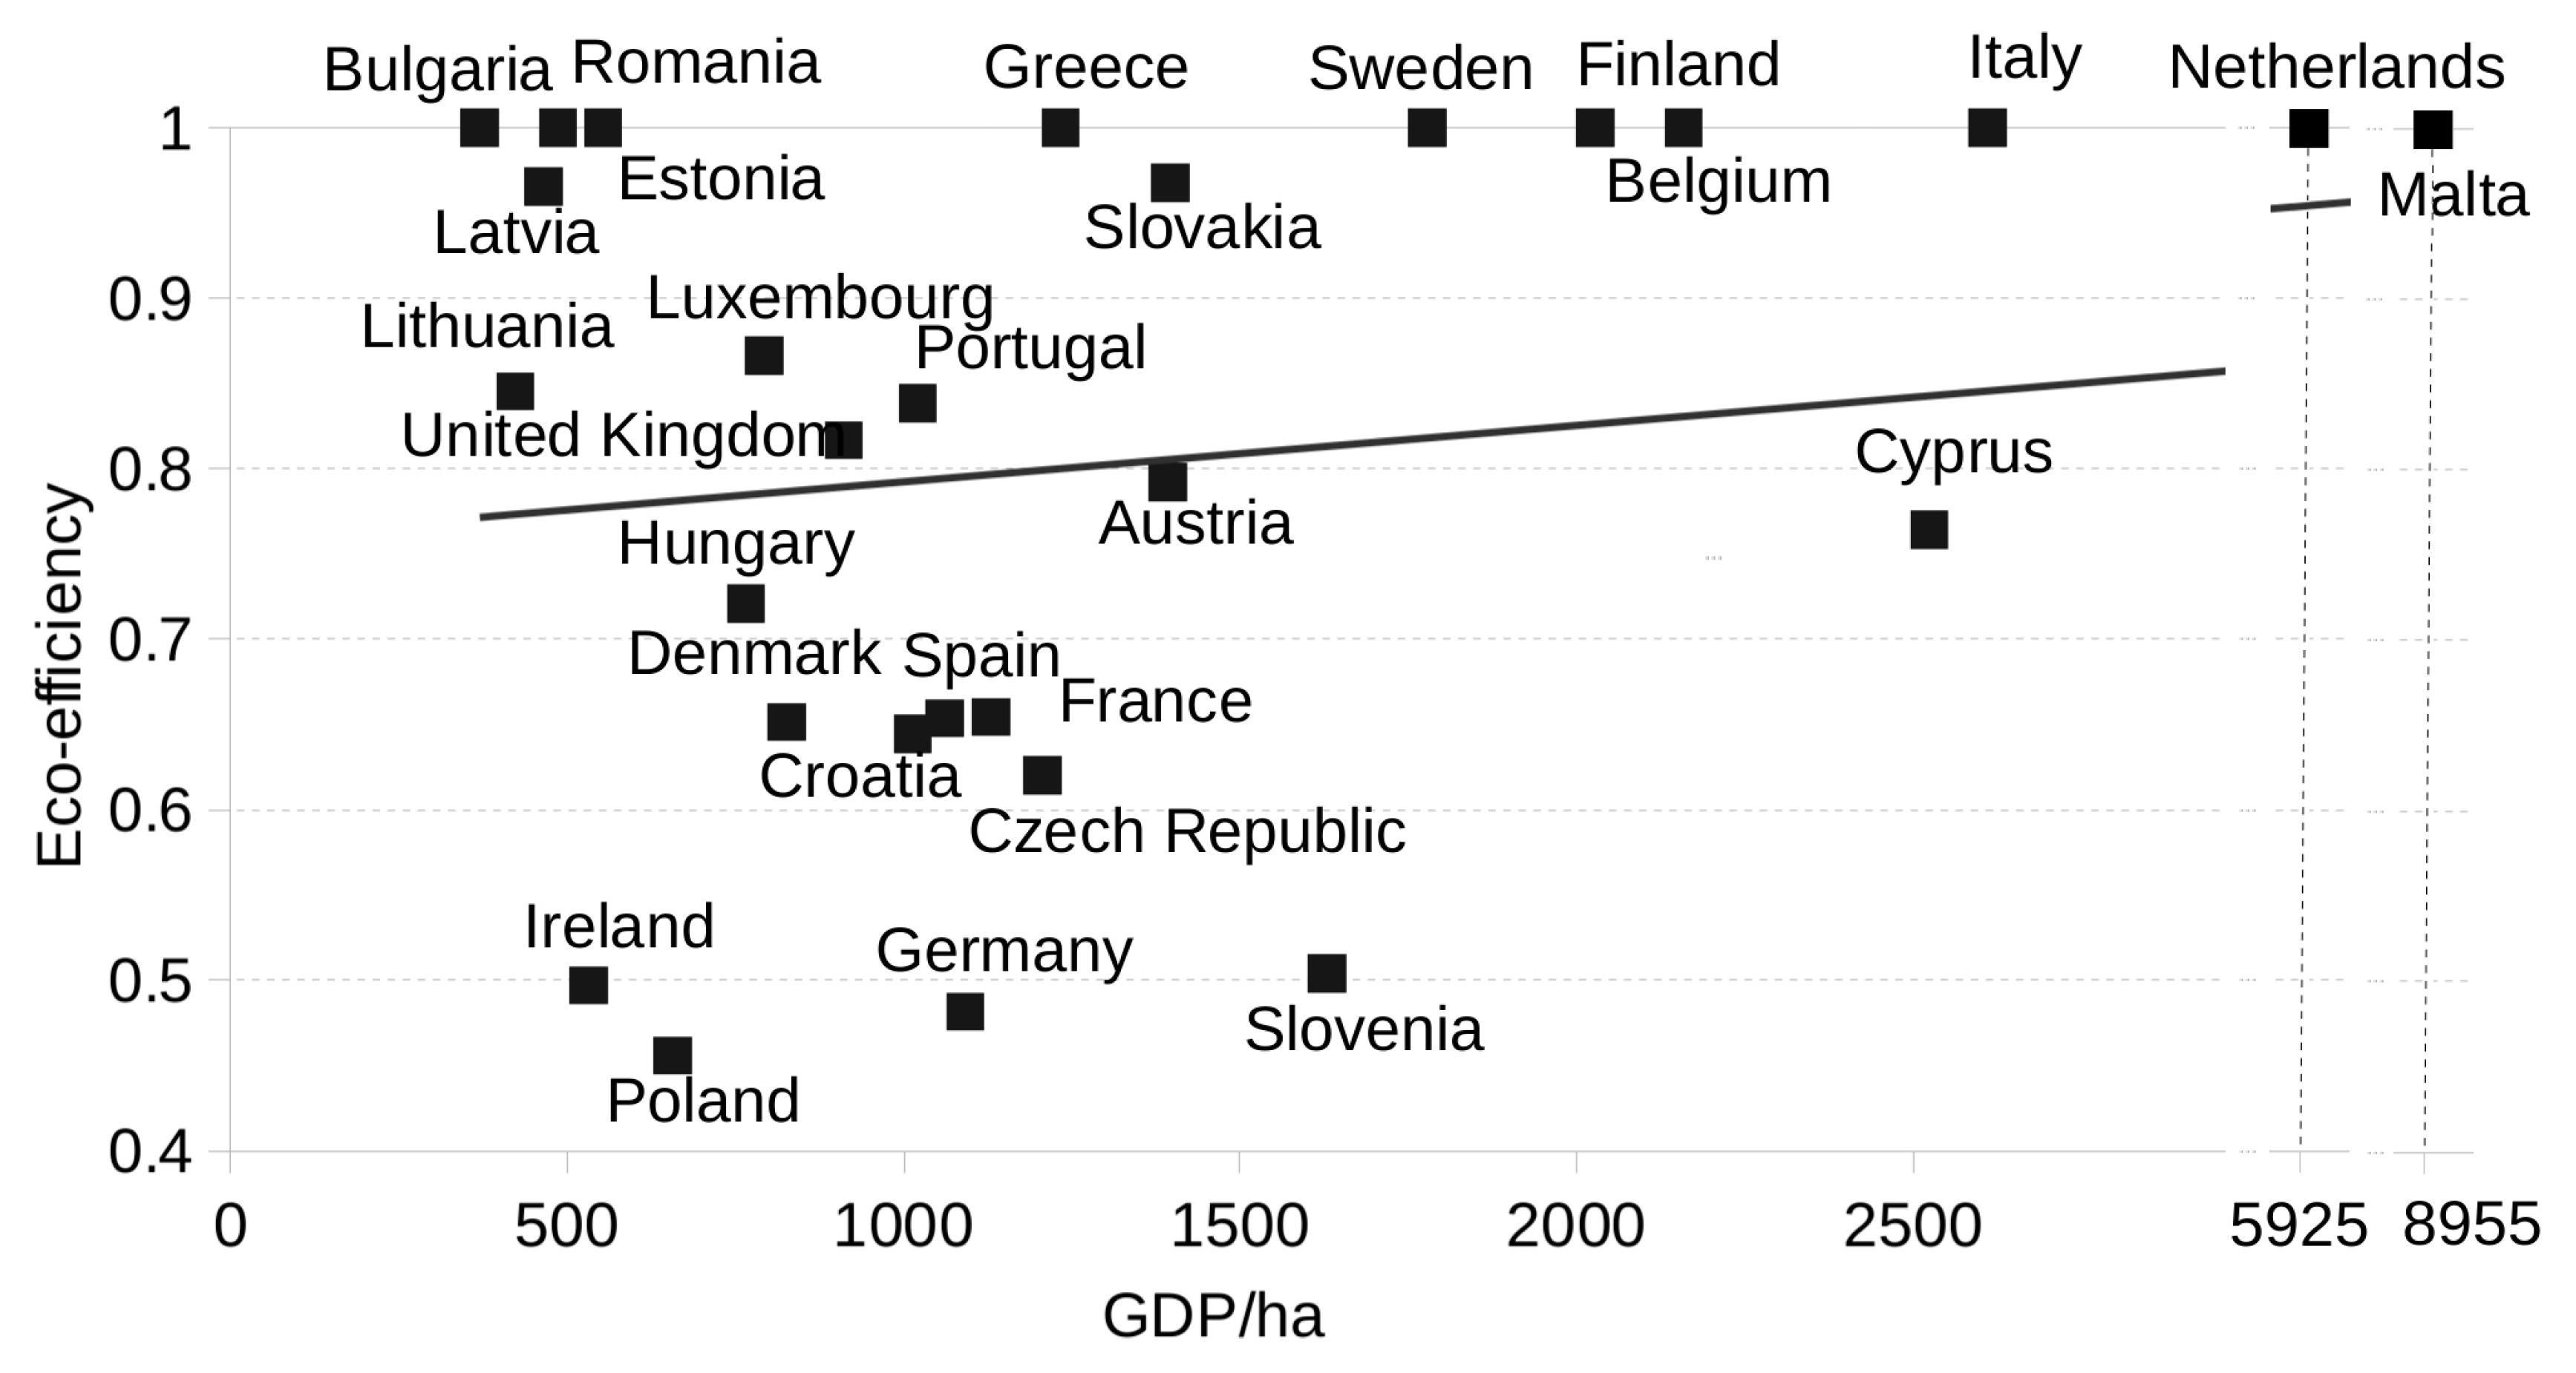
3.3. DEA Performance

The foundation for the calculation of the eco-efficiency performance of agriculture in the EU-28 was a set of selected normalised environmental impact categories and gross domestic products (GDP), all referenced to the utilised agricultural area of 1 ha. As the large number of inputs (normalised environmental impact categories) to the number of DMUs (agricultural sectors analysed) may diminish the discriminatory power of DEA, the correlation matrix was assessed (Table A2 of Appendix A). By calculating the correlation coefficients, however, it is possible to reduce the number of inputs [49,50]. Due to the fact that the correlation coefficients ρn,m for n,m = {1, 7 … 17} are close to 1 and for each n = {2 … 6} the correlation coefficients ρn,m where m = {1, 7 … 17} are constant, the set of inputs marked by n = {1, 7 … 17} may be represented by climate change. Consequently, six inputs—climate change, terrestrial acidification, freshwater eutrophication, marine eutrophication, particulate matter formation, and photochemical oxidant formation—were selected for the eco-efficiency analysis of agriculture in the EU-28. The rule that the number of DMUs should be at least three times greater than the number of inputs and outputs combined was met [51].
The GDP of the agricultural sector in the EU-28 was at the level of 205.561 million Euro and thus accounted for 1.4% of the EU-28’s GDP in 2015 (Table A3 of Appendix A) [52,53]. Despite the relatively low share of agriculture in generating the EU-28’s GDP, there is a group of member states in which agriculture has a considerably higher contribution to the GDP (i.e., Bulgaria (4.1%), Greece (3.7%), Hungary (3.7%), Latvia (3.6%), and Croatia (3.5%)). Cross-country analysis also showed that France, Italy, and Spain recorded the highest GDPs from agriculture, with 17.4%, 16.4%, and 13.1% shares of the total EU agricultural GDP, respectively.
In order to calculate the eco-efficiency performance of agriculture in the EU-28, the DEA method of the input-oriented BCC model was used. Therefore, 28 problems of linear programming were solved. For instance, the linear programming problem for the agricultural sector in Germany can be expressed in the following manner:
  • Decision variables
    θo, λo1, λo2, …… λo28
  • Objective function
    θomin
  • Problem Constraints
    1393λo1 + 2159λo2 + 370λo3 + …… +1779λo27 + 911λo28 ≥ 1092
    0.21λo1 + 0.57λ o2 + 0.036λo3 + …… + 0.169λo27 + 0.180λo28 ≤ 0.251θo
    1.799λo1 + 3.56λo2 + 0.215λo3 + …… +1.364λo27 + 1.088λo28 ≤ 3.264θo
    0.641λo1 + 0.412λo2 + 0.709λo3 + …… + 0.544λo27 + 0.645λo28 ≤ 1.01θo
    0.58λo1 + 1.27λo2 + 0.523λo3 + …… + 0.643λo27 + 0.584λo28 ≤ 1.221θo
    0.238λo1 + 0.749λo2 + 0.073λo3 + …… + 0.377λo27 + 0.231λo28 ≤ 0.432θo
    0.687λo1 + 1.331λo2 + 0.087λo3 + …… + 0.539λo27 + 0.376λo28 ≤ 1.145θo
    λo1 + λo2 + λo3 + …… + λo27 + λo28 = 1
    θo ≤ 1
  • Non-Negativity Constraints
    θo, λo1, λo2, ……, λo28 ≥ 0.
The results of the eco-efficiency evaluation of agriculture in the EU-28 revealed that the agricultural sector of 10 member states of the European Union is 100% eco-efficient (Figure 5). At the top of the eco-efficiency ranking of agriculture in the EU-28, with a score of 1, are Belgium, Bulgaria, Estonia, Finland, Greece, Malta, the Netherlands, Romania, Sweden, and Italy. They are followed by the member states with relatively high eco-efficiency scores for agriculture, with scores above or equal to 80%, such as Latvia, Lithuania, Luxembourg, Portugal, Slovakia, and the United Kingdom. The last in the ranking, with an eco-efficiency level of agriculture below 60%, are Germany, Ireland, Poland, and Slovenia. Given the aforementioned ranking of the eco-efficiency performance of agriculture of the EU-28, the agricultural sectors of the member states can be assigned into the following groups:
  • Eco-efficiency leaders, having eco-efficiency scores of 1 (i.e., agriculture in Belgium, Bulgaria, Estonia, Finland, Greece, Malta, the Netherlands, Romania, Sweden, and Italy);
  • Eco-efficiency followers, having relatively high eco-efficiency scores, in the range of 0.99–0.80, (i.e., agriculture in Latvia (0.97), Lithuania (0.85), Luxembourg (0.87), Portugal (0.84), Slovakia (0.97), and the United Kingdom (0.82));
  • Eco-efficiency moderates, having eco-efficiency scores in the range of 0.79–0.60 (i.e., agriculture in Austria (0.79), Croatia (0.64), Cyprus (0.76), the Czech Republic (0.65), Denmark (0.65), France (0.62), Hungary (0.72), and Spain (0.65)); and
  • Eco-efficiency laggards, having eco-efficiency scores below 0.6 (i.e., Germany (0.48), Ireland (0.50), Poland (0.46) and Slovenia (0.50)).
The eco-efficiency performance of the agricultural sectors in the EU-28 was contrasted with the corresponding ratios of GDP (Figure 6). The results confirmed the findings of recent research [9,54] that there is a correlation between eco-efficiency and GDP level and thus, apart from Bulgaria, Estonia and Romania, the agricultural sectors of the eco-efficiency leaders of the European Union also have the highest GDP per ha, e.g., Malta—8955 Euro, the Netherlands—5925 Euro, Italy—2611 Euro, Belgium—2159 Euro, Finland—2028 Euro, Sweden—1779 Euro and Greece—1233 Euro. However, it is important to underscore the fact that high GDP does not guarantee achieving high eco-efficiency scores as in, for instance, the cases of agriculture in Cyprus—2525 Euro, Slovenia—1629 Euro and France—1206 Euro.
For the eco-inefficient agricultural sectors, so-called ‘optimal technology’ can be established using the optimal intensity weights derived from the BCC optimising procedure. This consists of a combination of technologies from eco-efficiency leaders—alleged benchmarks, which enable the member states of the European Union to decrease the environmental impacts related to agriculture, while maintaining the current levels of GDP. Although the agricultural sectors in the EU-28 require different improvements depending upon their eco-inefficiency level, on average, to achieve eco-efficiency, they ought to predominantly follow the patterns set by Greece (31%), Estonia (22%), and Bulgaria (11%). Analogously, in order to be eco-efficient, the eco-inefficient agricultural sectors require a reduction in their environmental impacts, including a decrease of an average of 38% in climate change, 30% in terrestrial acidification, 35% in freshwater and marine eutrophication, 54% in photochemical oxidant formation, and 35% in particulate matter formation (Figure 7). The most eco-inefficient agriculture in the European Union requires the highest reductions, and thus, agriculture in Ireland requires the highest reduction (68%) in climate change; agriculture in Poland requires the highest reduction (54%, 54%, and 65%) in terrestrial acidification, freshwater eutrophication and particulate matter formation, respectively; agriculture in the Czech Republic requires the highest reduction (64%) in marine eutrophication, and, finally, agriculture in Slovenia requires the highest reduction (88%) in photochemical oxidant formation.

4. Discussion

The research has provided a valuable insight into the eco-efficiency performance of agriculture in the EU-28. It proved, though, that the agricultural sectors of 10 member states of the European Union are relatively eco-efficient. These are Belgium, Bulgaria, Estonia, Finland, Greece, Malta, the Netherlands, Romania, Sweden, and Italy. Considering the nature of the eco-efficiency evaluation, the eco-efficiency leaders of agriculture can be allocated into two groups. The first group comprises the agricultural sectors with relatively low environmental performance as expressed by the following impact categories: climate change, terrestrial acidification, eutrophication (freshwater and marine), photochemical oxidant formation, and particulate matter formation per ha, but high economic performance as expressed by the current level of GDP per ha (i.e., Belgium, Finland, Greece, Malta, the Netherlands, Sweden, and Italy). The second group comprises the agricultural sectors of relatively high environmental, but low economic performance (i.e., Bulgaria, Estonia, and Romania).
Man-made interventions and, thus, the eco-efficiency performance of agriculture is heavily dependent on the type of crops and intensity of agricultural production processes. In this sense, the agricultural sectors of the eco-efficiency leaders have a lot in common, because in all the member states that have eco-efficient agricultural production, except Estonia, Finland, and Malta, agricultural crop products are significantly higher than livestock products, exceeding even 70% of the total agricultural output in Bulgaria, Greece, and Romania [55]. Moreover, in most of the member states that have agricultural sectors with good eco-efficiency performance, vegetables and horticultural products form the largest agricultural crop output, such as the Netherlands 39%, Malta 32%, Italy 20%, Greece 17%, and Finland 14%. Cereals form another important agricultural crop output in the eco-efficient agricultural sectors in the EU-28, and thus, they constitute 35% in Bulgaria, 25% in Romania, 22% in Estonia, and 14% in Sweden of the total agricultural production. Furthermore, Bulgaria, Greece, Italy, and Romania are significant grape producers in comparison with the agricultural sectors of other member states of the European Union. Finally, Greece, together with Italy, are the largest olive producers in the EU-28.
18 member states of the EU-28 (Austria, Croatia, Cyprus, the Czech Republic, Denmark, France, Germany, Hungary, Ireland, Latvia, Lithuania, Luxembourg, Poland, Portugal, Slovakia, Slovenia, Spain, and the United Kingdom) have eco-inefficient agricultural sectors, though to a varying extent. This means that they consume too many natural resources (in particular, energy), use excessive quantities of fertilizers, and produce considerable amounts of airborne emissions in relation to the current level of GDP per ha. The research also revealed that waste generation does not have a significant influence on the results of the environmental performance of agriculture and thus can be omitted in the future eco-efficiency evaluations of agriculture at the sector level. The main environmental problem areas of agriculture in the EU-28 are terrestrial acidification, natural land transformation, eutrophication (freshwater and marine), particulate matter formation, photochemical oxidant formation, climate change, fossil depletion, and ecotoxicity (freshwater, marine, and terrestrial).
Due to complexity of the scope of the research, it is impossible to discuss the reasons for eco-inefficiency of agriculture in all the member states of the European Union. In general, the main environmental impacts of agriculture arise from animal husbandry and on-field activities related to the cultivation of plants, and thus, they strongly depend upon applied agricultural production methods, topographic and climatic conditions, and the type of agricultural output. Consequently, there might be many reasons for the relatively low environmental performance of agriculture in the EU-28, including the concentration of agricultural production, the use of machinery, the heating of livestock stables and greenhouses, the use of mineral fertilizers (nitrogen and phosphorus), and pesticides (of which production is very energy consuming), lack of crop rotation, and, finally, the inadequate storage and handling of livestock slurries and manure. Interestingly, the research also disclosed that livestock products form the dominant agricultural output in all the eco-inefficient agricultures in the EU-28, except in the agricultural sectors of the Czech Republic, France, Slovenia, Latvia, Lithuania, Portugal, and Slovakia, but the last four are eco-efficiency followers.
Owing to the fact that several assumptions and simplifications were made in the eco-efficiency evaluation of agriculture in the EU-28, the achieved results are not free from limitations. The major potential limitations are the lack of up-to-date, complete data on water consumption by agriculture, the under-representation of pesticide impacts on the environment in the currently available LCIA methods [56], and the lack of adaptation of the natural land transformation impact category to agricultural production systems [36]. Neither does the research investigate in-depth the mechanisms behind the environmental and economic relationship in the agricultural sectors. In addition, if other, for instance, functional unit, environmental inputs and outputs, economic indicators, impact categories, and calculation methods were adopted, the eco-efficiency assessment might produce different results.

5. Conclusions

Despite the continuous endeavours of the European Commission, the agricultural production in the European Union still faces a challenge to reconcile high environmental and economic performance. The research revealed, though, that only 10 member states of the EU-28 have been able to reach eco-efficiency in their agricultural production. This implies that policymakers ought to strengthen their efforts to encourage the implementation of environmentally sound farming techniques of plant cultivation and animal husbandry through, for instance, agri-environmental payments.
Current research on the eco-efficiency performance of agriculture in the EU-28 proves that the joint application of LCA+DEA is a valuable alternative methodology for measuring the eco-efficiency of agriculture at the sector level. Firstly, by using LCA, it is possible to assess the direct and indirect environmental impacts associated with agricultural production and convert them into relevant impact categories. Secondly, by using DEA, it is possible to incorporate several environmental impact categories and economic indicators into one aggregated score that concurrently describes environmental and economic performance instead of using many different scores that complicate the interpretation of results. Finally, in contrast to the ratio approach, the joint application of LCA+DEA does not require assigning subjective weights.
Future research, based on the findings obtained in this study, could unfold in several directions. In the first place, due to the fact that the many of the biggest agricultural sectors in the European Union in terms of GDP, such as France, Germany, and Poland belong to the group of eco-efficiency moderates or eco-efficiency laggards, exploring these agricultural production systems in a more comprehensive manner is highly recommended. Secondly, more research is also required from the methodological perspective to test the proposed LCA+DEA approach to the eco-efficiency assessment, including the merit of alternative types of joint LCA+DEA methods.

Author Contributions

Conceptualization, Methodology, Formal Analysis and Discussion M.R.B.; Formal Analysis, Discussion and Project Administration W.G.

Funding

This research was supported by the German Academic Exchange Service (Deutscher Akademischer Austauschdienst, DAAD) under grant no. 57314019.

Acknowledgments

The authors would like to thank Michael Schmidt from Brandenburgische Technische Universität Cottbus-Senftenberg for valuable scientific support.

Conflicts of Interest

The authors declare no conflict of interest.

Appendix A

Table A1. Simplified LCI table of the agricultural sectors for the EU-28 (base year of 2015).
CountryIndicators of Natural Resources ConsumptionEnvironmental Pressure Indicators
FertilizersPesticidesAir PollutantsWaste
Consumption of Energy [in thousand Mg of oil equivalent]Consumption of Water [in million m3]Nitrogen FertilizersPhosphorus FertilizersFungicides and BactericidesHerbicidesInsecticides and AcaricidesMolluscicidesPlant Growth RegulatorsAmmoniaCarbon DioxideCarbon MonoxideMethaneNitrogen OxideNMVOCSulphur OxideParticulates <2.5 µmChemical Waste *Recyclable Waste *Wood Waste *Animal and Vegetable Waste *Sludge *Mineral Waste *Waste, Remaining *
[in thousand Mg][in Mg][in thousand Mg][in thousand Mg]
Austria516M1251321281317196211166315272618321110.12.410.514.722.261.00.10.319.4
Belgium7223714432586237357627852602126823919320.8264.39.51.6122.01.55.760.2
Bulgaria186359342286196362860.30.31210833328120.30.30.41.41.3773.00.421.837.3
Croatia203308713131582113963024785255680.20.50.51.60.025800.174.5
Cyprus415680.8698*153*180*1*1.2*4840.3150.80.80.00.10.80.71.41000.0754.5
Czech Republic6076239721211928893272195560160023141333.50.632.76.51.0265.418.774.5
Denmark63324320414511190355111266921571922234410.921.315.03.4434.57.554.9
Estonia132536410947228MM1085125350.00.36.42.65.7890.00211.65.8
Finland695M14311225136819M251929172723104840.710.048.00.040.060.020
France41922788*22081872735230575246680256836641486315416381733101.82043.0132.07.07420.020.6348
Germany715288*1822131126021680695426517966724142146412991742182.0140.818.17.7285352.471.9
Greece258722116422192713156941242635534419971.70.230.05.505000
Hungary577323*3583638684270827M5196922065109272.30.11.470.42.70.84110.323.512.2
Ireland221M331376882098601026710710881.44896430.1223.748.50120011.8
Italy2664M5187538861795124299013688378817011574282150.11165.538.818.770992.438.5
Latvia154397611270861170.636216480738980.210.83.90.4200.0229.3
Lithuania9861167206331289280303254441.47613100.50.72.29.8143480.00525.721.6
Luxembourg240.7130.5M83M1166540.12011.70.00.050.10.10.110.410.2
Malta5290.60.03119530.7451120.010.10.00.00.020.00.10.1200.00.3
Netherlands3583125*24544379288129234241211110045105565830.53.52.722.73.843994.8152184
Poland336699010041327738121901539M2529259142222295801632241.623.51.36.822.33860.555.340.1
Portugal345M1211951932122561302095461991321933250.420.711.12.7210.28.15.9
Romania45823575841426353676231013813581851212730.0547.53.90541006.8
Slovakia15030MM6391218100M285298396418100.10.46.60.84.95532.54.42.6
Slovenia746.728475922438M2217238447470.00.30.00.227.0750.0030.40.3
Spain2262219631068180364231558666916718449459122615129482201113.742.536.761.019.653586.715.2320
Sweden350M19012398182930M505222513913223370.325.023.705952.7028
United Kingdom8631072104986603211464658M31712536375531106281800.47.52031702.21660.732.284
* data from 2013 or 2014; M-missing data.
Table A2. Correlations between environmental impact categories.
Impact CategoryClimate ChangeTerrestrial AcidificationFreshwater EutrophicationMarine EutrophicationPhotochemical Oxidant FormationParticulate Matter FormationTerrestrial EcotoxicityFreshwater EcotoxicityMarine EcotoxicityHuman ToxicityIonising RadiationOzone DepletionAgricultural Land OccupationUrban land OccupationNatural Land TransformationMetal DepletionFossil Depletion
Impact CategoryNO.1234567891011121314151617
Climate change11.000.62−0.260.790.780.710.950.940.940.950.950.950.950.950.950.950.95
Terrestrial acidification20.621.00−0.260.850.420.990.540.610.610.560.540.540.560.540.540.560.54
Freshwater eutrophication3−0.2−0.21.00−0.1−0.1−0.2−0.3−0.30−0.3−0.3−0.3−0.3−2.3−2.2−2.3−2.3−2.28
Marine eutrophication40.790.85−0.161.000.690.890.680.710.720.690.680.680.690.680.680.690.68
Photochemical oxidant formation50.780.42−0.110.691.000.510.630.610.610.630.630.640.630.630.640.630.64
Particulate matter formation60.710.99−0.250.890.511.000.630.690.690.650.630.630.650.630.630.650.63
Terrestrial ecotoxicity70.950.54−0.290.680.630.631.000.990.990.990.990.990.990.990.990.990.99
Freshwater ecotoxicity80.940.61−0.300.710.610.690.991.000.990.990.990.990.990.990.990.990.99
Marine ecotoxicity90.940.61−0.310.720.610.690.990.991.000.990.990.990.990.990.990.990.99
Human toxicity100.950.56−0.290.690.630.650.990.990.991.000.990.990.990.990.990.990.99
Ionising radiation110.950.54−2.290.680.630.630.990.990.990.991.000.990.990.990.990.990.99
Ozone depletion120.950.54−0.280.680.640.630.990.990.990.990.991.000.990.990.990.990.99
Agricultural land occupation130.950.56−0.290.690.630.650.990.990.990.990.990.991.000.990.990.990.99
Urban land occupation140.950.54−2.290.680.630.630.990.990.990.990.990.990.991.000.990.990.99
Natural Land Transformation150.950.54−2.280.680.640.630.990.990.990.990.990.990.990.991.000.990.99
Metal depletion160.950.56−2.290.690.630.650.990.990.990.990.990.990.990.990.991.000.99
Fossil depletion170.950.54−2.280.680.640.630.990.990.990.990.990.990.990.990.990.991.00
Table A3. Gross domestic products of agriculture in the EU-28 (base year of 2015).
CountryGDP
[in million Euro][in percent of the country total][in percent of the EU agriculture total]
Austria37891.11.9
Belgium28730.71.4
Bulgaria18574.10.9
Croatia15583.50.8
Cyprus3191.80.2
Czech Republic37062.21.7
Denmark21740.81.1
Estonia5492.70.3
Finland46112.22.3
France351081.617.4
Germany182620.68.9
Greece65243.73.3
Hungary40973.72.0
Ireland23580.90.9
Italy330522.016.4
Latvia8763.60.4
Lithuania12733.40.6
Luxembourg1040.20.1
Malta1051.10.1
Netherlands109351.65.4
Poland94612.24.6
Portugal37762.11.8
Romania67334.23.2
Slovakia26833.41.3
Slovenia7772.00.4
Spain270002.513.1
Sweden53881.22.6
United Kingdom156130.66.9

References

  1. EU (the European Parliament and the Council). Decision No 1386/2013/EU on a General Union Environment Action Programme to 2020 ‘Living Well, within the Limits of Our Planet’; EU: Brussels, Belgium. Available online: https://eur-lex.europa.eu/legal-content/EN/TXT/PDF/?uri=CELEX:32013D1386&from=EN (accessed on 20 March 2018).
  2. COM (Commission of the European Communities). Communication from the Commission to the Council and the European Parliament ‘Indicators for the Integration of Environmental Concerns into the Common Agricultural Policy’; COM: Brussels, Belgium, 2000. [Google Scholar]
  3. Godard, C.; Bamière, L.; Debove, E.; De Cara, S.; Jayet, P.A.; Niang, N.B. Interface between Agriculture and the Environment: Integrating Yield Response Functions in an Economic Model of EU Agriculture. Modelling Agricultural Policies: State of the Art and New Challenges; University of Parma: Parma, Italy, 2005; pp. 475–494. [Google Scholar]
  4. International Organization for Standardization. Environmental Management—Eco-Efficiency Assessment of Product Systems—Principles, Requirements and Guidelines; International Organization for Standardization: Geneva, Switzerland, 2012. [Google Scholar]
  5. Huppes, G.; Ishikawa, M. A framework for quantified eco-efficiency analysis. J. Ind. Ecol. 2005, 9, 25–41. [Google Scholar] [CrossRef]
  6. Huppes, G.; Ishikawa, M. A Quantified Eco-Efficiency an Introduction with Applications; Springer: Dordrecht, The Netherlands, 2007; ISBN 978-1-4020-5399-3. [Google Scholar]
  7. WBCSD (World Business Council for Sustainable Development). Eco-Efficiency Learning Module. 2005. Available online: http://www.wbcsd.org/pages/EDocument/EDocumentDetails.aspx?ID=13593 (accessed on 30 June 2018).
  8. Yu, Y.; Chen, D.; Zhu, B.; Hu, S. Eco-efficiency trends in China, 1978–2010: Decoupling environmental pressure from economic growth. Ecol. Indic. 2013, 24, 177–184. [Google Scholar] [CrossRef]
  9. Zhang, B.; Bi, J.; Fan, Z.; Yuan, Z.; Ge, J. Eco-efficiency analysis of industrial system in China: A data envelopment analysis approach. Ecol. Econ. 2008, 68, 306–316. [Google Scholar] [CrossRef]
  10. Dyckhoff, H.; Allen, K. Measuring ecological efficiency with data envelopment analysis. Eur. J. Oper. Res. 2001, 132, 312–325. [Google Scholar] [CrossRef]
  11. Kuosmanen, T.; Kortelainen, M. Measuring eco-efficiency of production with data envelopment analysis. J. Ind. Ecol. 2005, 9, 59–72. [Google Scholar] [CrossRef]
  12. Huang, J.; Yang, H.; Cheng, G.; Wang, S. A comprehensive eco-efficiency model and dynamics of regional eco-efficiency in China. J. Clean. Prod. 2014, 67, 228–238. [Google Scholar] [CrossRef]
  13. Rybaczewska-Błażejowska, M.; Masternak-Janus, A. Eco-efficiency assessment of Polish regions: Joint application of life cycle assessment and data envelopment analysis. J. Clean. Prod. 2018, 172, 1180–1192. [Google Scholar] [CrossRef]
  14. Lozano, S.; Iribarren, D.; Moreira, M.T.; Feijoo, G. The link between operational efficiency and environmental impacts: A joint application of life cycle assessment and data envelopment analysis. Sci. Total Environ. 2009, 407, 1744–1754. [Google Scholar] [CrossRef]
  15. Iribarren, D.; Vázquez-Rowe, I.; Moreira, M.T.; Feijoo, G. Further potentials in the joint implementation of life cycle assessment and data envelopment analysis. Sci. Total Environ. 2010, 408, 5265–5272. [Google Scholar] [CrossRef]
  16. Mouron, P.; Scholz, R.W.; Nemecek, T.; Weber, O. Life cycle management on Swiss fruit farms: Relating environmental and income indicators for apple-growing. Ecol. Econ. 2006, 58, 561–578. [Google Scholar] [CrossRef]
  17. Iribarren, D.; Hospido, A.; Moreira, M.T.; Feijoo, G. Benchmarking environmental and operational parameters through eco-efficiency criteria for dairy farms. Sci. Total Environ. 2011, 409, 1786–1798. [Google Scholar] [CrossRef] [PubMed]
  18. Basset-Mens, C.; Ledgard, S.; Boyes, M. Eco-efficiency of intensification scenarios for milk production in New Zealand. Ecol. Econ. 2009, 68, 1615–1625. [Google Scholar] [CrossRef]
  19. Picazo-Tadeo, A.J.; Gómez-Limón, J.A.; Reig-Martinez, E. Assessing farming eco-efficiency: A Data Envelopment Analysis approach. J. Environ. Manag. 2011, 92, 1154–1164. [Google Scholar] [CrossRef] [PubMed]
  20. Gómez-Limón, J.A.; Picazo-Tadeo, A.J.; Reig-Martinezb, E. Eco-efficiency assessment of olive farms in Andalusia. Land Use Policy 2012, 29, 395–406. [Google Scholar] [CrossRef]
  21. Vázquez-Rowe, I.; Villanueva-Rey, P.; Iribarren, D.; Teresa Moreira, M.; Feijoo, G. Joint life cycle assessment and data envelopment analysis of grape production for vinification in the Rias Baixasappellation (NW Spain). J. Clean. Prod. 2012, 27, 92–102. [Google Scholar] [CrossRef]
  22. Jan, P.; Dux, D.; Lips, M.; Alig, M.; Dumondel, M. On the link between economic and environmental performance of Swiss dairy farms of the alpine area. Int. J. Life Cycle Assess. 2012, 17, 706–719. [Google Scholar] [CrossRef]
  23. Mohammadi, A.; Rafiee, S.; Jafari, A.; Dalgaard, T.; Knudsen, M.T.; Keyhani, A.; Mousavi-Avval, S.; Hermansen, J. Potential greenhouse gas emission reductions in soybean farming: A combined use of life cycle assessment and data envelopment analysis. J. Clean. Prod. 2013, 54, 89–100. [Google Scholar] [CrossRef]
  24. Mohammadi, A.; Rafiee, S.; Jafari, A.; Keyhani, A.; Dalgaard, T.; Knudsen, M.T.; Nguyen, T.; Borek, R.; Hermansen, J. Joint Life Cycle Assessment and Data Envelopment Analysis for the benchmarking of environmental impacts in rice paddy production. J. Clean. Prod. 2015, 106, 521–532. [Google Scholar] [CrossRef]
  25. Masuda, K. Measuring eco-efficiency of wheat production in Japan: A combined application of life cycle assessment and data envelopment analysis. J. Clean. Prod. 2016, 126, 373–381. [Google Scholar] [CrossRef]
  26. Pang, J.; Chen, X.; Zhang, Z.; Li, H. Measuring eco-efficiency of agriculture in China. Sustainability 2016, 8, 398. [Google Scholar] [CrossRef]
  27. Ullah, A.; Perret, S.R.; Gheewala, S.H.; Soni, P. Eco-efficiency of cotton-cropping systems in Pakistan: An integrated approach of life cycle assessment and data envelopment analysis. J. Clean. Prod. 2016, 134, 623–632. [Google Scholar] [CrossRef]
  28. Forleo, B.; Palmieri, N.; Suardi, A.; Coaloa, D.; Pari, L. The eco-efficiency of rapeseed and sunflower cultivation in Italy. Joining environmental and economic assessment. J. Clean. Prod. 2018, 172, 3138–3153. [Google Scholar] [CrossRef]
  29. Mohseni, P.; Borghei, A.M.; Khanali, M. Coupled life cycle assessment and data envelopment analysis for mitigation of environmental impacts and enhancement of energy efficiency in grape production. J. Clean. Prod. 2018, 197, 937–947. [Google Scholar] [CrossRef]
  30. Gancone, A.; Pubule, J.; Rosa, M.; Blumberga, D. Evaluation of agriculture eco-efficiency in Latvia. Energy Procedia 2017, 128, 309–315. [Google Scholar] [CrossRef]
  31. Vlontzos, G.; Pardalos, M.P. Assess and prognosticate greenhouse gas emissions from agricultural production of EU countries, by implementing, DEA Window analysis and artificial neural networks. Renew. Sustain. Energy Rev. 2017, 76, 155–162. [Google Scholar] [CrossRef]
  32. Vlontzos, G.; Niavis, S.; Pardalos, M.P. Testing for Environmental Kuznets Curve in the EU Agricultural Sector through an Eco-(in)Efficiency Index. Energies 2017, 10, 1992. [Google Scholar] [CrossRef]
  33. International Organization for Standardization. Environmental Management—Life Cycle Assessment—Principles and Framework; International Organization for Standardization: Geneva, Switzerland, 2006. [Google Scholar]
  34. International Organization for Standardization. Environmental Management—Life Cycle Assessment—Requirements and Guidelines; International Organization for Standardization: Geneva, Switzerland, 2006. [Google Scholar]
  35. Cerutti, A.; Beccaro, G.; Bruun, S.; Bosco, S.; Donno, D.; Notarnicola, B.; Bounous, G. Life-cycle assessment application in the fruit sector: State of the art and recommendations for environmental declarations of fruit products. J. Clean. Prod. 2014, 73, 125–135. [Google Scholar] [CrossRef]
  36. Haas, G.; Wetterich, F.; Geier, U. Life Cycle Assessment Framework in Agriculture on the Farm Level. Int. J. Life Cycle Assess. 2000, 5, 345–348. [Google Scholar] [CrossRef]
  37. Eurostat (European Statistical Office). Land Use: Number of Farms and Areas of Different Crops by Type of Farming. 2017. Available online: http://appsso.eurostat.ec.europa.eu/nui/show.do?dataset=ef_oluft&lang=en (accessed on 6 March 2018).
  38. Guinee, J.B. Handbook on Life Cycle Assessment. Operational Guide to the ISO Standards; Kluwer Academic Publishers: Dordrecht, The Netherlands, 2004; ISBN 978-0-306-48055-3. [Google Scholar]
  39. Zarębska, J. SimaPro jako uniwersalny program do oceny cyklu życia (LCA). [SimaPro as an universal life cycle assessment (LCA) software]. Ekonomia i Organizacja Przedsiębiorstwa 2010, 4, 92. [Google Scholar]
  40. Goedkoop, M.; Heijungs, R.; Huijbregts, M.; De Schryver, A.; Struijs, J.; van Zelm, R. ReCiPe 2008 a Life Cycle Impact Assessment Method Which Comprises Harmonised Category Indicators at the Midpoint and the Endpoint Level; Ministry of Housing, Spatial Planning and Environment (VROM): Barendrecht, The Netherlands, 2013. [Google Scholar]
  41. Charnes, A.; Cooper, W.W.; Rhodes, E. Measuring the efficiency of decision making units. Eur. J. Oper. Res. 1978, 2, 429–444. [Google Scholar] [CrossRef]
  42. Eurostat (European Statistical Office). Agri-Environmental Indicator—Energy Use. 2018. Available online: http://ec.europa.eu/eurostat/en/web/products-datasets/-/NRG_100A (accessed on 6 February 2018).
  43. Eurostat (European Statistical Office). Water Use by Supply Category and Economical Sector. 2018. Available online: http://appsso.eurostat.ec.europa.eu/nui/show.do?dataset=env_wat_cat&lang=en (accessed on 6 February 2018).
  44. OECD (Organisation for Economic Co-operation and Development). Agri-Environmental Other Indicators—Agriculture Freshwater Abstraction. 2018. Available online: https://stats.oecd.org/viewhtml.aspx?datasetcode=AEI_OTHER&lang=en# (accessed on 6 March 2018).
  45. Eurostat (European Statistical Office). Agri-Environmental Indicator—Mineral Fertilizer Consumption. 2018. Available online: http://appsso.eurostat.ec.europa.eu/nui/show.do?dataset=aei_fm_usefert&lang=en (accessed on 6 February 2018).
  46. Eurostat (European Statistical Office). Agri-Environmental Indicator—Consumption of Pesticides. 2018. Available online: http://appsso.eurostat.ec.europa.eu/nui/show.do?dataset=aei_fm_salpest09&lang=en (accessed on 6 February 2018).
  47. Eurostat (European Statistical Office). Air Emissions Accounts by NACE. 2018. Available online: http://appsso.eurostat.ec.europa.eu/nui/show.do?dataset=env_ac_ainah_r2&lang=en (accessed on 6 February 2018).
  48. Eurostat (European Statistical Office). Generation of Waste by the Agriculture, Forestry and Fishing Sector, by Country, Year and Waste Category. 2018. Available online: http://appsso.eurostat.ec.europa.eu/nui/show.do?dataset=env_wasgen&lang=en (accessed on 6 February 2018).
  49. Lewin, A.Y.; Morey, R.C.; Cook, T.J. Evaluating the administrative efficiency of courts. Omega 1982, 10, 401–411. [Google Scholar] [CrossRef]
  50. Avkiran, N.K. Productivity Analysis in the Service Sector with Data Envelopment Analysis, 3rd ed.; The University of Queensland: Brisbane, Australia, 2006. [Google Scholar]
  51. Banker, R.D.; Charnes, A.; Cooper, W.W.; Swarts, J.; Thomas, D. An introduction to data envelopment analysis with some of its models and their uses. Res. Gov. Non-Profit Account. 1989, 5, 125–163. [Google Scholar]
  52. Eurostat (European Statistical Office). Gross Domestic Product and Main Components (Output, Expenditure and Income). 2018. Available online: http://appsso.eurostat.ec.europa.eu/nui/show.do?dataset=nama_10_gdp&lang=en (accessed on 19 February 2018).
  53. Eurostat (European Statistical Office). Gross Value Added and Income by A *10 Industry Breakdowns. Percentage of Gross Domestic Products (GDP). 2018. Available online: http://appsso.eurostat.ec.europa.eu/nui/show.do?dataset=nama_10_a10&lang=en (accessed on 19 February 2018).
  54. Masternak-Janus, A.; Rybaczewska-Błażejowska, M. Comprehensive regional eco-efficiency analysis based on date envelopment analysis: The case study of Polish regions. J. Ind. Ecol. 2017, 21, 180–190. [Google Scholar] [CrossRef]
  55. European Commission. Agriculture in the European Union and the Member States—Statistical Factsheets. 2017. Available online: https://ec.europa.eu/agriculture/statistics/factsheets_en (accessed on 27 April 2018).
  56. Brentrup, F.; Kusters, J.; Kuhlmann, H.; Lammel, J. Environmental impact assessment of agricultural production systems using the life cycle assessment methodology I. Theoretical concept of a LCA method tailored to crop production. Eur. J. Agron. 2004, 20, 247–264. [Google Scholar] [CrossRef]
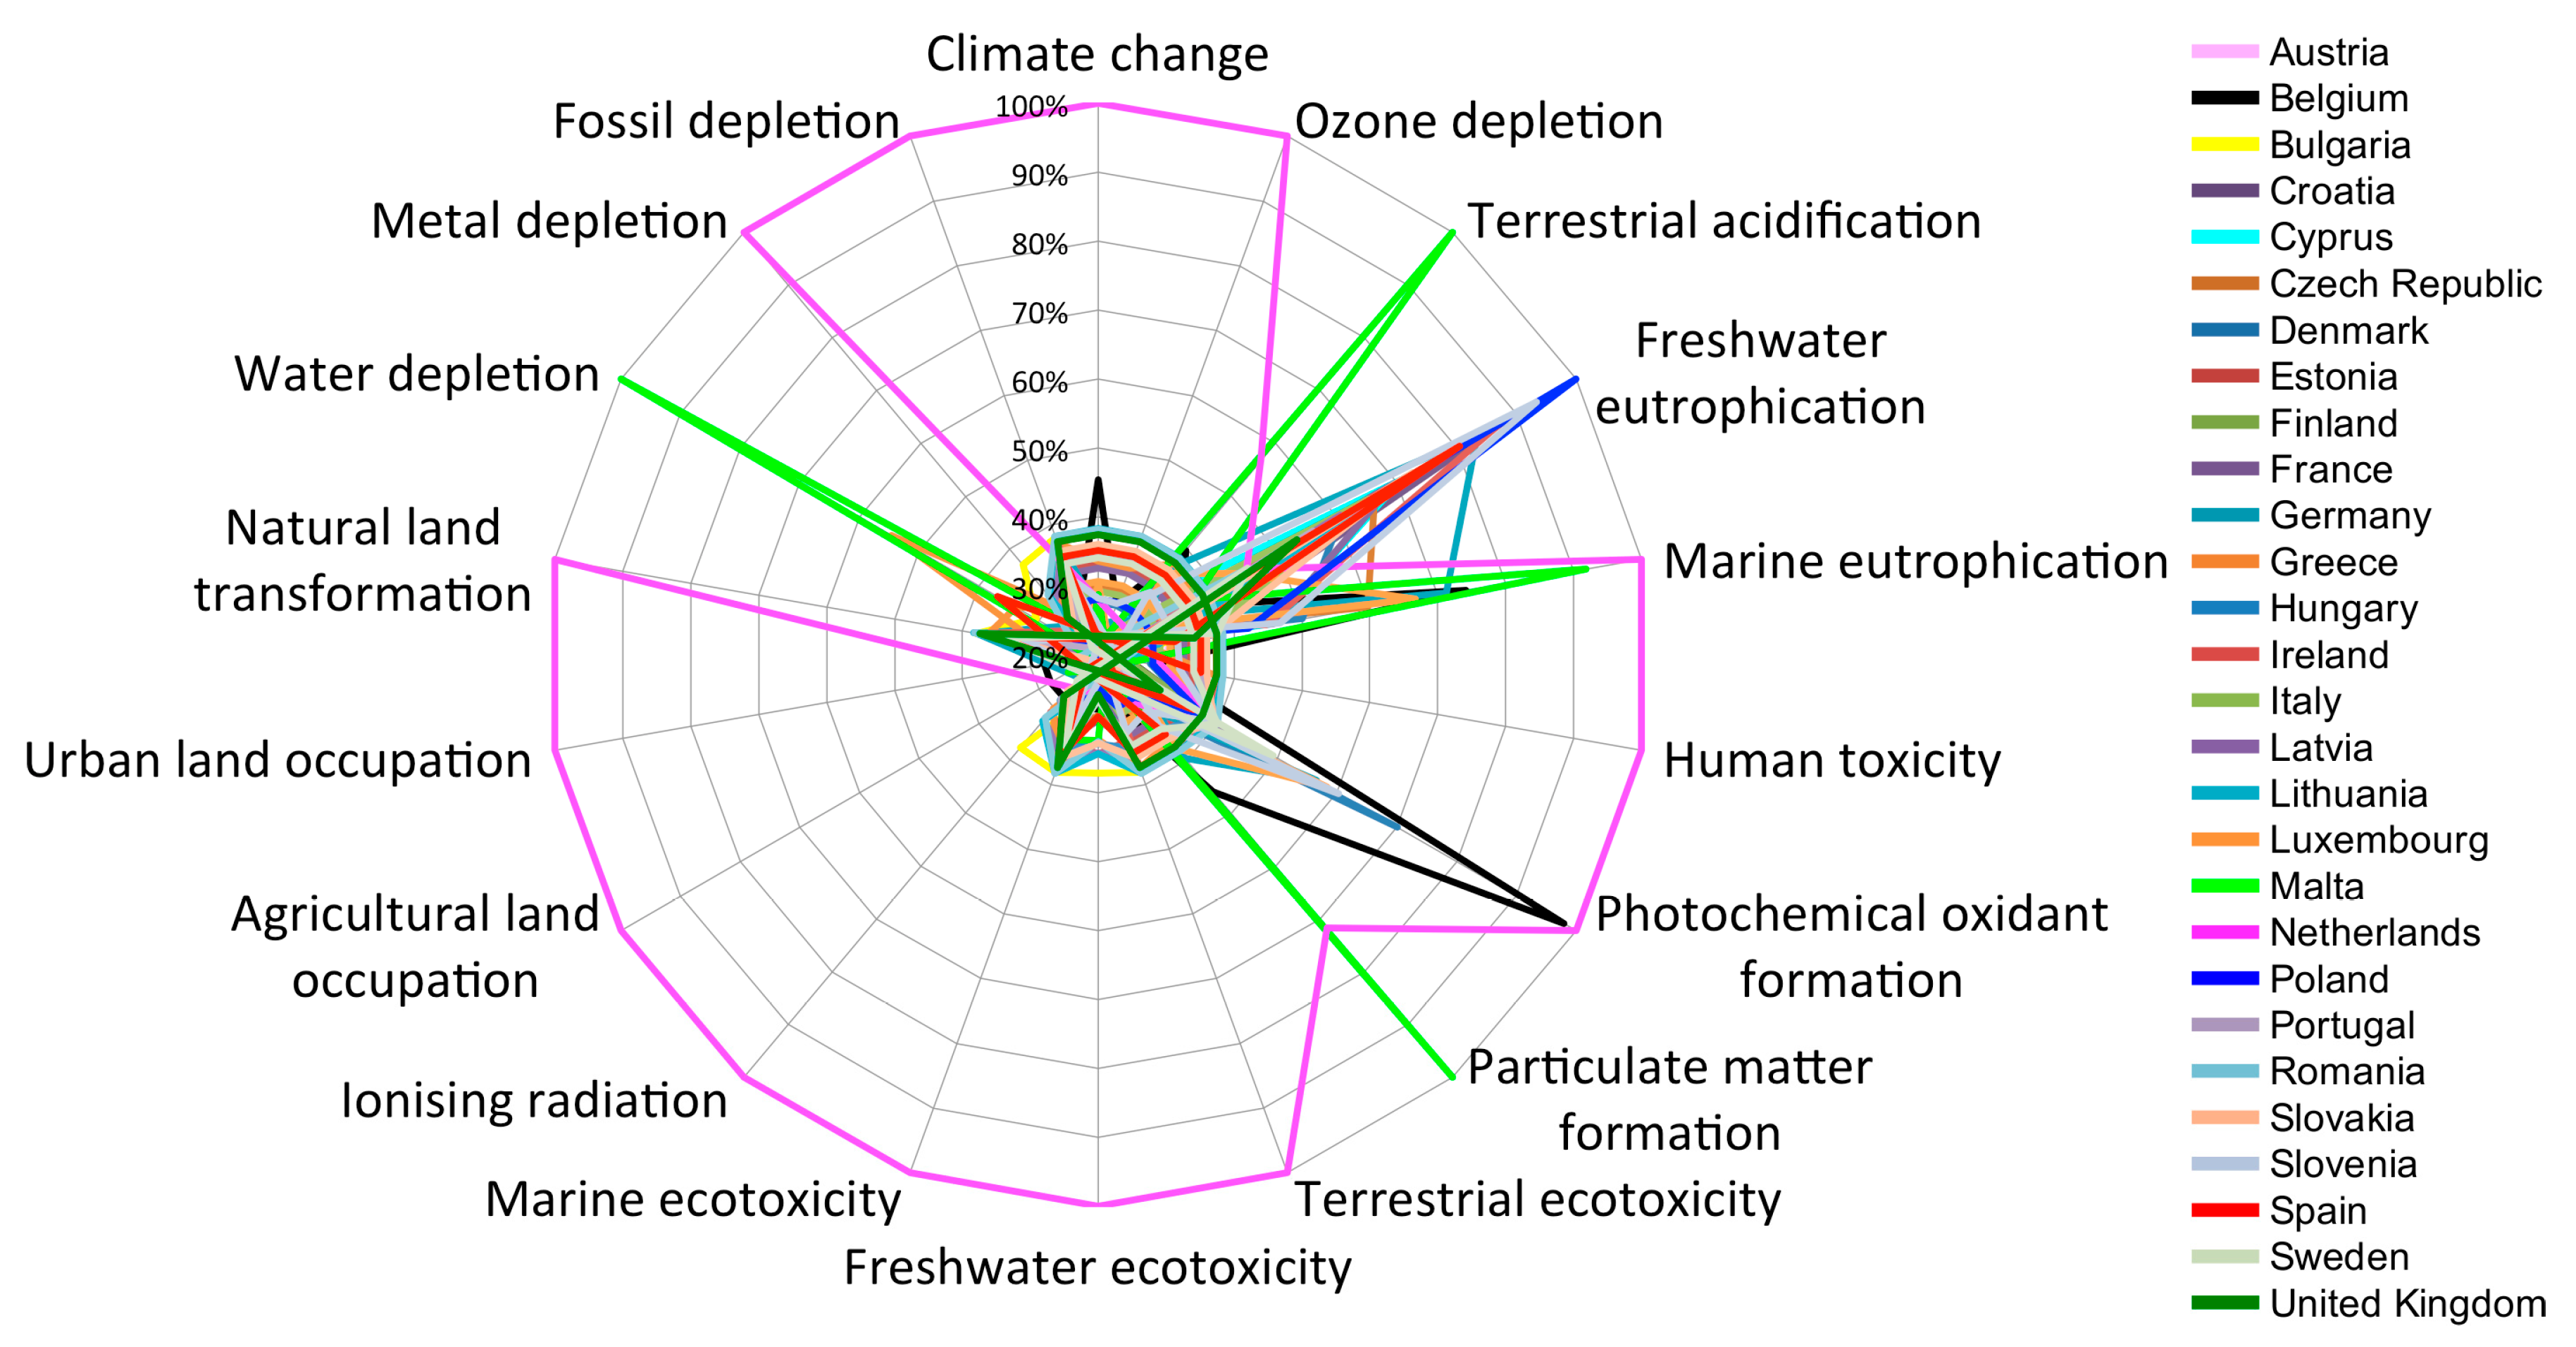
Figure 1. The schematic presentation of the combined life cycle assessment and data envelopment analysis (LCA+DEA) methodology applied for the eco-efficiency evaluation of agricultural production.
Sustainability 10 04544 g001
Figure 2. Member states of the European Union and their utilised agricultural area.
Sustainability 10 04544 g002
Figure 3. Environmental characterisation results of agricultural production in the 28 member states of the European Union (the EU-28) per 1 ha [in %].
Sustainability 10 04544 g003
Figure 4. Environmental normalisation results for the agricultural production in the EU-28 per 1 ha.
Sustainability 10 04544 g004
Figure 5. Eco-efficiency results of agricultural production in the EU-28.
Sustainability 10 04544 g005
Figure 6. Relationship between eco-efficiency and GDP per ha of agriculture in the EU-28.
Sustainability 10 04544 g006
Figure 7. Current and target environmental performance of agricultural production in the EU-28.
Sustainability 10 04544 g007
Table 1. Environmental characterisation results for the agricultural production in the EU-28 per 1 ha [in units of impact categories).
Impact CategoryClimate ChangeOzone DepletionTerrestrial AcidificationFreshwater EutrophicationMarine EutrophicationHuman ToxicityPhotochemical Oxidant FormationParticulate Matter FormationEcotoxicityIonising RadiationLand OccupationNatural land TransformationWater DepletionMetal DepletionFossil Depletion
Unitkg CO2 eqkg CFC-11 eqkg SO2 eqkg P eqkg N eqkg 1,4-DB eqkg NMVOCkg PM10 eqkg 1,4-DB eqkBq U235 eqm2am2m3kg Fe eqkg oil eq
Country
Austria23570.000161.810.265.8717.0213.5410.21.32512.700.260.053.35248
Belgium63950.0004122.350.1712.8548.7142.5419.83.781467.730.7428.139.58710
Bulgaria39907.390.295.293.544.171.290.31100.550.0571.730.7049
Croatia1478040.600.455.7811.869.976.340.92361.880.1819.542.33173
Cyprus37200.000289.070.367.8828.8315.8213.482.24864.580.44442.165.67420
Czech Republic1567048.630.3310.3416.2511.778.681.38472.540.2417.613.20227
Denmark30700.000273.030.318.6721.6030.4112.541.68653.430.3392.444.25314
Estonia786028.350.213.7911.929.384.600.92361.890.185.162.35174
Finland20800.000234.960.276.0627.477.485.902.13824.360.420.085.41400
France2001060.010.357.9312.9317.959.521.0038.742.050.2095.792.54188
Germany28160112.180.4212.363.8424.5317.070.3011.500.610.0617.230.7656
Greece1076030.210.223.456.362.694.800.8714.170.880.071364.31.2765
Hungary986035.080.366.339.7510.035.680.7729.051.540.1560.701.92141
Ireland3034060.150.447.754.4812.468.630.3513.410.710.070.010.8865
Italy2234077.840.336.0818.899.4212.171.4756.613.000.290.053.72275
Latvia813024.130.303.947.389.624.410.5821.981.170.1120.651.45107
Lithuania802022.970.354.992.937.943.910.238.770.470.0420.370.5843
Luxembourg42780109.240.2211.5616.4125.3316.331.2749.162.610.255.243.23239
Malta40440308.450.1815.9244.307.6643.174.42120.136.690.602494.78.77573
Netherlands14,1100.0014175.030.2217.33174.3343.3930.9613.52522.3227.692.640.4934.302541
Poland21300.000254.530.507.2920.7915.0710.811.6162.293.300.3268.824.09303
Portugal1899035.990.283.918.3811.306.670.6525.101.330.130.021.65122
Romania1041025.030.222.853.016.663.730.248.920.480.050.120.5943
Slovakia1012040.320.366.377.0210.226.190.5521.051.120.1115.881.38102
Slovenia3070095.060.478.1215.9426.1614.531.6142.922.400.2113.883.15204
Spain1560052.810.405.438.5015.5810.120.6625.471.350.13919.121.67124
Sweden1897046.880.236.5110.3821.418.030.8131.101.650.160.032.04151
United Kingdom2014037.380.275.914.5213.155.610.3513.550.720.0762.540.8966

