Migrants’ Integration on the European Labor Market: A Spatial Bootstrap, SEM and Network Approach


 ,
, 
Abstract
:1. Introduction
2. Literature Review
3. Data Analysis and Research Methodology
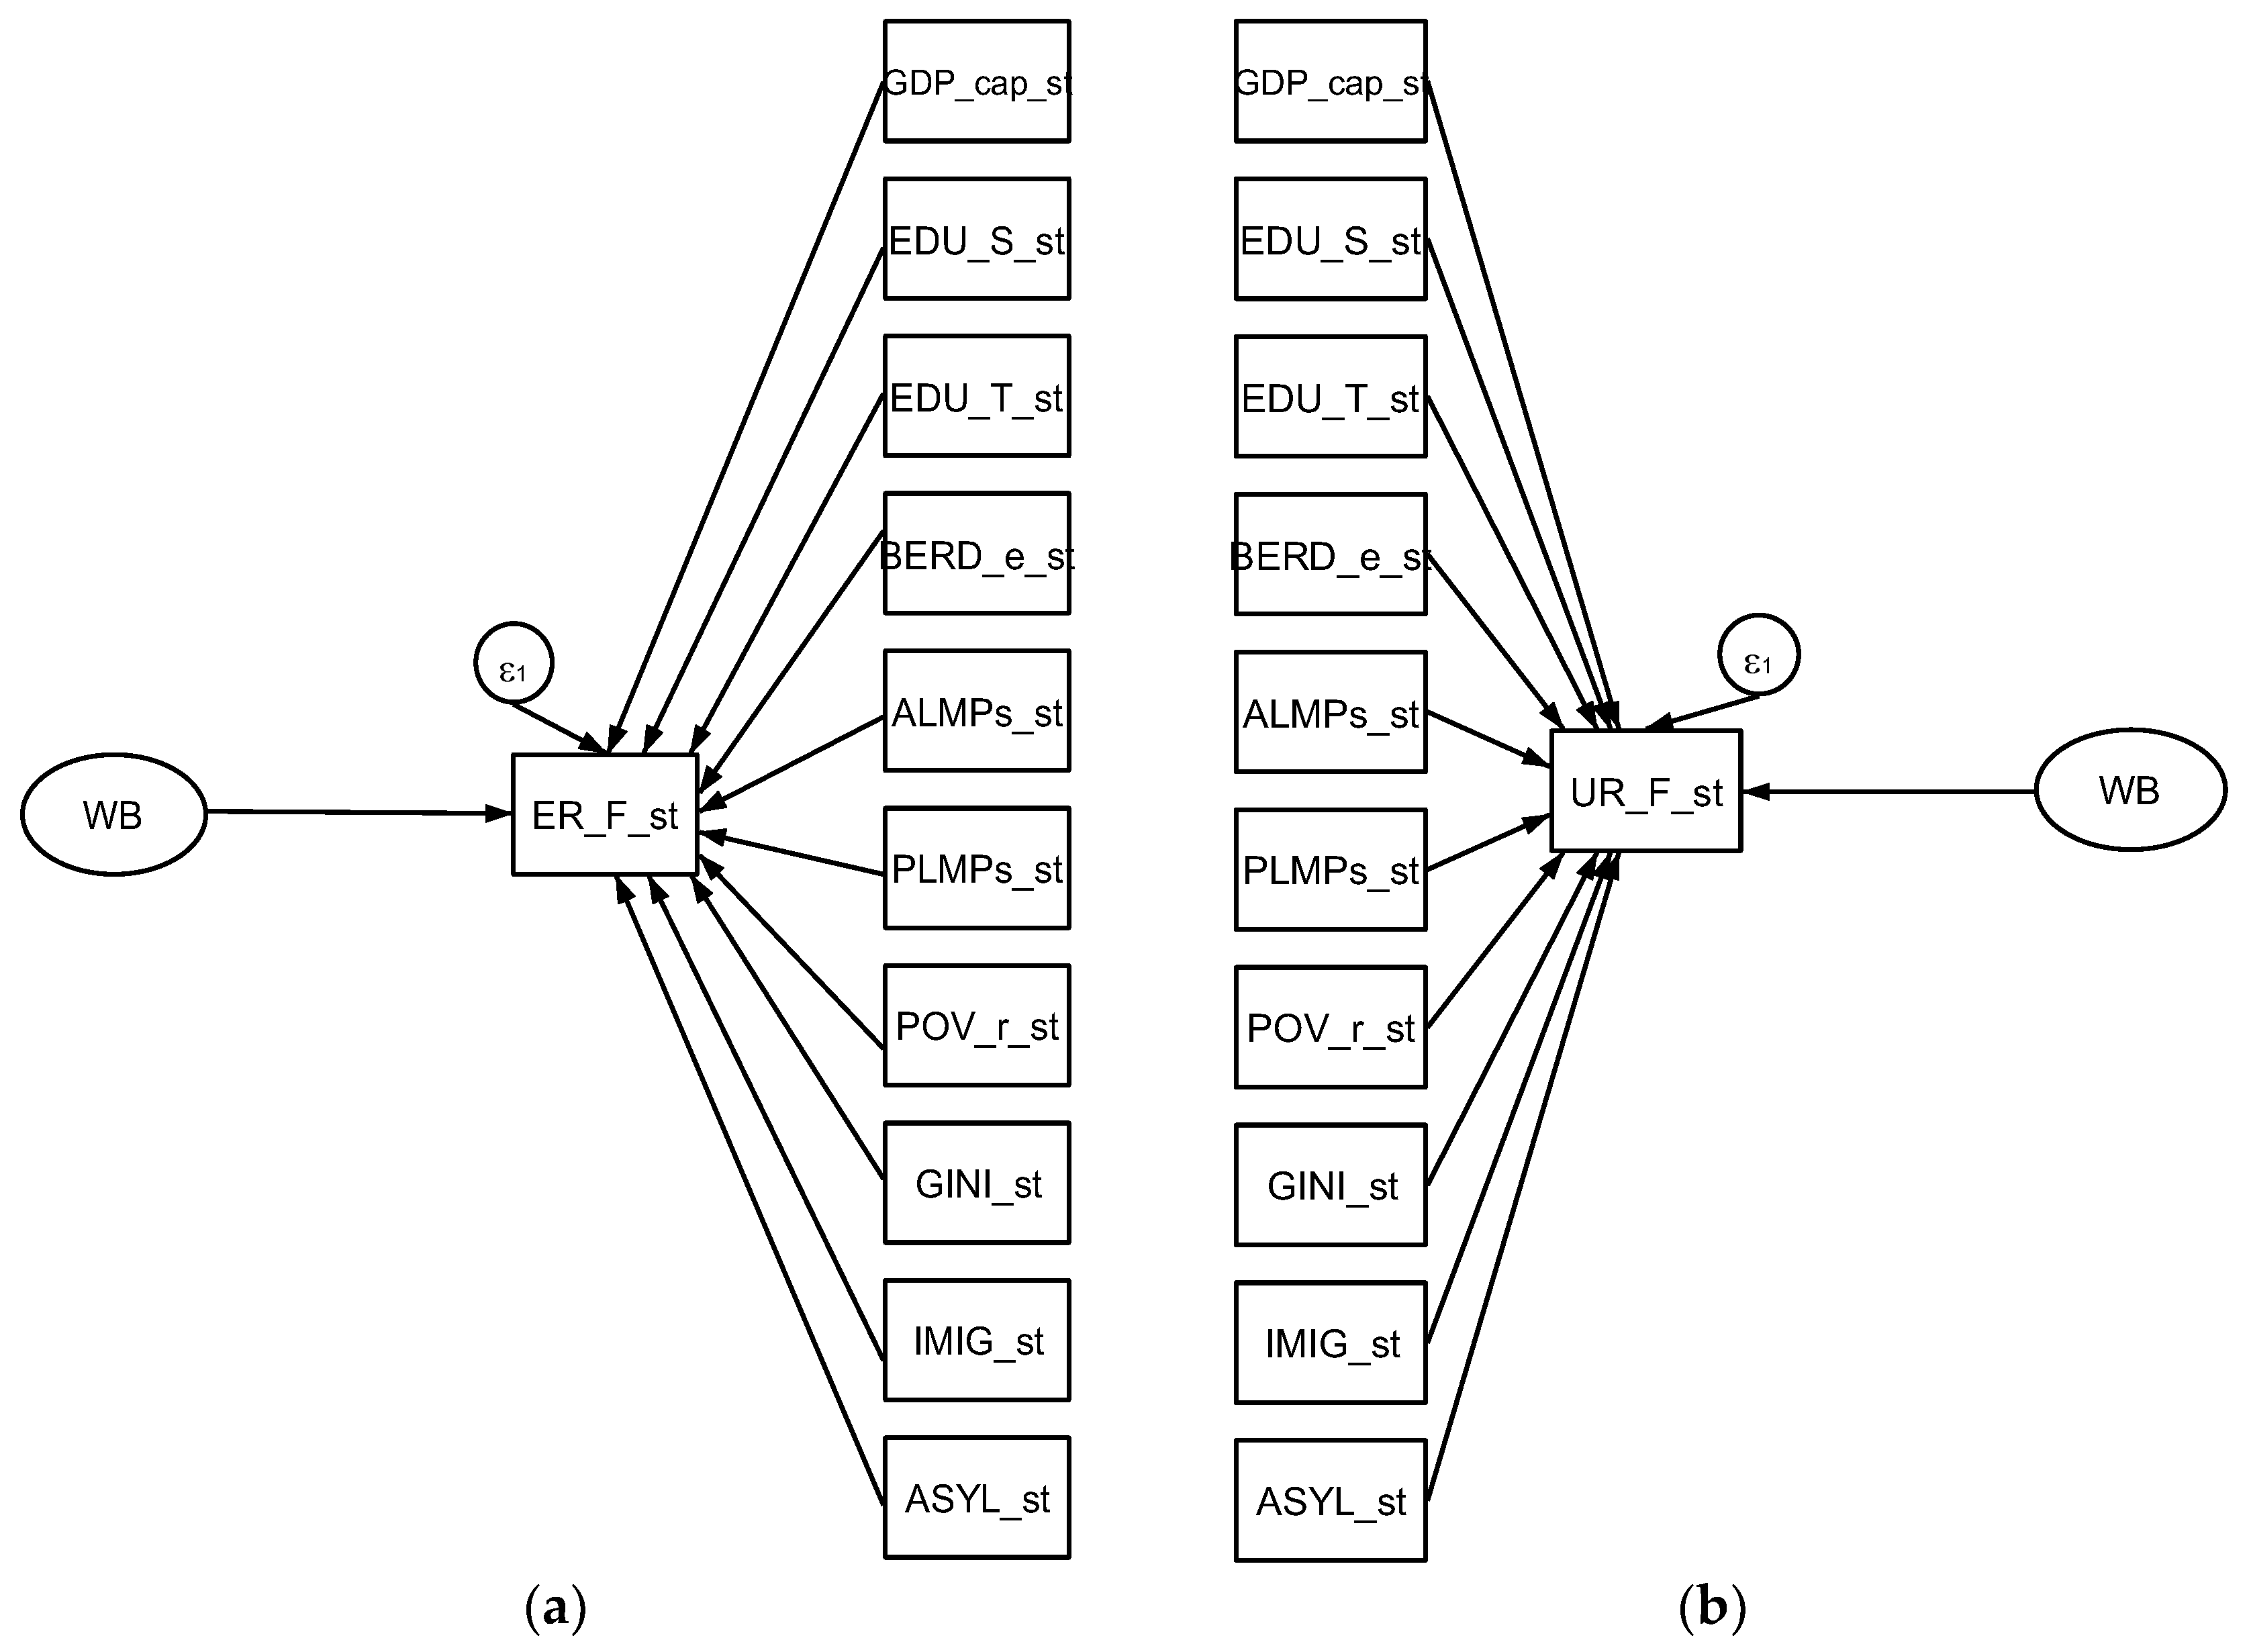
3.1. Data—Selected Indicators
- international migration indicators: flows of immigrants and foreign population (IMIG); and flows of refugees and asylum applicants (ASYL);
- economic welfare, labor market and other specific indicators: real Gross Domestic Product per capita (GDP_cap); unemployment rate for the foreign population (UR_F); employment rate for the foreign population (ER_F); educational attainment for upper secondary and post-secondary non-tertiary education (levels 3–4) (EDU_S), and tertiary education (levels 5–8) (EDU_T); active labor market policies (ALMPs) and passive labor market policies (PLMPs); at-risk-of-poverty rate (POV_R); Business Enterprise Research and Development (R&D) expenditures (BERD); GINI coefficients (economic inequalities among countries).
3.2. Methodology
4. Results and Discussion
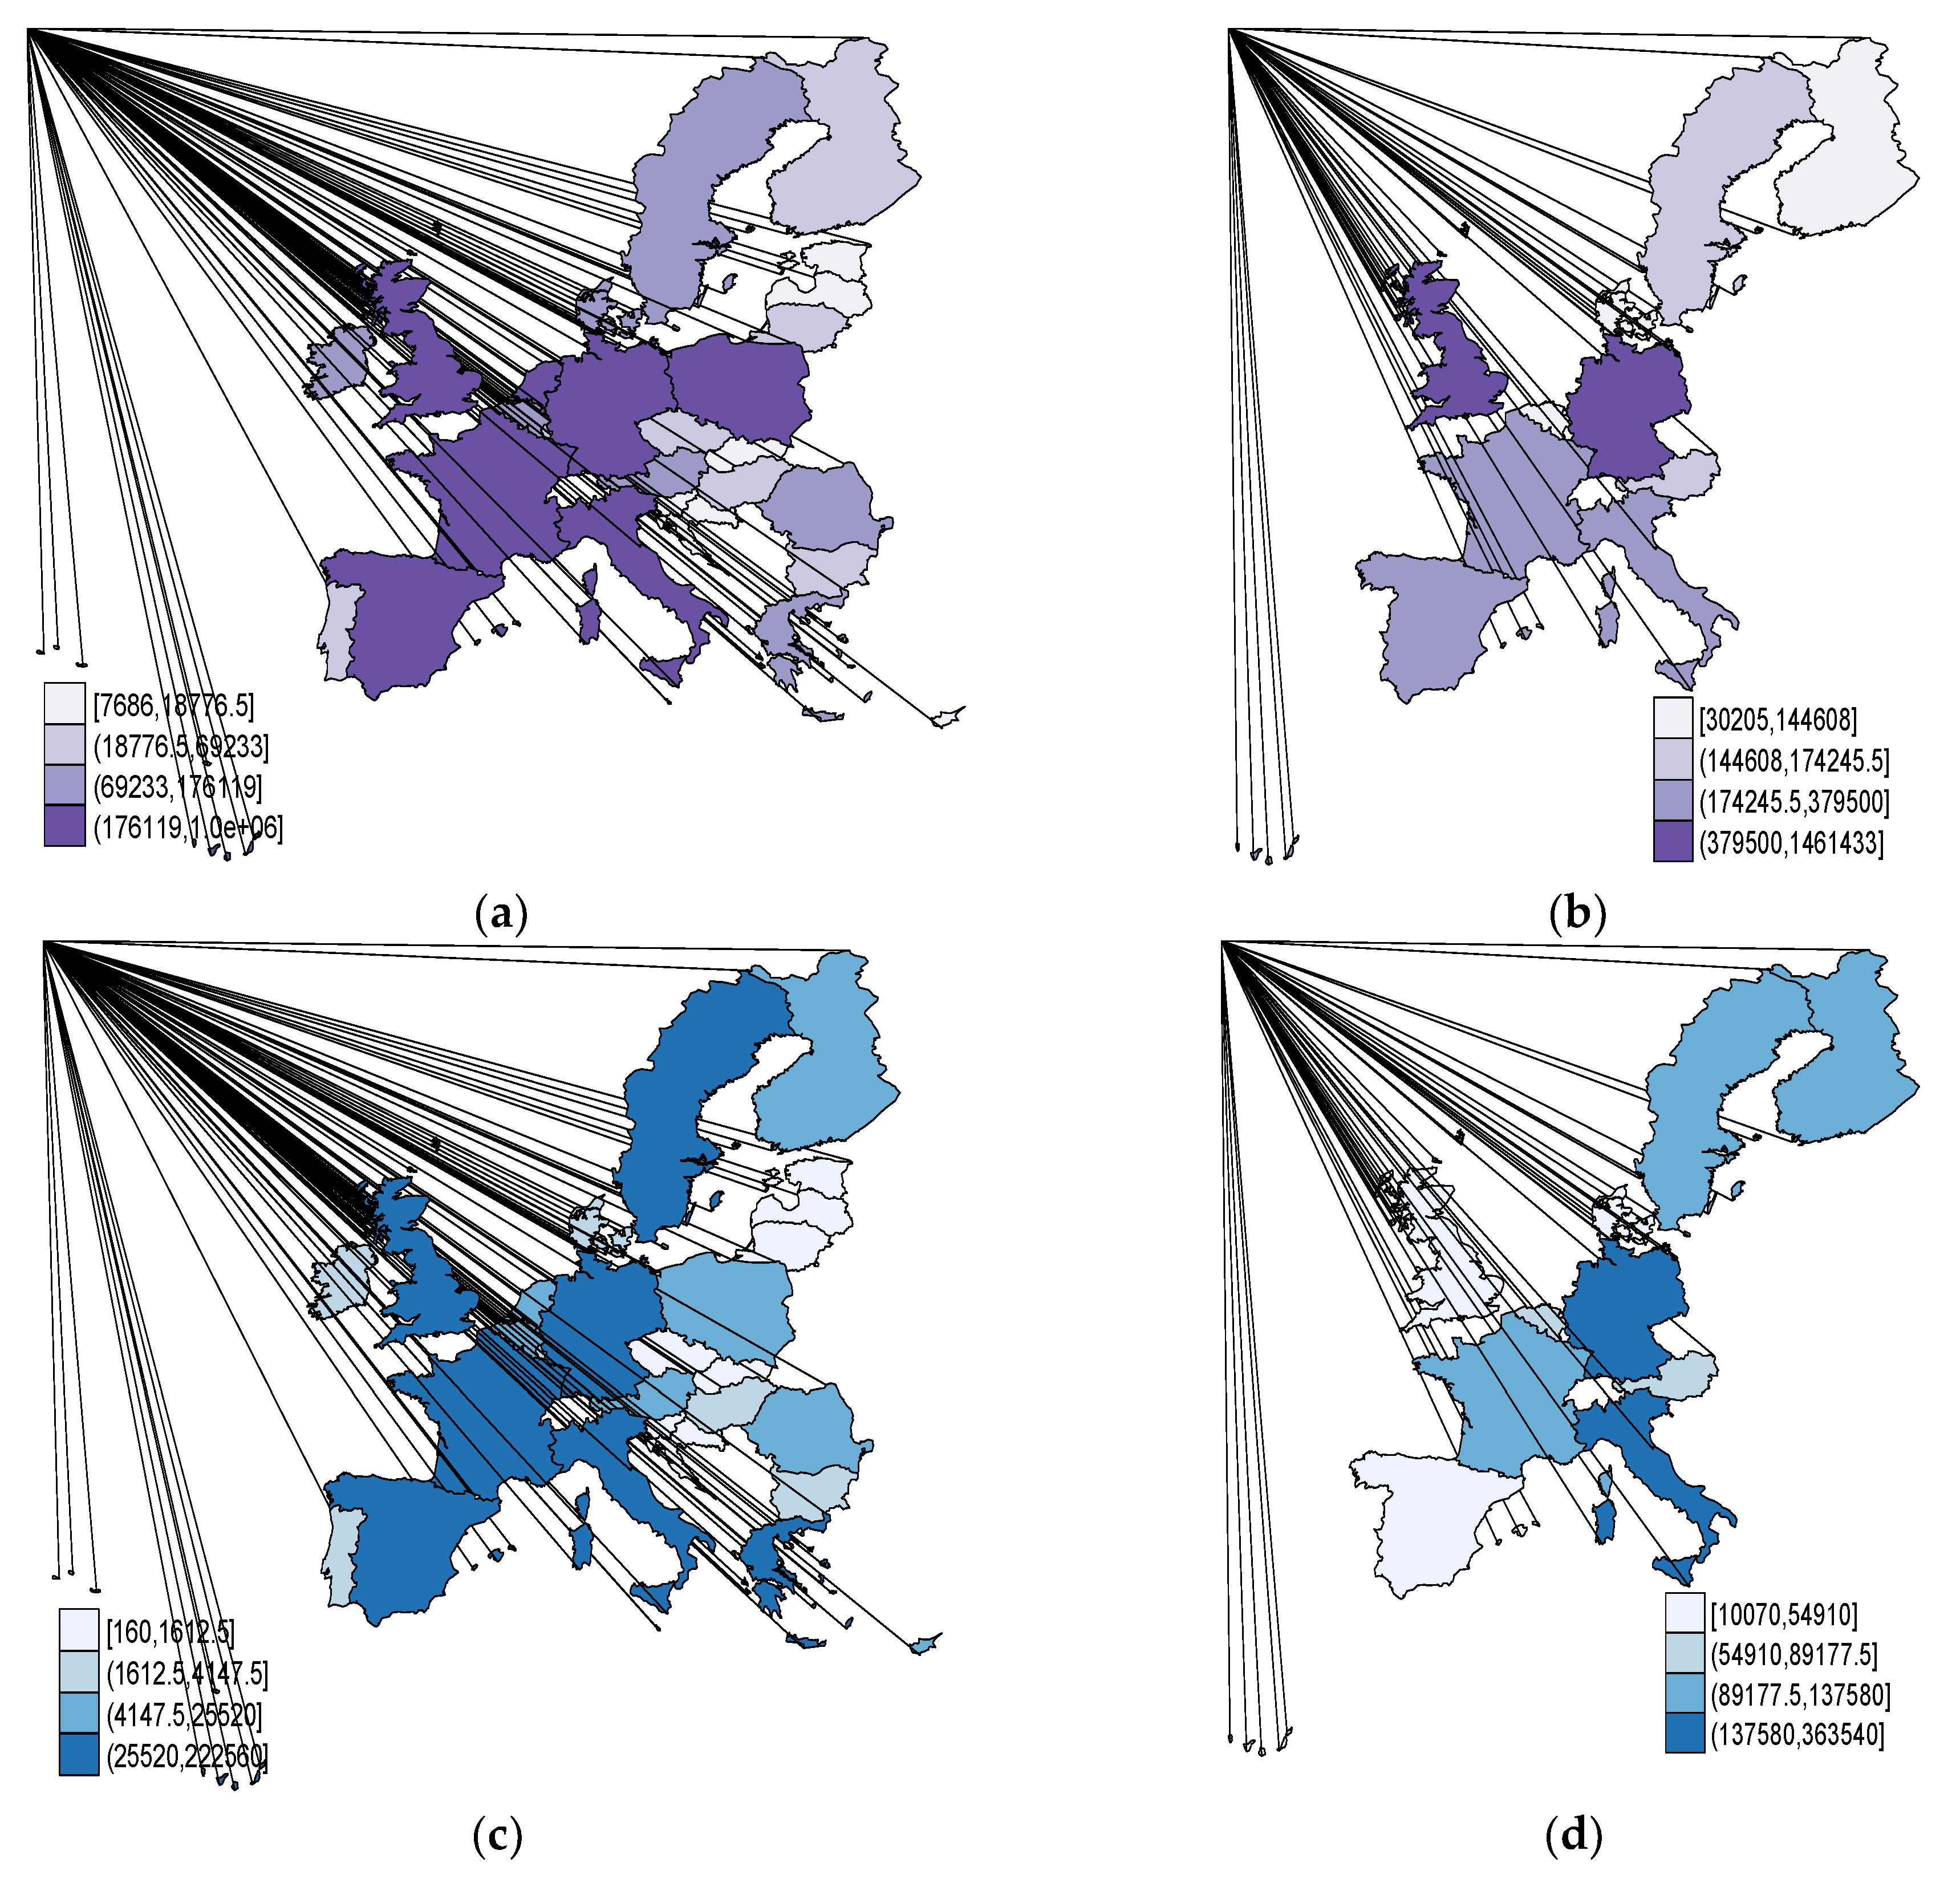
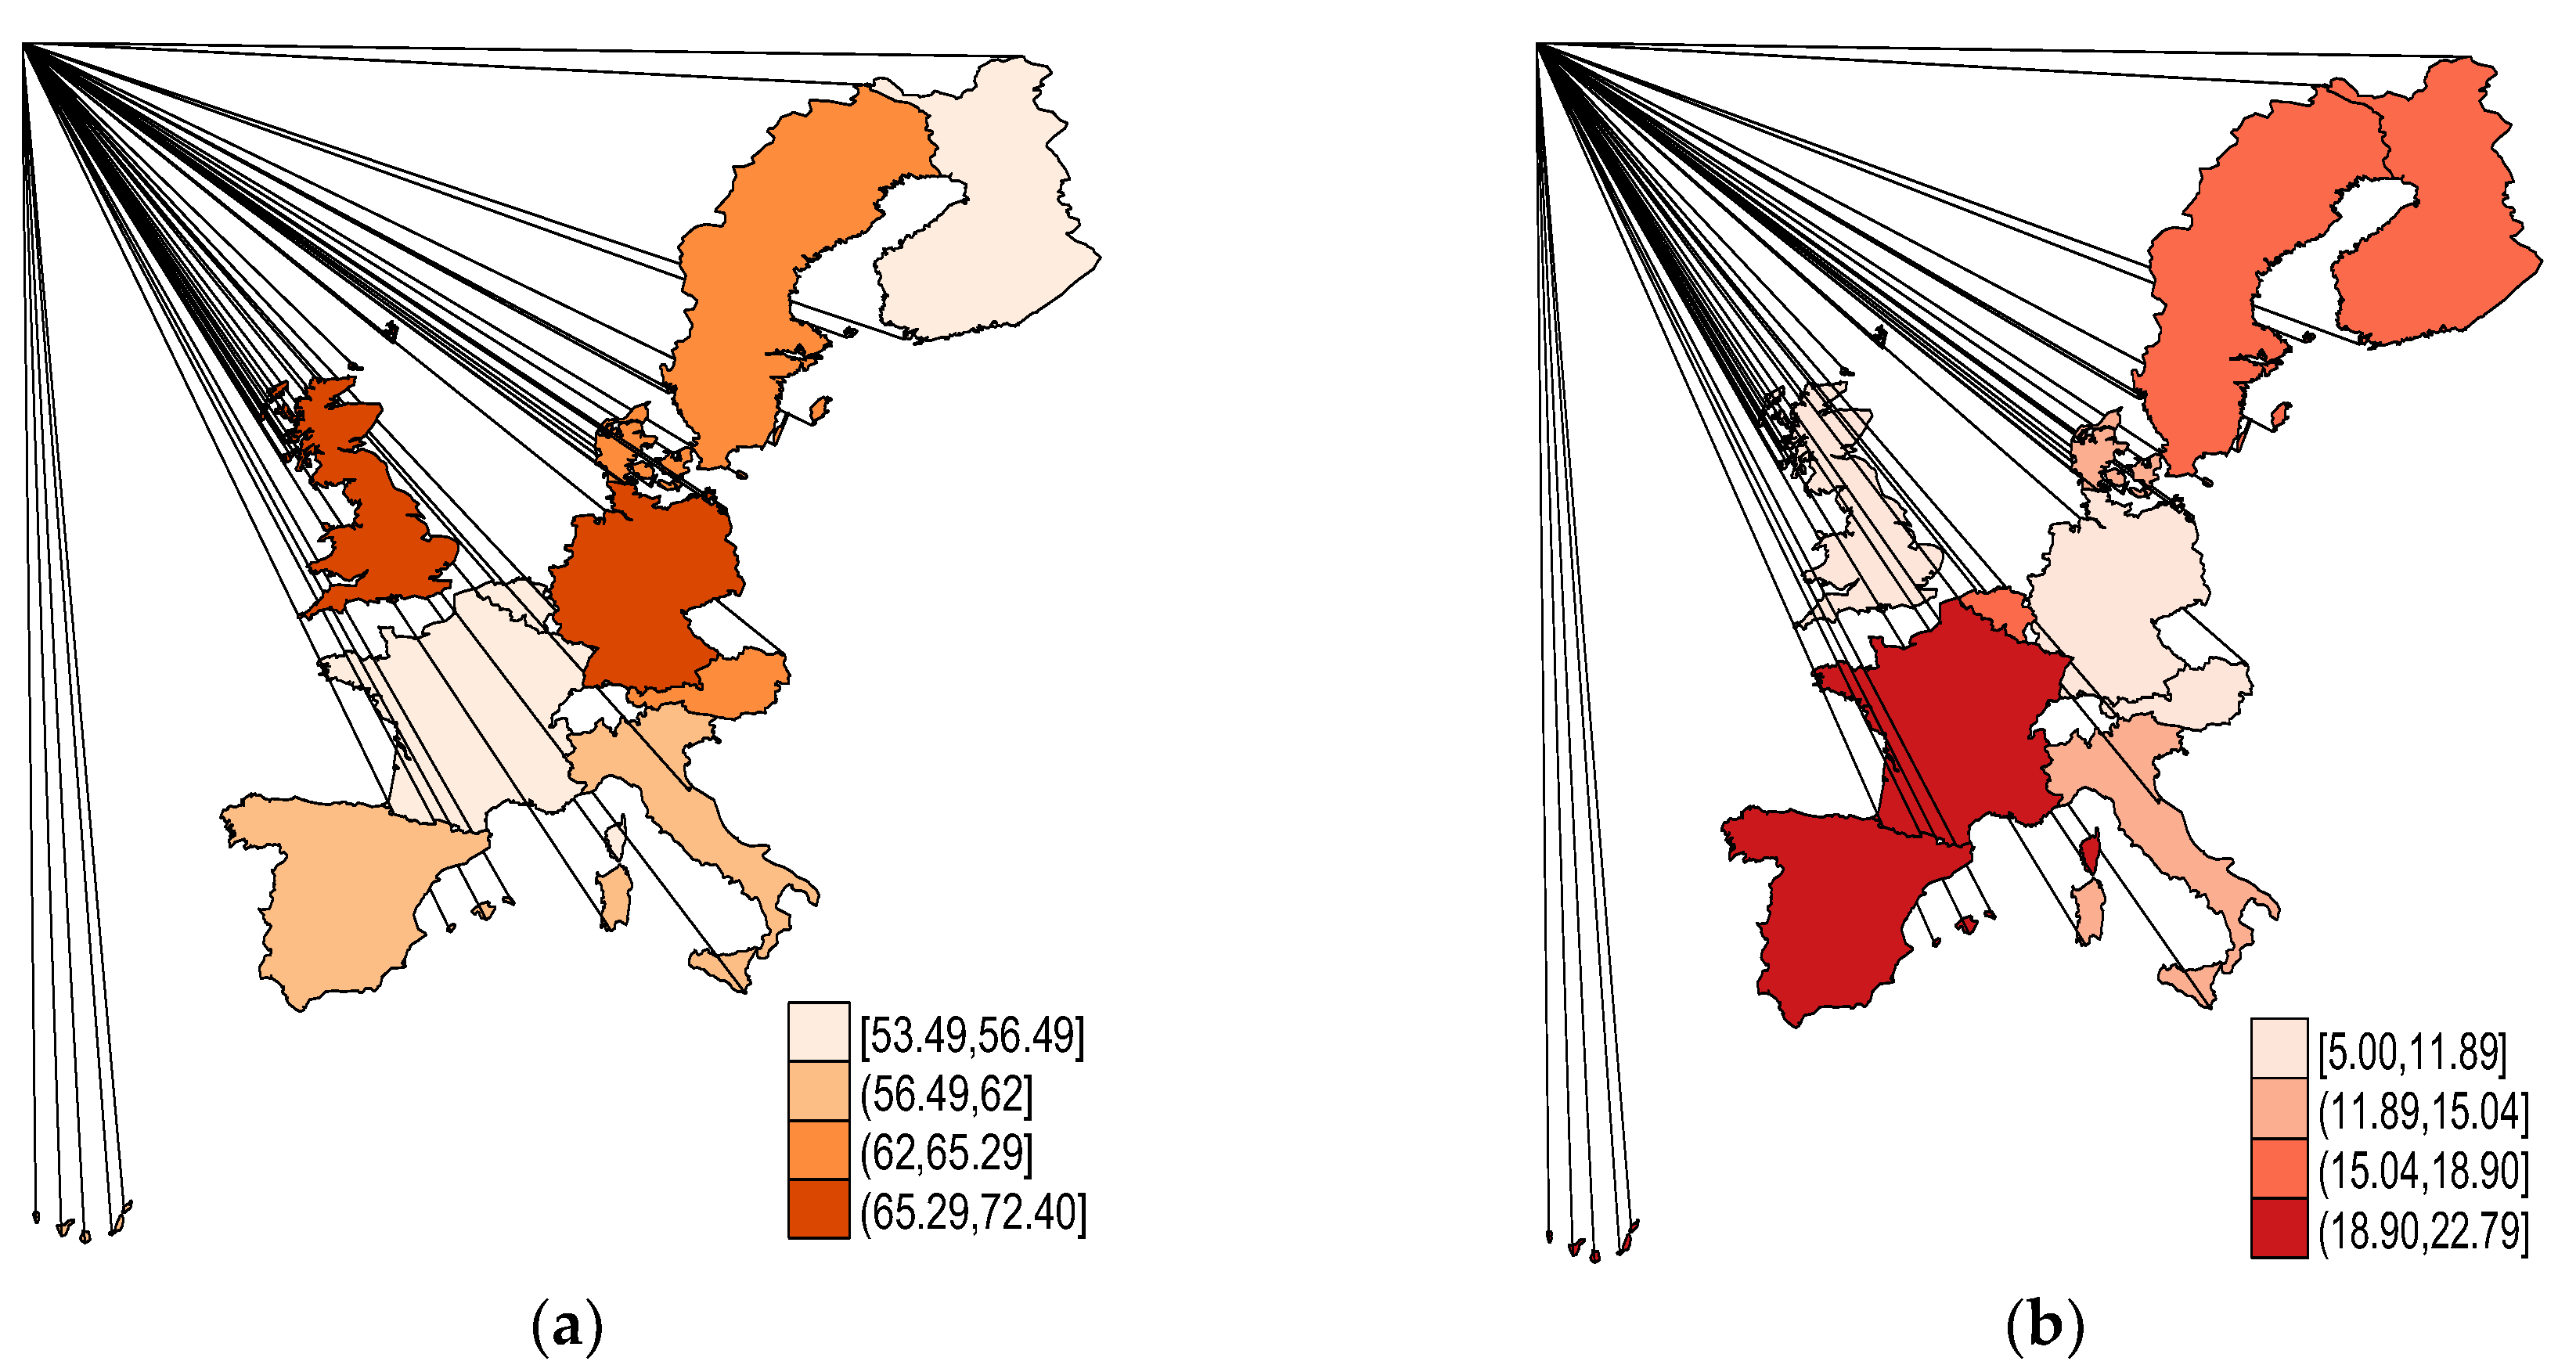
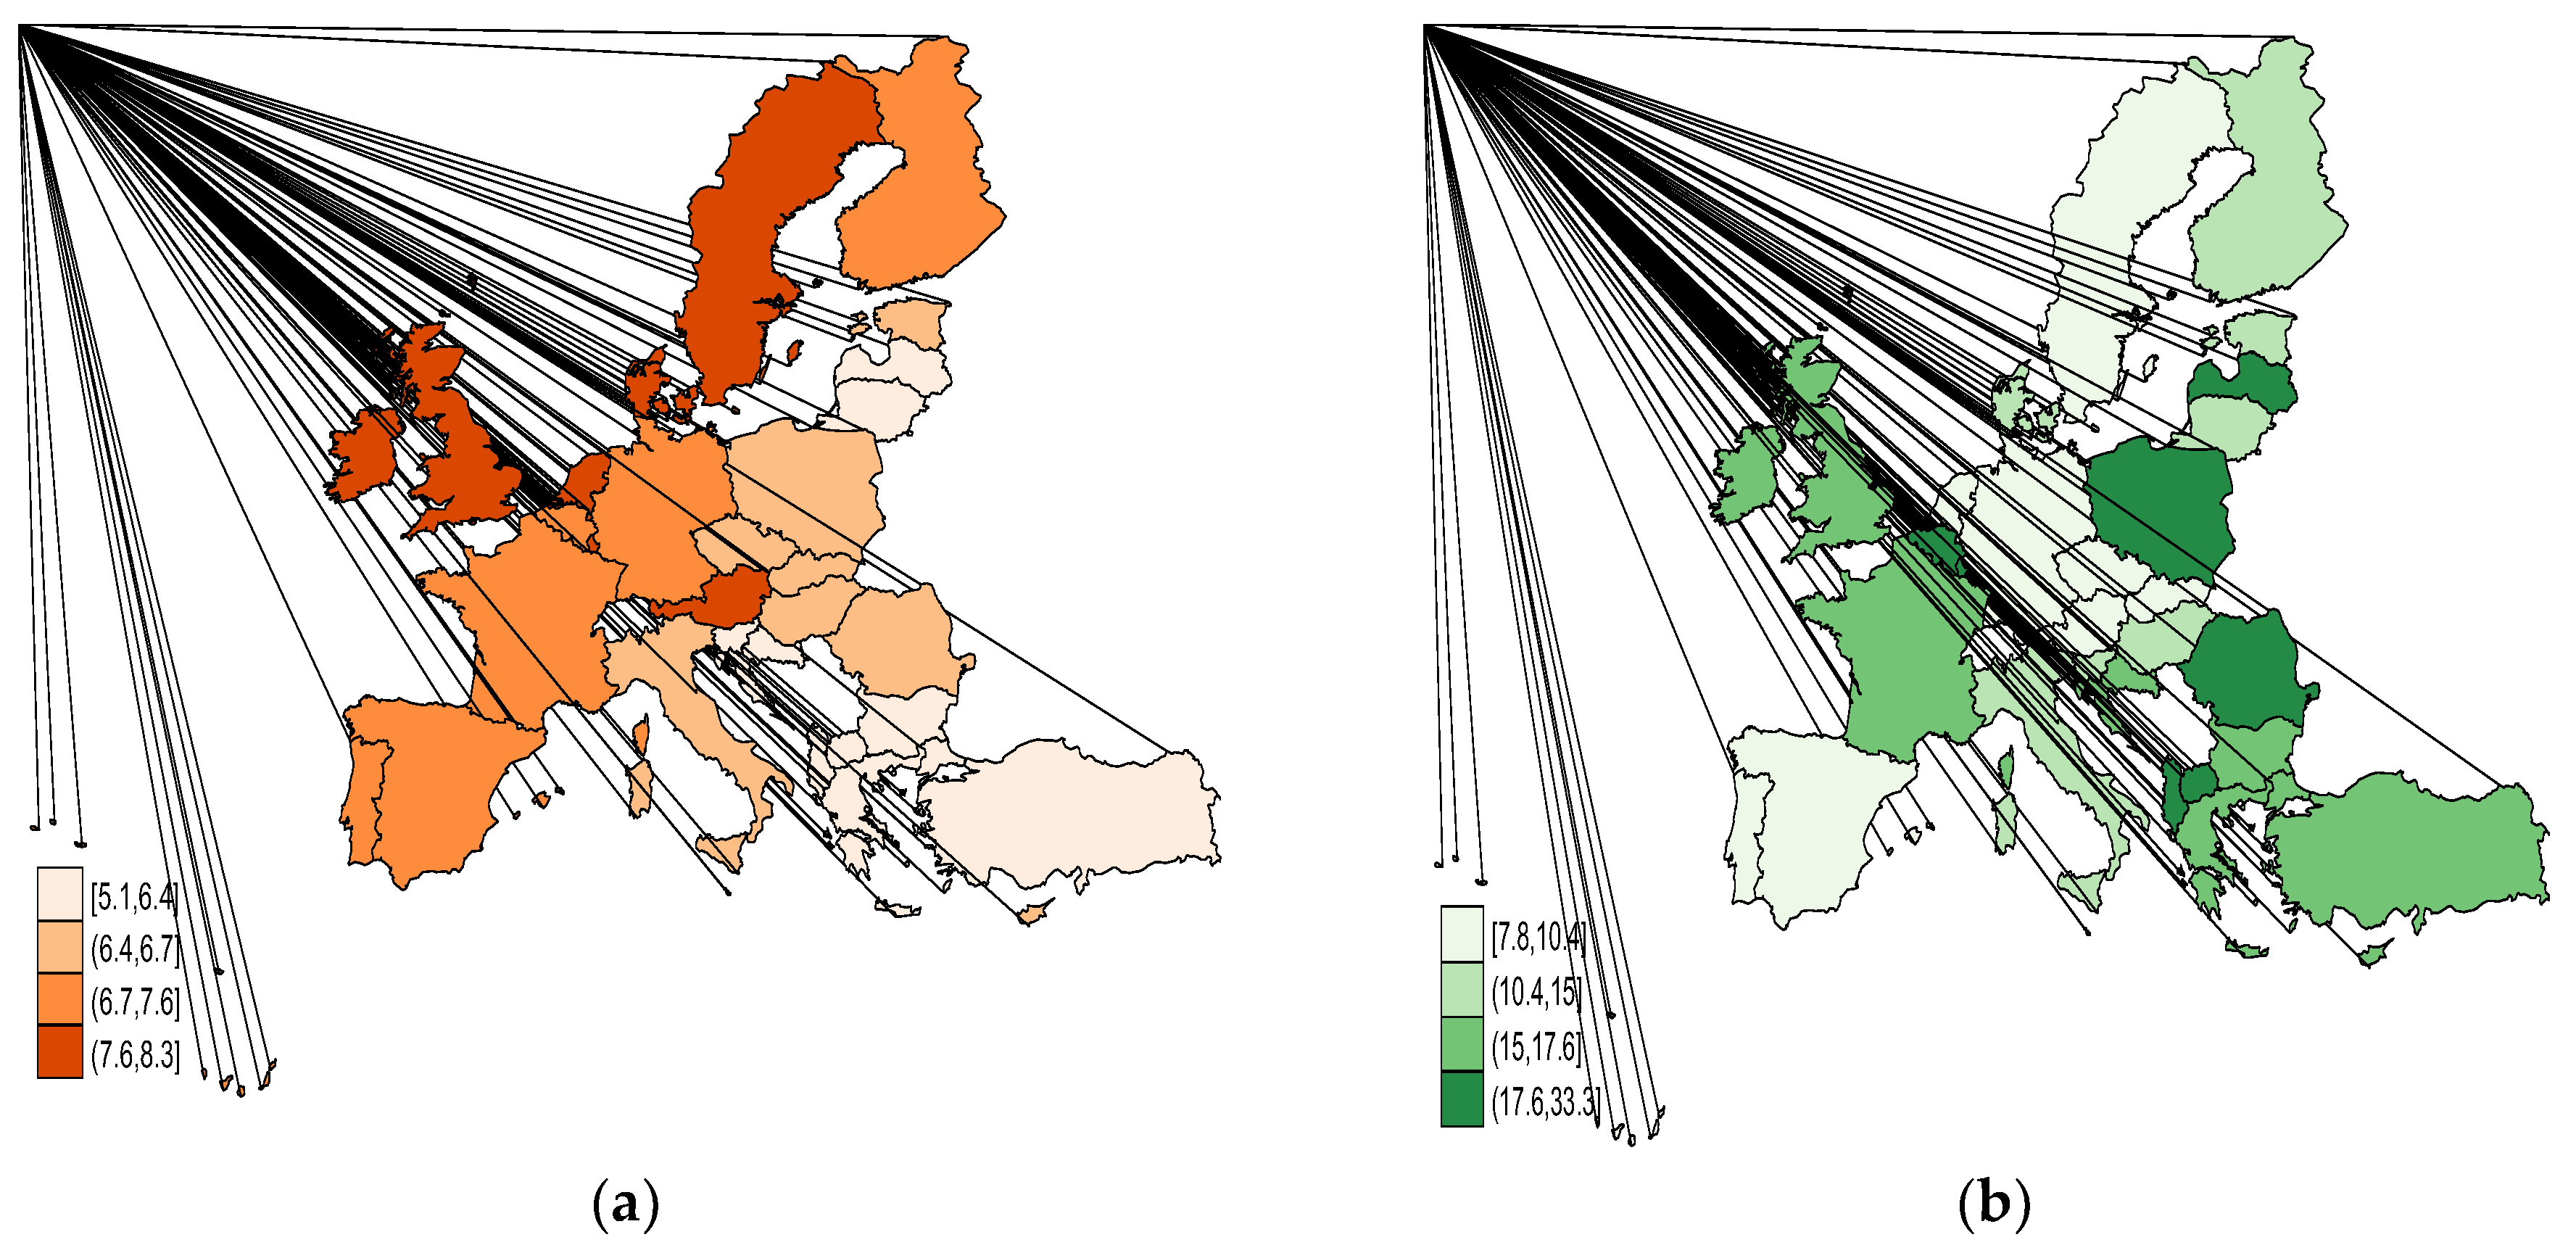
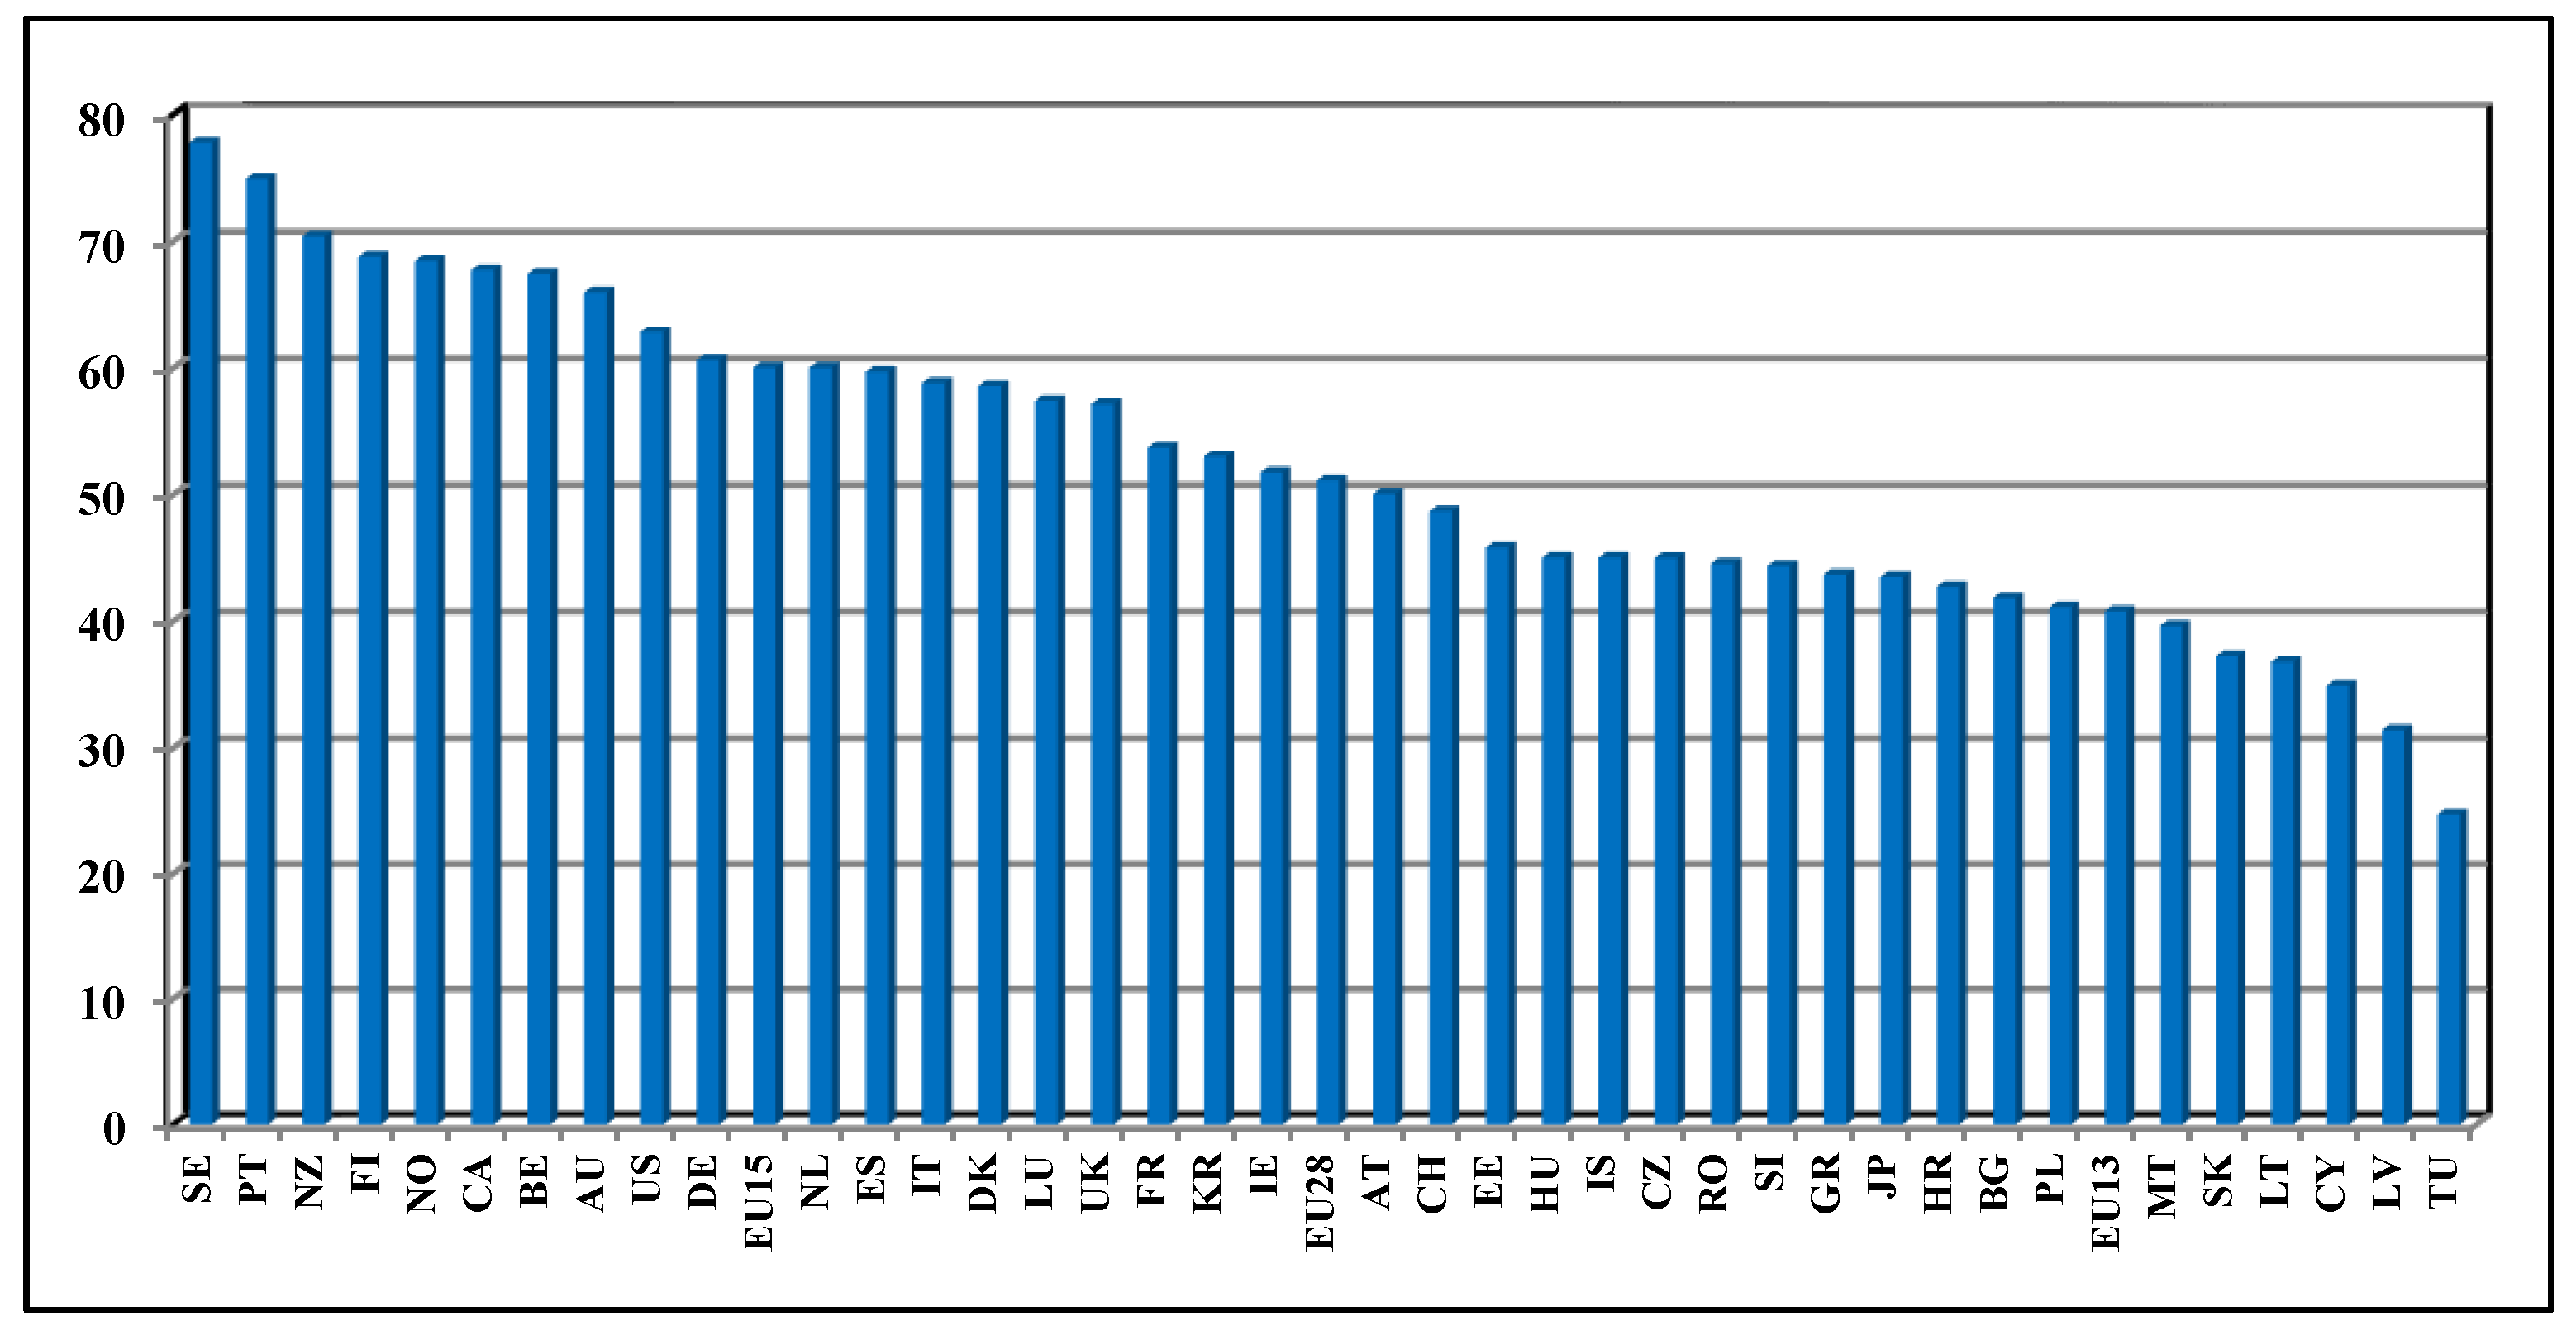
4.1. Spatial Analysis
4.2. SEM Models
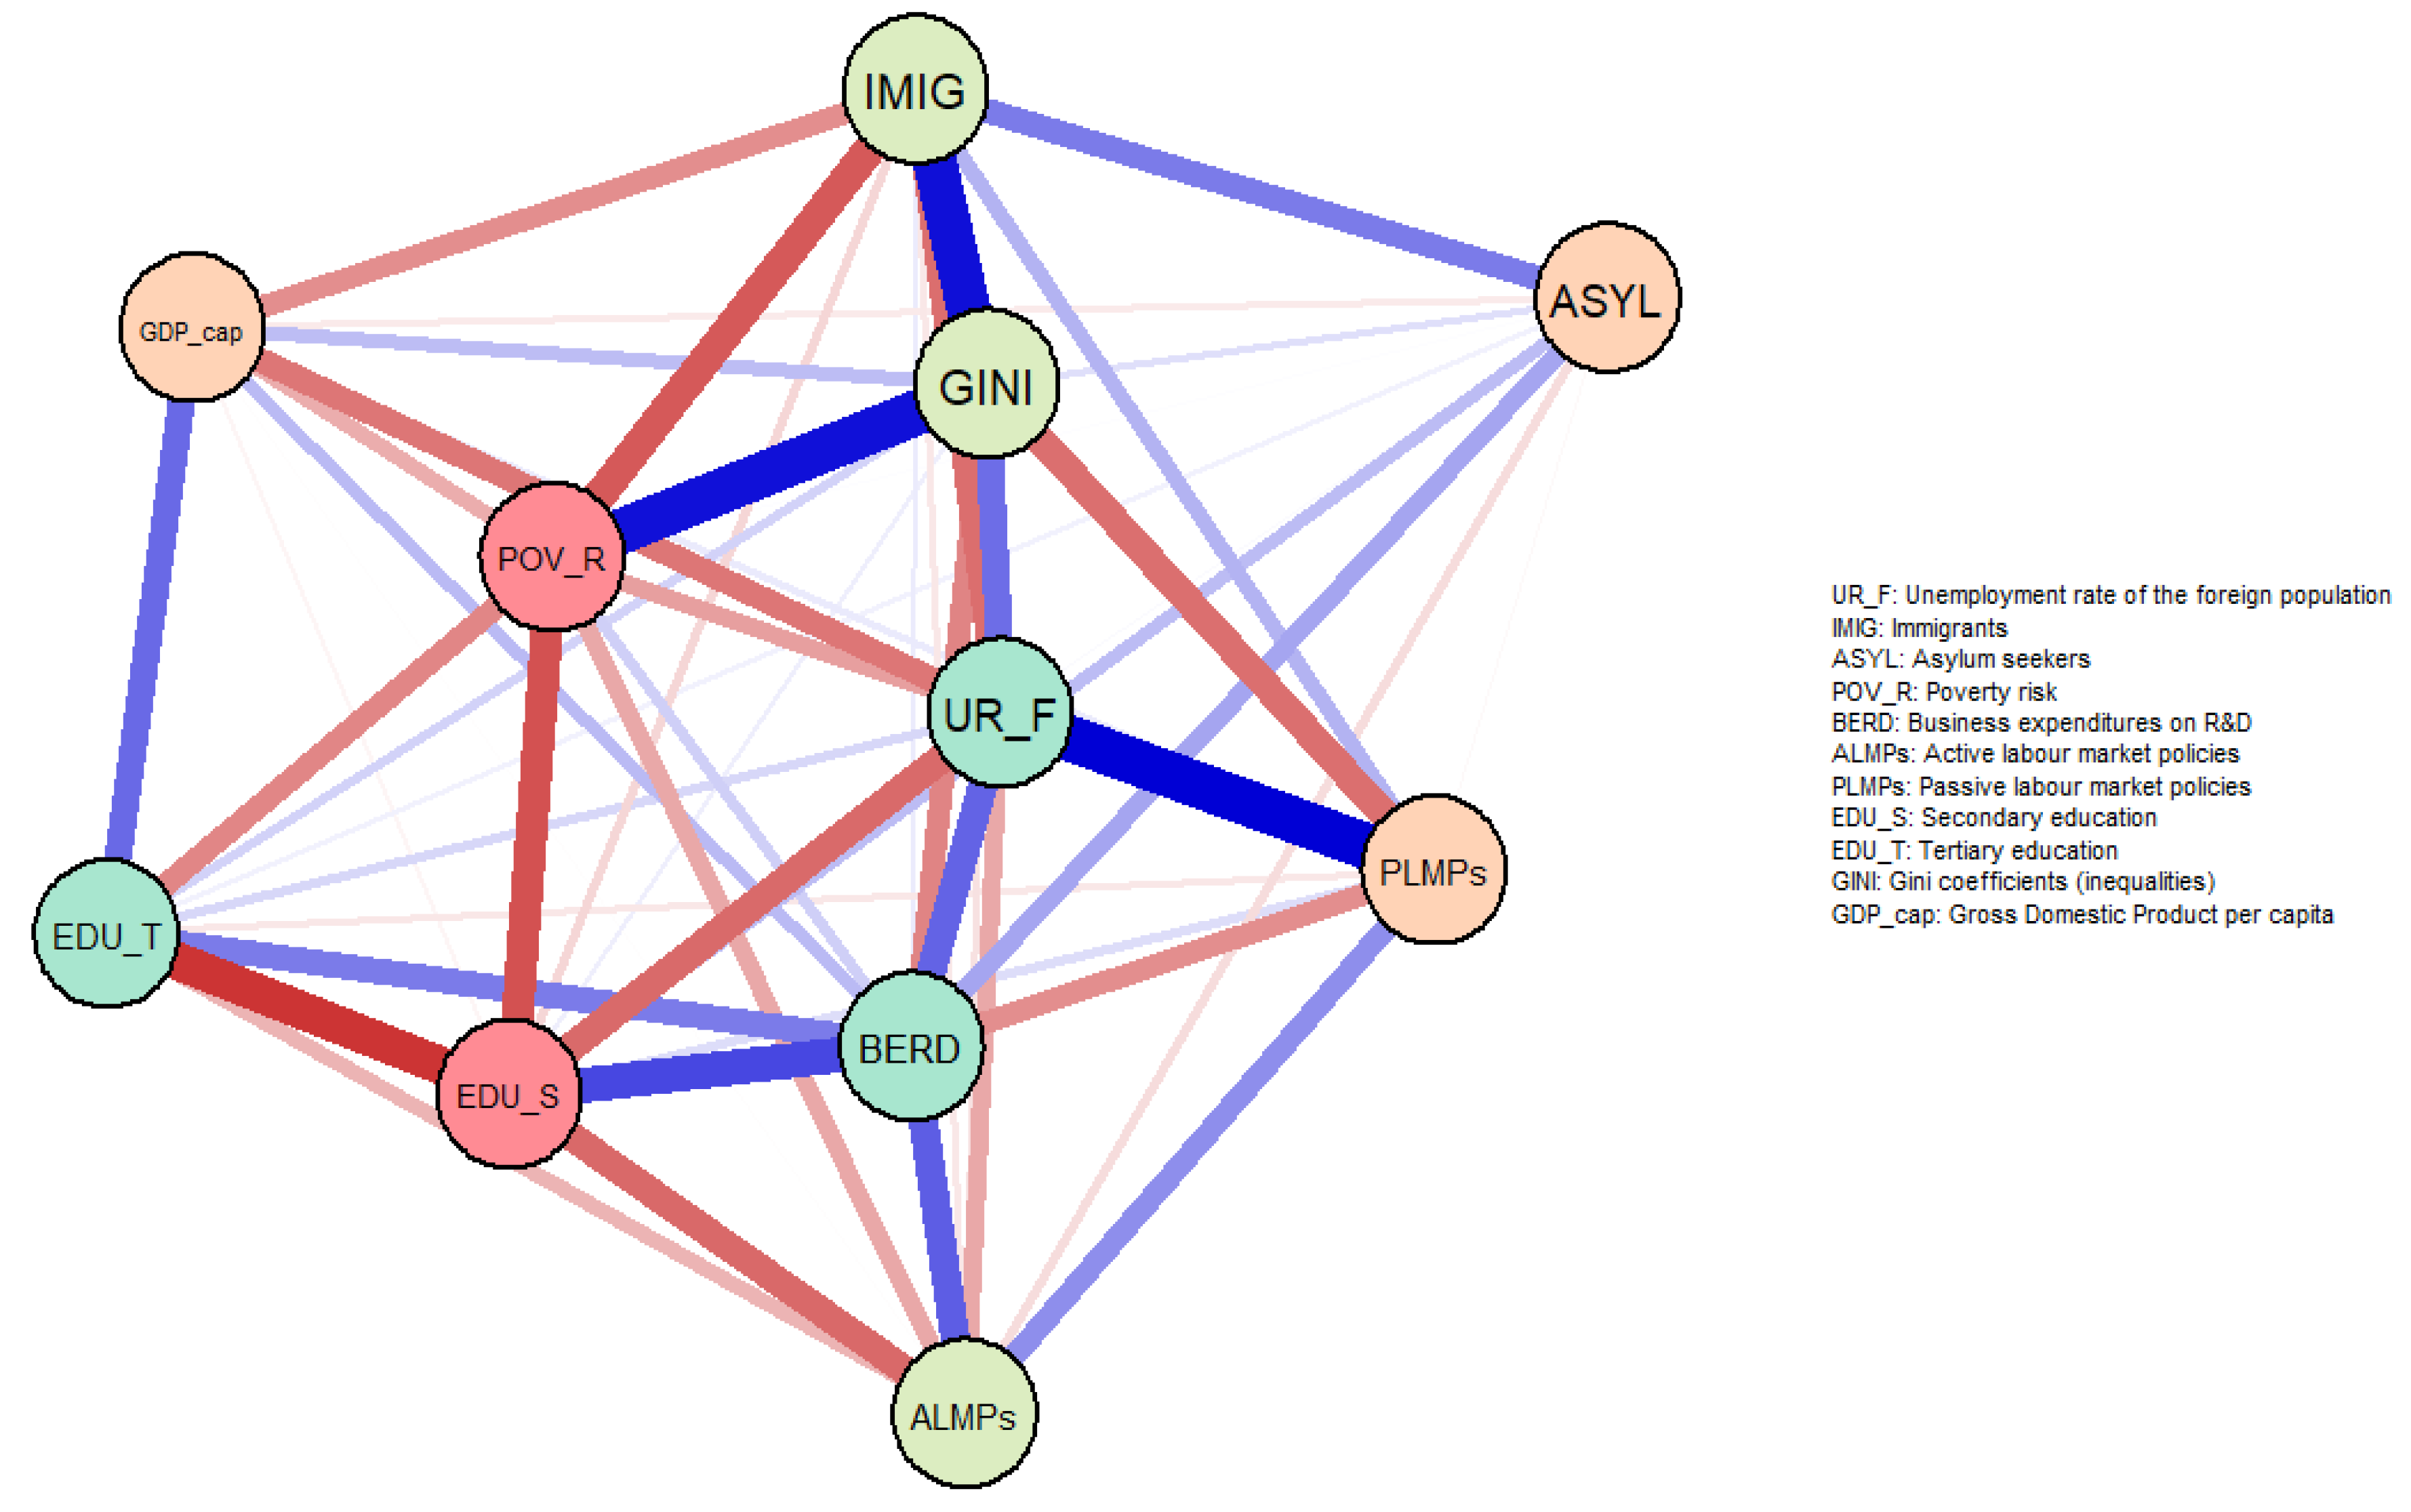
4.3. Network Analysis
5. Concluding Remarks
Author Contributions
Funding
Acknowledgments
Conflicts of Interest
Appendix A

| Acronym | Explanation | Database |
|---|---|---|
| IMIG | Flows of immigrants and foreign population (number) | OECD, Eurostat |
| ASYL | Flows of refugees and asylum applicants (number) | OECD, UNHCR |
| UR_F | Unemployment rate for the foreign population (%) | Eurostat |
| ER_F | Employment rate for the foreign population (%) | Eurostat |
| GDP_cap | Real Gross Domestic Product per capita (Euro) | Eurostat |
| EDU_S | Educational attainment for upper secondary and post–secondary non–tertiary education (levels 3–4) | Eurostat |
| EDU_T | Educational attainment for tertiary education (levels 5–8) | Eurostat |
| ALMPs | Expenditures on Active Labor Market Policies (% of GDP) | Eurostat |
| PLMPs | Expenditures on Passive Labor Market Policies (% of GDP) | Eurostat |
| POV_R | At-risk-of-poverty-rate (%) | Eurostat, World Bank |
| BERD | Business Enterprise R&D expenditures (% of GDP) | Eurostat |
| GINI | GINI coefficients (index) | UNU WIDER |
| N | Mean | sd | min | max | |
|---|---|---|---|---|---|
| IMIG | 180 | 289,868.3 | 269,660.3 | 16,895 | 1,461,433 |
| ASYL | 180 | 37,567.83 | 47,362.88 | 1405 | 363,540 |
| UR_F | 180 | 13.65889 | 5.563587 | 5 | 35.4 |
| ER_F | 180 | 60.95444 | 5.462389 | 45.2 | 72.4 |
| GDP_cap | 180 | 34,722.65 | 10,329.76 | 15,600 | 64,161.97 |
| EDU_S | 180 | 43.29222 | 9.77719 | 20 | 60.8 |
| EDU_T | 180 | 25.61667 | 7.409668 | 8.1 | 56.5 |
| ALMPs | 180 | 0.6604222 | 0.3642167 | 0.035 | 1.745 |
| PLMPs | 180 | 1.376456 | 0.6499149 | 0.062 | 3.053 |
| POV_R | 180 | 20.63778 | 4.545206 | 9.1 | 30.29 |
| BERD | 180 | 1.274556 | 0.6005345 | 0.38 | 2.985 |
| GINI | 180 | 28.65722 | 3.402878 | 20.6 | 37.7 |
| Variables | Test Scale = Mean (Standardized Items), Average | |||||
|---|---|---|---|---|---|---|
| UR_F | ER_F | |||||
| Obs | Sign | alpha | Obs | Sign | alpha | |
| UR_F | 180 | + | 0.7804 | |||
| ER_F | 180 | - | 0.7804 | |||
| GDP_capita | 180 | + | 0.7463 | 180 | + | 0.7517 |
| EDU_S | 180 | + | 0.7840 | 180 | + | 0.7850 |
| EDU_T | 180 | + | 0.7638 | 180 | + | 0.7736 |
| BERD | 180 | + | 0.7153 | 180 | + | 0.7230 |
| ALMPs | 180 | + | 0.7193 | 180 | + | 0.7255 |
| PLMPs | 180 | + | 0.7586 | 180 | + | 0.7640 |
| POV_R | 180 | - | 0.7192 | 180 | - | 0.7267 |
| GINI | 180 | - | 0.6987 | 180 | - | 0.7005 |
| IMIG | 180 | - | 0.7232 | 180 | - | 0.7279 |
| ASYL | 180 | - | 0.7742 | 180 | - | 0.7810 |
| Total scale | 0.7638 | 0.7686 | ||||
| Variables | Chi2 | df | p-Value | Chi2 | df | p-Value |
|---|---|---|---|---|---|---|
| UR_F | ER_F | |||||
| ER_F | 224.13 | 10 | 0.0000 | |||
| UR_F | 413.02 | 10 | 0.0000 | |||
| H0: all coefficients excluding the intercepts are 0. We can thus reject that null hypothesis for each equation. | ||||||
| (a) UR_F | ||
| Fit Statistic | Value | Description |
| Likelihood ratio | ||
| chi2_ms(26) | 0.000 | model vs. saturated |
| p > chi2 | - | |
| chi2_bs(38) | 214.610 | baseline vs. saturated |
| p > chi2 | 0.000 | |
| Information criteria | ||
| AIC | 4662.958 | Akaike’s information criterion |
| BIC | 4701.273 | Bayesian information criterion |
| Baseline comparison | ||
| CFI | 1.000 | Comparative fit index |
| TLI | 1.000 | Tucker-Lewis index |
| Size of residuals | ||
| SRMR | 0.000 | Standardized root mean squared residual |
| CD | 0.696 | Coefficient of determination |
| (b) ER_F | ||
| Fit Statistic | Value | Description |
| Likelihood ratio | ||
| chi2_ms(26) | 0.000 | model vs. saturated |
| p > chi2 | - | |
| chi2_bs(38) | 145.578 | baseline vs. saturated |
| p > chi2 | 0.000 | |
| Information criteria | ||
| AIC | 4735.025 | Akaike’s information criterion |
| BIC | 4773.341 | Bayesian information criterion |
| Baseline comparison | ||
| CFI | 1.000 | Comparative fit index |
| TLI | 1.000 | Tucker-Lewis index |
| Size of residuals | ||
| SRMR | 0.000 | Standardized root mean squared residual |
| CD | 0.555 | Coefficient of determination |
References
- Konle-Seidl, R.; Bolits, G. Labour Market Integration of Refugees: Strategies and Good Practices; European Parliament, Directorate General for Internal Policies, Policy Department A—Economic and Scientific Policy: Brussels, Belgium, 2016. [Google Scholar]
- European Commission. Action Plan on the Integration of Third Country Nationals; Communication from the Commission to the European Parliament, the Council, the European Economic and Social Committee and the Committee of the Regions; European Commission: Brussels, Belgium, 2016. [Google Scholar]
- European Commission. Eurostat. Database. 2018. Available online: http://ec.europa.eu/eurostat/data/ database (accessed on 3 September 2018).
- Van Wolleghem, P.G. The EU’s Policy on the Integration of Migrants: A Case of Soft-Europeanization? Palgrave Studies in European Union Politics; Palgrave Macmillan: Basingstoke, UK, 2019; pp. 1–236. ISBN 978-3-319-97681-5. [Google Scholar]
- Clark, K.; Garratt, L.; Li, Y.; Lymperopoulou, K.; Shankley, W. Local deprivation and the labour market integration of new migrants to England. J. Ethn. Migr. Stud. 2018, 1–23. [Google Scholar] [CrossRef]
- Hoxhaj, R. Wage expectations of illegal immigrants: The role of networks and previous migration experience. Int. Econ. 2015, 142, 136–151. [Google Scholar] [CrossRef]
- Zimmermann, K.F. Labor Mobility and the Integration of European Labor Markets; IZA Discussion Paper 3999; Institute for the Study of Labor: Bonn, Germany, 2009. [Google Scholar]
- Noja, G.G.; Cristea, S.M.; Yüksel, A.; Pânzaru, C.; Drăcea, R.M. Migrants’ role in enhancing the economic development of host countries: Empirical evidence from Europe. Sustainability 2018, 10, 894. [Google Scholar] [CrossRef]
- Amuedo Dorantes, C.; De la Rica, S. Labour market assimilation of recent immigrants in Spain. Br. J. Ind. Relat. 2007, 45, 257–284. [Google Scholar] [CrossRef]
- Delgado Gómez-Flors, M.; Alguacil, M. The impact of immigrant diversity on wages. The Spanish experience. Sustainability 2018, 10, 3312. [Google Scholar] [CrossRef]
- Entzinger, H.; Biezeveld, R. Benchmarking in Immigrant Integration; Report for the European Commission; European Research Centre on Migration and Ethnic Relations: Rotterdam, The Netherlands, 2003. [Google Scholar]
- Van Wolleghem, P.G. Why Implement without a Tangible Threat? The Effect of a Soft Instrument on National Migrant Integration Policies. J. Common Mark. Stud. 2017, 55, 1127–1143. [Google Scholar] [CrossRef]
- Kogan, I. New immigrants—Old disadvantage patterns? Labour market integration of recent immigrants into Germany. Int. Migr. 2011, 49, 91–117. [Google Scholar] [CrossRef]
- Koopmans, R. Trade-offs between equality and difference: Immigrant integration, multiculturalism and the welfare state in cross-national perspective. J. Ethn. Migr. Stud. 2010, 36, 1–26. [Google Scholar] [CrossRef]
- Hooper, K.; Desiderio, M.V.; Salant, B. Improving the Labour Market Integration of Migrants and Refugees—Empowering Cities through Better Use of EU Instruments; Migration Policy Institute Europe (MPI): Brussels, Belgium, 2017. [Google Scholar]
- Petracou, E.; Domazakis, G.; Papayiannis, G.; Yannacopoulos, A. Towards a Common European Space for Asylum. Sustainability 2018, 10, 2961. [Google Scholar] [CrossRef]
- Organization for Economic Cooperation and Development (OECD). International Migration Outlook. Trends in Migration Flows, 2018; Organization for Economic Cooperation and Development (OECD): Paris, France, 2018; Available online: https://www.oecd-ilibrary.org/social-issues-migration-health/international-migration-outlook-2018_migr_outlook-2018-en (accessed on 12 September 2018).
- World Bank. World Development Indicators. 2018. Available online: http://data.worldbank.org/data-catalog/ world-development-indicators (accessed on 4 September 2018).
- The UN Refugee Agency (UNHCR). Figures at a Glance 2017. Geneva: United Nations High Commissioner for Refugees. Available online: http://www.unhcr.org/figures-at-a-glance.html (accessed on 14 September 2018).
- United Nations University World Institute for Development Economics Research (UNU WIDER). World Income Inequality Database; United Nations University: Helsinki, Finland, 2018. [Google Scholar]
- Tănasie, A.; Drăcea, R.; Lădaru, G.R. A Chaos Theory Perspective on International Migration. Sustainability 2017, 9, 2355. [Google Scholar] [CrossRef]
- Noja, G.G.; Cristea, M. Working Conditions and Flexicurity Measures as Key Drivers of Economic Growth: Empirical Evidence for Europe. Ekonomický Časopis 2018, 66, 719–749. [Google Scholar]
- European Foundation for the Improvement of Living and Working Conditions (Eurofound). European Quality of Life Survey; Eurofound: Dublin, Ireland, 2016. [Google Scholar]
- Scicchitano, S. On the Complementarity between On-the-job Training and R&D: A Brief Overview. Econ. Bull. 2007, 15, 1–11. [Google Scholar]
- Scicchitano, S. Complementarity between heterogeneous human capital and R&D: Can job-training avoid low development traps? Empirica 2010, 37, 361–380. [Google Scholar] [CrossRef]
- Huddleston, T.; Bilgili, O.; Joki, A.L.; Vankova, Z. Migrant Integration Policy Index 2015; CIDOB: Barcelona, Spain; MPG: Brussels, Belgium, 2015; Available online: www.mipex.eu (accessed on 9 September 2018).
- Organization for Economic Cooperation and Development (OECD). Handbook on Constructing Composite Indicators: Methodology and User Guide; OECD Publishing: Paris, France, 2005; pp. 83–88. ISBN 978-92-64-04345-9. [Google Scholar]
- Lozano, F.A.; Steinberger, M.D. Empirical Methods in the Economics of International Immigration; IZA Discussion Paper Series 5328; Institute for the Study of Labor: Bonn, Germany, 2010. [Google Scholar]
- Viton, P.A. Notes on Spatial Econometric Models. City Reg. Plan. 2010, 870, 2–17. [Google Scholar]
- Efron, B.; Tibshirani, R.G. An Introduction to the Bootstrap; Chapman & Hall/CRC: Boca Raton, FL, USA, 1993; pp. 1–436. ISBN 0-412-04231-2. [Google Scholar]
- Dempster, A.P. Covariance selection. Biometrics 1972, 28, 157–175. [Google Scholar] [CrossRef]
- Dobra, A.; Eicher, T.; Lenkoski, A. Modeling Uncertainty in Macroeconomic Growth Determinants Using Gaussian Graphical Models; Working Paper 87; Center for Statistics and the Social Sciences, University of Washington: Seattle, WA, USA, 2008. [Google Scholar]
- Glass, A.J.; Kenjegalieva, K.; Sickles, R. The Economic Case for the Spatial Error Model with an Application to State Vehicle Usage in the U.S.; Rice University: Houston, TX, USA, 2012; Available online: https://pdfs.semanticscholar.org/40ff/8eeaae7f1326813e500253adc3eaff0490a9.pdf (accessed on 3 August 2018).
- Aceleanu, M.I.; Şerban, A.C.; Burghelea, C. “Greening” the youth employment—A chance for sustainable development. Sustainability 2015, 7, 2623–2643. [Google Scholar] [CrossRef]
- Dima, A.M.; Meghişan-Toma, G.M. Research on Implementing Education for Sustainable Development. In Proceedings of the International Conference on Business Excellence, Bucharest, Romania, 22–23 March 2018; Sciendo: Warsaw, Poland, 2018; Volume 12, pp. 300–310. [Google Scholar]
- Suciu, M.C.; Lăcătuş, M.L. Soft skills and economic education. Pol. J. Manag. Stud. 2014, 10, 161–168. [Google Scholar]
- Balaz, V.; Karasová, K. Geographical patterns in the intra-European migration before and after Eastern enlargement: The connectivity approach. Ekonomicky Casopis 2017, 65, 3–30. [Google Scholar]
- Lauritzen, S.L. Graphical Models; Oxford University Press: New York, NY, USA, 1996; pp. 1–298. ISBN 0-19-852219-3. [Google Scholar]
- Organization for Economic Cooperation and Development (OECD). Working Together for Local Integration of Migrants and Refugees; Organization for Economic Cooperation and Development (OECD): Paris, France, 2018. [Google Scholar]

| Dependent Variable UR_F | (1) | (2) | (3) | (4) | (5) | (6) |
|---|---|---|---|---|---|---|
| Spatial Lag (Robust) | Spatial Lag (Bootstrap) | Spatial Error (Robust) | Spatial Error (Bootstrap) | RREG | PCSE | |
| GDP_cap | −0.195 *** | −0.195 ** | −0.228 ** | −0.228 ** | −0.281 *** | −0.277 *** |
| (0.0589) | (0.0605) | (0.0843) | (0.0746) | (0.0519) | (0.0515) | |
| EDU_S | −0.339 *** | −0.339 *** | −0.393 *** | −0.393 *** | −0.400 *** | −0.414 *** |
| (0.0662) | (0.0869) | (0.0698) | (0.0730) | (0.0699) | (0.0977) | |
| EDU_T | 0.0627 | 0.0627 | 0.0581 | 0.0581 | 0.167 ** | 0.0758 |
| (0.0633) | (0.0724) | (0.0689) | (0.0829) | (0.0509) | (0.0529) | |
| BERD | 0.419 *** | 0.419 *** | 0.453 *** | 0.453 *** | 0.352 *** | 0.422 *** |
| (0.0691) | (0.0732) | (0.0721) | (0.0656) | (0.0680) | (0.0714) | |
| ALMPs | −0.206 *** | −0.206 *** | −0.196 *** | −0.196 ** | −0.159 ** | −0.179 ** |
| (0.0475) | (0.0585) | (0.0522) | (0.0599) | (0.0547) | (0.0550) | |
| PLMPs | 0.479 *** | 0.479 *** | 0.517 *** | 0.517 *** | 0.510 *** | 0.566 *** |
| (0.0509) | (0.0601) | (0.0548) | (0.0610) | (0.0463) | (0.0482) | |
| POV_R | −0.221 ** | −0.221 * | −0.245 ** | −0.245 ** | −0.341 *** | −0.282 ** |
| (0.0704) | (0.0941) | (0.0775) | (0.0850) | (0.0777) | (0.101) | |
| GINI | 0.339 *** | 0.339 *** | 0.343 *** | 0.343 *** | 0.545 *** | 0.506 *** |
| (0.0862) | (0.0847) | (0.0991) | (0.103) | (0.0880) | (0.0945) | |
| IMIG | −0.207 *** | −0.207 *** | −0.298 *** | −0.298 *** | −0.387 *** | −0.320 *** |
| (0.0572) | (0.0612) | (0.0660) | (0.0690) | (0.0561) | (0.0590) | |
| ASYL | −0.0206 | −0.0206 | 0.000299 | 0.000299 | 0.0447 | 0.00620 |
| (0.0243) | (0.0320) | (0.0253) | (0.0291) | (0.0321) | (0.0285) | |
| _cons | −0.0758 * | −0.0758 | −0.364 | −0.364 *** | −0.0588 | −0.00980 |
| (0.0353) | (0.0492) | (0.799) | (0.0427) | (0.0390) | (0.0509) | |
| Rho | ||||||
| _cons | 0.881 *** | 0.881 ** | ||||
| (0.0864) | (0.289) | |||||
| Sigma | ||||||
| _cons | 0.483 *** | 0.483 *** | 0.491 *** | 0.491 *** | ||
| (0.0330) | (0.0418) | (0.0342) | (0.0345) | |||
| Lambda | ||||||
| _cons | 0.948 *** | 0.948 * | ||||
| (0.0529) | (0.386) | |||||
| Test parameters | chi2(2) = 15.23 p = 0.0005 | chi2(2) = 14.82 p = 0.0006 | chi2(2) = 14.79 p = 0.0006 | chi2(2) = 13.41 p = 0.0012 | F(2, 169) = 21.51 p = 0.0000 | chi2(2) = 39.62 p = 0.0000 |
| LM | 58.961 (0.000) | 58.961 (0.000) | 37.801 (0.000) | 37.801 (0.000) | ||
| Wald test of rho/lambda | 104.004 (0.000) | 104.004 (0.000) | 320.381 (0.000) | 320.381 (0.000) | ||
| Acceptable range for rho: −2.150 < rho < 1.000; Acceptable range for lambda: −2.150 < lambda < 1.000 | ||||||
| Moran’s I IMIG I = 0.343; p = 0.000; ASYL I = 0.064; p = 0.000; UR_F I = 0.216; p = 0.000 | ||||||
| N | 180 | 180 | 180 | 180 | 180 | 180 |
| R2 | 0.738 | 0.696 | ||||
| Dependent Variable ER_F | (1) | (2) | (3) | (4) | (5) | (6) |
|---|---|---|---|---|---|---|
| Spatial Lag (Robust) | Spatial Lag (Bootstrap) | Spatial Error (Robust) | Spatial Error (Bootstrap) | RREG | PCSE | |
| GDP_cap | 0.0452 | 0.0452 | 0.0714 | 0.0714 | 0.104 | 0.123 * |
| (0.0711) | (0.0587) | (0.101) | (0.0840) | (0.0747) | (0.0502) | |
| EDU_S | 0.0857 | 0.0857 | 0.131 | 0.131 | 0.158 | 0.118 |
| (0.0984) | (0.112) | (0.101) | (0.104) | (0.101) | (0.0874) | |
| EDU_T | −0.0643 | −0.0643 | −0.0407 | −0.0407 | −0.0767 | −0.0842 |
| (0.0560) | (0.0511) | (0.0584) | (0.0571) | (0.0733) | (0.0469) | |
| BERD | −0.0813 | −0.0813 | −0.131 | −0.131 | −0.0457 | −0.0706 |
| (0.104) | (0.0994) | (0.104) | (0.121) | (0.0979) | (0.0813) | |
| ALMPs | 0.130 | 0.130 | 0.105 | 0.105 | 0.127 | 0.120 |
| (0.0745) | (0.0851) | (0.0749) | (0.0677) | (0.0787) | (0.0686) | |
| PLMPs | −0.540 *** | −0.540 *** | −0.557 *** | −0.557 *** | −0.574 *** | −0.581 *** |
| (0.0508) | (0.0533) | (0.0504) | (0.0455) | (0.0666) | (0.0429) | |
| POV_R | −0.362 *** | −0.362 ** | −0.368 ** | −0.368 *** | −0.331 ** | −0.346 ** |
| (0.109) | (0.138) | (0.112) | (0.110) | (0.112) | (0.108) | |
| GINI | 0.323 ** | 0.323 * | 0.337 ** | 0.337 ** | 0.295 * | 0.268 * |
| (0.111) | (0.134) | (0.115) | (0.128) | (0.127) | (0.131) | |
| IMIG | 0.108 | 0.108 | 0.237 * | 0.237 ** | 0.179 * | 0.210 *** |
| (0.0856) | (0.114) | (0.0962) | (0.0880) | (0.0807) | (0.0630) | |
| ASYL | −0.0991 * | −0.0991 * | −0.124 ** | −0.124 * | −0.129 ** | −0.135 ** |
| (0.0442) | (0.0473) | (0.0450) | (0.0550) | (0.0462) | (0.0493) | |
| _cons | 0.0625 | 0.0625 | 0.131 | 0.131 ** | 0.0225 | 0.0194 |
| (0.0533) | (0.0586) | (0.512) | (0.0435) | (0.0562) | (0.0395) | |
| rho | ||||||
| _cons | 0.760 *** | 0.760 ** | ||||
| (0.185) | (0.284) | |||||
| sigma | ||||||
| _cons | 0.642 *** | 0.642 *** | 0.629 *** | 0.629 *** | ||
| (0.0308) | (0.0287) | (0.0301) | (0.0323) | |||
| lambda | ||||||
| _cons | 0.897 *** | 0.897 * | ||||
| (0.109) | (0.429) | |||||
| Test parameters | chi2(2) = 11.62 p = 0.0030 | chi2(2) = 8.05 p = 0.0178 | chi2(2) = 11.43 p = 0.0033 | chi2(2) = 12.96 p = 0.0015 | F(2, 169) = 5.99 p = 0.0031 | chi2(2) = 25.51 p = 0.0000 |
| LM | 12.645 (0.000) | 12.645 (0.000) | 16.711 (0.000) | 16.711 (0.000) | ||
| Wald test of rho/lambda | 16.788 (0.000) | 16.788 (0.000) | 67.713 (0.000) | 67.713 (0.000) | ||
| Acceptable range for rho: −2.150 < rho < 1.000; Acceptable range for lambda: −2.150 < lambda < 1.000 | ||||||
| Moran’s I IMIG I = 0.343; p = 0.000; ASYL I = 0.064; p = 0.000; ER_F I = 0.120; p = 0.000 | ||||||
| N | 180 | 180 | 180 | 180 | 180 | 180 |
| R2 | 0.521 | 0.555 | ||||
| (1) | (2) | |
|---|---|---|
| Variables | UR_F | ER_F |
| GDP_capita_st | −0.277 *** | 0.123 |
| (0.0560) | (0.0684) | |
| EDU_S_st | −0.414 *** | 0.118 |
| (0.0755) | (0.0922) | |
| EDU_T_st | 0.0758 | −0.0842 |
| (0.0549) | (0.0671) | |
| BERD_e_st | 0.422 *** | −0.0706 |
| (0.0734) | (0.0896) | |
| ALMPs_st | −0.179 ** | 0.120 |
| (0.0590) | (0.0721) | |
| PLMPs_st | 0.566 *** | −0.581 *** |
| (0.0499) | (0.0610) | |
| POV_R_st | −0.282 *** | −0.346 *** |
| (0.0838) | (0.102) | |
| GINI_st | 0.506 *** | 0.268 * |
| (0.0949) | (0.116) | |
| IMIG_st | −0.320 *** | 0.210 ** |
| (0.0605) | (0.0739) | |
| ASYL_st | 0.00620 | −0.135 ** |
| (0.0346) | (0.0423) | |
| _cons | −0.00980 | 0.0194 |
| (0.0421) | (0.0514) | |
| var(e.UR_F_st) | ||
| _cons | 0.301 *** | |
| (0.0317) | ||
| var(e.ER_F_st) | ||
| _cons | 0.448 *** | |
| (0.0473) | ||
| N | 180 | 180 |
© 2018 by the authors. Licensee MDPI, Basel, Switzerland. This article is an open access article distributed under the terms and conditions of the Creative Commons Attribution (CC BY) license (http://creativecommons.org/licenses/by/4.0/).
Share and Cite
Marcu, N.; Siminică, M.; Noja, G.G.; Cristea, M.; Dobrotă, C.E. Migrants’ Integration on the European Labor Market: A Spatial Bootstrap, SEM and Network Approach. Sustainability 2018, 10, 4543. https://doi.org/10.3390/su10124543
Marcu N, Siminică M, Noja GG, Cristea M, Dobrotă CE. Migrants’ Integration on the European Labor Market: A Spatial Bootstrap, SEM and Network Approach. Sustainability. 2018; 10(12):4543. https://doi.org/10.3390/su10124543
Chicago/Turabian StyleMarcu, Nicu, Marian Siminică, Graţiela Georgiana Noja, Mirela Cristea, and Carmen Elena Dobrotă. 2018. "Migrants’ Integration on the European Labor Market: A Spatial Bootstrap, SEM and Network Approach" Sustainability 10, no. 12: 4543. https://doi.org/10.3390/su10124543
APA StyleMarcu, N., Siminică, M., Noja, G. G., Cristea, M., & Dobrotă, C. E. (2018). Migrants’ Integration on the European Labor Market: A Spatial Bootstrap, SEM and Network Approach. Sustainability, 10(12), 4543. https://doi.org/10.3390/su10124543