Article

Pollution Assessment of Trace Elements in Agricultural Soils around Copper Mining Area

1
Yunnan Land and Resources Vocational College, Kunming 652501, China
2
ENET Centre, VSB—Technical University of Ostrava, 708 33 Ostrava-Poruba, Czech Republic
*
Author to whom correspondence should be addressed.
Sustainability 2018, 10(12), 4533; https://doi.org/10.3390/su10124533
Submission received: 31 October 2018 / Revised: 20 November 2018 / Accepted: 21 November 2018 / Published: 1 December 2018
(This article belongs to the Special Issue Sustainable Management of Heavy Metals)

Abstract

:
Agricultural soils from Dongchuan copper mining area were sampled and analyzed to determine the concentrations of selected trace elements, namely As, Cd, Cr, Cu, Hg, Ni, Pb and Zn. The main objectives of this study were: (1) To determine the levels of trace elements and their spatial distribution in soils; (2) to evaluate the potential ecological risk; and (3) to identify the main sources of risk element pollution. The environmental risks were assessed using five different contamination and pollution indexes. Descriptive and exploratory statistical analyses were performed to identify the relations among the trace elements in soils and possible sources of pollution. Although the values of As, Cu and Zn in the soils were significantly higher than Yunnan background values and exceeded the limits of the Chinese national standards in several sampling points, the most serious threat for the ecosystem and human health was represented by Cd. The main sources of Cu and As were identified mining activities, airborne particulates from smelters and the weathering of tailings, and partly also agricultural fertilizers. The major source of Cd was agricultural fertilizers and partly sources associated with mining and smelting activities.

1. Introduction

Mining and metallurgical activities have long been recognized as important producers of waste and environmental pollution. Metalliferous mines, processing plants and smelters, in particular, generate huge amounts of mine tailings, wastewater and dust, which can contaminate the soil by risk elements. These metals and metalloids are transported mainly in the form of wastewater and airborne dust particles [1,2,3,4,5]. Risk element pollution in soil has been a cause for concern because risk elements are difficult to decompose and may be transported into the human body through the food chain and air. Moreover, they may bioaccumulate [6,7,8,9].
The Yunnan province is known for its high amount of mineral resources, such as lead, zinc, tin, phosphorus, copper and many others. On the one hand, the mining activities in the province boost the local economy. On the other hand, they cause serious environmental problems. Known as the “copper capital”, the Dongchuan Copper ore field is located in the north of Yunnan Province, Southwest China. The total tonnage of copper metal resource is 3.914 Mt with the famous mining history of about 500 years (since A.D. 1525) [10]. On the other side, the broad valleys along the Xiaojiang River are the most important agriculture lands in Dongchuan, and the irrigation mostly relies on the Xiaojiang River. In March 2013, the water in a 25-km segment of the Xiaojiang River was polluted by wastewater from tailings and tailings grit from 17 mine enterprises. This incident attracted a great deal of public attention to mining in China. Due to the white color of the polluted river segment, it was referred to as the “Milk River Incident”. The contamination of river water by mining or metallurgical activities and its subsequent use for irrigation can lead to the accumulation of toxic elements in the agroecosystems. Such results are typical mainly for the arid and semi-arid areas and areas with long dry seasons. Examples can be mentioned from several places around the world, such as the soils irrigated by the waters influenced by the copper mining in the Republic of Armenia around the Voghchi river [11], Georgia around the Mashavera and Kazretula rivers [12], Chile around the Aconcagua and Cachapoal Rivers [13], or around the Sinú river in Colombia [14]. Similar results have been reported from mining areas in Morocco [15], Tunisia [16] or Portugal [17]. The waters flowing directly from Pb-Zn mines in Enyigba, Nigeria, are used for farm land irrigation during the dry mid-winter season and cause pollution of arable soils and food crops [18].
Despite long and intense mining in Dongchuan, only a few studies report a systematic research of risk elements contamination in this area [19,20,21]. None of the published works have dealt with the spatial distribution and identification of risk element sources in Dongchuan. Our study aims to bring a comprehensive view of the problem of risk element pollution. The study presents results of trace element concentrations, their spatial distributions, contamination assessment, and statistical characteristics.
Different methods have been used to assess contamination and ecological risks in the areas influenced by ore mining [4,22,23,24,25]. The contamination factor, modified contamination degree, comprehensive potential ecological risk index, and Nemerow comprehensive index were used to assess the level and distribution of risk element pollution and ecological risk in the soils in Dongchuan mining area. Currently, multivariate statistical approaches are widely used statistical methods to process multidimensional datasets in environmental pollution research [26,27,28,29,30]. In this study, cluster analysis (CA), principal component analysis (PCA), and correlation analysis were used to identify the relationships between trace elements in soils and their possible sources. To determine the main principles of trace element migration and to assist the interpretation of geochemical data, we studied the spatial distribution of trace elements in the Dongchuan area.
The study has the following objectives: (1) To determine the levels of selected risk elements contamination and their spatial distribution in the topsoils in Dongchuan mining area; (2) to evaluate the ecological risks using a variety of methods and to compare the results; and (3) to identify the major sources of risk element pollution of farmlands around Dongchuan.

2. Materials and Methods

2.1. Study Area

Dongchuan Copper ore field covers 660 km2 (E 102°41′–102°51′, N 26°8′–26°30′) and consists of tens of large to middle deposits, such as Tangdan, Luoxue, Yinmin, Lanniping, Xintang, Baixila, and Shijiangjun copper deposits. The copper deposits occur in the Kunyang Group of the late Paleoproterozoic to early Mesoproterozoic age, containing conglomerate, sandstone, slate, dolostone, carbonaceous slate, and minor tuffaceous volcanic rocks [10,31]. Bornite and chalcopyrite are the main ore minerals, followed by chalcocite, digenite, covellite, and enargite [10]. In addition, tetrahedrite, zincian renierite and pyrite can be found occasionally. The copper ores contain many elements, such as Fe, Si, Mg, Mn, Al, Pb, Cr, Cd, Ag, Ba, V, Ca, Sn, Ni, As, Co, and P [32]. Gangue minerals are mainly quartz, calcite and dolomite [10].
Large scale development began in the 1950s as one of the Chinese national key construction projects. There were 20 mining sections and eight processing systems with a processing capacity of total 12.6 kt/d in the period from the 1970s to 1990s [32]. Nowadays, Dongchuan is still one of the six most important copper producing areas in China. There are four major mines with a total mining capacity of 2.255 Mt/a, namely Yinmin mine, Tangdan mine, Luoxue mine and Lanniping mine. In addition to these mines, there are more than 20 other small mines. The main land use types are woodland, waste land, cultivated land, grassland, dwelling land, and mining land. The cultivated land area decreased by 8% in the period between 1996 and 2003. The major land use changes in Dongchuan were in favor of construction and mining area [33]. Comparing the land use between 2006 and 2015 through remote Sensing Interpretation, the construction area increased by 12.9 km2 and is mainly distributed around Dongchuan City and along the Xiaojiang River. Mining area increased by 4.8 km2 and is distributed mainly around the pre-existing mines.
Dongchuan mining area is located in the north of Yunnan-Kweichow Plateau. Due to the deep erosion caused by the Xiaojiang River and its tributaries and the regional uplift caused by neotectonic movement, the elevation of the area ranges from about 700 m to about 4000 m. The landform is alpinotype middle alp [32]. The whole mining area is carved up by meridional and transmeridional “V” type valleys. The mountainous region covers 97.3% of the total area, and the rest belongs to the basin area [33]. The topographic slope is generally 30°~40°.
The total length of the Xiaojiang River is 140 km, the maximum discharge is 674 m3/s, while minimum discharge is 6.1 m3/s [24]. Due to the special geological conditions and heavy human interventions [33], there are 107 ravines of debris flow in Xiaojiang drainage basin [34]. Because of the steep terrain and brittle geological conditions, it is very difficult to find an appropriate place to build tailing ponds.
Dongchuan mining area has a moist-semihumid monsoon plateau climate with a clear vertical three-dimensional climate. The average annual temperature in the valleys is 20.2 °C, while that in the mountaintop is 7.1 °C [32]. The annual average precipitation ranges from 600 mm to 1200 mm in dependence on the altitudes [32]. However, the precipitation concentrates in the wet season, which is from May to October, accounting for 85% of the total precipitation. Prevailing wind directions are southern and northern with the annual mean wind speed of 3.4 m/s [35].
The soil texture in the study area was described as silt loam soil with the mean soil organic matter of 33.14 g/kg [36,37]. There are seven types of soil distributing from valley to mountaintop, namely dry red soil (<1500 m), brown red soil (1500 m~1700 m), red soil (1700 m~2200 m), yellowish red soil (2200 m~2550 m), yellow brown soil (2550 m~2900 m), dark brown soil (2900 m~3550 m) and subalpine meadow soil (>3300 m), in which red soil is the most widespread type [38].

2.2. Field Sampling

Topsoil samples were taken from actively farmed lands around Dongchuan copper mining area in February 2016. The map of the study area with the sampling sites is shown in Figure 1. Samples were taken along the Xiaojiang River, Huangshui Creek and Dashui Creek. One sample was collected from the cultivated land on the mountaintop. Soil samples were collected from the soil horizon (0–20 cm). Each sample was composed of 3~5 mixed sub-samples, where 1 kg of the mixture was selected by quartering and then stored in polyethylene zip bags.

2.3. Sample Preparation and Chemical Analysis

All the soil samples were subjected to tests in the Test Center in Kunming. Its laboratories meet the quality system for accreditation in accordance with ISO 9001 and ISO 17025 standards. All samples were oven-dried at 40 °C for 72 h. They were ground, sieved through a 0.15-mm plastic screen, and milled to 0.097 mm for chemical analysis. The pH of the samples was measured in the soil:water (1:5 v/v) suspension using the electrical conductivity method (ISO-10390 2005) by a pH meter INESA PHS-3C. To determine mercury, 0.5 g of each soil sample was digested with concentrated HNO3 (10 mL) and H2SO4 (20 mL) for 1 h at 70 °C [39]. To determine the remaining trace elements, soil samples of 0.25 g were inserted in the acid-washed Teflon beakers. HNO3 (3.0 mL), HClO4 (3.0 mL) and HF (10 mL) were added to each beaker and heated on a hot plate at 180 °C for 1–1.5 h. After cooling, slightly warmed HCl (10 mL) was added. Total values of arsenic and mercury were determined using an atomic fluorescence spectrometer. ICP-MS was used to identify the total value of other elements. Analytical procedures, instrumental models and detection limits are summarized in Table 1. All the analyses were carried out using guaranteed reagent and ultrapure water. The duplicate sample method was performed with relative deviation below 10%.

2.4. Data Analysis and Geostatistics

Initially, an exploratory data analysis (EDA) and confirmatory data analysis (CDA) were performed using IBM SPSS Statistics (version 25.0) (IBM Corp., North Castle, NY, USA) and Statgraphics Plus 5.0 statistical software (Statgraphics Technologies, Inc., The Plains, VA, USA). The Shapiro-Wilk test was used to determine whether the data were normally distributed. All statistical analyses and tests were performed at significance levels of p < 0.05 and 0.01. The determination of geochemical background values and threshold values for each variable were performed using iterative 2σ-technique described by Matschullat et al. [40]. This method does not require normally distributed data, and can be used on relatively small datasets [41]. The calculations were performed using Visual Basic macro BACKGROUND published and designed by Nakić et al. [41].
To identify the relationships among trace elements and pH in agricultural soils and for the identification of major sources of pollution, the correlation analysis and multidimensional statistical methods (cluster analysis (CA) and principal component analysis (PCA)) were performed using OriginPro 9.1 software (trial version). In cases where datasets did not meet the assumption of normality and outliers were identified, the datasets were transformed by a logarithmic transformation.
The main advantage of multidimensional statistical methods is their ability to reduce the number of originally monitored variables to a smaller number of latent variables. The purpose of cluster analysis is clustering of observed parameters and samples into different geochemical groups. Clustering is based on the similarities of the monitored parameters and their chemical properties. CA was conducted according to the Ward-Wishart method. The euclidean metric was employed to measure the distance among the groups. The graphical representation of the hierarchical clustering procedure is a dendrogram. The essence of PCA is a linear transformation of original variables into a smaller number of uncorrelated latent variables (principal components, PCs). The graphical representation of results of principal component analysis is a biplot.
The spatial distribution maps of trace elements and pH were created using Surfer 12 (Golden Software, Inc., Golden, CO, USA). The method of ordinary kriging with an omnidirectional variogram was used for grid calculation. Based on the cross-validation results, the linear interpolation method was applied to construct the maps of spatial distribution of monitored variables in agricultural soils. As in the case of the multidimensional analysis, the logarithmic-transformed datasets were used for geostatistical modeling. Finally, the transformed data were converted using back-transformation into normal (original) values that appear on the maps.

2.5. Risk Assessment Methods

To evaluate trace element pollution risk, several indices were calculated in accordance with the equations below.
The contamination factor C f i was proposed by Håkanson [42] and its expression is:
C f i = C i C n i
where Ci is the measured value of trace element i in the soil sample (mg/kg) and C n i is the geochemical background value of trace element i. The geochemical background values for As, Cd, Cr, Cu, Ni, Pb, Zn [22] and Hg [43] for the Yunnan Province were used in the calculation (Table 2). Cf value was divided into four categories: Cf < 1, low contamination; 1 ≤ Cf < 3, moderate contamination; 3 ≤ Cf <6, considerable contamination; and Cf ≥ 6, very high contamination [42].
The potential ecological risk index comprehensively evaluates the risk behavior of an element in the environment [42]. Mathematically, Er is calculated as follows:
E r i = C f i × T r i
where Er is the potential ecological risk associated with element i, Cf is the contamination factor of trace element i, and Tr is the toxicity coefficient of element i. Håkanson [42] determined the toxicity coefficients for As, Cd, Cr, Cu, Hg, Pb, and Zn to be 1, 2, 5, 5, 10, 30 and 40 respectively. The degree of Er is classified as follows: Er < 40, low risk; 40 ≤ Er < 80, moderate risk; 80 ≤ Er < 160, considerable risk; 160 ≤ Er < 320, high risk; and Er ≥ 320, very high risk.
The degree of contamination mCd was calculated based on Abrahim’s modification of the Håkanson contamination degree Cd. mCd represents a generalized form of the overall degree of contamination at a sampling point [42,44]. Equation (3) was used to calculate mCd.
mC d = i = 1 N C f i N
where N is the number of elements analyzed and Cf is the contamination factor. Brady et al. [45] classified mCd into seven grades: mCd < 1.5, unpolluted; 1.5 ≤ mCd <2, slightly polluted; 2 ≤ mCd < 4, moderately polluted; 4 ≤ mCd < 8, considerably polluted; 8 ≤ mCd < 16, highly polluted; 16 ≤ mCd < 32, strongly polluted; and mCd ≥ 32, extremely polluted.
The Nemerow comprehensive index Pi can be calculated in accordance with Equation (4):
P i = ( mC d ) 2 + ( C f   m a x i ) 2 2
where mCd is the modified contamination degree calculated from Equation (2) and Cfmax is the maximum value of the contamination factor calculated from Equation (1) [46]. Soil pollution according to the Nemerow index can be classified into five groups: Pi ≤ 0.7, clean; 0.7 < Pi ≤ 1, warning limit; 1 < Pi ≤ 2, slight pollution; 2 < Pi ≤ 3, moderate pollution; and Pi > 3, heavy pollution [47]. Recently, the Nemerow index has been widely used to assess soils [48,49], stream sediments [50] and waters [51].
Potential ecological risk index for combined factors RI is calculated as follows:
RI = i = 1 n E r i
where Er is the monomial potential ecological risk associated with element i. Håkanson [42] evaluated the RI of eight parameters (As, Cd, Cr, Cu, Hg, Pb, Zn and PCBs). Because PCBs are not included in this study, it is necessary to modify the original grading for the RI using the weighted average method [52,53,54]. The modified grades for the RI of seven trace elements are as follows: RI < 105, low risk; 105 ≤ RI < 210, moderate risk; 210 ≤ RI < 420, considerable risk; and RI ≥ 420, very high risk [54].

3. Results and Discussion

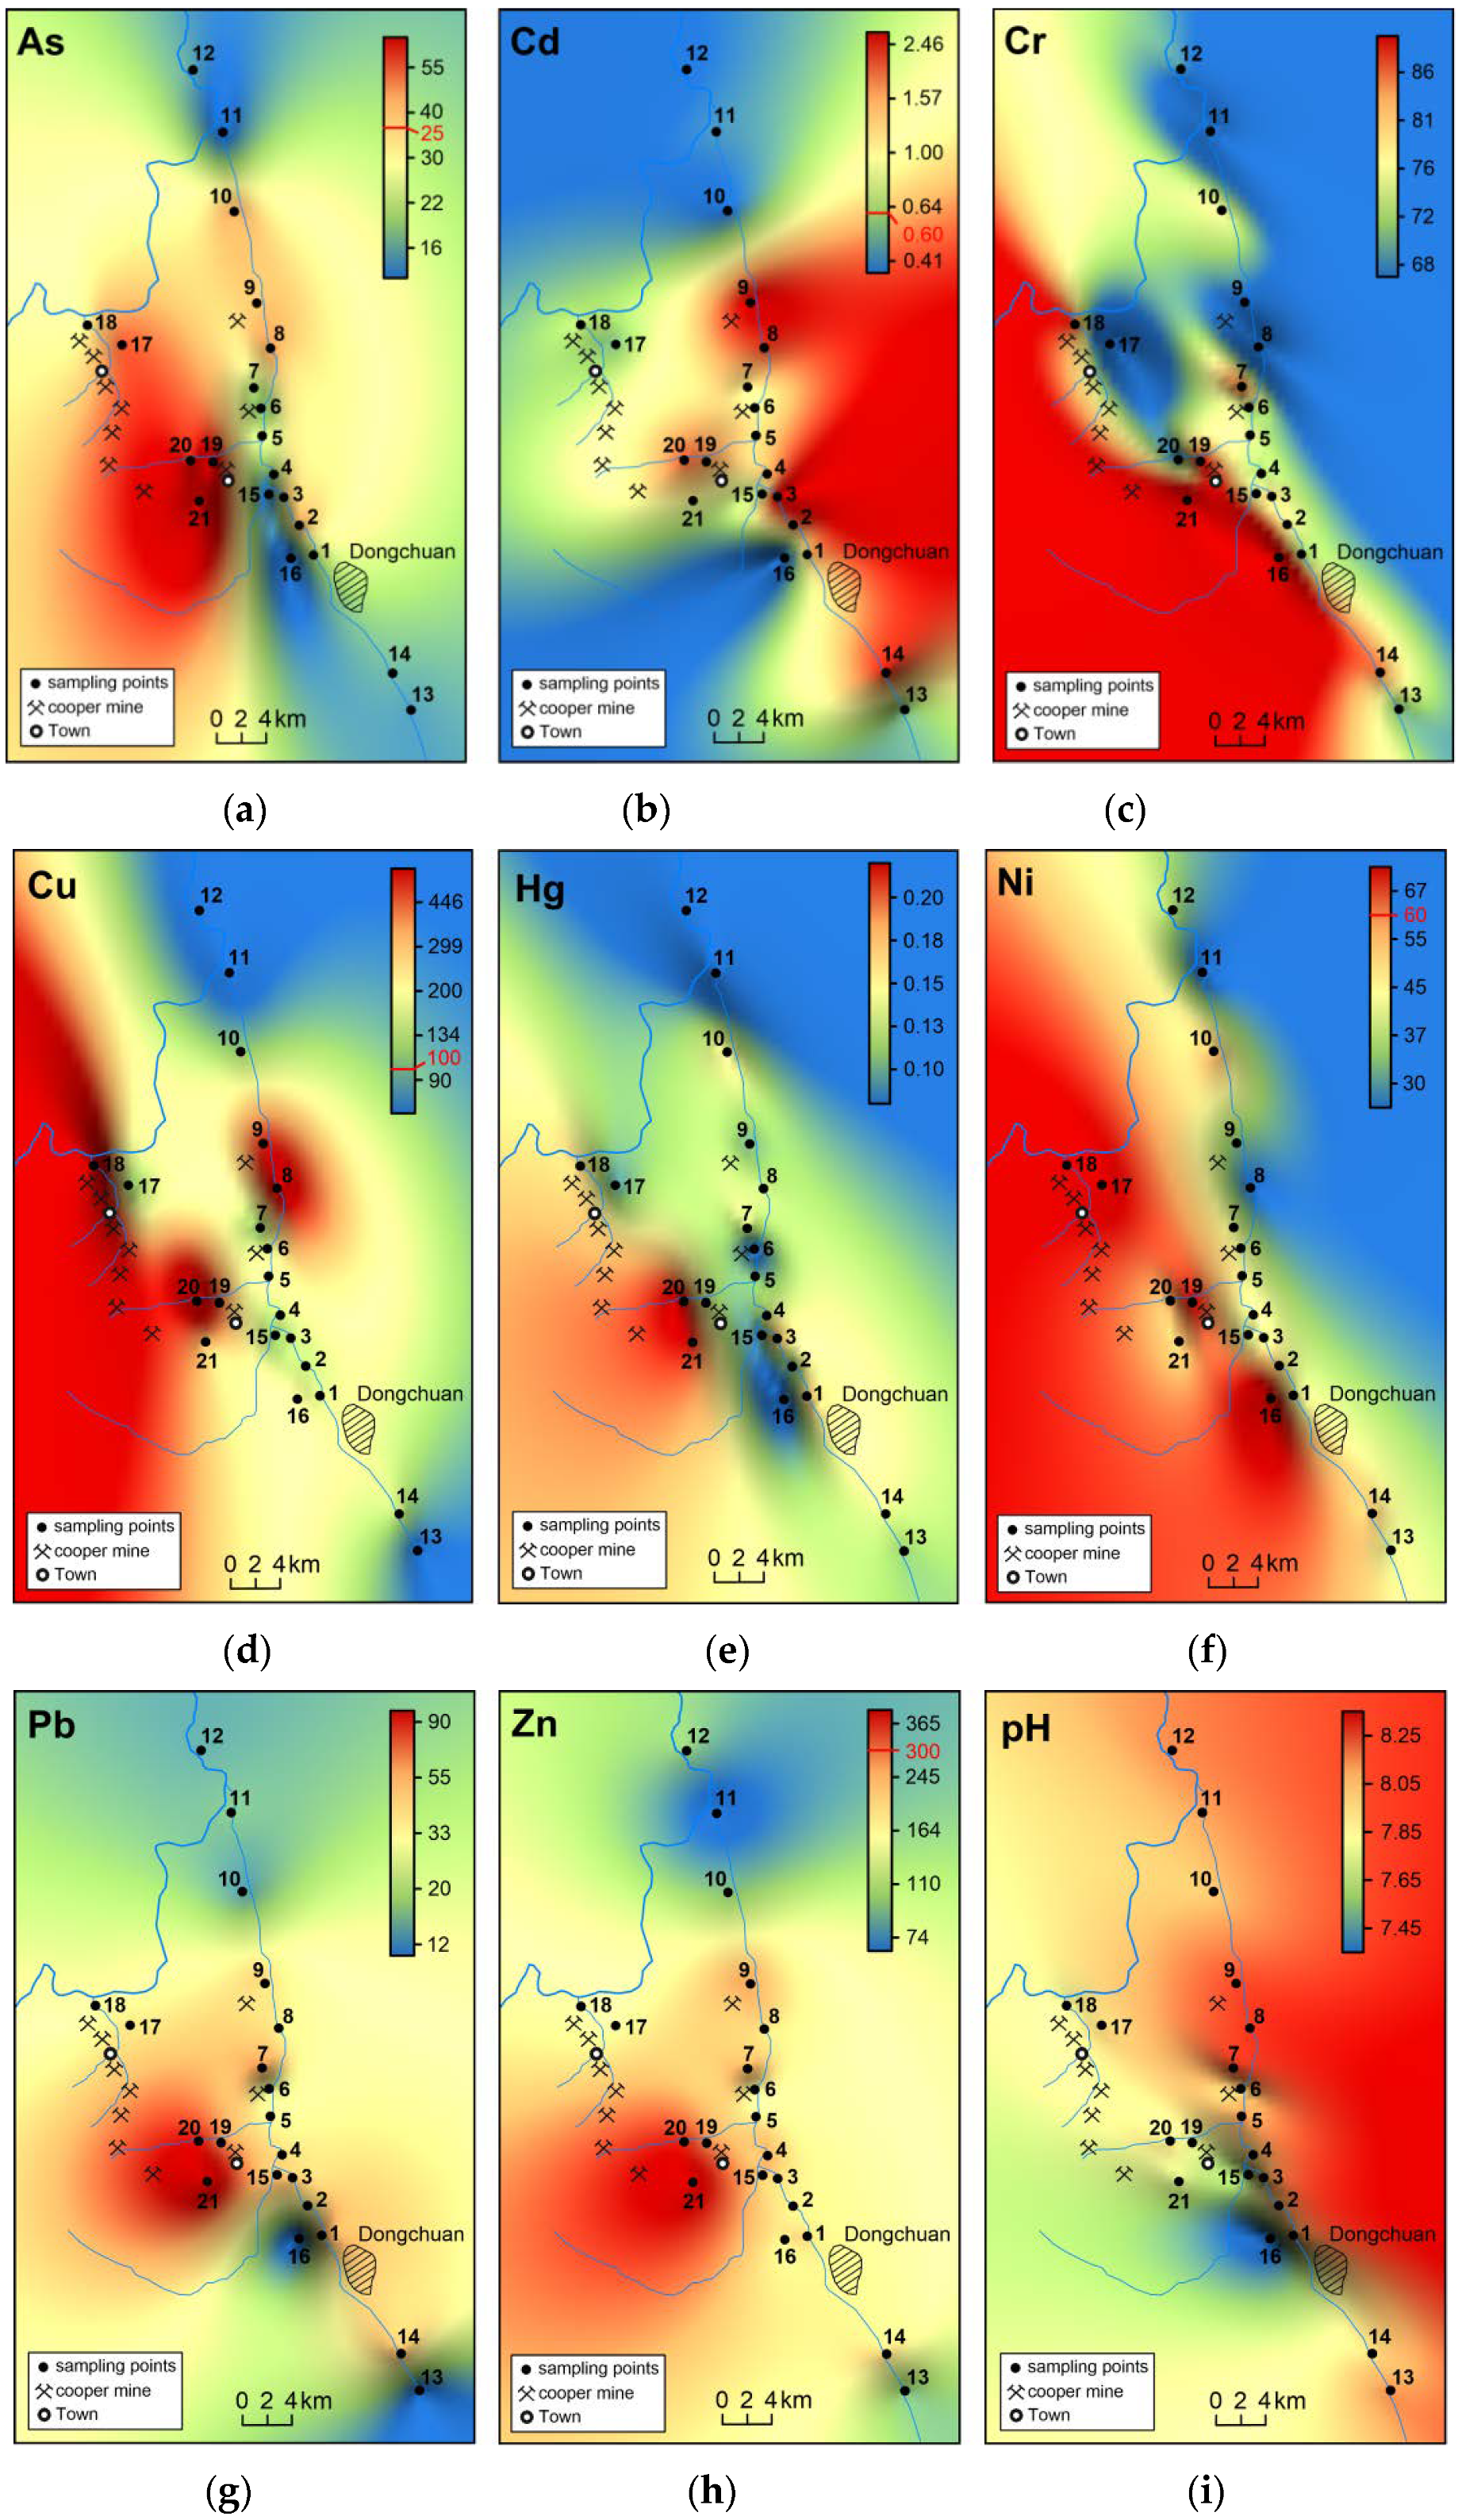
3.1. Trace Element Concentrations

By performing EDA, we found that most of the variables are not normally distributed with many outliers. The outliers can be very important for the identification of pollution sources and therefore were not excluded. For those reasons, the median and interquartile range (IQR) were used to estimate the measure of location and variability.
The basic statistics for all the studied elements and pH values in the topsoils, and the background values and limits for grade II and III of the Chinese standard for soils (GB15618-1995) are summarized in Table 2. Compared with the GB15618-1995, the medians of the Cu and Cd concentration exceeded the limits of the GB15618-1995, grade II (in the case of Cd also grade III limit of standard). Limits of grade II were exceeded in As, Cd, Cu and Zn in numerous sampling sites. In addition, medians of these elements are much higher than those of the Yunnan natural background (YNB) [22,43]. The median concentrations of Cr, Hg, Ni and Pb are close to the Yunnan background value and deeply below both the standard limits (GB15618-1995).
The pH value of the samples varies between 7.17 and 8.28 and its mean is 7.97, which indicates the moderate alkalinity in nearly all soil samples. This is probably caused by a higher content of calcite and dolomite in the bedrocks, such as calcareous slates or dolomites.
The arsenic value in the samples oscillates between 9.59 and 141.51 μg/g; 48% of the soils show values higher than the limit of 25 μg/g appointed by GB15618-1995, grade II, 33% higher than the 40 μg/g limit for grade III of the standard; and 67% of the soils show a higher value of arsenic than YNB [22,43]. Arsenic maximum value in the samples was eight times over the YNB, six times over grade II limits and more than three times over the grade III limit.
The cadmium value in the analysed samples was relatively excessive and varies between 0.2 to 3.57 μg/g. Cadmium value in more than 71% of the soils was over the limit of 0.6 μg/g set by grade II, and 57% of the samples exceeded the grade III limit (1.0 μg/g) of the soil quality standard. Cadmium values in 86% of the soils were significantly above the YNB. The significantly increased arsenic and cadmium values in the soils can be related to their presence in the lattice of sulphide minerals [55,56]. The highest analysed values of Cd are six times higher than the limit for grade II, over 3.5 times higher than the limit for grade III set in the soil standard and over 16 times over the YNB.
The copper value in the samples varies from 45.38 to 2026 μg/g. Values of Cu in almost 86% of the soils are over the limit of grade II (100 μg/g) and 25% over the limits of grade III (400 μg/g) set in the soil standard. Almost 86% of the samples significantly exceeded YNB. The maximum Cu value in the analysed samples was 44 times above YNB, 20 times above the limit for grade II and five times above the limit for grade III set in GB15618-1995.
Zinc values in the soils vary between 55.8 and 484.9 μg/g. More than 10% of the soils surpass the limit of 300 μg/g established for grade II in soil standard, and more than 76% significantly surpass YNB. The highest concentration of Zn analysed in the soils was more than five times higher than the natural background value. The concentrations of Cr, Hg, Ni and Pb were quite low and did not exceed the limits of the national standard. Their values oscillated around YNB.
The concentrations of the main risk elements (Cd and Cu) from our study and similar results from other worldwide Cu smelting and mining localities with comparable soil properties are compared below. Cai et al. [57] presented a study from Daye, Hubei Province, China. The soils in this area contain similar amounts of organic matter (15–20 g/kg) and their pH is slightly acidic to slightly alkaline (6.5–7.5). Their results show a higher value of cadmium (29.58 μg/g) but considerably lower copper values (615.45 μg/g). In accordance with the study by Christou et al. [58], the values of both main risk elements in soils of Limni mining area, Cyprus, where soils contain a higher amount of clay particles (14–28%) and soil mean pH is moderately alkaline (7.9), show higher concentrations than the results in this study. The highest concentrations described in their study were 6.41 μg/g for Cd and 9653 μg/g for Cu. Zhou et al. [59] published concentrations of Cd from four localities in China, namely: Dexing, Jiangxi province; Yangjiazhangzhi, Liaoning province; Hongqiling, Jilin province; and Baiyin, Gansu province. The soils of Yangjiazhangzhi and Baiyin show properties comparable with soils around Dongchuan, moderate alkaline pH (7.91 and 8.21) and lower values of organic matter [59]. The peak Cd concentrations are significantly higher in Yangjiazhangzhi (22.8 μg/g) and Baiyin (94.0 μg/g).
The results of geostatistical modeling for monitored variables are in Figure 2. The highest values of As, Cu, Hg, Pb, and Zn and increased concentrations of Cd are found near Tangan Town, around sampling points 19, 20, and 21. In this part of the studied area, there are copper mines, three processing plants and a large tailing pond. Increased concentrations of these risk elements, except for Cd, spread into the surroundings predominantly westwards. The second peak of the concentration of Cu and Cd with increased values of As, Pb, and Zn is located around the sampling points 8 and 9 close to the other copper mine. Very interesting is the occurrence of high concentrations of Cd in the southeastern part of the area. There are no significant industrial sources of pollution in this part of the area. Here, the major source of Cd is probably intensive agricultural activity. As stated by Luo et al. [60], Cd is considered to be an element typical for agricultural activities because Cd is often found as an impurity in phosphatic fertilizers. Phosphatic fertilizers can also be the source of As contamination [61]. The concentrations of Cr and Ni have maximum values in the southwest part of the studied area. In contrast, the pH values are highest in the northeast.

3.2. Contamination and Environmental Risk Assessment

Based on the Cf values, the contaminations of soils are in the following order: Cu > Cd > Zn > As > Ni > Cr > Pb > Hg. According to the average values of the Cf, the area is highly contaminated by Cu and Cd. Results of this study show that the soils around Dongchuan (Figure 3a) are very highly contaminated by cadmium (43% of samples), copper (24% of samples) and arsenic (5% of samples). The soil samples are considerably contaminated by Cu (38%), Cd (24%), Zn (19%), As (14%) and Pb (5%). Values of Cf indicate low and moderate contamination for chromium, mercury and nickel in all sampling sites.
The order average Er can be expressed as follows: Cd >> Hg > Cu > As > Pb > Ni > Cr > Zn. Its values show a very high risk for Cd and, in contrast, low risk for all other analyzed elements (Figure 3b). Our results show that the ecological risk caused by cadmium is very high in 14% of sampling sites, high in 33% of sampling sites and considerable in 33% of sampling sites. The potential ecological risk induced by Cu is high in 5% of sampling sites and considerable in 14% sampling sites. In contrast, all samples indicate low or moderate risk for As and Hg and low risk for Cr, Ni, Pb and Zn.
The mCd values for soil sampling points range from 0.77 and 6.97 (Figure 4a). Average value of modified contamination degree is 2.8 and it indicates moderate contamination. Based on the mCd, the pollution in soil samples is considerable in 19% of the sampling points, moderate in 48%, slight in 14% and without pollution in 19%.
Nemerow comprehensive pollution index Pi can clearly express the level of pollution in the Dongchuan mining area, especially plotted in the map of the spatial distribution (Figure 4b). The Pi ranges from 1.3 to 31.3 in soils. The average Nemerow index indicates heavy pollution (Pi = 7.25). The Pi of the majority of sampling points indicates heavy pollution (71%). The other sampling points indicate moderate (14% samples) and slight pollution (14% samples).
The values of RI for soils from sampling points range from 77.98 to 598.19. The mean value of combined potential ecological risk index RI suggests that the soils around Dongchuan influenced by mining activity present a considerable ecological risk (RI = 293). Based on the categories described in Section 2.5, RI shows a very high risk in 24% sampling points, considerable risk in 38% sampling points, and moderate risk in 24% sampling points (Figure 4c). Only 14% of sampling points show a low risk.
The results of the trace element’s concentration analysis and considerably high ecological risk expressed by Er and mCd illustrate that the soils in Dongchuan mining area are seriously polluted mainly by Cd, Cu and As. Contamination by Cd represents a serious threat for the environment and human health, because Cd is considered to be one of the most toxic and carcinogenic trace elements. The results by Zhou et al. [59] from the Cu mining area show relatively high values of transfer factor and a significant positive correlation between Cd concentration in soils and crops. Liu et al. [62] assessed the bioavailability, bioaccessibility and transfer of trace elements in agroecosystem affected by Cu mining and smelting area in the Bayin district, China. Their results show a relatively high bioavailability of Cd using EDTA extraction (64.67%). They also stated that cumulative Cd concentration tended to increase over time. The results of Li et al. [7] from soils around Gejiu polymetallic deposit with slightly alkaline pH (7.6) and organic matter slightly higher than that in this study (61.31 g/kg) showed that the bioavailability of Cd, Pb, and As was high; the soil was polluted by Cd-Pb-As and imposed a great threat to vegetables. The bioavailability of risk elements was positively correlated with the total element concentrations in soil in their study. Exposure to the high concentrations of Cd through the food chain, drinking water or dust particles in the air can cause harmful changes in the liver, kidney, skeleton (osteomalacia, osteoporosis), or respiratory system [63]. Chronic Cd poisoning is typically manifested by neuralgia and ostealgia [64].

3.3. Correlation Analysis

Correlation analysis of the concentrations of observed parameters in topsoil samples around Dongchuan copper mining area (n = 21) was performed. Since most variables did not meet the assumption of normality and had many outliers, Spearman correlation coefficient (rs) was calculated. The correlation coefficient matrix for the monitored trace elements and pH is shown in Table 3.
A significant positive relationship (rs = 0.552 to 0.878; p < 0.01) was identified among Cd-Pb-Zn, Hg-Pb-Zn, and between As-Hg and Cu-Zn. Besides, a slightly weaker positive linear relationship (rs = 0.440 to 0.511; p < 0.05) was identified between Cd-Cu, As-Cu, As-Pb, As-Zn, Cu-Hg and between Cd-Hg. The positive linear dependence indicates that the main source of this group of inorganic pollutants is the mining of copper deposits and other related processes. The total concentrations of Cr were significantly positively correlated with Ni (rs = 0.547; p < 0.05). This dependence indicates the existence of a second group of inorganic pollutants (Cr a Ni) originating from a different source. On the other hand, the significant negative correlations between risk elements and pH were identified only in Ni (rs = −0.691; p < 0.01) and Cr (rs = −0.493; p < 0.05).

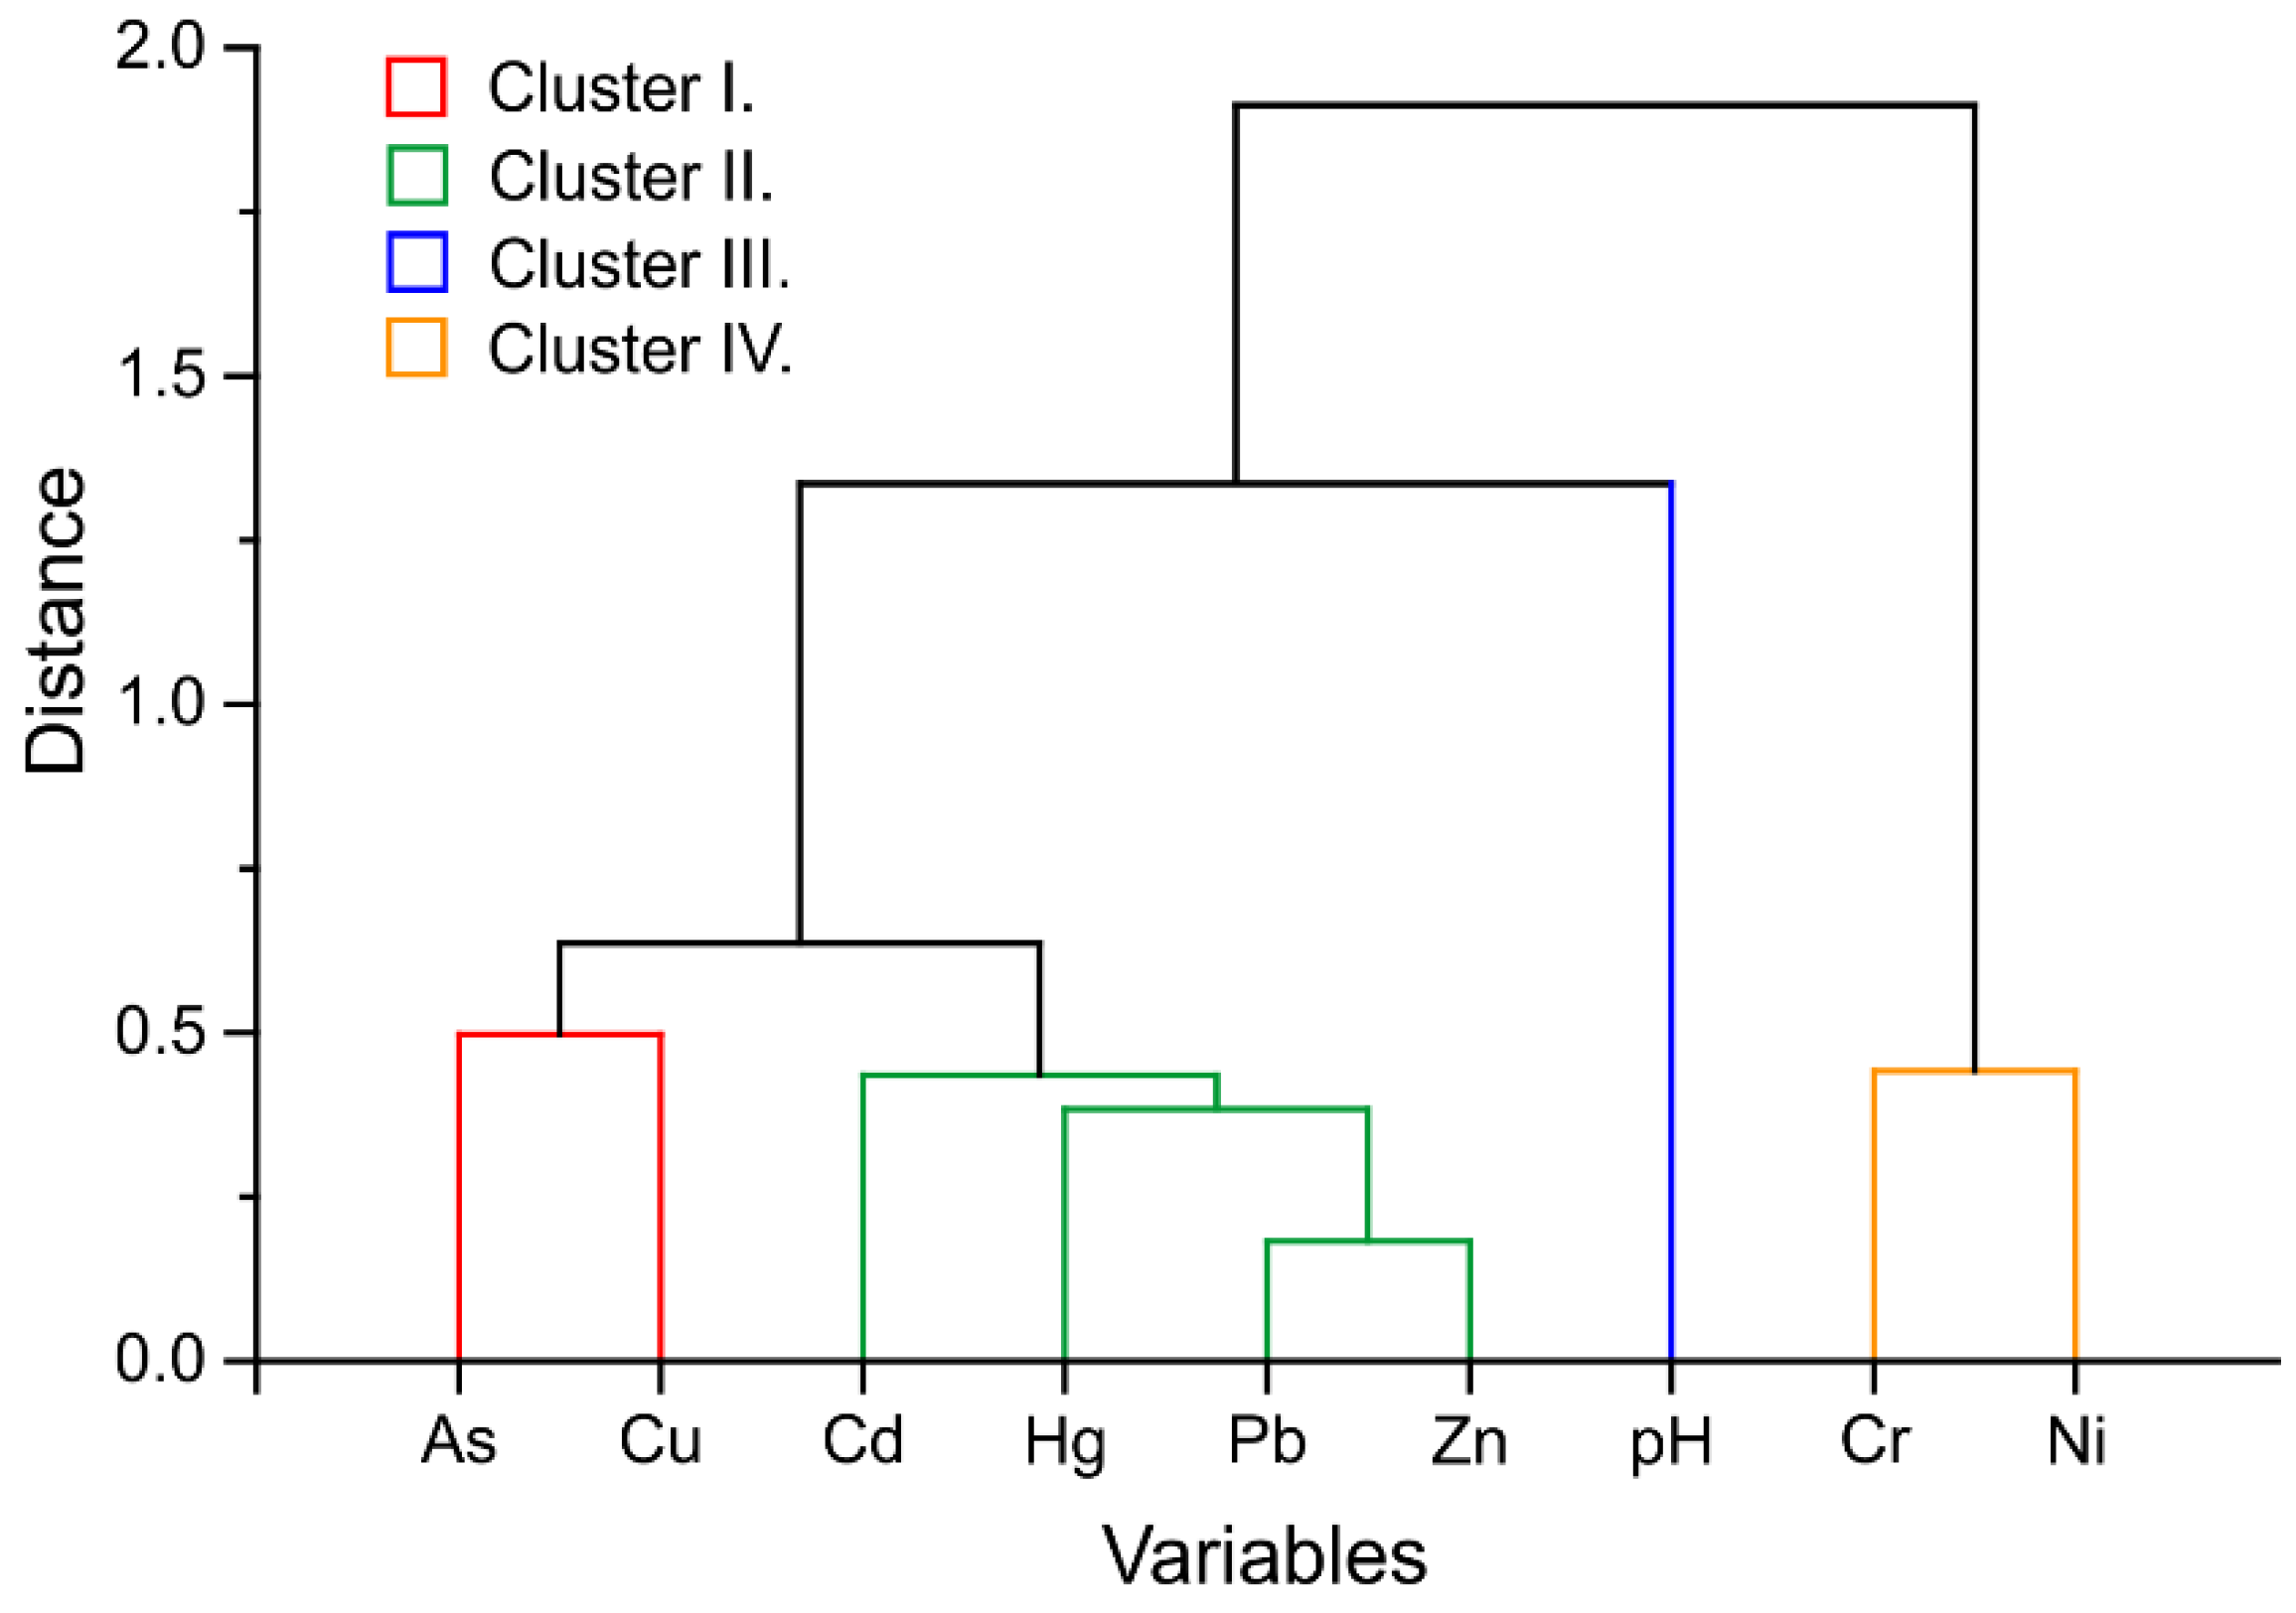
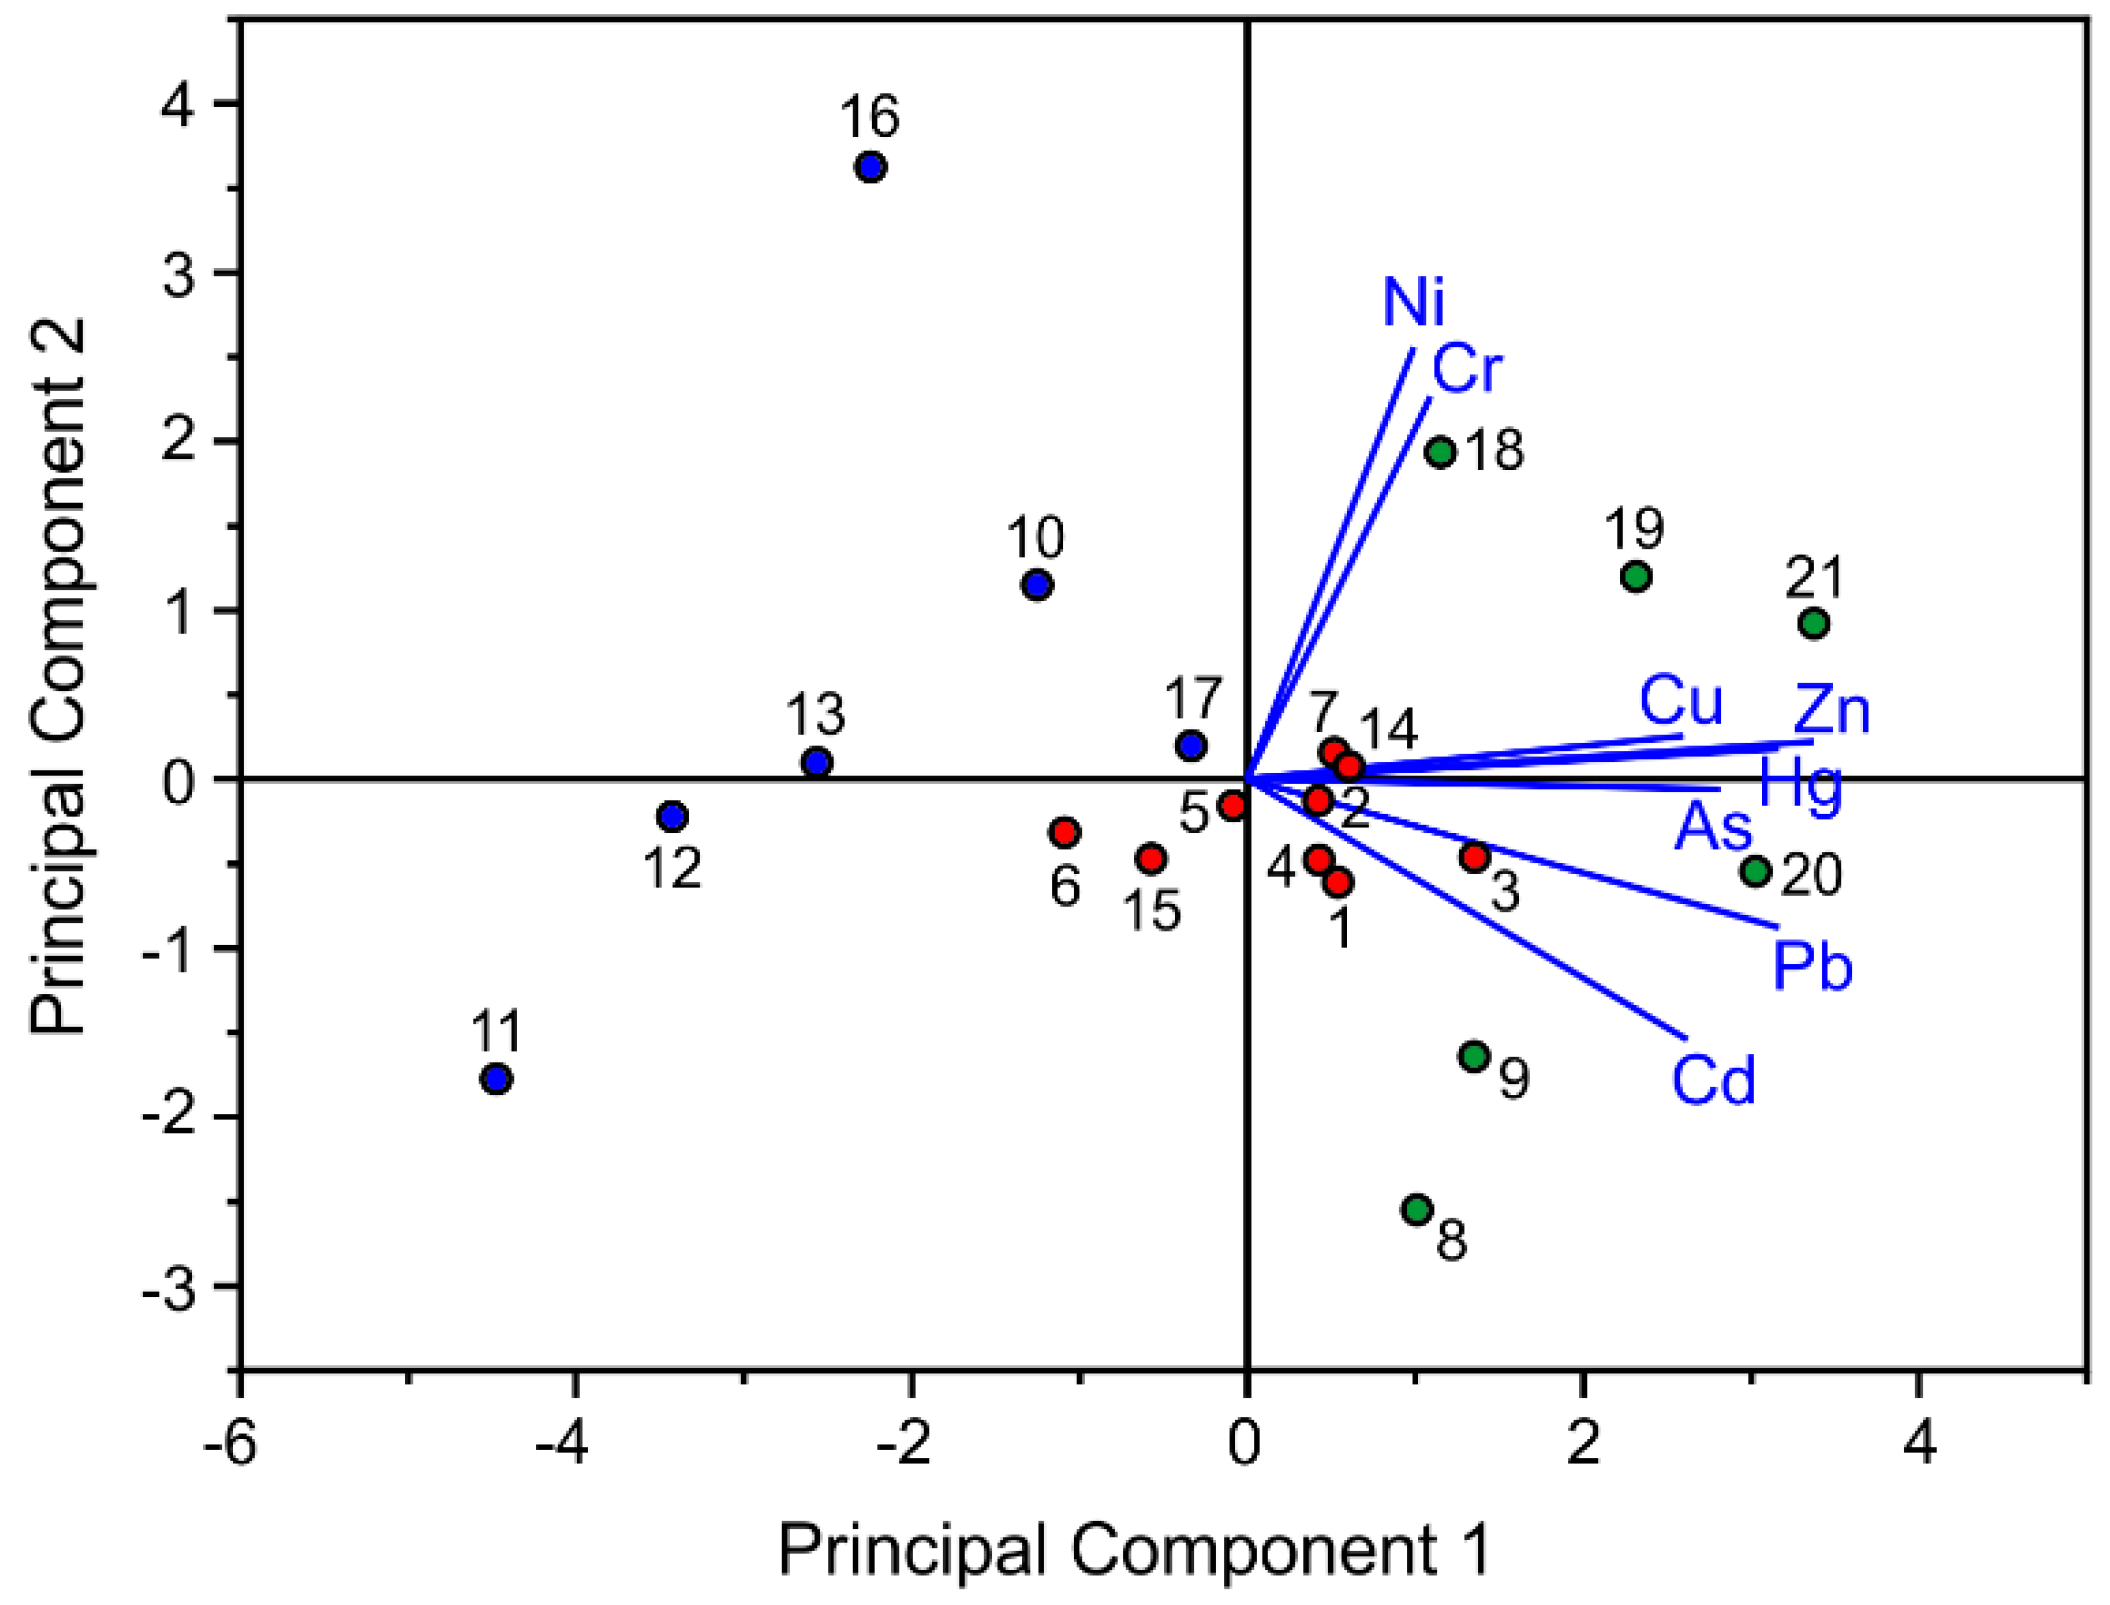
3.4. Multidimensional Statistical Analysis

After performing the cluster analysis (CA), three clusters of topsoil samples were obtained. The analysis results are shown as a dendrogram in Figure 5. The first cluster included topsoils taken primarily in the southeast part of the study area. This cluster was characterized by high values of all monitored parameters. In this part of the study area, there are many smelter factories, two large and many small tailing ponds.
The second cluster consisted of the topsoils with the highest content of Cu and As and higher contents of Cd, Hg, Pb and Zn. This group of topsoils was taken near the processing plants, in the mining areas and in their proximity. Their high values are related to the intensive mining and processing activities in this part of the study area. The results are consistent with the results of correlation analysis and spatial distribution of Cu, As, Cd, Hg, Pb and Zn (Figure 2a,b,d,e,g,h).
The third cluster included topsoils collected primarily in the marginal parts of the area. This cluster is characterized by moderately elevated values of Ni and Cr and low values of Cd, Hg, Pb, Zn, As, and Cu. The concentrations of these risk elements vary slightly. They are lower or comparable with the limits for grade II of the soil standard. This indicates that Ni and Cr originated mainly from lithogenic sources. This assumption is confirmed by the results of the Spearman’s correlation analysis.
CA results for monitored parameters in agricultural soils in the form of a dendrogram are in Figure 6. The dendrogram shows four clusters: (1) includes As and Cu; (2) includes Cd, Hg, Pb and Zn; (3) includes only pH; (4) includes Cr and Ni.
Based on the above mentioned, the results suggest that the main sources of As, Cu, Cd, Hg, Pb and Zn are intensive mining and processing activities. The distribution of these risk elements into two clusters is caused by the type of Dongchuan deposits containing primarily Cu sulfides, such as bornite, chalkocite and chalcopyrite, and Cu-As sulfide–enargite. Cd, Hg, Pb and Zn are present on the deposit in minor amounts. Variables in the third and fourth clusters differ significantly, which is consistent with the results of the correlation analysis. As mentioned above, Cr and Ni are released from natural sources.
Comparable results were obtained from PCA. A total of two significant principal components were extracted after performing PCA. The first principal component (PC1) and second principal component (PC2) accounted for 49.84% and 21.55% of the total variance, respectively, and the two components could explain 71.38% of the total variance. PCA results are shown as a biplot, where PC1 vs. PC2 are represented, in Figure 7.
In the biplot, three groups of soil samples can be easily identified. The soil samples are grouped very similarly to the dendrogram (Figure 5). The first group is located in the negative part of PC1 and consists of samples 10–13, and 16 with the lowest concentrations of all trace elements. The second group of samples 1–7, 14, 15, and 17 is distributed around the center. These soil samples are characterized by higher concentrations of all monitored elements, especially by Cd, Pb, As, Hg, Zn and Cu. With regard to grouping of sample 17, the PCA results differ from the CA results. The results of the PCA clearly show that the sampling point 17 is slightly influenced by the mining and processing activities in its vicinity. The third group is located in the positive part of PC1 and consists of samples 8, 9, and 18–21 with the highest concentrations of monitored elements. PC1 was loaded Cd, Pb, As, Hg, Zn and Cu, and PC1 can be defined as the mining and processing factor. PC2 is in its positive part primarily comprised of elemental association Cr-Ni. This is consistent with the results of the correlation analysis, spatial distribution (Figure 2c,f,i) and CA. The main sources of Cr and Ni are probably lateritic soils within the study area. As stated by Schwertmann and Pfab [65], de Oliveira et al. [66], and Johnston and Chrysochoou [67], Cr and Ni in laterites are associated with goethite and hematite. It is clear that PC2 can be labelled as a lithogenic factor.

4. Conclusions

The agricultural soils around Dongchuan copper mining area contain extremely high concentrations of As, Cd and Cu. Compared with the GB15618-1995, concentrations of As, Cd, and Cu exceeded the limits of grade III in 38%, 57%, and 24% of samples. The limits of grade II were exceeded in As, Cd, Cu, Ni, and Zn. The pH value of the samples varied between 7.17 and 8.28, which indicates the moderate alkalinity in nearly all the soil samples. The results of this study and considerably high ecological risk expressed by Er and mCd suggested that the soils in Dongchuan mining area are seriously polluted mainly by Cd, particularly by Cu and As. The contamination by Cd represents a serious threat to the environment and human health, because Cd is considered one of the most toxic and carcinogenic heavy metals. The geostatistical models imply that the highest concentrations of As, Cu, Hg, Pb, Zn, and Cd are located near Tangan Town. Here the main sources of pollution are copper mines, three processing plants, and a large tailing pond. The second peak of Cd values was identified in the southeastern part of the monitored area, where agricultural activity is probably the main source of this pollutant. The correlation analysis, cluster analysis, and principal component analysis proved that the main source of As, Cu, Cd, Hg, Pb and Zn is of an anthropogenic origin, such as intensive mining and processing activities. Cr and Ni are released from natural sources, namely the lateritic soils within the study area.
The contamination of the soils by Cd in the area is alarming and such a situation requires immediate and effective measures to prevent further pollution of the ecoagrosystem. Firstly, the best practice and cleaner production should be implemented in mining and smelting activities to decrease emissions of the risk elements in wastewater, gases and solids into the environment. Secondly, the amount of waste material emitted by mines and smelters in the area should be monitored periodically and the environmental laws and regulations should be complied with strictly. Thirdly, the fertilizers used in the farmlands should be tested and chosen with respect to the risk elements content to avoid further accumulation of Cd and As in the soils. Finally, the risk elements in local farmers’ products need to be detected before they enter the market.
Further research should focus on the following issues: (1) Assessment and monitoring of the risk element’s contamination of the air-borne dust, stream waters and sediments; (2) assessment of bioavailability, bioaccumulation and transfer of risk elements in the ecosystem; and (3) characterization of the mineralogy, fractionation and reactivity of metals in the environment.

Author Contributions

X.C., T.D. and W.Q. conceived and designed the experiments. Q.H., L.Z., S.Y., X.Z. and Y.X. sampled and performed the experiments. X.C., T.D. and J.D. analyzed the data and wrote the paper. W.Q. and Q.H. revised the draft manuscript. All authors read and approved the final manuscript.

Funding

This research was funded by Department of Land Resources of Yunnan Province of China grant number Yun 50 Land Resources Scientific 2013-1; Ministry of Education, Youth and Sport of the Czech Republic grant number LO1404. The APC was funded by Yunnan Land and Resources Vocational College, Kunming.

Acknowledgments

Financial support from the Department of Land Resources of Yunnan Province of China (Grant No. Yun 50 Land Resources Scientific 2013-1) is gratefully acknowledged. We are particularly grateful to Dongchuan District Land Resources Bureau and Yunnan Jinsha Mining CO., LTD. for the help with field work. This paper was prepared within the framework of the project LO1404: Sustainable development of ENET Centre.

Conflicts of Interest

The authors declare no conflict of interest. The funders had no role in the design of the study; in the collection, analyses, or interpretation of data; in the writing of the manuscript, or in the decision to publish the results.

References

  1. Bech, J.; Poschenrieder, C.; Llugany, M.; Barceló, J.; Tume, P.; Tobias, F.J.; Barranzuela, J.L.; Vásquez, E.R. Arsenic and heavy metal contamination of soil and vegetation around a copper mine in Northern Peru. Sci. Total Environ. 1997, 203, 83–91. [Google Scholar] [CrossRef]
  2. Zheng, N.; Wang, Q.; Zheng, D. Health risk of Hg, Pb, Cd, Zn, and Cu to the inhabitants around Huludao Zinc Plant in China via consumption of vegetables. Sci. Total Environ. 2007, 383, 81–89. [Google Scholar] [CrossRef] [PubMed]
  3. Lim, H.S.; Lee, J.S.; Chon, H.T.; Sager, M. Heavy metal contamination and health risk assessment in the vicinity of the abandoned Songcheon Au–Ag mine in Korea. J. Geochem. Explor. 2008, 96, 223–230. [Google Scholar] [CrossRef]
  4. Li, Z.; Ma, Z.; Van der Kuijp, T.J.; Yuan, Z.; Huang, L. A review of soil heavy metal pollution from mines in China: Pollution and health risk assessment. Sci. Total Environ. 2014, 468–469, 843–853. [Google Scholar] [CrossRef] [PubMed]
  5. Cai, L.M.; Xu, Z.C.; Qi, J.Y.; Feng, Z.Z.; Xiang, T.S. Assessment of exposure to heavy metals and health risks among residents near Tonglushan mine in Hubei, China. Chemosphere 2015, 127, 127–135. [Google Scholar] [CrossRef] [PubMed]
  6. Liu, X.; Song, Q.; Tang, Y.; Li, W.; Xu, J.; Wu, J.; Wang, F.; Brookes, P.C. Human health risk assessment of heavy metals in soil–vegetable system: A multi-medium analysis. Sci. Total Environ. 2013, 463–464, 530–540. [Google Scholar] [CrossRef] [PubMed]
  7. Li, Y.; Wang, H.; Wang, H.; Yin, F.; Yang, X.; Hu, Y. Heavy metal pollution in vegetables grown in the vicinity of a multi-metal mining area in Gejiu, China: Total concentrations, speciation analysis, and health risk. Environ. Sci. Pollut. Res. 2014, 21, 12569–12582. [Google Scholar] [CrossRef] [PubMed]
  8. Levis, R.C.; Meeker, J.D. Biomarkers of exposure to molybdenum and other metals in relation to testosterone among men from the United States National Health and Nutrition Examination Survey 2011–2012. Fertil. Steril. 2015, 103, 172–178. [Google Scholar] [CrossRef] [Green Version]
  9. Wang, Z.; Hong, C.; Xing, Y.; Wang, K.; Li, Y.; Feng, L.; Ma, S. Spatial distribution and sources of heavy metals in natural pasture soil around copper-molybdenum mine in Northeast China. Ecotoxicol. Environ. Saf. 2018, 154, 329–336. [Google Scholar] [CrossRef] [PubMed]
  10. Huichu, R.; Renmin, H.; Cox, D.P. Copper deposition by fluid mixing in deformed strata adjacent to a salt diapir, Dongchuan area, Yunnan Province, China. Econ. Geol. 1991, 86, 1539–1545. [Google Scholar] [CrossRef]
  11. Tepanoszan, G.; Sahakyan, L.; Belyaeva, O.; Asmaryan, S.; Saghatelyan, A. Continuous impact of mining activities on soil heavy metals levels and human health. Sci. Total Environ. 2018, 639, 900–909. [Google Scholar] [CrossRef] [PubMed]
  12. Avkopashvili, G.; Avkopashvili, M.; Gongadze, A.; Tsulukidze, M.; Shengelia, E. Determination of Cu, Zn and Cd in Soil, Water and Food Products in the Vicinity of RMG Gold and Copper mine, Kazreti, Georgia. Ann. Agrar. Sci. 2017, 15, 269–272. [Google Scholar] [CrossRef]
  13. Schalscha, B.E.; Ahumada, T.I. Heavz metals in rivers and soils of central Chile. Water Sci. Technol. 1998, 37, 251–255. [Google Scholar] [CrossRef]
  14. Marrugo-Negrete, J.; Pinedo-Hernández, J.; Díez, S. Assessment of heavy metal pollution, spatial distribution and origin in agricultural soils along the Sinú River Basin, Colombia. Environ. Res. 2017, 154, 380–388. [Google Scholar] [CrossRef] [PubMed]
  15. Azhari, A.E.; Rhoujjati, A.; Hachimi, M.L.E.; Ambrosi, J.-P. Pollution and ecological risk assessment of heavy metals in the soil-plant system and the sediment/water column around a former Pb/Zn-mining area in NE Morocco. Ecotoxicol. Environ. Saf. 2017, 144, 464–474. [Google Scholar] [CrossRef] [PubMed]
  16. Boussen, S.; Soubrand, M.; Bril, H.; Ouerfelli, K.; Abdeljaouad, S. Transfer of lead, zinc and cadmium from mine tailings to wheat (Triticum aestivum) in carbonated Mediterranean (Northern Tunisia) soils. Geoderma 2013, 192, 227–236. [Google Scholar] [CrossRef]
  17. Ávila, P.F.; da Silva, E.F.; Candeias, C. Health risk assessment through consumption of vegetables rich in heavy metals: The case study of the surrounding villages from Panasqueira mine, Central Portugal. Environ. Geochem. Health 2017, 39, 565–589. [Google Scholar] [CrossRef] [PubMed]
  18. Obiora, S.C.; Chukwu, A.; Davies, T.C. Heavy metals and health risk assessment of arable soils and food crops around Pb–Zn mining localities in Enyigba, southeastern Nigeria. J. Afr. Earth Sci. 2016, 116, 182–189. [Google Scholar] [CrossRef]
  19. Huang, Y.; Chen, X.; Zheng, L.; Wu, D.; Ji, S. Analysis of copper and cadmium amount in the vegetables in Tangdan and Luoxue. J. Dali Univ. 2009, 8, 14–15. [Google Scholar]
  20. Huang, Q.-R.; Yang, S.-R.; Cheng, X.-F.; Zhang, X.-Q. Heavy metal pollution characteristics and prevention advice of Xiaojiang River drainage area in Dongchuan, Yunnan. Yunnan Geol. 2017, 1, 134–140. [Google Scholar]
  21. Zou, L.-L.; Yang, J.-Q.; Cheng, X.-F.; Wang, W.-F.; Huang, Q.-R.; Zhang, X.-Q. Investigation of Farmland Soil and Chinese Cabbage Heavy Metal Pollution along Banks of Xiaojiang in Dongchuan, Yunnan Province. Southwest China J. Agric. Sci. 2018, 31, 754–758. [Google Scholar]
  22. Bai, J.; Cui, B.; Wang, Q.; Gao, H.; Ding, Q. Assessment of heavy metal contamination of roadside soils in Southwest China. Stoch. Environ. Res. Risk Assess. 2009, 23, 341–347. [Google Scholar] [CrossRef]
  23. Yang, Y.; Li, S.; Bi, X.; Wu, P.; Liu, T.; Li, F.; Liu, C. Lead, Zn, and Cd in slags, stream sediments, and soils in an abandoned Zn smelting region, southwest of China, and Pb and S isotopes as source tracers. J. Soils Sediments 2010, 10, 1527–1539. [Google Scholar] [CrossRef]
  24. Wang, Q.; Feng, Y.M.; Wang, S.M.; Du, Y.Q.; Yin, J.Z.; Yang, Y.L. Assessment of the cadmium exposure in the blood, diet, and water of the Pumi people in Yunnan, China. Biol. Trace Elem. Res. 2015, 168, 349–355. [Google Scholar] [CrossRef] [PubMed]
  25. Nunes, J.M.R.; Bonito, A.; Loures, L.; Gama, J.; López-Pñeiro, A.; Peña, D.; Albarrán, A. Effects of the European Union Agricultural and Environmental Policies in the Sustainability of Most Common Mediterranean Soils. Sustainability 2017, 9, 1404. [Google Scholar] [CrossRef]
  26. Ma, L.; Sun, J.; Yang, Z.; Wang, L. Heavy metal contamination of agricultural soils affected by mining activities around Ganxi River in Chenzou, Southern China. Environ. Monit. Assess. 2015, 187, 731. [Google Scholar] [CrossRef] [PubMed]
  27. Nunes, J.R.; Ramos-Miras, J.; López-Pñeiro, A.; Loures, L.; Gil, C.; Coelho, J.; Loures, A. Concentrations of Available Heavy Metals in Mediterranean Agricultural Soils and their Relation with Some Soil Selected Properties: A Case Study in Typical Mediterranean Soils. Sustainability 2014, 6, 9124–9138. [Google Scholar] [CrossRef] [Green Version]
  28. Hlavsová, A.; Corsaro, A.; Raclavská, H.; Vallová, S.; Juchelková, D. The effect of feedstock composition and taxonomy on the products distribution from pyrolysis of nine herbaceous plants. Fuel Process. Technol. 2016, 144, 27–36. [Google Scholar] [CrossRef]
  29. Tian, K.; Huang, B.; Xing, Z.; Hu, W. Geochemical baseline establishment and ecological risk evaluation of heavy metals in greenhouse soils from Dongtai, China. Ecol. Indic. 2017, 72, 510–520. [Google Scholar] [CrossRef]
  30. Tang, J.; Chai, L.; Li, H.; Yang, Z.; Yang, W. A 10-Year Statistical Analysis of Heavy Metals in River and Sediment in Hengyang Segment, Xiangjiang River Basin, China. Sustainability 2018, 10, 1057. [Google Scholar] [CrossRef]
  31. Zhao, X.-F.; Zhou, M.-F.; Li, J.-W.; Sun, M.; Gao, J.-F.; Sun, W.-H.; Yang, J.-H. Late Paleoproterozoic to early Mesoproterozoic Dongchuan Group in Yunnan, SW China: Implications for tectonic evolution of the Yangtze Block. Precambrian Res. 2010, 182, 57–69. [Google Scholar] [CrossRef]
  32. Bureau of Dongchuan Copper Mine. The History Records of Dongchuan Copper Mine; Yunnan Nationalities Publishing House: Kunming, China, 1990.
  33. Wang, Y.; Tian, B.; Liu, S. Close relationship between the frangibility of mountain eco-environment and mountain disasters: A case study of Dongchuan, Kunming in Yunnan Province. Wuhan Univ. J. Nat. Sci. 2007, 12, 721–728. [Google Scholar] [CrossRef]
  34. Shi, Y. Ecological Environment and its Sustainable Development of Xiaojiang Valley. Yunnan Environ. 2000, 19, 41–43. [Google Scholar]
  35. Cheng, Y.Q. Preliminary study on atmospheric boundary layer characteristics in Dongchuan Region. Yunnan Environ. Sci. 1990, 2, 20–22. [Google Scholar]
  36. Zhang, S.; Wang, D.; Mei, Y.; Chang, S.; Wang, H. Effects of Land Use Types on Soil Properties in a Small Watershed of Debris Flow Activity Region. J. Soil Water Conserv. 2015, 29, 258–262. [Google Scholar] [CrossRef]
  37. Li, J. Interrelation Study of Soil Water and Thermal Parameters in Heavy Metal Contaminated Area. Master’s Thesis, Kunming University of Science and Technology, Kunming, China, 2017. [Google Scholar]
  38. An, C.H. Analysis of acid rain characteristics and control measures in Dongchuan. Archit. Eng. Technol. Des. 2014, 11, 626–628. [Google Scholar]
  39. Loring, D.H.; Rantala, R.T.T. Manual for the geochemical analyses of marine sediments and suspended particulate matter. Earth Sci. Rev. 1992, 32, 235–283. [Google Scholar] [CrossRef]
  40. Matschullat, J.; Ottenstein, R.; Reimann, C. Geochemical background—Can we calculate it? Environ. Geol. 2000, 39, 990–1000. [Google Scholar] [CrossRef]
  41. Nakić, Z.; Posavec, K.; Bačani, A. A visual basic spreadsheet macro for geochemical background analysis. GroundWater 2007, 45, 642–647. [Google Scholar] [CrossRef] [PubMed]
  42. Håkanson, L. An ecological risk index for aquatic pollution control. A sedimentological approach. Water Res. 1980, 14, 975–1001. [Google Scholar] [CrossRef]
  43. Zhong, T.; Chen, D.; Zhang, X. Identification of potential sources of mercury (Hg) in farmland soil using a decision tree method in China. Int. J. Environ. Res. Public Health 2016, 13, 1111. [Google Scholar] [CrossRef] [PubMed]
  44. Abrahim, G.M.S. Holocene sediments of Tamaki Estuary: Characterization and impact of recent human activity on an urban estuary in Auckland. Ph.D. Thesis, University of Auckland, Auckland, New Zealand, 2005. [Google Scholar]
  45. Brady, J.P.; Ayoko, G.A.; Martens, W.N.; Goonetilleke, A. Development of a hybrid pollution index for heavy metals in marine and estuarine sediments. Environ. Monit. Assess. 2015, 187, 306. [Google Scholar] [CrossRef] [PubMed] [Green Version]
  46. Li, W.X.; Zhang, X.X.; Wu, B.; Sun, S.L.; Chen, Y.S.; Pan, W.Y.; Zhao, D.Y.; Cheng, S.P. A comparative analysis of environmental quality assessment methods for heavy metal-contaminated soils. Pedosphere 2008, 18, 344–352. [Google Scholar] [CrossRef]
  47. Hong-Gui, D.; Teng-Feng, G.; Ming-Hui, L.; Xu, D. Comprehensive assessment model on heavy metal pollution in soil. Int. J. Electrochem. Sci. 2012, 7, 5286–5296. [Google Scholar]
  48. Li, J.G.; Pu, L.J.; Liao, Q.L.; Zhu, M.; Dai, X.Q.; Xu, Y.; Zhang, L.F.; Hua, M.; Jin, Y. How anthropogenic activities affect soil heavy metal concentration on a broad scale: A geochemistry survey in Yangtze River Delta, Eastern China. Environ. Earth Sci. 2015, 73, 1823–1835. [Google Scholar] [CrossRef]
  49. Cheng, X.; Danek, T.; Drozdova, J.; Huang, Q.; Qi, W.; Zou, L.; Yang, S.; Zhao, X.; Xiang, Y. Soil heavy metal pollution and risk assessment associated with the Zn-Pb mining region in Yunnan, Southwest China. Environ. Monit. Assess. 2018, 190, 194. [Google Scholar] [CrossRef] [PubMed]
  50. Singovszka, E.; Balintova, M.; Holub, M. Heavy metal contamination and its indexing approach for sediment in Smolnik creek (Slovakia). Clean Technol. Environ. Policy 2016, 18, 305–313. [Google Scholar] [CrossRef]
  51. Cheng, X.; Qi, W.; Danek, T.; Matysek, D.; Huang, Q.; Zhao, X.; Zhou, Z.; Fang, R.; Zou, L.; Xu, J. Heavy metal contamination of surface water and groundwater in and around Gejiu Tin Mine, Southwest China. Inżynieria Mineralna 2016, 17, 93–98. [Google Scholar]
  52. Zhang, J.; Deng, H.; Wang, D.; Chen, Z.; Xu, S. Toxic heavy metal contamination and risk assessment of street dust in small towns of Shanghai suburban area, China. Environ. Sci. Pollut. Res. 2013, 20, 323–332. [Google Scholar] [CrossRef] [PubMed]
  53. Wu, Q.; Leung, J.Y.S.; Geng, X.; Chen, S.; Huang, X.; Li, H.; Huang, Z.; Zhu, L.; Chen, J.; Lu, Y. Heavy metal contamination of soil and water in the vicinity of an abandoned e-waste recycling site: Implications for dissemination of heavy metals. Sci. Total Environ. 2015, 506–507, 217–225. [Google Scholar] [CrossRef] [PubMed]
  54. Lin, Q.; Liu, E.; Zhang, E.; Li, K.; Shen, J. Spatial distribution, contamination and ecological risk assessment of heavy metals in surface sediments of Erhai Lake, a large eutrophic plateau lake in southwest China. CATENA 2016, 145, 193–203. [Google Scholar] [CrossRef]
  55. Li, H.; Xiao, T.F.; Shuang, Y.; He, L.B.; Ning, Z.P.; Li, D.H.; Zhu, C.S. Geochemical distribution and environmental quality of cadmium in river sediment around the Jinding Pb-Zn mine area in Yunnan. Environ. Sci. 2008, 29, 2894–2898. [Google Scholar]
  56. Li, R.P.; Wang, A.J.; Cao, D.H.; Gao, L.; Geng, N.; Zhao, Y.X.; Zou, W.L.; Xiu, Q.Y. Research on the distribution characteristics of Zn, Cd in the soil of Jinding Pb-Zn deposit, Lanping County. Geol. Rev. 2009, 55, 126–133. [Google Scholar]
  57. Cai, L.-M.; Wang, Q.-S.; Luo, J.; Chen, L.-G.; Zhu, R.-L.; Wang, S.; Tang, C.-H. Heavy metal contamination and health risk assessment for children near a large Cu-smelter in central China. Sci. Total Environ. 2019, 650, 725–733. [Google Scholar] [CrossRef] [PubMed]
  58. Christou, A.; Theologides, C.P.; Costa, C.; Kalavrouziotis, I.K.; Varnavas, S.P. Assessment of toxic heavy metals concentrations in soils and wild and cultivated plant species in Limni abandoned cooper mining site, Cyprus. J. Geochem. Explor. 2017, 178, 16–22. [Google Scholar] [CrossRef]
  59. Zhou, Z.; Chen, Z.; Pan, H.; Sun, B.; Zheng, D.; He, L.; Yang, R.; Zhou, G. Cadmium contamination in soils and crops in four mining areas, China. J. Geochem. Explor. 2018, 192, 72–84. [Google Scholar] [CrossRef]
  60. Luo, L.; Ma, Y.; Zhang, S.; Wei, D.; Zhu, Y.-G. An inventory of trace element inputs to agricultural soils in China. J. Environ. Manag. 2009, 90, 2524–2530. [Google Scholar] [CrossRef] [PubMed] [Green Version]
  61. Hartley, T.N.; MacDonald, A.J.; McGrath, S.P.; Zhao, F.-J. Historical arsenic contamination of soil due to long-term phosphate fertiliser applications. Environ. Pollut. 2013, 180, 259–264. [Google Scholar] [CrossRef] [PubMed]
  62. Liu, B.; Ai, S.; Zhang, W.; Hunang, D.; Zhang, Y. Assessment of the bioavailability, bioaccessibility and transfer of heavy metals in the soil-grain-human systems near a mining and smelting area in NW China. Sci. Total Environ. 2017, 609, 822–829. [Google Scholar] [CrossRef] [PubMed]
  63. Huang, M.; Choi, S.J.; Kim, D.-W.; Kim, N.Y.; Bae, H.-S.; Yu, S.D.; Kim, D.-S.; Kim, H.; Choi, B.-S.; Yu, I.-J.; et al. Evaluation of factors associated with cadmium exposure and kidney function in the general population. Environ. Toxicol. 2013, 28, 563–570. [Google Scholar] [CrossRef] [PubMed]
  64. Purello-D’Ambrosio, F.; Ganemi, S.; Minciullo, P.; Ricciardi, L.; Merendino, R.A. Burning mouth syndrome due to cadmium in a denature wearer. J. Investig. Allergol. Clin. Immunol. 2000, 10, 105–106. [Google Scholar] [PubMed]
  65. Schwertmann, U.; Pfab, G. Structural vanadium and chromium in lateritic iron oxides: Genetic implications. Geochim. Cosmochim. Acta 1996, 60, 4279–4283. [Google Scholar] [CrossRef]
  66. Oliveira, S.M.B.; de Moya Partiti, C.S.; Enzweiler, J. Ochreous laterite: A nickel ore from Punta Gorda, Cuba. J. S. Am. Earth Sci. 2001, 14, 307–317. [Google Scholar] [CrossRef]
  67. Johnston, C.P.; Chrysochoou, M. Mechanisms of chromate adsorption on hematite. Geochim. Cosmochim. Acta 2014, 138, 146–157. [Google Scholar] [CrossRef]
Figure 1. Locations of the study area and sampling points in the Dongchuan mining area.
Sustainability 10 04533 g001
Figure 2. Geostatistical maps of monitored variables in agricultural soils from Dongchuan copper mining area. (a) As; (b) Cd; (c) Cr; (d) Cu; (e) Hg; (f) Ni; (g) Pb; (h) Zn; and (i) pH.
Sustainability 10 04533 g002
Figure 3. Charts of: (a) the contamination factor; (b) the potential ecological risk index.
Sustainability 10 04533 g003
Figure 4. Spatial maps of: (a) modified contamination degree; (b) Nemerow comprehensive pollution index; (c) potential ecological risk index.
Sustainability 10 04533 g004
Figure 5. Dendrogram obtained by CA for sampling points.
Sustainability 10 04533 g005
Figure 6. Dendrogram obtained by CA for variables.
Sustainability 10 04533 g006
Figure 7. Biplot of sampling points and variables for PC1 vs. PC2.
Sustainability 10 04533 g007
Table 1. Analytical methods used for soils.
ElementsMethodsInstrument ModelDetection Limit
CrICP-MSiCAP Q (Thermo Fisher Scientific, Suzhou, China)0.82 mg/kg
CdICP-MSiCAP Q (Thermo Fisher Scientific, Suzhou, China)0.015 mg/kg
PbICP-MSiCAP Q (Thermo Fisher Scientific, Suzhou, China)0.96 mg/kg
Total AsAFSAFS 3100 (Beijing Haiguang Instr. Co., Ltd, Beijing, China)0.27 mg/kg
Total HgCV-AFSXGY-1011 (Institute of geophysical and geochemical exploration CAGS, Beijing, China)0.0004 mg/kg
CuICP-MSiCAP Q (Thermo Fisher Scientific, Suzhou, China)0.89 mg/kg
ZnICP-MSiCAP Q (Thermo Fisher Scientific, Suzhou, China)2.15 mg/kg
NiICP-MSiCAP Q (Thermo Fisher Scientific, Suzhou, China)0.44 mg/kg
Table 2. The basic statistics for studied elements (µg/g) and the pH in the topsoils around the Dongchuan copper mining area.
SoilAsCdCrCuHgNiPbZnpH
Range (min–max)9.59–141.510.20–3.5751.97–105.2045.38–2026.000.02–0.2324.06–95.876.83–146.6055.80–484.907.17–8.28
Median24.361.0573.38152.700.1244.9842.23203.308.05
IQR28.421.3817.85162.900.0613.4829.4895.700.21
Over-limit ratio (%) 14871086019010-
Over-limit ratio (%) 238570240000-
Background value28.591.1273.08127.170.1242.1536.67184.838.04
Threshold value60.122.5596.37230.560.2360.5774.23315.36<7.71; >8.37
Background value in Yunnan Province 318.400.2265.2046.300.12 *42.5040.6089.70-
Chinese standard for grade II soil 4250.60250.00100.001.0060.00350.00300.00-
Chinese standard for grade III soil 5401.00300.00400.001.50200.00500.00500.00-
1 Compared to Grade II; 2 Compared to Grade III; 3 The background value of the soil environment in Yunnan Province—Bai et al. [22]; * Zhong et al. [43]; 4 National Environmental Protection Agency of China, 1995 (GB15618-1995). Grade II refers to vegetable soils; 5 Grade III refers to soil from woodland, arable land in the vicinity of mines, and districts with high background values.
Table 3. Correlation coefficient matrix for monitored variables in the topsoil samples.
AsCdCrCuHgNiPbZnpH
As1
Cd0.4141
Cr−0.009−0.0581
Cu0.511 *0.456 *0.1911
Hg0.581 **0.440 *0.3430.465 *1
Ni0.356−0.1360.547 *0.3070.3101
Pb0.508 *0.606 **0.1900.3280.614 **0.0311
Zn0.505 *0.603 **0.2900.552 **0.553 **0.1050.878 **1
pH−0.0720.146−0.493 *−0.309−0.112−0.691 **−0.224−0.2781
* p < 0.05; ** p < 0.01.

