Assessing Heavy Industrial Heat Source Distribution in China Using Real-Time VIIRS Active Fire/Hotspot Data


Abstract
1. Introduction
2. Dataset
2.1. Study Area
2.2. Data Sources
2.2.1. VIIRS Active Fire/Hotspot Data
2.2.2. Auxiliary Data
3. Heavy Industrial Heat Source Detection Model Using Real-Time VIIRS Active Fire/Hotspot Data Based on an Improved Adaptive K-means Algorithm
3.1. Data Preprocessing
3.2. Heat Source Object Detection Model Using Real-Time VIIRS Active Fire/Hotspot Data
3.2.1 Segmentation of Long-Term Time-Series Fire Hotspots
3.2.2. Combination of Heat Source Objects Based on Their Topology Association
3.3. Heavy Industrial Heat Source Identification
- (1)
- The days between the start of the fire hotspot and final date in one heat source object was greater than 90.
- (2)
- The number of fire hotspots in one heat source object was greater than nine.
- (3)
- The fire hotspot density per square kilometer in one heat source object was greater than 50.
- (1)
- The number of fire hotspots in one heat source object divided by its working period must be greater than 30.
- (2)
- The fire hotspot density per square kilometer for one heat source object divided by its working period must be greater than 100.
3.4. Quantitative Analysis
4. Results
4.1. Heavy Industrial Heat Source Distribution Characteristics at the National Scale
4.2. Heavy Industrial Heat Source Distribution Characteristics at Regional Scales
4.3. Heavy Industrial Heat Source Distribution Characteristics at the Provincial Scale
5. Conclusions
- (1)
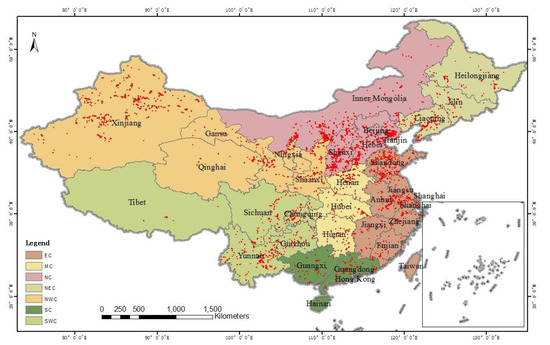
- Mainland China’s heavy industrial heat sources were mainly focused in North China (NC), East China (EC), and Northwest China (NWC). The Tangshan, Ordos, and Wuhai regions consisted of widespread heavy industrial heat source areas.
- (2)
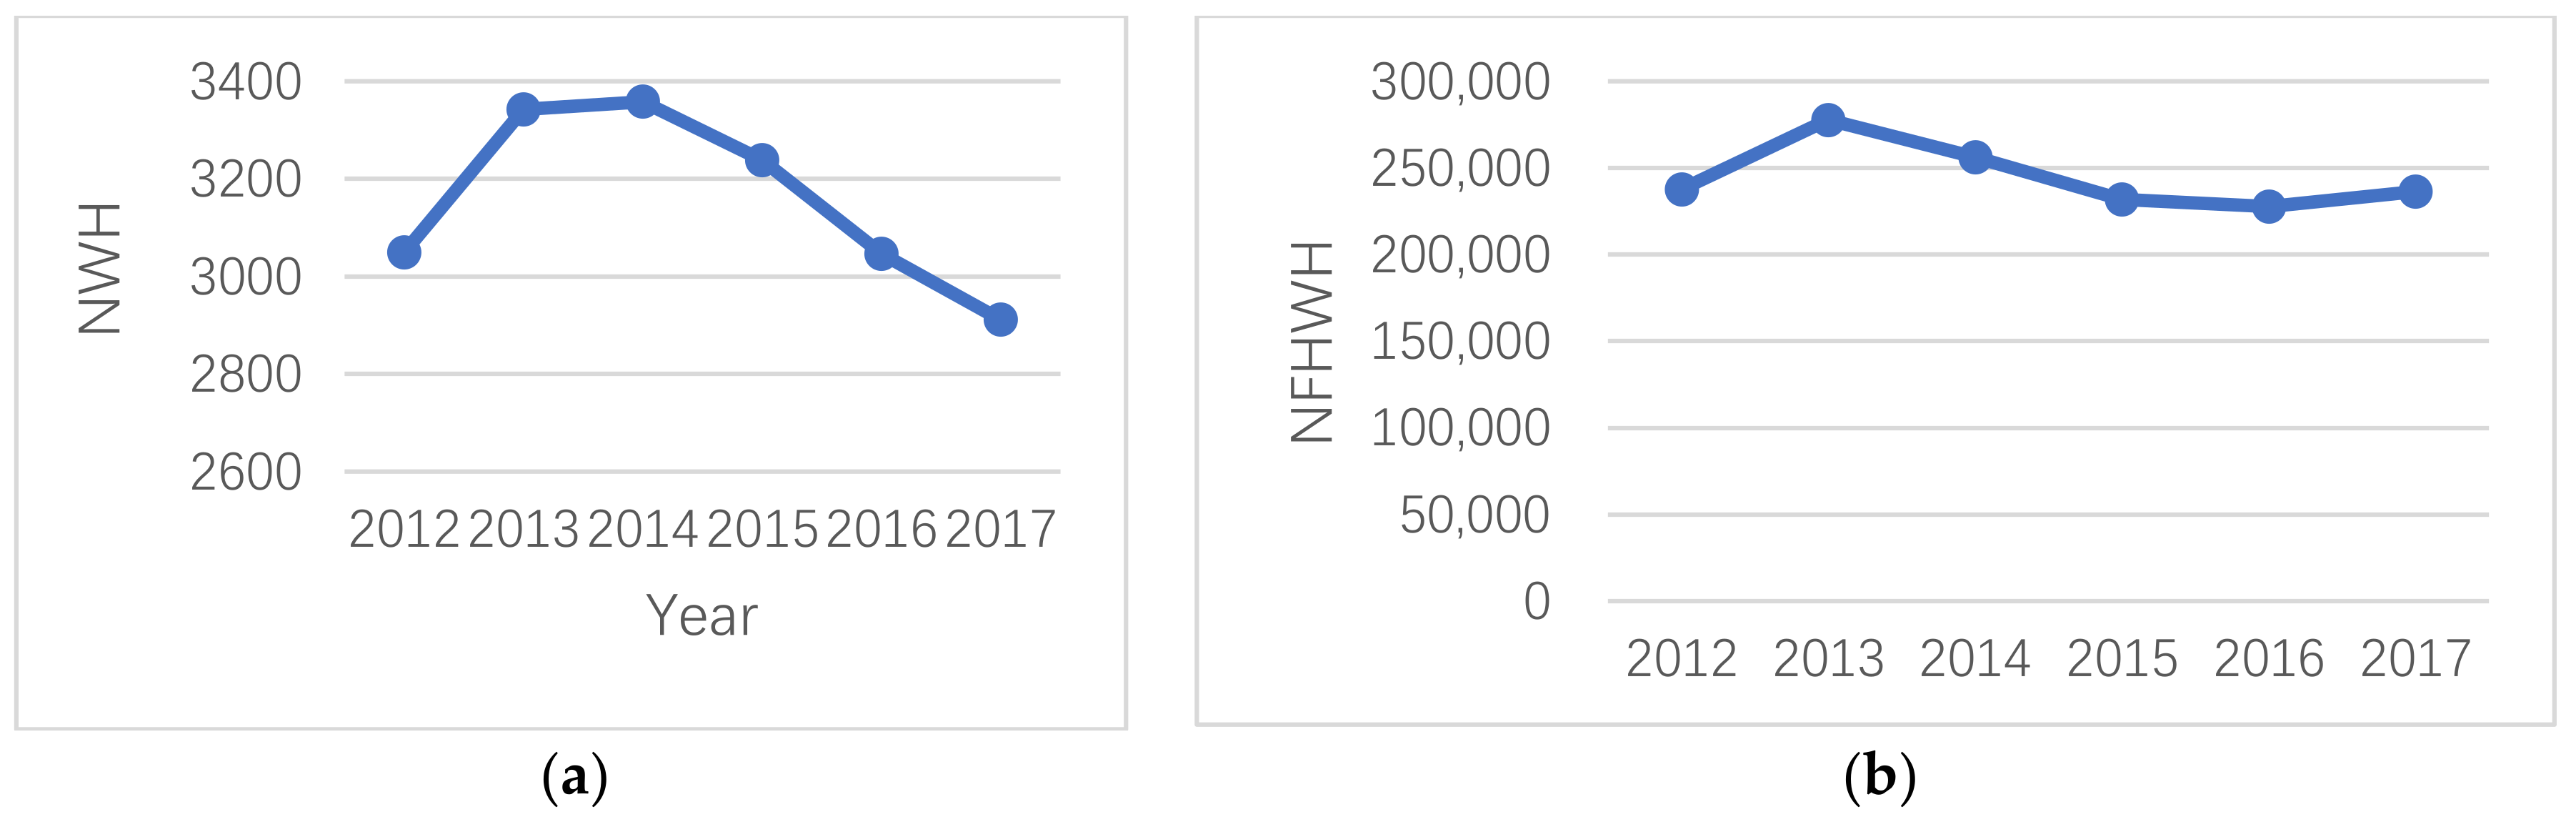
- The total number of working heavy industrial heat sources (NWH) and the number of fire hotspots in working heavy industrial heat sources (NFHWH) values increased from 2012 to 2013. They reached a maximum in 2014 and 2013, respectively, and declined thereafter.
- (3)
- The largest NWH and NFHWH values were observed in North China (NC), followed by Northwest China (NWC) and East China (EC), and the NWH and NFHWH values in NC accounted for about 30% of the total in the mainland. The values experienced an initial increase and reached a maximum value in 2013, then sharply declined thereafter.
- (4)
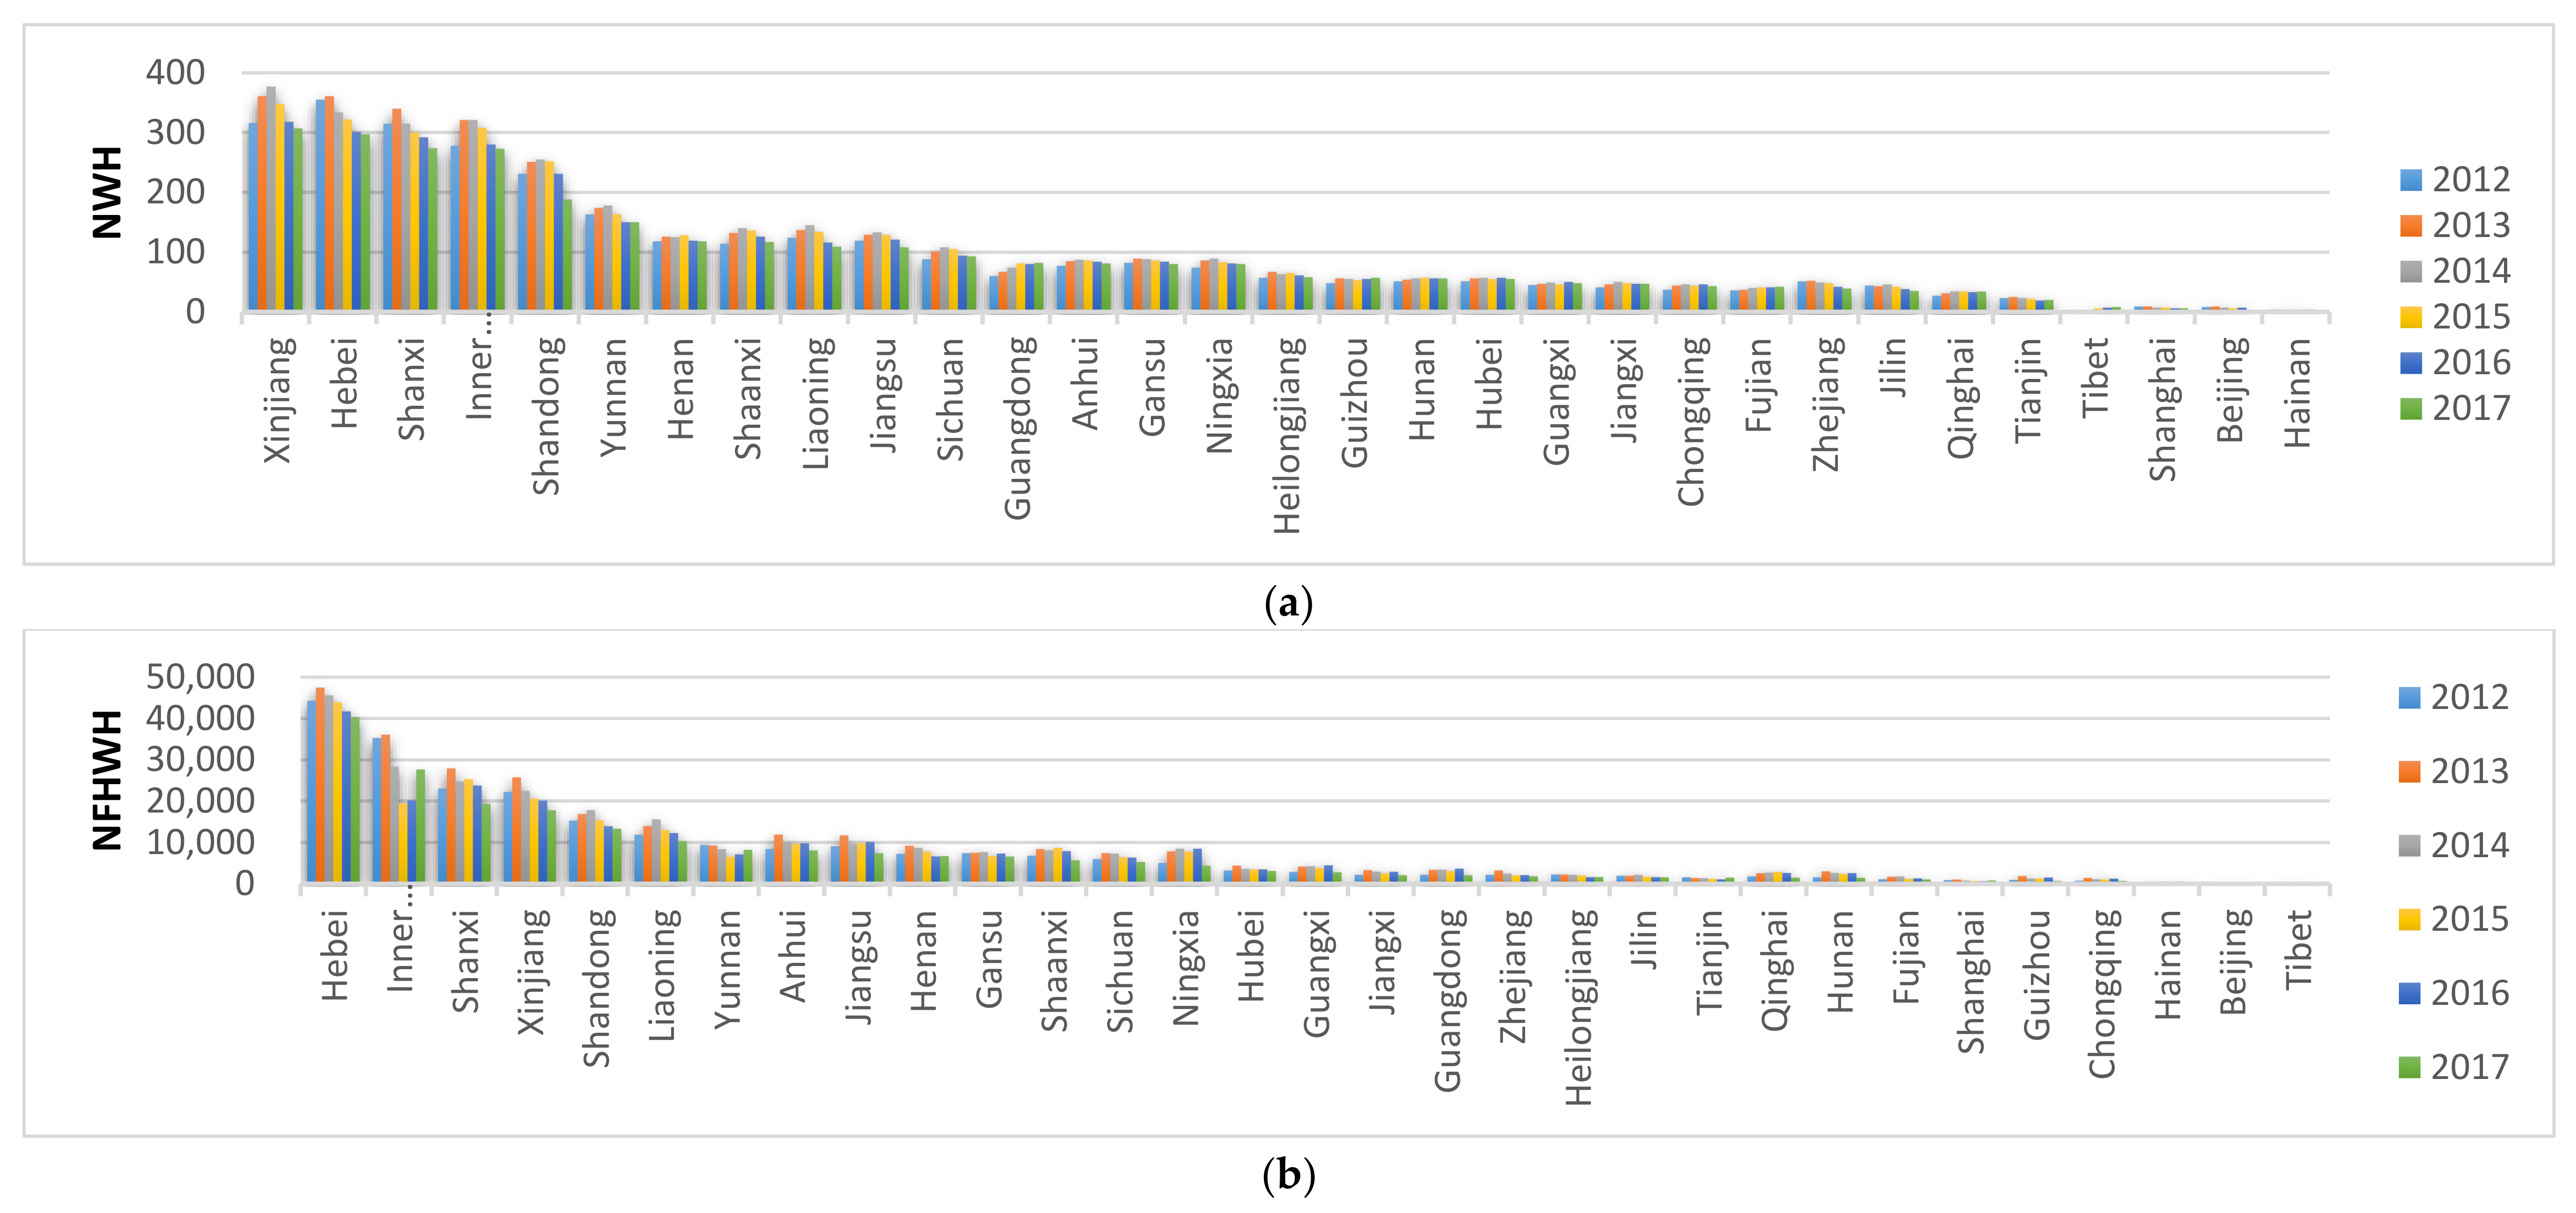
- The largest NWH values were located in Xinjiang province, followed by Hebei, Shanxi, Inner Mongolia, and Shandong. Conversely, the largest NFHWH values were found in Hebei, accounting for nearly 20% of the entire mainland. Additionally, Guangdong, Hunan, Guangxi, Fujian, Qinghai, and Tibet provinces revealed an upward trend.
Author Contributions
Funding
Acknowledgments
Conflicts of Interest
References
- Zhou, Y.; Zhao, F.; Wang, S.; Liu, W.; Wang, L. A Method for Monitoring Iron and Steel Factory Economic Activity Based on Satellites. Sustainability 2018, 10, 1935. [Google Scholar] [CrossRef]
- Liu, Y.; Hu, C.; Zhan, W.; Sun, C.; Murch, B.; Ma, L. Identifying industrial heat sources using time-series of the VIIRS Nightfire product with an object-oriented approach. Remote Sens. Environ. 2018, 204, 347–365. [Google Scholar] [CrossRef]
- Paltridge, G.W.; Barber, J. Monitoring grassland dryness and fire potential in Australia with NOAA/AVHRR data. Remote Sens. Environ. 1998, 25, 381–394. [Google Scholar] [CrossRef]
- Morisette, J.T.; Giglio, L.; Csiszar, I.; Justice, C.O. Validation of the MODIS active fire product over Southern Africa with ASTER data. Int. J. Remote Sens. 2005, 26, 4239–4264. [Google Scholar] [CrossRef]
- Zhao, W. Research and evaluation of the algorithm of land surface fire detection based on FY3-VIRR data. Fire Saf. Sci. 2011, 3, 004. [Google Scholar]
- Vogeler, J.C.; Yang, Z.; Cohen, W.B. Mapping post-fire habitat characteristics through the fusion of remote sensing tools. Remote. Sens. Environ. 2016, 173, 294–303. [Google Scholar] [CrossRef]
- Schroeder, W.; Oliva, P.; Giglio, L.; Quayle, B.; Lorenz, E.; Morelli, F. Active fire detection using Landsat-8/OLI data. Remote. Sens. Environ. 2016, 185, 210–220. [Google Scholar] [CrossRef]
- Trifonov, G.M.; Zhizhin, M.N.; Melnikov, D.V.; Poyda, A.A. VIIRS Nightfire Remote Sensing Volcanoes. Procedia Comput. Sci. 2017, 119, 307–314. [Google Scholar] [CrossRef]
- Baugh, K. Characterization of Gas Flaring in North Dakota using the Satellite Data Product, VIIRS Nightfire. In Proceedings of the AGU Fall Meeting 2015, San Francisco, CA, USA, 14–18 December 2015. [Google Scholar]
- Sun, J.Q.; Liu, Y.X.; Dong, Y.Z. Classification of Urban Industrial Heat Sources Based on Suomi-NPP VIIRS Nighttime Thermal Anomaly Products: A Case Study of the Beijing-Tianjin-Hebei Region. Geogr. Geo-Inf. Sci. 2018, 34, 13–19. [Google Scholar]
- Schroeder, W.; Oliva, P.; Giglio, L.; Csiszar, I. The new VIIRS 375 m activefire detection data product: Algorithm description and initial assessment. Remote Sens. Environ. 2014, 143, 85–96. [Google Scholar] [CrossRef]
- Giglio, L.; Schroeder, W.; Justice, C.O. The collection 6 MODIS active fire detection algorithm and fire products. Remote Sens. Environ. 2016, 178, 31–41. [Google Scholar] [CrossRef] [PubMed]
- Weijermars, W.; Van Berkum, E. Analyzing highway flow patterns using cluster analysis. In Proceedings of the 2005 IEEE Intelligent Transportation Systems, Vienna, Austria, 16 September 2005. [Google Scholar]
- Ma, C.; Dai, Q.; Liu, S. A New Method of Remote Sensing Image Segmentation Based on Pso And Isodata. Wuhan Daxue Xuebao (Xinxi Kexue Ban)/Geomatics Inf. Sci. Wuhan Univ. 2012, 37, 35–38. [Google Scholar]
- Abubaker, M.; Ashour, W. Efficient Data Clustering Algorithms: Improvements over Kmeans. Int. J. Intell. Syst. Appl. 2013, 5, 37–49. [Google Scholar] [CrossRef]
- Lei, J.; Jiang, T.; Wu, K. Robust K -means algorithm with automatically splitting and merging clusters and its applications for surveillance data. Multimedia Tools Appl. 2016, 75, 12043–12059. [Google Scholar] [CrossRef]
- Ma, C.; Xia, W.; Chen, F.; Liu, J.; Dai, Q.; Jiang, L. A Content-Based Remote Sensing Image Change Information Retrieval Model. ISPRS Int. J. Geo-Inf. 2017, 6, 310. [Google Scholar] [CrossRef]
- Jiang, W.; He, G.; Long, T.; Wang, C.; Ni, Y.; Ma, R. Assessing light pollution in china based on nighttime light imagery. Remote Sens. 2017, 9, 135. [Google Scholar] [CrossRef]
- China Will Establish Network to Monitor Smog’s Health Effects. Southern Weekly. Available online: http://www.infzm.com/content/95493 (accessed on 26 November 2018). (In Chinese).
- Air Pollution Prevention Plan. Available online: http://www.gov.cn/zwgk/2013-09/12/content_2486773.htm (accessed on 14 September 2018).
- China Shuts Down Thousands of Firms for Pollution Offences. Available online: http://www.360doc.com/content/07/0508/23/21275_489581.shtml (accessed on 26 November 2018).
- NASA. NASA VIIRS Land Science Investigator Processing System (SIPS) Visible Infrared Imaging Radiometer Suite (VIIRS)375 m & 750 m Active Fire Products, 2018. Available online: https://viirsland.gsfc.nasa.gov/PDF/VIIRS_activefire_User_Guide.pdf (accessed on 14 September 2018).
- VIIRS I-Band 375 m Active Fire Data. Available online: https://earthdata.nasa.gov/earth-observation-data/near-real-time/firms/viirs-i-band-active-fire-data (accessed on 14 September 2018).
- Han, L. The Analytical Research on Current Development and Utilization Situation of Mineral Resources & Energy Based on Data Mining. Available online: http://new.coallib.com/detail.html?id=3975298588805122&classesEn=coal_dissertations (accessed on 26 November 2018). (In Chinese).
- Shizuishan. Available online: https://baike.baidu.com/item/%E7%9F%B3%E5%98%B4%E5%B1%B1/307901?fr=aladdin (accessed on 21 November 2018).
- Lu, Z.; Deng, X. Regional Policy and Regional Development: A Case Study of China’s Western Development Strategy. MPRA 2013, 15, 250–264. [Google Scholar]
- Meng, C.; Fan, G. The Analysis of Weather Causes and Sources of a Heavy Pollution Process in Beijing. China Environ. Sci. 2018, 38, 3628–3638. [Google Scholar]
- Kyoto Protocol. Available online: https://en.wikipedia.org/wiki/Kyoto_Protocol (accessed on 21 November 2018).
- Paris Agreement. Available online: https://en.wikipedia.org/wiki/Paris_Agreement (accessed on 21 November 2018).


© 2018 by the authors. Licensee MDPI, Basel, Switzerland. This article is an open access article distributed under the terms and conditions of the Creative Commons Attribution (CC BY) license (http://creativecommons.org/licenses/by/4.0/).
Share and Cite
Ma, C.; Yang, J.; Chen, F.; Ma, Y.; Liu, J.; Li, X.; Duan, J.; Guo, R. Assessing Heavy Industrial Heat Source Distribution in China Using Real-Time VIIRS Active Fire/Hotspot Data. Sustainability 2018, 10, 4419. https://doi.org/10.3390/su10124419
Ma C, Yang J, Chen F, Ma Y, Liu J, Li X, Duan J, Guo R. Assessing Heavy Industrial Heat Source Distribution in China Using Real-Time VIIRS Active Fire/Hotspot Data. Sustainability. 2018; 10(12):4419. https://doi.org/10.3390/su10124419
Chicago/Turabian StyleMa, Caihong, Jin Yang, Fu Chen, Yan Ma, Jianbo Liu, Xinpeng Li, Jianbo Duan, and Rui Guo. 2018. "Assessing Heavy Industrial Heat Source Distribution in China Using Real-Time VIIRS Active Fire/Hotspot Data" Sustainability 10, no. 12: 4419. https://doi.org/10.3390/su10124419
APA StyleMa, C., Yang, J., Chen, F., Ma, Y., Liu, J., Li, X., Duan, J., & Guo, R. (2018). Assessing Heavy Industrial Heat Source Distribution in China Using Real-Time VIIRS Active Fire/Hotspot Data. Sustainability, 10(12), 4419. https://doi.org/10.3390/su10124419